Embed Size (px)
Citation preview

AUTHORAaron Fine, Partner at Oliver Wyman Frank Rohde, CEO of Nomis Solutions
EXECUTIVE BRIEF
Financial Services
DEPOSITS: A RETURN TO VALUE?


INTRODUCTION
In 2006 (ahead of the credit losses that would soon
decimate lending profits), one of the largest banks in
the United States publicly reported that 1/3rd of its
earnings and more than half of its shareholder value
added came from retail deposits and treasury services.
This bank has significant businesses in capital markets
and commercial banking, mortgage lending, credit
cards and wealth management. Yet the earnings power
of the deposit product set was so high that it quietly
dominated the economic value creation of the bank.
Since 2008 however, new regulation regarding debit
interchange and consumer overdraft, and even
more importantly the dramatic fall in base interest
rates, have greatly impacted the profitability of
US deposits. This has reduced retail deposit profit
margins on the order of 3/4ths at many banks.
In that light, it’s easy to understand the excitement
that even the slightest overtures of sustained rising
rates causes among deposit managers (and banking
executives more broadly). The recent rise in long-term
interest rates is more than enough to allow us to begin to
consider a return to more favorable times.
While it will obviously take several years for the
recovery to be complete, the current structure
of the yield curve indicates that by 2018 the rate
environment would closely resemble conditions in
2005 (coming out of the 2001 recession). Under the
deposit NIM that the aforementioned bank realized
in that year, and given its current balances, retail
deposit profitability would nearly regain pre-crisis
levels. And while that full recovery is still five years out,
the period between now and then would be one of
tailwinds rather than the headwinds of the past five.
Deposit businesses indeed have a lot to get
excited about.
However they also cannot afford to lose sight of five
critical challenges that will accompany the rise of rates.
Indeed, we believe that given the complexity of the
emerging deposit landscape, the rise of interest rates
could be a trigger that will create tremendous separation
between winners and losers. Banks that understand the
dramatic forces impacting the business, take steps to
respond to them, and successfully manage the transition
will emerge as market leaders well positioned to enjoy
the more favorable conditions we appear headed
towards. Those institutions that stumble, however, could
well find their strategic position so diminished that the
better environment will not be enough.
The five key factors impacting the deposit market as
rates rise:
1. The instability of balance growth since the crisis
2. New deposit competitors
3. Basel III and the Liquidity Coverage Ratio
4. Lagging and distorted FTP rates
5. The great unknown: the digital evolution
This is the first of a series of three publications that
Oliver Wyman will release over the next several
months detailing our views on the evolving deposit
landscape. In this publication we focus on the financial
implications and management challenges of the rising
rate environment. We also introduce our partnership
with Nomis Solutions to bring industry-leading deposit
product management tools to the market.
The second publication will focus more specifically on
the potential evolution of deposit product design. The
third will focus in detail on the potential for disruptive
threats to the industry. Given the time constraints of our
audience, we have opted to produce these publications
in an “executive brief” format that quickly illustrates
each of the key points. Those interested in a more
detailed discussion can reference the related webinar, or
contact us for a more in-depth conversation.
Copyright © 2013 Oliver Wyman 1

A RETURN TO DEPOSIT VALUE
Loss of fee income has received the bulk of attention
in deposits, but the deterioration of net interest
margin has had a similarly sized impact on deposit
profitability. While 2007 levels of fee income may
be a thing of the past, a return to a higher interest
rate environment could lead to a return to historical
levels of deposit NIM. As seen in a study of this
leading US retail bank, a return to the deposit NIM
experienced in 2005 – combined with balance
growth and improvements in operating efficiency
that have occurred since the crisis – would result in
deposit profit levels near those reached in 2007.
3.0% 6%
2.5% 5%
2.0% 4%
1.5% 3%
1.0% 2%
0.5% 1%
3.5% 7%
2007 2008 2009 2010 2011 2012 2013
DEPOSIT NIM 1 YEAR SWAP
1. BASE RATES FALL, LEADING TO A DECLINE IN NIM1,2
0%0%
Deposit NIM
1 year SWAP
H1 2007 Q3. 2013
2. RETAIL DEPOSIT PROFIT MARGIN SUFFERS1
InterestIncome
Fee Income
Operating expense
2.65%
0.69%
• The dramatic decline in base interest rates led to a 50% decline in NIM
• As a result of the declining NIM and regulatory pressure on fees, deposit profit margin fell 75%
Q3. 2005
5%
4%
1%
3%
2%
3 Months 12 Months 5 Years
0%
3. EXPECTATIONS OF RISING RATES3
DEC. 2016(implied)
SEP. 2013(actual)
DEC. 2018(implied)
H1. 2007 Q3. 2013 Q3. 2013@Q3. 2005 NIM
4. RAISE THE PROMISE OF A RETURN TO DEPOSIT VALUE1
Value of returnto Q3. 2005 NIM
• The current yield curve indicates a return to a 2005-like rate environment by the end of 2018
• If deposit NIM returned to Q3 2005 levels, deposit earnings would nearly regain their pre-crisis levels – despite the losses to fee income (all else being the same)
* CASE STUDY: LEADING US RETAIL BANK
Copyright © 2013 Oliver Wyman 2

FIVE FACTORS THAT WILL COMPLICATE THE RETURN TO VALUE
Unfortunately, at least five separate factors will
complicate banks’ efforts to recover historical levels
of deposit NIM. Any of these five on their own would
be difficult to navigate, but the five together represent
an unprecedented level of challenge. Of particular
importance will be the rise of digital technologies. The
period since the crisis has seen tremendous levels of
disruptive innovation in other industries. If a rise in
deposit value sparks similar change in retail deposits,
changes in customer access brought about by digital
could serve as a catalyst that links the other four factors
together, enhancing the possible effects.
2005 2006 2007
FTP
5-YearSWAP rate
4. LAGGING FUNDS TRANSFER PRICING
1. DISRUPTED BALANCES (CASE STUDY)1
FEDERAL RESERVE SYSTEM
12 CFR Part 249
Regulation WW; Docket No. R-[xxxx]
FEDERAL DEPOSIT INSURANCE CORPORATION
12 CFR Part 329
RIN 3064-AE04
Liquidity Coverage Ratio: Liquidity Risk Measurement, Standards, and Monitoring
AGENCIES: O�ce of the Comptroller of the Currency, Department of the Treasury; Board of Governors of the Federal Reserve System; and Federal Deposit Insurance Corporation.
ACTION: Notice of proposed rulemaking with request for public comment.
3. NEW RULES FOR LIQUIDITY5
2. COMPETITIVE PRESSURE4
5. DIGITAL
2007
TODAY
…………
……… …
VIDEO AUDIO COMMUNI-CATION
DEPOSITS
TOP 20 US BANK HOLDING COMPANIES (BY ASSETS)JPMorgan Chase & Co.
Bank of America Corp.
Citigroup Inc.
Wells Fargo & Co.
Goldman Sachs Group Inc.
Morgan Stanley
General Electric Capital Corp.
Bank of New York Mellon Corp.
U.S. Bancorp
HSBC North America Hldgs Inc.
Shading indicates new potential deposit competitor since financial crisis
11
12
13
14
15
16
17
18
19
20
1
2
3
4
5
6
7
8
9
10
Capital One Financial Corp.
PNC Financial Services Group
State Street Corp.
TD Bank US Holding Co.
BB&T Corp.
Ally Financial Inc.
SunTrust Banks Inc.
Principal Financial Group Inc.
American Express Co.
Charles Schwab Corp. Q12005
Q22007
Q32013
CHECKING DEPOSIT TOTAL
Q12005
Q22007
Q32013
90% growth 65% growth
Copyright © 2013 Oliver Wyman 3

1. DISRUPTED BALANCES
Many US institutions have seen significant growth in
deposit balances since the financial crisis. This growth
has – to a degree – helped to offset the decline in net
interest margin, and if the balances remain in place
as rates rise, deposit profits could soar. Most deposit
product managers and treasurers however are skeptical
of this growth, unsure how much will migrate to other
investments as the economy improves. As the yield curve
has steepened, many banks have found themselves with
a tempting dilemma: gamble and deploy the balances
against longer-term assets and elevate NIM now, or invest
the balances conservatively and reduce risk in the future.
Q12005
Q22007
Q32013
1. RECENT SURGE IN DEPOSIT GROWTH (CASE STUDY)1
CHECKING BALANCES DEPOSIT BALANCES
Q12005
Q22007
Q32013
90% growth65% growth
2. WHAT COULD HAVE CAUSED IT?
CAUSE
EXAMPLE
Changein business
• Acquisition
• New product structures
• Need for liquidity
Foreseeablemacro-economic
events
• Economic growth
• Shift of the yield curve
Crisis-specificevent
• Transaction Account Guarantee Program
A B C
• Deposit and checking growth was flat from 2005 through mid 2007, but has risen sharply since
• Targeted account level analysis can help organizations identify the likely causes of balance growth – and therefore what to expect as the environment shifts
20%
40%
60%
80%
-40%
-60%
-20%
Total growth Growth/online account
Growthin checking
Growthin CD
0%
3. WHAT DID CAUSE IT? (CASE STUDY)1
CHANGE IN BUSINESS PREDICTABLE VS.UNPREDICTABLE SHIFTS
4. IMPLICATIONS
1 Month 1 Year 3 Year 5 Year 10 Year
2.5% x 5% = 12.5 bps
LIBOR/Swap curve
• Growth per account that trails total growth indicates a potentially sustainable business shift. Offsetting declines in CD growth indicate a re-allocation of customer funds that likely will reverse (but stay with the bank)
• Each 5% of checking balances that could be invested “long-term” instead of “short-term” is worth 15 bps to total checking NIM – likely warranting an investment in deeper understanding
Copyright © 2013 Oliver Wyman 4

2. COMPETITIVE PRESSURE
In the wake of the financial crisis many of the largest
non-bank US financial institutions converted to bank
holding companies. At the time, there was speculation
that they could quickly become significant deposit
takers. Instead, they largely met their liquidity needs
directly through government-sponsored funding. As
the economy improves however, and rates rise, the
scenarios envisioned by that post-crisis speculation
could come to pass. If this pressure emerges, and
combines with pressure from traditional banks
accelerating their lending, the current liquidity rich
position that most institutions are enjoying will come
under substantial pressure.
1. THE “NEW” BANKS6
TOP 20 US BANK HOLDING COMPANIES (BY ASSETS)
JPMorgan Chase & Co.
Bank of America Corp.
Citigroup Inc.
Wells Fargo & Co.
Goldman Sachs Group Inc.
Morgan Stanley
General Electric Capital Corp.
Bank of New York Mellon Corp.
U.S. Bancorp
HSBC North America Hldgs Inc.
1
2
3
4
5
6
7
8
9
10
11
12
13
14
15
16
17
18
19
20
Capital One Financial Corp.
PNC Financial Services Group
State Street Corp.
TD Bank US Holding Co.
BB&T Corp.
Ally Financial Inc.
SunTrust Banks Inc.
Principal Financial Group Inc.
American Express Co.
Charles Schwab Corp.
Shading indicates new potential deposit competitor since financial crisis
2. WHY THEIR DEPOSIT GROWTH HAS BEEN SLOW
Legal and regulatory complexity
Availability of goverment sponsored fundingat similar interest expense
$$ $
Low loan growth
• Five of the top twenty US bank holding companies today were not threats in the US deposit market before the crisis – but could be as rates begin to rise
• Deposit growth among these banks has been slow for three key reasons – all of which could erode as the economy improves, rates rise, and the cost advantage of deposits increases
3. LARGEST LOAN TO DEPOSIT GAPS OF US BANK HOLDING COMPANIES6
60
80
240
220
20
40
1 2 3 4 5 6 7 8 9 10
Represents the size of the US deposit base it would require to fill the gap
$BN
…
……
5
23
48
#
40
18
0
4. IMPLICATIONS7
% OF US TOTALCONSUMER DEPOSITS # OF ING DIRECTS
Conservativeestimate
Aggressiveestimate
6x
5.5%
10%
• Overall, BHCs with the ten largest loan to deposit gaps would require $450 BN of deposit funding to cover their current lending needs
• Closing that gap with retail deposits would represent 5-10% of the market – or 5.5 ING Directs. If institutions look to deposits to fund other earning assets (e.g., securities) that would increase pressure further
Copyright © 2013 Oliver Wyman 5

3. NEW RULES FOR LIQUIDITY
Complicating the potential fight for deposit liquidity:
the ‘liquidity value’ of many types of funding is about
to change. The Federal Reserve recently issued
preliminary liquidity regulations for the US market. Once
implemented, these regulations will alter the value of
certain types of funding vs. others. The good news for
retail deposit taking: retail balances will be viewed as
more stable (and therefore more valuable) than other
sources of funding. The bad news: if other sources of
funding are deemed less stable, there will likely be added
demand for liquidity overall, and pressure on retail
deposits as a result.
1. OVERVIEW OF FEDERAL RESERVE LIQUIDITY COVERAGE RATIO PROPOSAL5
A “Retail” deposits have run-o� rates of 3% or 10%
B To qualify as “stable” (and get 3%)
– Fully insured
– Either a transactional account or otherwise part of a broader relationship that makes them less likely to leave
C Most “Wholesale” deposits have run-o� rates of 20-100%
– Small business deposits that qualify as retail will have the 3-10% run-o� rate
2. THE VALUE OF STABLE VS. LESS STABLE DEPOSITS
% OF BALANCES THAT CAN FUND LONG-TERM ASSETS
VALUE OF LONG-TERM MONEY VS. SHORT-TERM
bps
97%
90%
7%
2.7%
0.1%
2.6%x = 18– –
• Retail deposits will be considered significantly more stable than commercial deposits and other forms of wholesale funding. As well, “stable” retail balances – likely defined largely based on the presence of a transaction account – will have lower run-off rates than less stable retail balances
• Given the current structure of the yield curve, stable retail balances (that can be used to fund long-term assets) could be worth as much as 15–20 bps more than unstable. They may be worth vastly more vs. wholesale deposits. Note that this calculation is indicative and actual value will vary
3. THE KEY UNKNOWNS
The final rules(these are “proposals”)
“Regulatory” vs. “Economic” liquidity
True value of “Stable” vs. “Unstable”
4. IMPLICATIONS
50k Saving account
IF YOU HAVETHIS
THE VALUE OFTHIS
ISTHIS
Checkingaccount
Increased valuecreated by movingsavings to “stable”
50k $100
• The ultimate value of stable vs. unstable balances will depend on how closely the final rules resemble this proposal – as well as how banks implement the framework and what their individual liquidity needs are
• The value generated by adding a checking account to existing savings balances could be used to pay for better rates, features, or ATM rebates on the checking product
Copyright © 2013 Oliver Wyman 6

4. LAGGING FUNDS TRANSFER PRICING
For banks that use it, FTP communicates the value
of deposits and plays a role in everything from
product pricing to incentives to network planning. As
traditionally employed, it is typically very good in stable
environments. However, it is also challenged in quickly
changing or unique situations. When rates rise rapidly,
the FTP for more stable products (e.g., checking and
low-rate savings) lags behind. There are good reasons
for this and some positive business impacts. But banks
that don’t account for it and make adjustments to how
they use it to manage their business could be at a severe
disadvantage vs. other institutions – particularly new
entrants that are looking to grow balances quickly.
4.5%
3.5%
5.0%
4.0%
5.5%
1. FTP RATES LAG (CASE STUDY)1
2005 2006 2007 2005 2006 20072004
3.0%
5-YEAR SWAP REPORTED CHECKING NIM 6.0%
5.5%
5.0%
4.5%
4.0%
3.5%
3.0%
2. DUE TO THE “TRACTOR” EFFECT
2001 2002 2003 2004 2005 2006 2007
2.5%
2001-2005 Average
2003-2007 Average
2002-2006 Average
• Between 2005 and 2007 – as long-term rates rose more than 100 bps – NIM on checking balances at the sample bank was essentially flat
• The FTP “lag” is due to the fact that long-term stable deposits are used to fund long-term assets. As a result, the value of the deposit book reflects not only current asset yields, but also the historical yields at which the balances were invested
3.5%
4.0%
4.5%
2.5%
3.0%
3. POTENTIAL IMPACT AS RATES RISE
EoY 2016 EoY 2018
2.0%
Trailingaverage of the 5-Year SWAP
5-YearSWAP rate
Marginal view
Book view
4. IMPLICATIONS
Pricing
“BOOK” LENS
“MARGINAL” LENS
Product design Infrastructure investment
VS.
• As rates rise in this recovery, the same phenomena will be exhibited. The trailing average of the 5-year Swap rate will lag up to 125–150 bps behind the spot rate. Institutions that take a marginal view of the value of a dollar of deposits will be heavily advantaged
• FTP systems do a good job representing the value of a book of deposits. However, to represent the value of a marginal dollar of deposits in a rising rate environment adjustments may need to be made. Without adjustments incumbents could find themselves at a significant economic disadvantage across business decisions
Copyright © 2013 Oliver Wyman 7

5. DIGITAL
Given how busy bankers have been, it is easy to
lose track of how significantly other industries have
changed as a result of advancements in digital and
data technology. In just the period from the crisis
to now, many of the current market leaders in other
industries rose from obscurity while their predecessors
disappeared from the landscape. Meanwhile the
market leaders in financial services have been largely
unaffected. This has resulted in arguments by some that
there are fundamental barriers to change in our industry.
This could be true – but it’s also possible that the delayed
impact was simply a matter of circumstance.
1. THE WORLD (OUTSIDE OF OURS) HAS CHANGED
2007
TODAY
VIDEO AUDIO COMMUNICATION DEPOSITS
…………
……… …
2. FUNDAMENTALLY DIFFERENT?
INERTIA
TRUST REGULATIONCONVENIENCE
TIPPINGPOINT
• As hard as it is to remember, market leaders like Netflix, the iPhone, Facebook and Amazon were just barely emerging in 2007. Six years later they’ve ridden the digital wave to the top of their respective categories. In deposits, we’ve seen little significant change
• This has caused some to discount the possibility of disruptive innovation in deposits – pointing to market barriers that may be present in retail financial services that didn’t exist in the categories that have shifted so quickly
3. OR DIFFERENT CIRCUMSTANCES?
THE CHANGING DIGITAL VALUE GAP FOR RETAIL DEPOSITS
Rate advantage
Conveniencedisadvantage(illustrative)
Rate advantage of online banking offers (MMDA)
4%
1%
%
2007 2013 2018
4. IMPLICATIONS
DEPOSITS MIGHT BE DIFFERENT
but
so
LACK OF CHANGE ISN’T PROOF
WE MUST BE PREPARED
• Another possibility: the rate advantage of disrupters declined dramatically just as they were solving for their convenience disadvantages. If the rate advantage returns and convenience continues to improve, the value exchange for clients could shift quickly – and market leadership among providers may follow
• There are no assurances that either the “fundamentally different” or “different circumstances” arguments are correct. More than likely, the answer lies somewhere in between. But both the threat and the severity are high enough that banks must be prepared
Copyright © 2013 Oliver Wyman 8

A COMPLEX PROBLEM
As interest rates rise, bringing renewed importance to
deposit funding, new (and old) banks will compete for
new deposit balances with new – and varied – rules for
determining value. While this situation is complex, in
the past the impact on deposit behavior might have
been mitigated by the importance of physical channels.
Competition to any pocket of customers would have
been limited and the inconvenience of switching
would have provided a measure of natural protection.
However, it is for this reason that the rise of digital
disruption – less and less hindered by the barriers of the
past – could create a catalyst that dramatically increases
the challenge of the situation. With the competitive
landscape, the value of deposits, and the access to
customers all fundamentally altered, deposit behavior
is likely to be very difficult to predict based on historical
practices and historical data.
1. NEW BALANCES
… may be a sign of trust
2. NEW COMPETITORS
… was created when regulatorsopened the gate
4. VARIED RULES FOR FTP
VS.
… may result in a value gap that overcomes inertia
TIPPINGPOINT
LCR
3. NEW RULES FOR LIQUIDITY
… may be the impetus for significant change
2007 H1. 2013
14%
–
E-BOOK SHARE OFUS CONSUMERBOOK SPENDING
… has overcome higher convenience hurdles
5. DIGITAL8
Copyright © 2013 Oliver Wyman 9
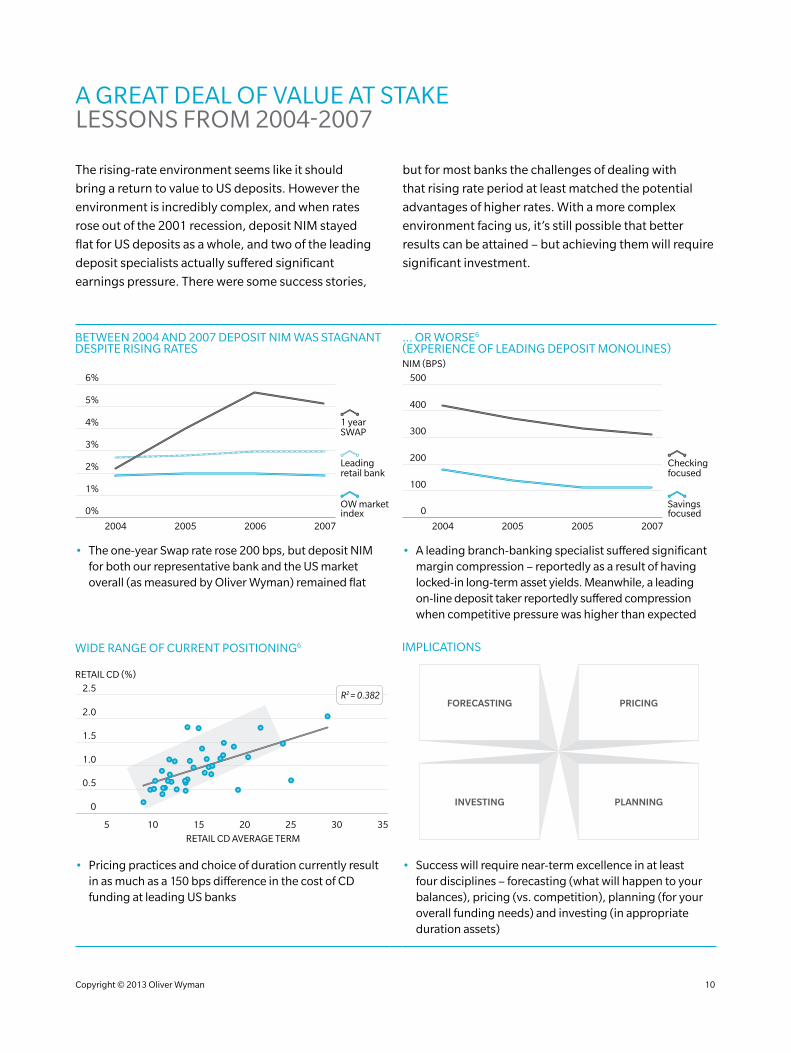
A GREAT DEAL OF VALUE AT STAKE LESSONS FROM 2004-2007
The rising-rate environment seems like it should
bring a return to value to US deposits. However the
environment is incredibly complex, and when rates
rose out of the 2001 recession, deposit NIM stayed
flat for US deposits as a whole, and two of the leading
deposit specialists actually suffered significant
earnings pressure. There were some success stories,
but for most banks the challenges of dealing with
that rising rate period at least matched the potential
advantages of higher rates. With a more complex
environment facing us, it’s still possible that better
results can be attained – but achieving them will require
significant investment.
BETWEEN 2004 AND 2007 DEPOSIT NIM WAS STAGNANT DESPITE RISING RATES
3%
4%
6%
5%
1%
2%
2004 2005 2006 2007
0%
Leading retail bank
OW marketindex
1 year SWAP
… OR WORSE6
(EXPERIENCE OF LEADING DEPOSIT MONOLINES)
300
400
500
100
200
2004 2005 2005 2007
0
Checkingfocused
Savingsfocused
NIM (BPS)
• The one-year Swap rate rose 200 bps, but deposit NIM for both our representative bank and the US market overall (as measured by Oliver Wyman) remained flat
• A leading branch-banking specialist suffered significant margin compression – reportedly as a result of having locked-in long-term asset yields. Meanwhile, a leading on-line deposit taker reportedly suffered compression when competitive pressure was higher than expected
0.5
WIDE RANGE OF CURRENT POSITIONING6
1.5
2.0
1.0
2.5
0
RETAIL CD AVERAGE TERM
5 10 15 20 25 30 35
R2 = 0.382
RETAIL CD (%)
Y-AXIS TITLE (LINE 1)Y-AXIS TITLE (LINE 2)
IMPLICATIONS
INVESTING
FORECASTING PRICING
PLANNING
• Pricing practices and choice of duration currently result in as much as a 150 bps difference in the cost of CD funding at leading US banks
• Success will require near-term excellence in at least four disciplines – forecasting (what will happen to your balances), pricing (vs. competition), planning (for your overall funding needs) and investing (in appropriate duration assets)
Copyright © 2013 Oliver Wyman 10

AN ADVANCED SOLUTION (SIMPLY)
Oliver Wyman and Nomis understands these
inplications, and realizes both the opportunities and the
challenges of the environment to come. As a result, we
have joined together to begin to deliver a suite of deposit
value management services that will efficiently and
flexibly position our clients to succeed. Our partnership
brings together Nomis’s capabilities in delivering
powerful software-based pricing solutions with
Oliver Wyman’s deep expertise across the deposit value
chain. The core of our offering is unique capabilities in
account and customer level data management. From
that starting point, we are able to deliver both tool-based
and custom solutions for each of four disciplines that
will be critical for success: deposit forecasting, pricing,
planning and investing.
CLOUD-BASED
• Account level data
• Customer levelflow of funds
“BIG DATA” COMPUTATIONAL POWER
PRICINGFORECASTING
INVESTING (FTP) PLANNING (LCR)
VS.
Stable Less Stable
$$$$$$
$$$ $
VS.
Copyright © 2013 Oliver Wyman 11

Our goal is to help bring both excellence and efficiency
to deposit value management at a critical time in the
evolution of the business. Stress testing and regulatory
guidance demand that all institutions must build a better
understanding of how their deposit balances are going to
behave as the economy changes. Similarly, all institutions
must understand the potential impact of new liquidity
regulations, and they must build the tools to be able to
assess that position on an ongoing basis.
By combining the work necessary to meet those
regulatory-driven demands with the implementation of
industry-leading deposit price optimization software, we
are able to help our clients use the same resources and
investment dollars to also set the foundation for better
investments of deposits in the near-term, better pricing
of deposits in the mid-term and better engagement
between treasury and deposit functions over the
long-term.
Our clients are able to choose which of our services meet
their needs, and to customize implementation for their
organizations. To learn more about how Oliver Wyman
and Nomis can help, or just to further discuss our views
on the evolving deposit landscape and the ways in which
each of these critical deposit disciplines can be efficiently
built together, please contact us.
Authors: Aaron Fine [email protected]
Frank Rohde [email protected]
Copyright © 2013 Oliver Wyman 12

FOOTNOTES AND SOURCES
1. Quarterly earnings releases (publicly disclosed)
2. Federal Reserve Interest Rates, Historical Data
3. Oliver Wyman Analysis
4. SNL Financial, Oliver Wyman analysis
5. Federal Reserve: Liquidity Coverage Ratio: Liquidity Risk Measurement, Standards, and Monitoring
6. SNL Financial, Oliver Wyman analysis
7. Federal Reserve Flow of Funds, Oliver Wyman Customer Insights Survey, Oliver Wyman Analysis
8. Publishers Weekly, Bowker Market Research
Note: LIBOR/Swap rate data
used throughout the report
is sourced from Thomson
Reuters Datastream and the
Federal Reserve
Copyright © 2013 Oliver Wyman 13

www.oliverwyman.com
Oliver Wyman is a global leader in management consulting that combines deep industry knowledge with specialized expertise in strategy, operations, risk management, and organization transformation.
For more information please contact the marketing department by email at [email protected] or by phone at one of the following locations:
AMERICAS
+1 212 541 8100
EMEA
+44 20 7333 8333
ASIA PACIFIC
+65 6510 9700
Copyright © 2013 Oliver Wyman
All rights reserved. This report may not be reproduced or redistributed, in whole or in part, without the written permission of Oliver Wyman and Oliver Wyman accepts no liability whatsoever for the actions of third parties in this respect.
The information and opinions in this report were prepared by Oliver Wyman. This report is not investment advice and should not be relied on for such advice or as a substitute for consultation with professional accountants, tax, legal or financial advisors. Oliver Wyman has made every effort to use reliable, up-to-date and comprehensive information and analysis, but all information is provided without warranty of any kind, express or implied. Oliver Wyman disclaims any responsibility to update the information or conclusions in this report. Oliver Wyman accepts no liability for any loss arising from any action taken or refrained from as a result of information contained in this report or any reports or sources of information referred to herein, or for any consequential, special or similar damages even if advised of the possibility of such damages. The report is not an offer to buy or sell securities or a solicitation of an offer to buy or sell securities. This report may not be sold without the written consent of Oliver Wyman.