Embed Size (px)
Citation preview

Laboratory and Environmental Assessment Program 7202 NE Evergreen Pkwy Suite 150 Hillsboro, OR 97123 Phone: 503- 693-5700 Fax: 503-693-4999 www.oregon.gov/DEQ
DEQ is a leader in restoring, maintaining and enhancing the quality of Oregon’s air, land and water.
Last Updated: 09/13/17 DEQ09-LAB-0071-QAG Version 3.0
DEQ Quality Assurance Guidance Guidance for Self Monitoring Laboratories (NPDES and WPCF) September 2017
Quality Assurance Project Plan
Guidance for Self Monitoring Laboratories (NPDES and WPCF)
This guidance document was prepared by:
Oregon Department of Environmental Quality
7202 NE Evergreen Pkwy, Suite 150 Hillsboro, OR 97123
1-503-693-5700 www.oregon.gov/deq
Contact:
Scott Hoatson (503) 693-5786
Documents can be provided upon request in an alternate format for individuals with disabilities or in a language other than English for people with limited English skills. To request a document in another format or language, call DEQ in Portland at 503-229-5696, or toll-free in Oregon at 1-800-452-4011, ext. 5696; or email [email protected].

QA Guidance for Self Monitoring Laboratories Oregon Department of Environmental Quality DEQ09-LAB-0071-QAG 09/13/17 Version 3.0 Page iii
Table of Contents
1.0 Scope and Application ...................................................................................................................... 1
2.0 Useful Resources .............................................................................................................................. 1
3.0 Documentation Requirements ........................................................................................................... 1 3.1 Quality Assurance Manual ............................................................................................................ 1 3.2 Procedures .................................................................................................................................... 3
4.0 Standard Quality Control Procedures ............................................................................................... 5
5.0 Laboratory Data Handling and Reporting ......................................................................................... 7
6.0 Essential Checks for BOD5 ............................................................................................................... 7 6.1 Sample Collection ......................................................................................................................... 7 6.2 Sample Preservation ..................................................................................................................... 7 6.3 Holding Time ................................................................................................................................. 7 6.4 Approved Methods (40 CFR Part 136.3) ...................................................................................... 7 6.5 Analytical Checks .......................................................................................................................... 8
7.0 Total Suspended Solids (TSS) .......................................................................................................... 9 7.1 Sample Collection and Preservation ............................................................................................. 9 7.2 Holding Time ................................................................................................................................. 9 7.3 Approved Methods ........................................................................................................................ 9 7.4 Analytical Checks .......................................................................................................................... 9
8.0 pH .................................................................................................................................................... 10 8.1 Sample Collection ....................................................................................................................... 10 8.2 Approved Methods ...................................................................................................................... 10 8.3 Meter Specifications .................................................................................................................... 10 8.4 Electrodes ................................................................................................................................... 11 8.5 Analytical Checks ........................................................................................................................ 11
9.0 Total Residual Chlorine ................................................................................................................... 11 9.1 Sample Collection, Preservation and Handling ........................................................................... 11 9.2 Approved Methods ...................................................................................................................... 11 9.3 Analytical Checks ........................................................................................................................ 11
10.0 Bacteria (E. coli, Coliforms, Enterococci) ........................................................................................ 12 10.1 Sample Collection ....................................................................................................................... 12 10.2 Sample Preservation ................................................................................................................... 12 10.3 Holding Time ............................................................................................................................... 12 10.4 Approved Methods ...................................................................................................................... 12 10.5 Equipment Requirements ............................................................................................................ 14 10.6 Analytical Checks ........................................................................................................................ 14
11.0 Calculation & Reporting of Results ................................................................................................. 15 11.1 Individual Sample Calculations and Reporting - MPN Methods ................................................. 15 11.2 Individual Sample Calculations and Reporting - Membrane Filtration Methods ......................... 16 11.3 Distribution of Bacterial Populations ........................................................................................... 18
12.0 Statistical Measures ........................................................................................................................ 19
List of Tables Table 1 Water Quality Check ....................................................................................................................... 6
QA Guidance for Self Monitoring Laboratories Oregon Department of Environmental Quality DEQ09-LAB-0071-QAG 09/13/17 Version 3.0 Page iv
Table 2 Bacteria Method Information ......................................................................................................... 13
Table 3 Bacteria Results to Use in Calculations ........................................................................................ 18
List of Figures Figure 1 Precision Control Chart as a function of range or RPD ............................................................... 26
Figure 2 Accuracy Control Chart as a function of percent recovery .......................................................... 26
List of Appendices Appendix A Procedure for Calculating Method Precision .......................................................................... 20
Appendix B Procedure for Calculating Method Accuracy .......................................................................... 24
Appendix C Control Charting ..................................................................................................................... 26
Appendix D Example Analysis Form I ........................................................................................................ 27 Appendix E Example Analysis Form II ....................................................................................................... 28
Appendix F Revision History. ..................................................................................................................... 29
QA Guidance for Self Monitoring Laboratories Oregon Department of Environmental Quality DEQ09-LAB-0071-QAG 09/13/17 Version 3.0 Page 1 of 29
1.0 Scope and Application This guidance document is intended to provide assistance to self monitoring laboratories as applicable to NPDES (National Pollution Discharge Elimination System) permitting and WPCF (Water Pollution Control Facilities) applicable to requirements in Standard Methods for the Analysis of Water and Wastewater and EPA requirements in 40 CFR Part 136. This document does not supersede DEQ wastewater permit conditions. The information is provided for information purposes only.
This guidance is not intended to be used as guidance for compliance under national safe drinking water regulations (e.g. 40 CFR Part 141) nor as guidance for routine groundwater or surface water monitoring.
This guidance document is provided by DEQ as a summary of some of the basic method requirements and should not be considered a complete list of requirements. All laboratories should be familiar with the requirements of the analytical methodologies. DEQ used the analytical methods and federal regulations as reference while preparing this document. In case of a discrepancy, the actual content of regulations and analytical referenced methods will supersede this document.
2.0 Useful Resources • Code of Federal Regulations: https://www.ecfr.gov
o Test Methods: 40 CFR 136.3
o Alternate Test Procedure: 40 CFR 136.5
o Method Modifications: 40 CFR 136.6
o Quality Assurance Quality Control: 40 CFR 136.7
• USEPA Handbook for the Analytical Quality Control In Water and Wastewater Laboratories (1979): https://www.epa.gov/sites/production/files/2015-06/documents/QCHandbook.pdf
• USEPA NPDES Compliance Inspection Manual (2004): https://www.epa.gov/sites/production/files/2013-09/documents/npdesinspect_0.pdf
• USEPA – 2017 Method Update Rule: https://www.epa.gov/cwa-methods/methods-update-rule-2017
3.0 Documentation Requirements
3.1 Quality Assurance Manual It is essential that all labs analyzing compliance samples adhere to defined quality assurance procedures. This is to insure that routinely generated analytical data are scientifically valid and defensible and are of known and acceptable precision and accuracy. To accomplish these goals, each laboratory should prepare a written description of its quality assurance activities (a QA manual). The following items should be addressed in each QA manual:
a) a Table of Contents, and applicable lists of references and glossaries, and appendices.
b) a quality policy statement, including objectives and commitments, by top management;
c) the organization and management structure of the laboratory
a. its place in any parent organization and relevant organizational charts;
b. the relationship between management, technical operations, support services and the quality system;
QA Guidance for Self Monitoring Laboratories Oregon Department of Environmental Quality DEQ09-LAB-0071-QAG 09/13/17 Version 3.0 Page 2 of 29
d) procedures to ensure that all required records are retained, as well as procedures for control and maintenance of documentation through a document control system which ensures that all standard operating procedures, manuals, or documents clearly indicate the time period during which the procedure or document was in force;
e) job descriptions of key staff and reference to the job descriptions of other staff;
f) identification of the laboratory's approved signatories; at a minimum, the title page of the Quality Manual must have the signed and dated concurrence, (with appropriate titles) of all responsible parties including the QA officer(s), technical director(s) (however named), and the agent who is in charge of all laboratory activities such as the laboratory director or laboratory manager;
g) the laboratory's procedures for achieving traceability of measurements;
h) a list of all test methods under which the laboratory performs its accredited testing;
i) mechanisms for ensuring that the laboratory reviews all new work to ensure that it has the appropriate facilities and resources before commencing such work;
j) reference to the calibration and/or verification test procedures used;
k) procedures for handling submitted samples;
l) reference to the major equipment and reference measurement standards used as well as the facilities and services used by the laboratory in conducting tests;
m) reference to procedures for calibration, verification and maintenance of equipment;
n) reference to verification practices including interlaboratory comparisons, proficiency testing programs, use of reference materials and internal quality control schemes;
o) procedures to be followed for feedback and corrective action whenever testing discrepancies are detected, or departures from documented policies and procedures occur;
p) the laboratory management arrangements for exceptionally permitting departures from documented policies and procedures or from standard specifications;
q) procedures for audits and data review;
r) processes/procedures for establishing that personnel are adequately experienced in the duties they are expected to carry out and are receiving any needed training;
s) processes/procedures for educating and training personnel in their ethical and legal responsibilities including the potential punishments and penalties for improper, unethical or illegal actions; and,
t) reference to procedures for reporting analytical results;
The QA plan may be a separately prepared QA document or may incorporate, by reference, already available standard operating procedures (SOPs) that are approved by the laboratory director and that address the listed items. Documentation for many of the listed QA plan items can be made by reference to appropriate sections of the laboratories SOPs, or to other literature (e.g. Standard Methods for the Examination of Water and Wastewater, 40 CFR Part 136, etc.) The QA plan must be available for analysts and for inspection by authorities.
To assist labs if QA Manual development, DEQ adapted a QA Manual template, originally developed by the Virginia DEQ, for use by wastewater laboratories in Oregon. The template (in MS Word) can be found on DEQ’s webpage @ www.oregon.gov/deq/FilterDocs/QAManualTemplate.docx . To use the manual modify the sections to reflect the labs’ specific practices and remove areas that may not be applicable.

QA Guidance for Self Monitoring Laboratories Oregon Department of Environmental Quality DEQ09-LAB-0071-QAG 09/13/17 Version 3.0 Page 3 of 29
3.2 Procedures Each facility/laboratory should have a procedure manual that includes all the SOPs used for their self-monitoring program. The facility's SOPs should cover sampling, equipment calibration and maintenance, analytical methods, quality control activities and laboratory data handling and reporting. Facility SOPs should include enough detail to use this document as a training manual for new employees.
Sampling Procedures a) Sample collection and analysis schedules for parameters specified in permit and/or other
tests not covered in permit, but are used to determine plant performance.
b) Sample collection locations.
c) Sample types such as grab, composite or flow proportioned composites including instructions on sampler setup.
a. The following parameters CANNOT be analyzed from a composite sample. Grab samples must be used instead: pH, temperature, cyanide, total phenols, residual chlorine, oil and grease, fecal coliform (including E. coli), and Enterococci, or volatile organics.
b. All other parameters may be run from a well mixed composite sample.
d) Sample handling requirements such as sampling containers, preservatives (e.g. acid, thiosulfate, refrigeration etc.), and holding time.
Facilities and Equipment a) Operating instructions for equipment such as balances, meters, incubators, and samplers
etc., which outline proper calibration procedures to be followed whenever equipment is used.
b) Maintenance schedules on major equipment, which indicate what type of maintenance is to be performed. A certified repairman should service balances annually.
c) Cleaning procedures to be followed for each type of equipment and glassware used by the facility.
d) Instructions for ordering chemicals and reagents used by the laboratory, dating of all chemicals when received and opened, and preparation of laboratory reagents. Reagents or standards should be labeled for identity, concentration, date prepared, expiration date and preparers initials.
e) An adequate supply of reagent water is required. Water must be free of the analyte tested and of interferences. Water may come from distilled/deionized, distilled, or Reverse-Osmosis systems.
Acceptable Methods All methods that are referenced in 40 CFR part 136.3 are acceptable for reporting to Oregon DEQ unless otherwise specified in a facility permit. The references to Standard Methods1 in 40 CFR 136.3 have changed to simply reference the year the method was adopted rather than referencing the multiple editions that contain a given method. The change was made so EPA would not have to continue adding all of the Standard Method Editions in the CFR.
1 Refers to the compendium method book Standard Methods for the Examination of Water and Wastewater, published by the American Water Works Association (AWWA) and Water Environment Federation (WEF).

QA Guidance for Self Monitoring Laboratories Oregon Department of Environmental Quality DEQ09-LAB-0071-QAG 09/13/17 Version 3.0 Page 4 of 29
For example: For BOD, the current approved method is SM5210B-2011, with 2011 being the year the method version was adopted. The same method version is published in the edition published following 2011 (22st edition, published in 2012; 23rd Edition, published in 2017; and on-line)
A cross reference table of the approved versions of Standard Methods can be found on the Standard Methods website www.standardmethods.org.
Where a facility wants to utilize a new method or technology that is not listed in 40 CFR part 136.3, they may apply directly to EPA Region 10 for an Alternate Testing Procedure (ATP) approval. The Approval must be submitted to the permit inspector once obtained.
EPA published the final 2017 Method Update Rule in the Federal Register on 8/28/2017 with an effective date of 9/27/2017. All references to Standard Methods will be from the 22nd or 23rd editions or Standard Methods on-line (almost all approved inorganic chemistry methods were updated in 2011).
Analytical Procedures a) Standard Operating Procedures (SOPs) should be written outlining the test procedures to
be followed by all personnel. The SOPs should conform to EPA approved methods contained in Standard Methods, ASTM, EPA Methods, or other methods listed in 40 CFR part 136.3. The SOP contains all specific analytical instructions from sample prep to calculations of final result; including calibration procedures, QC procedures, dilutions etc. SOPs should reference the approved method from which they were developed and describe the test as it is performed.
a. Note: as an Option to a formal written procedure, if the laboratory follows the referenced method to the letter, another written document is not necessary or the laboratory may list their specific variances from the method and attach this to a copy of the referenced method as their written procedure.
b) Methods which deviate from the approved method must be demonstrated to be applicable by documenting that results obtained are comparable to those obtained using the approved method.
c) The Department of Environmental Quality and EPA must approve all nonstandard methods in writing.
Method Reference Description
ASTM American Society for Testing and Materials (ASTM), Consensus Standard Organization – www.astm.org
AOAC Association of Analytical Communities, International (AOAC) “Official Methods of Analysis of the Association of Analytical Chemists, Methods Manual, Sixteenth Edition, 4th Revision 1998 www.aoac.org
USGS Unites States Geologic Survey (USGS) Methods for Analysis of Inorganic Substances is Water and Fluvial Sediments, Book 5 1989 www.usgs.gov
Standard Methods American Waterworks Association, Water Environment Federation – Standard Methods for the Analysis of Water and Wastewater. www.standardmethods.org

QA Guidance for Self Monitoring Laboratories Oregon Department of Environmental Quality DEQ09-LAB-0071-QAG 09/13/17 Version 3.0 Page 5 of 29
4.0 Quality Assurance / Quality Control in the CFR 40 CFR part 136.7 outlines the QA/QC requirements for permittees/labs that perform compliance testing under NPDES. Essentially there are 3 options depending on applicability:
a) “Refer to and follow the QA/QC published in the “equivalent” EPA method for that parameter that has such QA/QC procedures;”
• Some of the older EPA methods or other approved methods are lacking in QC detail, if you are are citing one of these methods, you need to try and identify and locate the latest equivalent version the EPA method that contains detailed QC procedures. If none are available, then you will need to go to the third option below (c).
b) “Refer to the appropriate QA/QC section(s) of an approved part 136 method from a consensus organization compendium;”
• As an example, rather than putting the QA/QC procedures in every method, Standard Methods has specific chapters for QA/QC procedures that apply throughout the book. So citing Standard Methods references, includes the QA/QC in these chapters. Examples below.
i. 1020 Quality Assurance / Quality Control – General QA/QC for all Chemistry methods (note that all of the items do not apply to all methods (e.g. matrix spiking doesn’t apply to pH or BOD).
ii. 2020 QA/QC – Applies to 2000 series methods (e.g. SM 2540 Solids – TDS, TSS, etc)
iii. 3020 – QA/QC – Applies to the 3000 series methods – Metals
iv. 4020 – QA/QC – Applies to the 4000 series methods – Non-Metal Inorganics (e.g. Ammonia, Chlorine, pH, Nitrate, Phosphate, etc.)
v. 9020 – QA QC – Quality assurance procedures for 9000 series microbiology methods.
c) “Incorporate the following twelve quality control elements, where applicable, into the laboratory's documented standard operating procedure (SOP) for performing compliance analyses when using an approved part 136 method when the method lacks such QA/QC procedures. One or more of the twelve QC elements may not apply to a given method and may be omitted if a written rationale is provided indicating why the element(s) is/are inappropriate for a specific method.
• (i) Demonstration of Capability (DOC); • (ii) Method Detection Limit (MDL); (DEQ note: see 40 CFR 136 Appendix B for
applicability) • (iii) Laboratory reagent blank (LRB), also referred to as method blank (MB); • (iv) Laboratory fortified blank (LFB), also referred to as a spiked blank, or laboratory
control sample (LCS); • (v) Matrix spike (MS) and matrix spike duplicate (MSD), or laboratory fortified matrix
(LFM) and LFM duplicate, may be used for suspected matrix interference problems to assess precision;
• (vi) Internal standards (for GC/MS analyses), surrogate standards (for organic analysis) or tracers (for radiochemistry);
• (vii) Calibration (initial and continuing), also referred to as initial calibration verification (ICV) and continuing calibration verification (CCV);

QA Guidance for Self Monitoring Laboratories Oregon Department of Environmental Quality DEQ09-LAB-0071-QAG 09/13/17 Version 3.0 Page 6 of 29
• (viii) Control charts (or other trend analyses of quality control results); • (ix) Corrective action (root cause analysis); • (x) QC acceptance criteria; • (xi) Definitions of preparation and analytical batches that may drive QC frequencies;
and • (xii) Minimum frequency for conducting all QC elements.
These twelve quality control elements must be clearly documented in the written standard operating procedure for each analytical method not containing QA/QC procedures, where applicable.”
4.1 Basic Quality Control Procedures for the small lab a) Demonstration of capability for each analyst: This should reflected by the training and
initially successful analysis of known QC samples or PT samples PRIOR to running real samples.
b) A blank analysis on water and reagents should be run with each test.
c) A blank spike/Laboratory control sample or QC reference reference standard should be run with each batch.
d) Calibration consisting of at least a low, midpoint and a high standard. At least one calibration check standard should be run with each set-up.
e) Duplicate an analysis with each set-up as a precision check.
f) A sample spiked with target analyte matrix spike should be run with each batch as an accuracy check, and to identify interferences in the sample that may affect actual measurements. For those analyses where sample spiking cannot be performed, (e.g. turbidity, TSS, Residual Chlorine, etc) a QC reference standard should be analyzed with each batch to determine accuracy.
g) Control limits should be established for duplicates and standards, or spike samples for data verification. Examples of establishing control limits are outlined in Appendix A. Note that there may be a minimum control limit required for the methods that must be met regardless of the control limits established by the laboratory.
h) Routinely verify quality of reagent water. Reagent water must meet the requirements of the individual analytical methods. Testing the conductivity of reagent water at least daily should be performed as a check of water quality for inorganic (and metals) parameters. Laboratories should minimally use the criteria for medium quality water, however it is dependent on data quality objectives (DQOs). Conductivity checks do not provide an indication of suitability for organic or microbiological methods. Method blanks and calibration blanks provide the final demonstration that reagent water is of sufficient quality.
Table 1 Water Quality Check
Test High Quality Water Medium Quality Water Conductivity < 0.1 µmho/cm at 25°C or >
10 megohms < 1 µmho/cm at 25°C or > 1 megohms

QA Guidance for Self Monitoring Laboratories Oregon Department of Environmental Quality DEQ09-LAB-0071-QAG 09/13/17 Version 3.0 Page 7 of 29
i) Routinely check and document temperature of sample refrigerators, incubator, and composite sampler's cooler.
5.0 Laboratory Data Handling and Reporting a) Bound lab books or bench data sheets must be available for all tests performed. Data
sheets should document all essential checks made to verify that test results are valid.
i. Data sheets/logbooks must be dated, initialed by analyst, legible, and written in ink. Drawing a single line through the incorrect recording should make any corrections, insertion of corrected result, initialed and dated, and contain a comment.
ii. Data sheets/logbooks should include calibration measurements, incubator temperature records, and the time samples were placed in and removed from incubators, ovens, etc.
iii. Data sheets/logbooks should include equations used for deriving final test results. This helps ensure that all analysts are using the same calculations, and allows for cross checking of results prior to reporting on DMR.
iv. Control limits used for standards or duplicates can be included on data sheet/logbook for easy review and verification of data.
6.0 Essential Checks for BOD5
6.1 Sample Collection Samples are to be collected at locations specified in permits. Collect the sample in the center of the channel at 40% - 60% of the channel depth where flow is turbulent and well mixed, and the settling of solids is minimal. For sampling of influent and primary effluent, automatic samplers should have an intake velocity greater than 0.76 m/sec (2.5 ft/sec).
6.2 Sample Preservation Keep samples cold (ice or refrigeration) to between 0o and 6o Celsius (< 10oC for microbiology methods). This includes during the 24-hour compositing.
6.3 Holding Time The holding time for BOD5 is 48 hours after the grab sample is taken or the compositing period ends. Also see 40 CFR 136.3 Table II.
6.4 Approved Methods (40 CFR Part 136.3) Standard Methods 5210 B – 2011 (Current editions: 22nd, 23rd, and on-Line). Dissolved oxygen (DO) is measured using either the Winkler (Azide Modification) or Electrode Method. (Note: the 2001 version is equivalent to 2011, there were only editiorial changes in 2011)
Or alterntively
a) USGS I-1578-78 b) AOAC 973.44
QA Guidance for Self Monitoring Laboratories Oregon Department of Environmental Quality DEQ09-LAB-0071-QAG 09/13/17 Version 3.0 Page 8 of 29
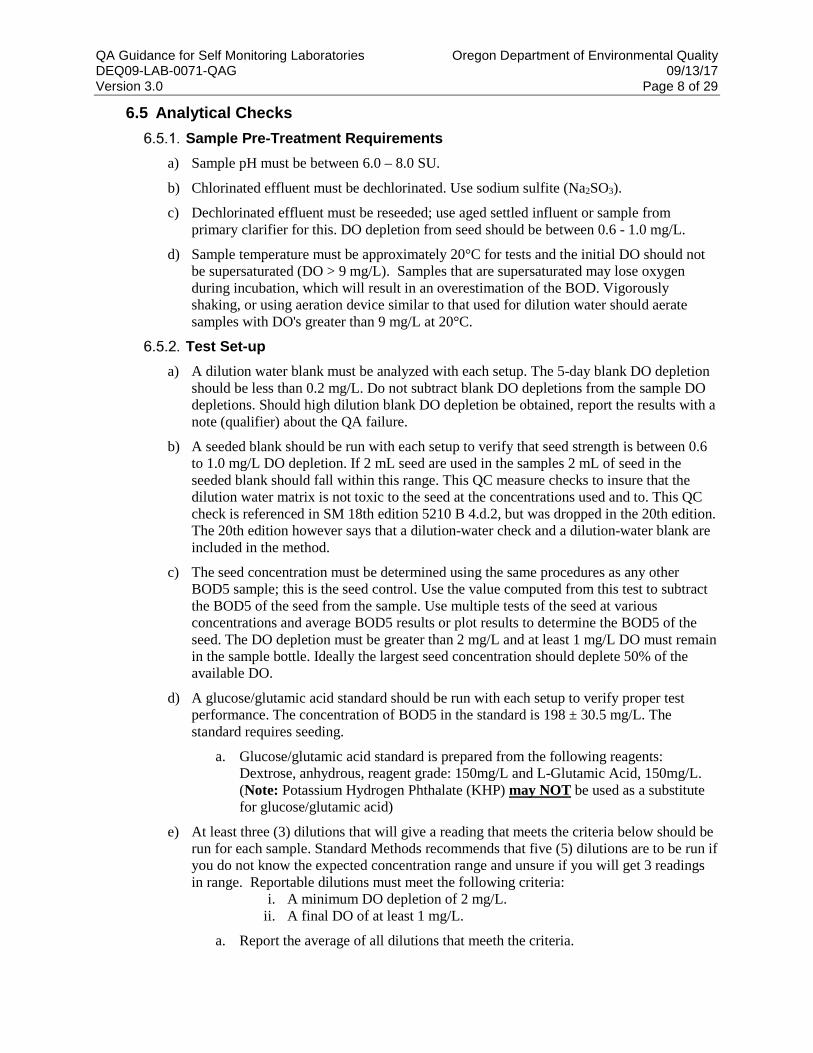
6.5 Analytical Checks Sample Pre-Treatment Requirements
a) Sample pH must be between 6.0 – 8.0 SU.
b) Chlorinated effluent must be dechlorinated. Use sodium sulfite (Na2SO3).
c) Dechlorinated effluent must be reseeded; use aged settled influent or sample from primary clarifier for this. DO depletion from seed should be between 0.6 - 1.0 mg/L.
d) Sample temperature must be approximately 20°C for tests and the initial DO should not be supersaturated (DO > 9 mg/L). Samples that are supersaturated may lose oxygen during incubation, which will result in an overestimation of the BOD. Vigorously shaking, or using aeration device similar to that used for dilution water should aerate samples with DO's greater than 9 mg/L at 20°C.
Test Set-up a) A dilution water blank must be analyzed with each setup. The 5-day blank DO depletion
should be less than 0.2 mg/L. Do not subtract blank DO depletions from the sample DO depletions. Should high dilution blank DO depletion be obtained, report the results with a note (qualifier) about the QA failure.
b) A seeded blank should be run with each setup to verify that seed strength is between 0.6 to 1.0 mg/L DO depletion. If 2 mL seed are used in the samples 2 mL of seed in the seeded blank should fall within this range. This QC measure checks to insure that the dilution water matrix is not toxic to the seed at the concentrations used and to. This QC check is referenced in SM 18th edition 5210 B 4.d.2, but was dropped in the 20th edition. The 20th edition however says that a dilution-water check and a dilution-water blank are included in the method.
c) The seed concentration must be determined using the same procedures as any other BOD5 sample; this is the seed control. Use the value computed from this test to subtract the BOD5 of the seed from the sample. Use multiple tests of the seed at various concentrations and average BOD5 results or plot results to determine the BOD5 of the seed. The DO depletion must be greater than 2 mg/L and at least 1 mg/L DO must remain in the sample bottle. Ideally the largest seed concentration should deplete 50% of the available DO.
d) A glucose/glutamic acid standard should be run with each setup to verify proper test performance. The concentration of BOD5 in the standard is 198 ± 30.5 mg/L. The standard requires seeding.
a. Glucose/glutamic acid standard is prepared from the following reagents: Dextrose, anhydrous, reagent grade: 150mg/L and L-Glutamic Acid, 150mg/L. (Note: Potassium Hydrogen Phthalate (KHP) may NOT be used as a substitute for glucose/glutamic acid)
e) At least three (3) dilutions that will give a reading that meets the criteria below should be run for each sample. Standard Methods recommends that five (5) dilutions are to be run if you do not know the expected concentration range and unsure if you will get 3 readings in range. Reportable dilutions must meet the following criteria:
i. A minimum DO depletion of 2 mg/L. ii. A final DO of at least 1 mg/L.
a. Report the average of all dilutions that meeth the criteria.
QA Guidance for Self Monitoring Laboratories Oregon Department of Environmental Quality DEQ09-LAB-0071-QAG 09/13/17 Version 3.0 Page 9 of 29
b. If no dilution meets these requirements average the calculated results and report it as an estimate.
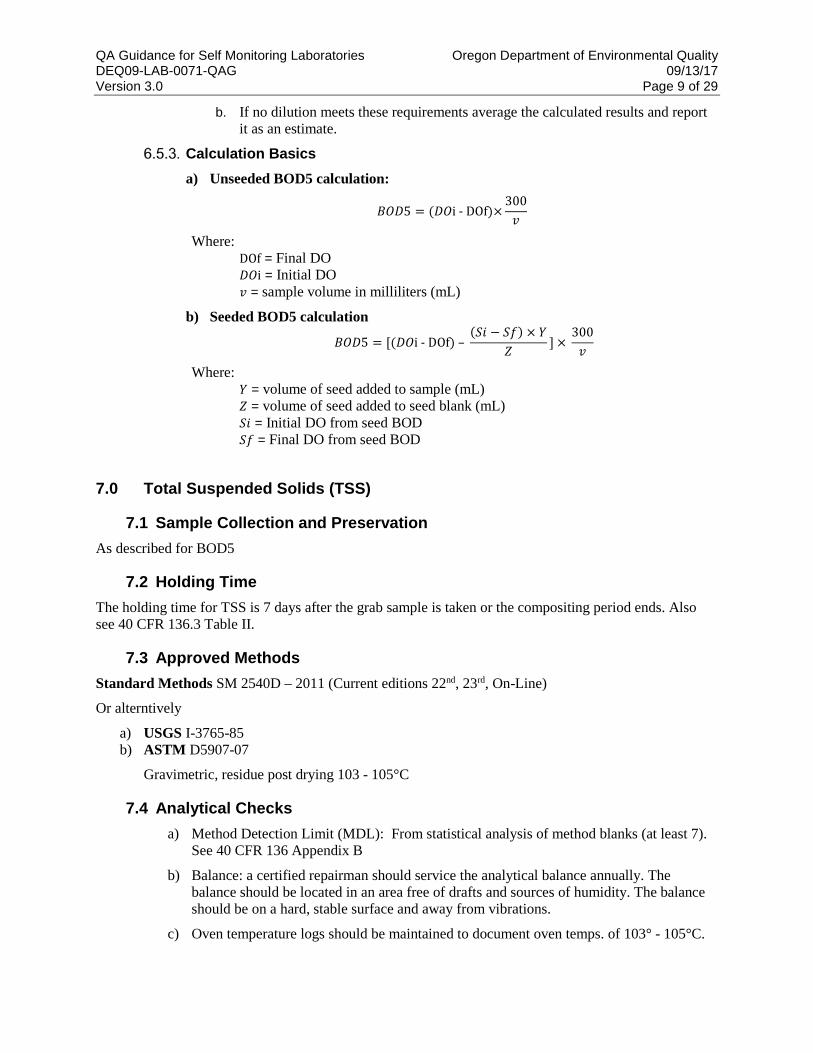
Calculation Basics a) Unseeded BOD5 calculation:
𝐵𝐵𝐵𝐵𝐵𝐵5 = (𝐵𝐵𝐵𝐵i - DOf)×300𝑣𝑣
Where: DOf = Final DO 𝐵𝐵𝐵𝐵i = Initial DO 𝑣𝑣 = sample volume in milliliters (mL)
b) Seeded BOD5 calculation
𝐵𝐵𝐵𝐵𝐵𝐵5 = [(𝐵𝐵𝐵𝐵i - DOf) – (𝑆𝑆𝑆𝑆 − 𝑆𝑆𝑆𝑆) × 𝑌𝑌
𝑍𝑍] ×
300𝑣𝑣
Where: 𝑌𝑌 = volume of seed added to sample (mL) 𝑍𝑍 = volume of seed added to seed blank (mL) 𝑆𝑆𝑆𝑆 = Initial DO from seed BOD 𝑆𝑆𝑆𝑆 = Final DO from seed BOD
7.0 Total Suspended Solids (TSS)
7.1 Sample Collection and Preservation As described for BOD5
7.2 Holding Time The holding time for TSS is 7 days after the grab sample is taken or the compositing period ends. Also see 40 CFR 136.3 Table II.
7.3 Approved Methods Standard Methods SM 2540D – 2011 (Current editions 22nd, 23rd, On-Line)
Or alterntively
a) USGS I-3765-85 b) ASTM D5907-07
Gravimetric, residue post drying 103 - 105°C
7.4 Analytical Checks a) Method Detection Limit (MDL): From statistical analysis of method blanks (at least 7).
See 40 CFR 136 Appendix B
b) Balance: a certified repairman should service the analytical balance annually. The balance should be located in an area free of drafts and sources of humidity. The balance should be on a hard, stable surface and away from vibrations.
c) Oven temperature logs should be maintained to document oven temps. of 103° - 105°C.
QA Guidance for Self Monitoring Laboratories Oregon Department of Environmental Quality DEQ09-LAB-0071-QAG 09/13/17 Version 3.0 Page 10 of 29
Note: The temperatures may also be recorded on a bench sheet (temp in / temp out)
d) Filters should be pre-washed and dried at 103° - 105°C before initial weighing.
Note: Prewashed / preweighed filter are available commercially.
e) Filters must be stored in a desiccator prior to weighings.
f) Choose a sample volume to yield 2.5 to 200 mg of dried solids. Filtration should be complete within 2 minutes. If it takes longer than 10 minutes to filter sample, use a larger filter or reduce volume, but do not produce less than 2.5 mg residue. Clogging of filters reduces the effective filter pore size and introduces a positive bias to TSS result.
Note: SHAKE or STIR SAMPLE WELL prior to pouring into filter.
g) Drying time of 1 hour should be verified such that the change in weight between successive weighings does not exceed 0.5 mg.
Note: The USGS method has overnight drying without the requirement to reweigh.
h) Filter DI water through a filter and put through the procedure for a method blank.
i) Samples should be periodically run in duplicate, as a precision check.
j) An ASTM Certified thermometer should be available to verify accuracy of working thermometers. Thermometer checks need to be documented, and correction factors posted on equipment.
Note: a laboratory control sample can be made measuring a known amount of Diatomaceous earth into 500 or 1000 mL of water in volumetric flask. Example weigh 0.0500 mg into 10 Liter volumetric flask and bring to line with DI water = 50 mg/L TSS standard.
8.0 pH
8.1 Sample Collection Grab samples collected at locations as outlined for BOD5 samples, or in other areas of plant for process control. Samples must be analyzed immediately (within ~ 15 minute).
8.2 Approved Methods Standard Methods 4500-H+ B-2011 (Current editions 22nd, 23rd, On-Line)
Or alterntively
a) ASTM D1293-99 b) USGS I-1586-85 c) AOAC 973.41
Electrometric
8.3 Meter Specifications a) Desirable Performance Characteristics:
Accuracy: 0.05 SU Scale Divisions: 0.1 SU Temperature Compensation: either manual or automatic Slope adjustment ability required.

QA Guidance for Self Monitoring Laboratories Oregon Department of Environmental Quality DEQ09-LAB-0071-QAG 09/13/17 Version 3.0 Page 11 of 29
8.4 Electrodes A wide variety of pH electrodes are available. Generally a rugged full-range glass or plastic-bodied combination electrode is a good choice.
8.5 Analytical Checks a) Electrodes should be stored in distilled water or buffer between uses, as recommended by
the manufacturer.
b) Uncover fill hole in electrode before use.
c) Meter should be calibrated before each use by performing a 2-point standardization with pH 7 and either pH 4 or 10 buffer. Calibrations must be documented in the lab notebook. The buffers used should bracket the pH of the samples. Test the third buffer using it as a QC check. Record the QC but do not adjust the calibration with the third buffer.
d) The sample temperature should be recorded when pH is measured. pH readings should be normalized to 25oC. Most pH meters have built in temperature compensation, if not you will have to manually adjust the meter during calibration.
e) The time required to obtain a stable reading is dependent on the electrode and whether the sample is being stirred during measurement. A rule of thumb would be at least 1 minute to obtain a stable reading.
9.0 Total Residual Chlorine
9.1 Sample Collection, Preservation and Handling Grab samples are to collected at discharge from chlorine contact chamber. Samples must be analyzed immediately.
Also see 40 CFR 136.3 Table II.
9.2 Approved Methods Standard Methods 22nd or 23rd, editions or Standard Methods On-Line Iodometric Method I (SM 4500-Cl B 2011) or II (SM 4500-CL C 2011) Amperometric Titration (SM 4500-CL D 2011) Amperometric Low level Titration (SM 4500-CL E 2011) DPD Ferrous Titration (SM4500-CL-F 2011) DPD Colorimetric (SM4500-CL-G 2011) Historically, EPA and DEQ have approved DPD kits in special cases if they are basically equivalent to the standard methods. Colorimetric methods should not be used if the waste stream has significant color due to inherent interferences.
9.3 Analytical Checks a) Method Detection Limit (MDL): From statistical analysis of low level QC samples and method
blanks (at least 7). See 40 CFR 136 Appendix B
b) A reference standard should be analyzed routinely.

QA Guidance for Self Monitoring Laboratories Oregon Department of Environmental Quality DEQ09-LAB-0071-QAG 09/13/17 Version 3.0 Page 12 of 29
b) Reagents should be dated when received.
c) (kits) the color wheels must be protected from sunlight when not in use to prevent fading.
10.0 Bacteria (E. coli, Coliforms, Enterococci)
10.1 Sample Collection Grab samples are collected in sterile polyethylene or borosilicate glass bottles at discharge after disinfection.
Note: If at all possible, use the sample bottle directly to take the sample. Do not use a scoop or other transfer device as they are susceptible to contamination.
10.2 Sample Preservation Chlorinated samples must be dechlorinated with sodium thiosulfate (Na2S2O3).
Note: The addition of 1mL of a 1% Na2S2O3 solution to the sample bottle prior to sterilization will neutralize up to 15mg/L chlorine.
Note: Sodium sulfite (Na2SO3) that is used for dechlorination for the BOD5 method is toxic to gram-negative microbes such as coliform and therefore MUST NOT be used for dechlorination of coliform samples.
After collection, immediately put the samples on ice or refrigerate at < 6°C until the time of analysis.
10.3 Holding Time Per 40 CFR part 136.3, for compliance testing, the sample analysis must be started within 8 hours of sampling. Results MUST be qualified if the holding times are not met. A notice of non-compliance (NON) will not be issued based on holding time exceedance if the sample is analyzed within 24 hours of sampling.
If the testing is not for compliance purposes, the maximum holding time is 24 hours according to Standard Methods.
10.4 Approved Methods a) EPA Method: "Microbiological Methods for Monitoring the Environment, Water and Wastes",
1978, EPA 600/8-78-017
b) Standard Methods (SM) 21st, 22nd, and On-line editions
c) Colilert®, Quanti-Tray®, Quanti-Tray/2000®, Colilert-18® (IDEXX Laboratories): E. Coli, Fecal Coliforms (Colilert-18)
d) Enterolert® (IDEXX Laboratories): Enterococci only
e) ASTM D6503-99: Enterococci only
f) mColiBlue-24® (Hach Company): E. coli only

QA Guidance for Self Monitoring Laboratories Oregon Department of Environmental Quality DEQ09-LAB-0071-QAG 09/13/17 Version 3.0 Page 13 of 29
Table 2 Bacteria Method Information (number per 100 mL) Reference: Comments Incubation Numeration
Limits E.Coli MPN SM 9223B-2004
(Colilert®-Quanti-Tray® and Quanti-Tray/2000®) AOAC 991.15
Colilert and Colilert-18 are approved
35°C ± 0.5° 24 hrs From IDEXX Table
MF (single step) mColiBlue-24® 35°C ± 0.5° 2 hrs/ 44.5°C + 0.2° 23 ± 1hr
From Hach Table
Fecal Coliform MPN (5-tube, 3-dilution method)
SM 9221 C,E-2006 EC Medium 44.5°C ± 0.2° 24hrs ± 2 hrs
From Method Table (9221.IV)2
SM 9221 C,E-2006 A-1 Medium 35°C ± 0.5°3 hrs/ 44.5°C + 0.2° 21 ± 2hr
From Method Table (9221.IV)2
Multiple tuble/multiple well
Colilert-18® New Non-chlorinated only
44.5°C + 0.2° From IDEXX Table
MF (single step) 9222 D1 -2006 Non-chlorinated only
44.5°C ± 0.2° 24hrs ± 2 hrs
20-60 Colonies
Total Coliform MPN (5-tube, 3-dilution method)
9221 B-2006 35°C ± 0.5° 24 hrs ± 2 hrs
From Method Table (9221.IV)2
MF (single step or two step)
9222 B-2006 Non-chlorinated only
35°C ± 0.5° 22-24 hrs.
20-80 Colonies
MF (with enrichment) 9222 B B+B.5c,d-2006 Chlorinated only.
35°C ± 0.5° 20-22 hrs.
20-80 Colonies
Enterococci MPN (multiple tiube/multiple well)
Enterolert® ( Quanti-Tray® and Quanti-Tray/2000®)
41° ± 0.5°C 24 hrs. From IDEXX Table
MPN (multiple tiube/multiple well)
9230 D - 2007 41° ± 0.5°C 24 hrs. From method tables
MPN (5-tube, 3-dilution method)
9230 B - 2007 41° ± 0.5°C 24 hrs. From method tables
MF (single step) 9230 C-2007 41° ± 0.5°C 24 hrs. 20-80 Colonies MF = Membrane Filter method MPN = Most Probable Number

QA Guidance for Self Monitoring Laboratories Oregon Department of Environmental Quality DEQ09-LAB-0071-QAG 09/13/17 Version 3.0 Page 14 of 29
1 Since Chlorination stresses fecal coliforms and significantly reduces recovery, this method should not be used with chlorinated wastewater. Any decision to use this test method for stressed micro-organisms requires MF/MPN evaluations. A Modified MF technique for fecal coliforms in chlorinated wastewater may be used if parallel testing over a 3 month period with multiple-tube fermentation technique shows comparability for each site-specific type of sample. 2 See Section 10.1 below
10.5 Equipment Requirements Follow guidelines in Standard Methods Method 9030B – Equipment Specifications
a) Incubator: water bath or aluminum block that controls temperature at: a. 44.5° ± 0.2°C, and which is equipped with thermometer readable at least to the
nearest 0.2°C. b. 35.0° ± 0.5°C, and which is equipped with thermometer readable at least to the
nearest 0.5°C. c. 41.0° ± 0.5°C, and which is equipped with thermometer readable at least to the
nearest 0.5°C. b) Sterilizing Equipment (Any may be used):
a. Autoclave: 121°C @ 20psi b. Hot air oven: 170° ± 10°C c. Ultraviolet light.
c) Stereoscope d) Balance providing a sensitivity of at least 0.1 g at a load of 150g. Single pan rapid-weigh
balances are most convenient. e) Bunsen burner, alcohol burner, or electric incinerator.
10.6 Analytical Checks **Follow guideline in Standard Methods Method 9020 - Intra-laboratory Quality Control Guidelines as well as the actual referenced methods**
a) All Micro: Incubation time and temperature requirements:
a. See Table 1 for incubation temperature and time requirements.
b. An NBS or ASTM certified thermometer is necessary to document the accuracy of the working thermometer of the incubator or water bath. Thermometer accuracy should be checked against a Certified Standard and documented semi-annually. Incubator thermometer must be graduated in tenths of a degree.
i. For general use: Use thermometers with graduations of at least 0.5oC (0.1oC graduations is preferred).
ii. For incubators used above 40oC: Use thermometers with graduations of at least 0.1oC)
iii. For 44.5oC water bath use thermometers with graduations of at least 0.2oC.
b) All Micro: Use only sterile, nonbuffered, oxidant-free water for dilutions.
c) All Micro: A positive control should be run monthly, or whenever a new lot of media is purchased, to demonstrate the lab's ability to obtain a positive test from a known contaminated

QA Guidance for Self Monitoring Laboratories Oregon Department of Environmental Quality DEQ09-LAB-0071-QAG 09/13/17 Version 3.0 Page 15 of 29
sample. Positive controls can be purchased (E. coli), or analyze 1 ml of influent diluted to 100 ml with dilution water.
d) All Micro: A negative control must be run with each test on dilution/rinse buffer to verify the sterility of equipment and solutions.
e) All Micro: If a laboratory prepares its own media, records must be maintained documenting the date prepared, type of medium, lot number, sterilization time, heat exposure time, final pH, and preparer initials Membrane Filtration (MF) methods: Filters should be incubated within 30 minutes of filtration and do not hold diluted samples more than 30 minutes before inoculation.
f) E.coli (Colilert® Quanti-Tray®): Only yellow colonies that fluoresce are counted. Look for fluorescence with a 6-watt, 365-nm UV light within 5 inches of the sample in a dark environment. Yellow colonies that do not fluoresce are positive for Total coliform.
g) E.coli, Fecal (Colilert® Quanti-Tray®): In samples with excessive chlorine, a blue flash may be seen when adding Colilert. If this is seen, consider sample invalid and discontinue testing.
h) E.coli, Fecal (Quanti-Tray®): Use Quanti-Tray 2000® for enumeration since QT2000 can read up to 2419/ml.
i) Fecal and Total (MF Methods): Coliform colonies should be counted within 30 minutes from removal from incubator.
j) Fecal and Total (MF Methods): Test should be prepared at volumes such that the number of colonies per filter is between 20 and 60 for Fecal Coliforms and between 20 and 80 for total coliforms and enterococcus. More than one aliquot volume should be run on each sample to ensure this criterion can be satisfied.
k) Fecal (MF Method): Only the blue colonies are counted as fecal coliforms.
11.0 Calculation & Reporting of Results
11.1 Individual Sample Calculations and Reporting - MPN Methods a) For Quanti-Tray® and Quanti-Tray/2000® and mColiBlue-24® use the table provided by the
manufacturer to quantitate MPN/100ml values for samples.
b) For the 5 Tube, 3 dilution methods (SM 9221) for Fecal and Total Coliforms follow guidance below:
Use Table 9221.IV from Standard methods for enumeration of MPN 5 tube / 3 dilution methods. Report results as written from table (do not round further).
Table 9221.IV is based on 3 dilutions: 10ml, 1ml, and 0.1ml.
From Standard Methods: When the series of decimal dilutions is different from the table, select MPN value from Table 9221:IV for the combination of positive tubes and calculate according to the following formula:
𝑀𝑀𝑀𝑀𝑀𝑀100𝑚𝑚𝑚𝑚
= 𝑀𝑀𝑀𝑀𝑀𝑀 𝐼𝐼𝐼𝐼𝐼𝐼𝐼𝐼𝐼𝐼 𝑣𝑣𝑣𝑣𝑣𝑣𝑣𝑣𝐼𝐼 𝑆𝑆𝑓𝑓𝑓𝑓𝑚𝑚 𝑇𝑇𝑣𝑣𝑇𝑇𝑣𝑣𝐼𝐼 9221. 𝐼𝐼𝐼𝐼 × 10
𝑚𝑚𝑣𝑣𝑓𝑓𝐿𝐿𝐼𝐼𝐿𝐿𝐿𝐿 𝑣𝑣𝑓𝑓𝑣𝑣𝑣𝑣𝑚𝑚𝐼𝐼 𝐿𝐿𝐼𝐼𝐿𝐿𝐿𝐿𝐼𝐼𝐼𝐼
See Examples A and D below
When more than 3 dilutions are used in a decimal series of dilutions, use the results from only 3 of these in computing the MPN. To select the 3 dilutions to be used, choose the highest dilution (most diluted)

QA Guidance for Self Monitoring Laboratories Oregon Department of Environmental Quality DEQ09-LAB-0071-QAG 09/13/17 Version 3.0 Page 16 of 29
that gives positive results in all 5 portions tested for that volume (no lower dilution giving negative results) and the 2 next succeeding dilutions. See Examples A-D below.
Example 10 ml 1 ml 0.1 ml 0.01 ml Combination of Positives
MPN /100ml
A 5/5 5/5 2/5 0/5 5-2-0 500
B 5/5 4/5 2/5 0/5 5-4-2 220
C 0/5 1/5 0/5 0/5 0-1-0 2
D 5/5 5/5 3/5 3/5 5-3-3 1700
E 5/5 3/5 1/5 1/5 5-3-2 140
F 5/5 3/5 2/5 0/5 5-3-2 140
When a case such as that shown in Example E arises where a positive occurs in a dilution higher that than the 3 chosen according to the rule, incorporate it in the result for the highest chosen dilution, as in F.
11.2 Individual Sample Calculations and Reporting - Membrane Filtration Methods
40 CFR Part 136 references both Standard Methods and EPA 600/8-78-017. However, each reference uses different procedures for calculating results when multiple sample volumes are used. The following calculation procedures were taken from the EPA document (refer to 6.e.vii. (4)), and should be used over those given in Standard Methods. Standard Methods shows an example of averaging results when all aliquots produce colonies that are below the acceptable limit. However, the larger the sample volume filtered the more likely it is accurate. The criteria for selecting the appropriate aliquot to make the calculation are as follows:
• Use the test result that produced a number within the acceptable range of 20 to 60 colonies (Fecal Coliforms) or 20-80 colonies (Total Coliforms) – See Numeration Limits in Table 2).
• If more than one aliquot yields acceptable results or none produced enough colonies (i.e. all were <20 colonies), use the larger sample volume to calculate the report value. Do not average the results as given in Standard Methods.
• If all aliquots produced numbers that exceed 60 colonies (or 80 colonies) use the smallest sample volume.
Note: All examples below use the Fecal Coliform 20-60 colony criteria for the decision point, the same rules apply for the Total Coliform methods that use 20-80 colony criteria, just use 80 as the decision point and rather than 60.
a) Both references use the following formula.
• Colonies 𝑐𝑐𝑐𝑐𝑐𝑐100𝑚𝑚𝑚𝑚
= 𝑁𝑁𝑉𝑉
× 100
Where: 𝑀𝑀 = Number of Colonies Counted 𝐼𝐼 = Volume of Sample filtered (ml) 𝑐𝑐𝑆𝑆𝑣𝑣 = Colony Forming Units
QA Guidance for Self Monitoring Laboratories Oregon Department of Environmental Quality DEQ09-LAB-0071-QAG 09/13/17 Version 3.0 Page 17 of 29
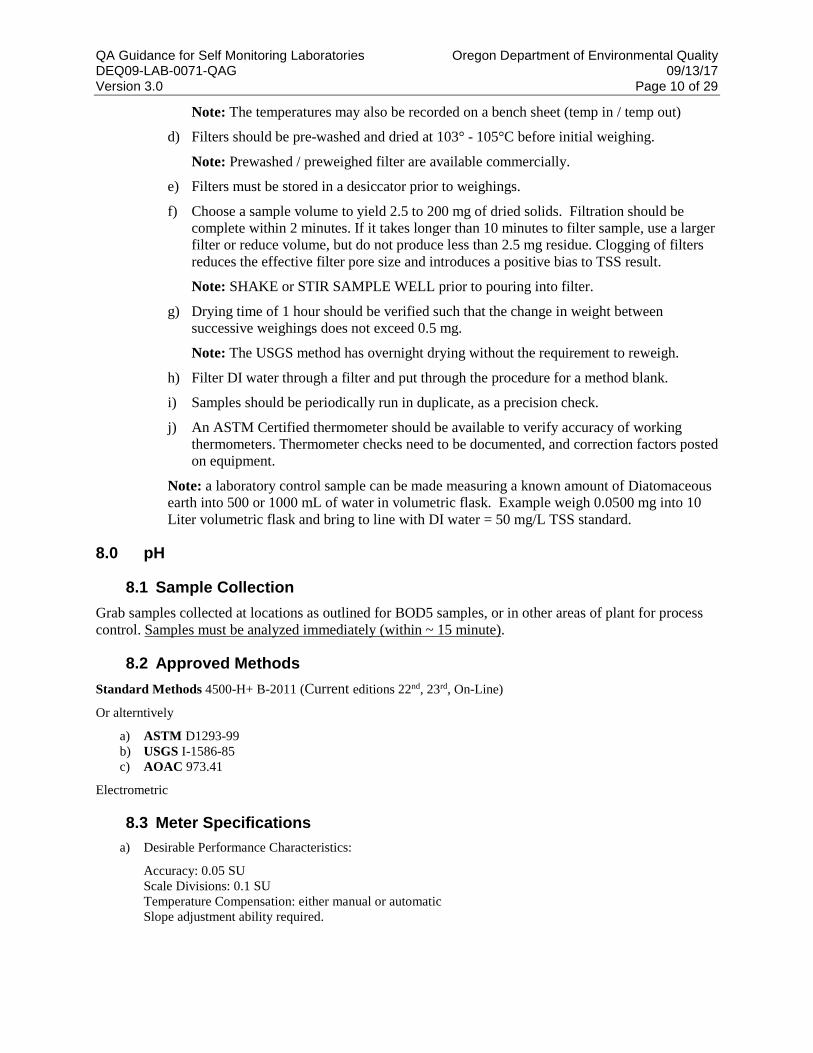
b) Example Equation where only one plate count is within acceptable limits (20 - 60)
5 ml sample produced 30 counts and 10 ml sample produced 15 counts. Use the 5 ml sample because 30 colonies are within the acceptable range and 15 colonies isn't.
• FC 𝑐𝑐𝑐𝑐𝑐𝑐100𝑚𝑚𝑚𝑚
= 305
× 100 = 600 FC 𝑐𝑐𝑐𝑐𝑐𝑐100𝑚𝑚𝑚𝑚
Where FC = Fecal Coliform
c) Example Equation where more than one plate count is within acceptable limits (20 - 60)
5 ml sample obtained 60 counts and 1 ml sample obtained 20 counts. Use the value obtained from the largest filtered volume (1200 cfu/100ml). The larger volume has a higher probability of being accurate
• FC 𝑐𝑐𝑐𝑐𝑐𝑐100𝑚𝑚𝑚𝑚
= 605
× 100 = 1200 FC 𝑐𝑐𝑐𝑐𝑐𝑐100𝑚𝑚𝑚𝑚
• FC 𝑐𝑐𝑐𝑐𝑐𝑐100𝑚𝑚𝑚𝑚
= 201
× 100 = 2000 FC 𝑐𝑐𝑐𝑐𝑐𝑐100𝑚𝑚𝑚𝑚
d) Example Equation where ALL MF counts are below the lower limit of 20, select the value obtained from the largest volume sampled and report as “est” (estimated).
Sample volumes of 1, 0.3, and 0.01 ml produced counts of 14, 3, and 0 respectively. In this example the 1 ml dilution is larger than the other dilutions and is used for the calculation.
• FC 𝑐𝑐𝑐𝑐𝑐𝑐100𝑚𝑚𝑚𝑚
= 141
× 100 = 1400 est FC 𝑐𝑐𝑐𝑐𝑐𝑐100𝑚𝑚𝑚𝑚
e) Example Equation where ALL MF counts are zero, calculate the final result using the count from
largest filtered volume and report as “<” (less than).
Volumes of 25, 10 and 1 ml of sample filtered. In this case use the 25 ml volume.
• FC 𝑐𝑐𝑐𝑐𝑐𝑐100𝑚𝑚𝑚𝑚
= 125
× 100 = < 4 FC 𝑐𝑐𝑐𝑐𝑐𝑐100𝑚𝑚𝑚𝑚
f) Example Equation where all membrane counts exceed 60, calculate the final result using smallest
sample volume and report as “est (estimated).
Volumes of 25, 10 and 1 ml of sample filtered with counts of 90, 100, and 70 respectively. In this case use the 1 ml volume.
• FC 𝑐𝑐𝑐𝑐𝑐𝑐100𝑚𝑚𝑚𝑚
= 701
× 100 = 7000 est FC 𝑐𝑐𝑐𝑐𝑐𝑐100𝑚𝑚𝑚𝑚
QA Guidance for Self Monitoring Laboratories Oregon Department of Environmental Quality DEQ09-LAB-0071-QAG 09/13/17 Version 3.0 Page 18 of 29
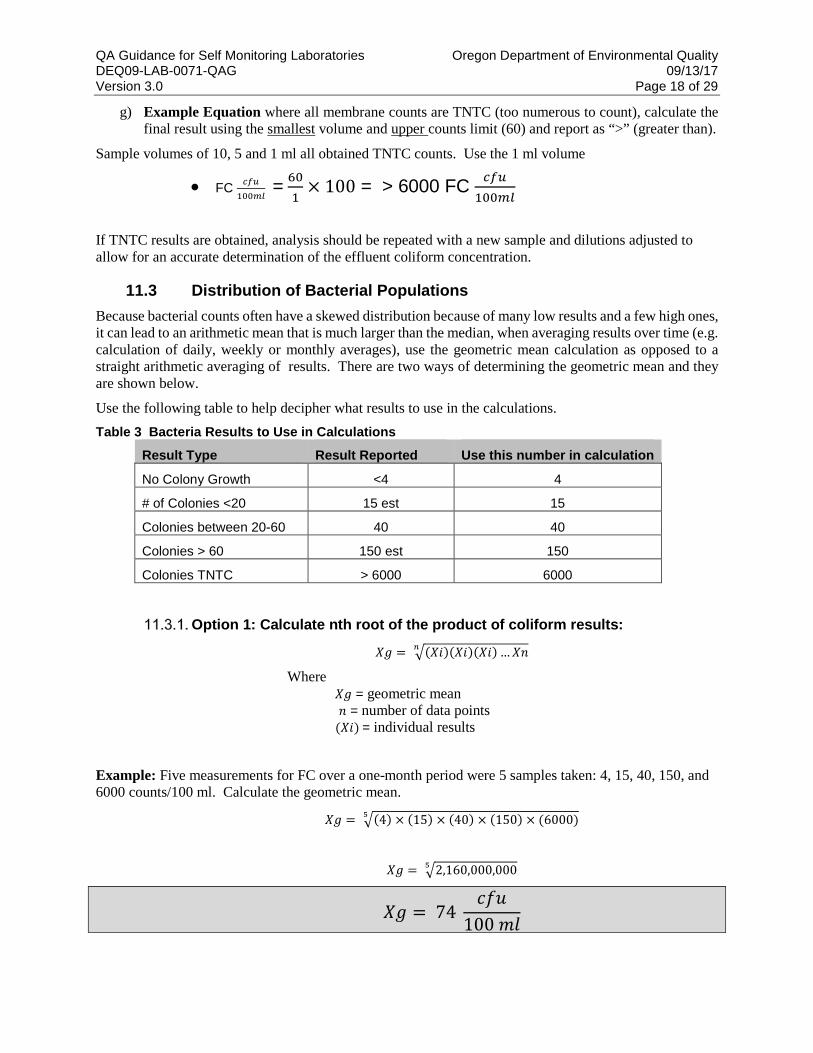
g) Example Equation where all membrane counts are TNTC (too numerous to count), calculate the final result using the smallest volume and upper counts limit (60) and report as “>” (greater than).
Sample volumes of 10, 5 and 1 ml all obtained TNTC counts. Use the 1 ml volume
• FC 𝑐𝑐𝑐𝑐𝑐𝑐100𝑚𝑚𝑚𝑚
= 601
× 100 = > 6000 FC 𝑐𝑐𝑐𝑐𝑐𝑐100𝑚𝑚𝑚𝑚
If TNTC results are obtained, analysis should be repeated with a new sample and dilutions adjusted to allow for an accurate determination of the effluent coliform concentration.
11.3 Distribution of Bacterial Populations Because bacterial counts often have a skewed distribution because of many low results and a few high ones, it can lead to an arithmetic mean that is much larger than the median, when averaging results over time (e.g. calculation of daily, weekly or monthly averages), use the geometric mean calculation as opposed to a straight arithmetic averaging of results. There are two ways of determining the geometric mean and they are shown below.
Use the following table to help decipher what results to use in the calculations. Table 3 Bacteria Results to Use in Calculations
Result Type Result Reported Use this number in calculation
No Colony Growth <4 4
# of Colonies <20 15 est 15
Colonies between 20-60 40 40
Colonies > 60 150 est 150
Colonies TNTC > 6000 6000
Option 1: Calculate nth root of the product of coliform results:
𝑋𝑋𝐿𝐿 = �(𝑋𝑋𝑆𝑆)(𝑋𝑋𝑆𝑆)(𝑋𝑋𝑆𝑆) …𝑋𝑋𝐼𝐼𝑛𝑛
Where 𝑋𝑋𝐿𝐿 = geometric mean 𝐼𝐼 = number of data points (𝑋𝑋𝑆𝑆) = individual results
Example: Five measurements for FC over a one-month period were 5 samples taken: 4, 15, 40, 150, and 6000 counts/100 ml. Calculate the geometric mean.
𝑋𝑋𝐿𝐿 = �(4) × (15) × (40) × (150) × (6000)5
𝑋𝑋𝐿𝐿 = �2,160,000,0005
𝑋𝑋𝐿𝐿 = 74 𝑐𝑐𝑆𝑆𝑣𝑣
100 𝑚𝑚𝑣𝑣

QA Guidance for Self Monitoring Laboratories Oregon Department of Environmental Quality DEQ09-LAB-0071-QAG 09/13/17 Version 3.0 Page 19 of 29
Option 2: Calculate antilog of arithmetic mean of log transformed FC results:
𝑚𝑚𝑓𝑓𝐿𝐿 𝑋𝑋𝐿𝐿 = ∑(log𝑋𝑋𝑆𝑆)
𝐼𝐼
Where 𝑋𝑋𝐿𝐿 = geometric mean 𝐼𝐼 = number of data points 𝑋𝑋𝑆𝑆 = individual results
Example: Five measurements for FC over a one-month period were 5 samples taken: 4, 15, 40, 150, and 6000 counts/100 ml. Calculate the geometric mean (Log mean).
𝑚𝑚𝑓𝑓𝐿𝐿 𝑋𝑋𝐿𝐿 = (𝑚𝑚𝑓𝑓𝐿𝐿 4) + (𝑚𝑚𝑓𝑓𝐿𝐿 15) + (log 40) + (𝑚𝑚𝑓𝑓𝐿𝐿150) + (𝑚𝑚𝑓𝑓𝐿𝐿 6000)
5
𝑚𝑚𝑓𝑓𝐿𝐿 𝑋𝑋𝐿𝐿 = (0.60) + (1.18) + (1.6) + (2.18) + (3.78)
5
𝑚𝑚𝑓𝑓𝐿𝐿 𝑋𝑋𝐿𝐿 = 9.34
5
𝑋𝑋𝐿𝐿 = antilog 1.868
𝑋𝑋𝐿𝐿 = 74 𝑐𝑐𝑆𝑆𝑣𝑣
100 𝑚𝑚𝑣𝑣
Note that the same result was obtained using either calculation method.
12.0 Statistical Measures Statistical methods provide the basis for determining the precision and accuracy of data. Once precision (Appendix A) and accuracy (Appendix B) performance has been established, it can be used to verify self-monitoring data by establishing quality control limits. Data that does not meet set control limits for precision or accuracy indicate that some sort of error has occurred due to equipment failure, analyst error, or a calculation error. Identification and correction of errors improves the overall quality of the data generated by a laboratory.

QA Guidance for Self Monitoring Laboratories Oregon Department of Environmental Quality DEQ09-LAB-0071-QAG 09/13/17 Version 3.0 Page 20 of 29
Appendix A Procedure for Calculating Method Precision
1 Definition: Precision is a measure of the spread in the data, or the repeatability of obtaining a given result on a sample or standard. Precision is expressed either in standard deviation (multiple results), range (difference between duplicate analyses) or relative percent difference (RPD: range divided by the mean between duplicate analyses and multiplied by 100). Range is commonly used for samples that do not vary appreciably in concentration (such as effluent BOD) whereas RPD is used for samples, which may vary in concentration several orders of magnitude (i.e. 1 - 500 mg/L) and range is dependent on concentration.
2 Calculation:
𝑅𝑅𝑀𝑀𝐵𝐵 = |𝑋𝑋𝐿𝐿 − 𝑋𝑋𝐼𝐼|(𝑋𝑋𝐿𝐿 + 𝑋𝑋𝐼𝐼)
2
× 100
Where RPD = Relative Percent Difference
Xs = Sample measurement X𝐼𝐼 = Duplicate measurement Example: Duplicate analysis for BOD5 on an effluent sample obtained the following results: 15 and 20 mg/L.
𝑅𝑅𝑀𝑀𝐵𝐵 = |15 − 20|(15 + 20)
2
× 100
𝑅𝑅𝑀𝑀𝐵𝐵 = |−5|17.5
× 100
𝑹𝑹𝑹𝑹𝑹𝑹 = 𝟐𝟐𝟐𝟐.𝟔𝟔% Note that calculation utilizes the absolute value in the numerator and therefore it doesn’t matter which number is greater.
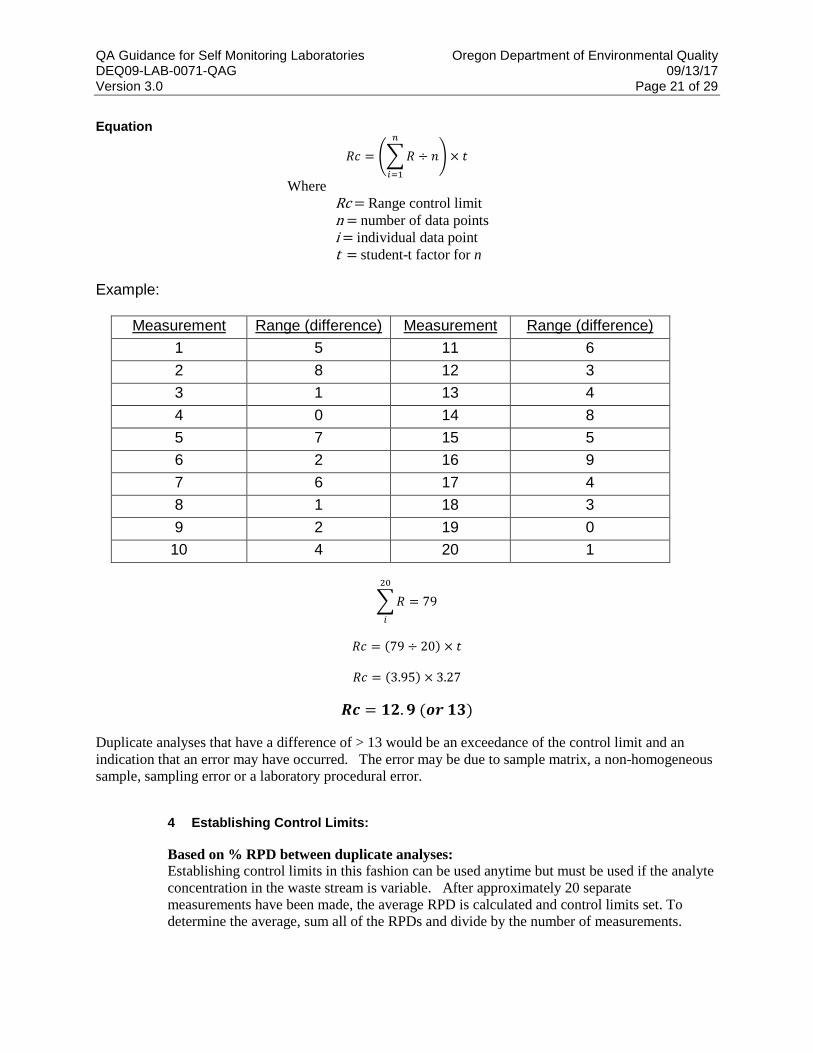
3 Establishing Control Limits: Based range (difference) between duplicate analyses: Establishing control limits in this fashion should only be used if the waste stream is consistent with little variability in analyte concentration. If concentrations of an analyte vary significantly precision control limits should be calculated based on variation in % RPD. After approximately 20 separate measurements have been made, the average range is calculated and control limits set. To determine the average, sum all of the ranges (difference between duplicate analyses) and divide by the number of measurements. Multiply the average range by the student "t" factor of 3.27 for a 95% confidence interval to determine the control limit:
QA Guidance for Self Monitoring Laboratories Oregon Department of Environmental Quality DEQ09-LAB-0071-QAG 09/13/17 Version 3.0 Page 21 of 29
Equation
𝑅𝑅𝑐𝑐 = ��𝑅𝑅𝑛𝑛
𝑖𝑖=1
÷ 𝐼𝐼� × 𝐿𝐿
Where Rc = Range control limit n = number of data points i = individual data point t = student-t factor for n Example:
Measurement Range (difference) Measurement Range (difference) 1 5 11 6 2 8 12 3 3 1 13 4 4 0 14 8 5 7 15 5 6 2 16 9 7 6 17 4 8 1 18 3 9 2 19 0
10 4 20 1
�𝑅𝑅 = 7920
𝑖𝑖
𝑅𝑅𝑐𝑐 = (79 ÷ 20) × 𝐿𝐿
𝑅𝑅𝑐𝑐 = (3.95) × 3.27
𝑹𝑹𝑹𝑹 = 𝟏𝟏𝟐𝟐.𝟗𝟗 (𝒐𝒐𝒐𝒐 𝟏𝟏𝟏𝟏)
Duplicate analyses that have a difference of > 13 would be an exceedance of the control limit and an indication that an error may have occurred. The error may be due to sample matrix, a non-homogeneous sample, sampling error or a laboratory procedural error.
4 Establishing Control Limits: Based on % RPD between duplicate analyses: Establishing control limits in this fashion can be used anytime but must be used if the analyte concentration in the waste stream is variable. After approximately 20 separate measurements have been made, the average RPD is calculated and control limits set. To determine the average, sum all of the RPDs and divide by the number of measurements.

QA Guidance for Self Monitoring Laboratories Oregon Department of Environmental Quality DEQ09-LAB-0071-QAG 09/13/17 Version 3.0 Page 22 of 29
Calculate the standard deviation (SD) of the data set. The control limit is determined by adding the average %RPD and 3xSD.
Equation 1: RPD Control Limit
𝑅𝑅𝑀𝑀𝐵𝐵𝑐𝑐 = ��𝑅𝑅𝑀𝑀𝐵𝐵𝑛𝑛
𝑖𝑖=1
÷ 𝐼𝐼� + (3 × 𝑆𝑆𝐵𝐵)
Where RPDc = RPD control limit n = number of data points i = individual RPDs t = student-t factor for n SD = standard deviation of data set Equation 2: Standard Deviation
𝑆𝑆𝐵𝐵 = �∑ (𝑅𝑅𝑀𝑀𝐵𝐵𝑆𝑆 − 𝑅𝑅𝑀𝑀𝐵𝐵𝑣𝑣)2𝑛𝑛𝑖𝑖=1
𝐼𝐼 − 1
Where SD = Standard Deviation n = number of data points RPDi = individual RPDs RPDa = Average RPD Scientific calculators have statistical functions for calculating averages and standard deviations. These calculations can also be performed easily with Microsoft Excel® or other commercially available spreadsheet software. Example:
Measurement % RPD Measurement % RPD 1 15.2 11 25.2 2 16.8 12 19 3 10.3 13 17.3 4 15.6 14 25 5 25.6 15 30 6 28.5 16 14.2 7 18.8 17 14.3 8 28.6 18 23.8 9 14 19 12.2
10 27.8 20 16.9

QA Guidance for Self Monitoring Laboratories Oregon Department of Environmental Quality DEQ09-LAB-0071-QAG 09/13/17 Version 3.0 Page 23 of 29
Note: Standard Deviation (SD) = 6.215
��𝑅𝑅𝑀𝑀𝐵𝐵20
𝑖𝑖=1
= 399.1�
𝑅𝑅𝑀𝑀𝐵𝐵𝑐𝑐 = (399.1 ÷ 20) + (3 × 𝑆𝑆𝐵𝐵)
𝑅𝑅𝑀𝑀𝐵𝐵𝑐𝑐 = (19.955) + (3 × 6.215)
𝑅𝑅𝑀𝑀𝐵𝐵𝑐𝑐 = (19.955) + (18.645)
= 𝟏𝟏𝟐𝟐.𝟔𝟔% (𝟏𝟏𝟗𝟗%)𝑹𝑹𝑹𝑹𝑹𝑹
Duplicate analyses that have an RPD of > 39% would be an exceedance of the control limit and an indication that an error may have occurred. The error may be due to sample matrix, a non-homogeneous sample, sampling error or a laboratory procedural error.

QA Guidance for Self Monitoring Laboratories Oregon Department of Environmental Quality DEQ09-LAB-0071-QAG 09/13/17 Version 3.0 Page 24 of 29
Appendix B Procedure for Calculating Method Accuracy
A. Determining Accuracy
1 Definition: Accuracy is a measure of how well an analytical measurement compares to the "true value". Accuracy can be determined from the analysis of a known reference standard or with the analysis of a sample spike (addition of a known amount of analyte to a sample) and is measured as percent recovery.
2 Calculation of Percent Recovery (%R):
Reference Standard
%𝑅𝑅 = (𝑆𝑆𝑓𝑓𝑇𝑇𝑣𝑣
) × 100
Where %R = Percent Recovery Sr = Standard result measured Tv = True value of Standard
Example: A glucose/glutamic acid standard for BOD5 analysis was analyzed and a result of 185 mg/L obtained. Theoretical value of standard is 200 mg/L.
%𝑅𝑅 = (185200
) × 100
%𝑹𝑹 = 𝟗𝟗𝟐𝟐.𝟓𝟓%
Sample Spike
%𝑅𝑅 = ((𝑆𝑆𝑆𝑆 − 𝑆𝑆𝑣𝑣)
𝑇𝑇𝑣𝑣) × 100
Where Sp = Spike sample result Sa = Sample Result (unspiked) Example: A sample for an Ammonia analysis was analyzed and a result of 2.5 mg/L obtained. A known amount of ammonia (10 mg/L) was added to a second aliquot of the sample and the analyzed and a result of 11.6 mg/L was obtained
%𝑅𝑅 = ((11.6 − 2.5)
10) × 100
%𝑹𝑹 = 𝟗𝟗𝟏𝟏.𝟎𝟎%

QA Guidance for Self Monitoring Laboratories Oregon Department of Environmental Quality DEQ09-LAB-0071-QAG 09/13/17 Version 3.0 Page 25 of 29
3 Determining Control Limits: The control limits for percent recovery are calculated similar to the example of %RPD control limits (Appendix A.4 Equation 1). The standard deviation (dispersion statistic) is calculated using the equation in Appendix A.4 Equation 2 except RPD is substituted with percent recoveries. Often warning limits are also established as an indication that there may be some deterioration in the process that should be evaluated at before control limits are exceed. Warning limits use the mean + 2SD instead of + 3SD used for control limits. Control limits for percent recovery are based on variations from the mean both positive and negative whereas the RPD control limit is based on only the positive deviation from the mean. Using the equations in Appendix A.4: Control Limits for % Recovery = Average Recovery + 3SD Warning Limits for % recovery = Average Recovery + 2SD Example: A glucose/glutamic acid standard for BOD5 analysis obtained an average percent recovery over time of 94% with a standard deviation of 5%. The control and warning limits would be:
Warning limits = 94 ± 2(5) = 94 ± 10% = 84 - 104% Control limits = 94 ± 3(5) = 94 ± 15% = 79 - 109%

QA Guidance for Self Monitoring Laboratories Oregon Department of Environmental Quality DEQ09-LAB-0071-QAG 09/13/17 Version 3.0 Page 26 of 29
Appendix C Control Charting
Control charts are an effect tool to monitor Precision or Accuracy on individual data points over time. The concept is to plot each percent recovery, RPD, Range, etc. on a chart showing the control limits (and Warning Limits) to give a visual display of performance and trends.
Figure 1 Precision Control Chart as a function of range or RPD
The dark bar is the upper control limit.
Figure 2 Accuracy Control Chart as a function of percent recovery
Inner two bars are warning limits
Outer two bars are control limits

QA Guidance for Self Monitoring Laboratories Oregon Department of Environmental Quality DEQ09-LAB-0071-QAG 09/13/17 Version 3.0 Page 27 of 29
Appendix D Example Analysis Form I
DAY: DATE:
Suspended Solids:
Oven temperature (°C): 5g class S weight (g):
Row SAMPLE: QC*
Filter#:
A = Volume (ml):
B = TSS Filter + Dry Solids (g):
C = TDS Dish + Dry Solids (g):
D = Filter Tare (g):
E = Dish Tare (g):
Mass diff. TSS
F = B - D (g):
Mass diff. TDS
G = C - E (g):
TSS (mg/L) = 1,000,000 × F/A:
TDS (mg/L) 1,000,000 × G/A:
pH:
Sample temperature (°C): pH 7 buffer:
pH 4 buffer: pH 10 buffer: * QC sample for TDS is a solution of KCl, and for TSS a suspension of diatomaceous earth.
QA Guidance for Self Monitoring Laboratories Oregon Department of Environmental Quality DEQ09-LAB-0071-QAG 09/13/17 Version 3.0 Page 28 of 29
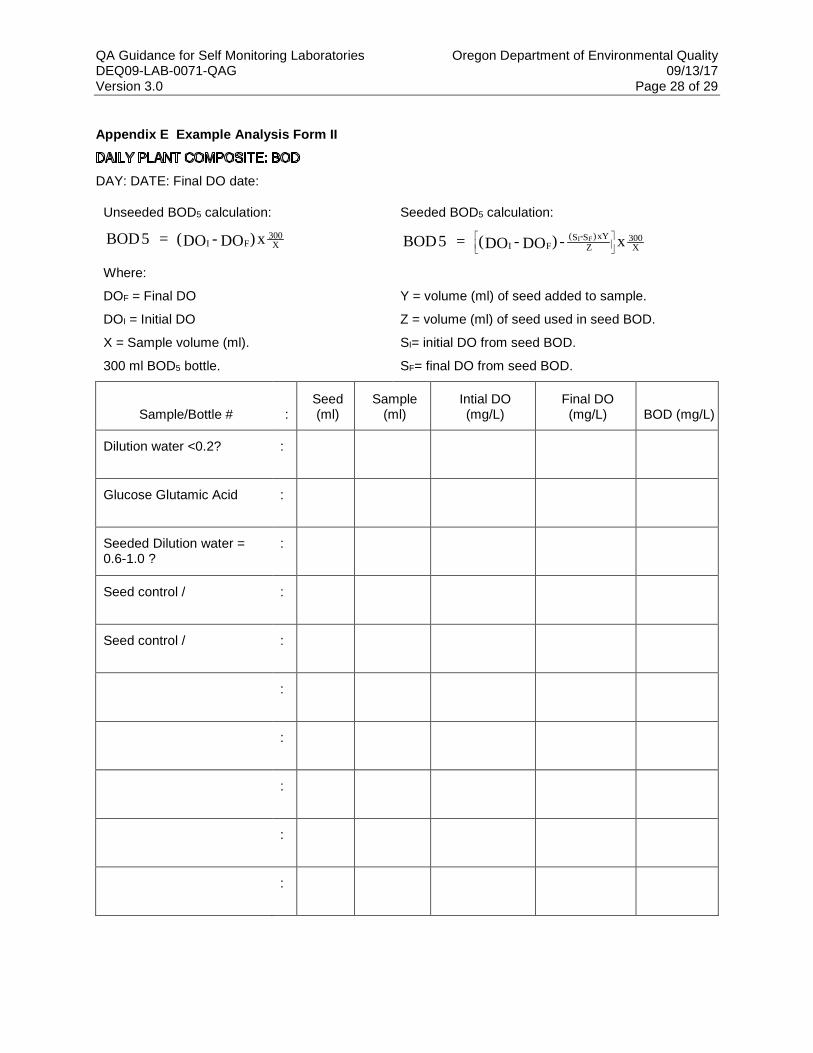
Appendix E Example Analysis Form II
DAY: DATE: Final DO date:
Unseeded BOD5 calculation: Seeded BOD5 calculation:
BOD5 = (DO - DO )xI F300X BOD5 = (DO - DO ) - xI F
(S -S )xYZ
300X
I F
Where:
DOF = Final DO Y = volume (ml) of seed added to sample.
DOI = Initial DO Z = volume (ml) of seed used in seed BOD.
X = Sample volume (ml). SI= initial DO from seed BOD.
300 ml BOD5 bottle. SF= final DO from seed BOD.
Sample/Bottle # : Seed (ml)
Sample (ml)
Intial DO (mg/L)
Final DO (mg/L) BOD (mg/L)
Dilution water <0.2? :
Glucose Glutamic Acid :
Seeded Dilution water = 0.6-1.0 ?
:
Seed control / :
Seed control / :
:
:
:
:
:

QA Guidance for Self Monitoring Laboratories Oregon Department of Environmental Quality DEQ09-LAB-0071-QAG 09/13/17 Version 3.0 Page 29 of 29
Appendix F Revision History.
Revision Date Changes Editor
1.1 April 2001 Original Document CLR
2.0 October 2009
Reformatted
Updated Method references
Extensive clarifications to microbiology requirements including Holding Time requirements.
SCH
2.1 12/15/2009 Corrected pagenation error SCH
2.2 05/06/2010 Clarified SCH
2.3 4/25/2013 Added 2.2.3 (Acceptable methods section). Added Note to 2.2.4. Updated throughout to reflect 2012 changes in 40 CFR part 136 references to Standard Methods.
SCH
3.0 09/13/2017 Updated Formating. Added section 2 Useful Resources, added clarification regarding what parameters cannot be from composite samples, updated all method references to reflect 2017 MUR, Added information regarding QA/QC requirements in 40 CFR 136.7 and updated some of the method specific information to reflect CFR requirements. Added more references to the CFR in general.
SCH