Embed Size (px)
Citation preview
Derek BurletonVice President and Deputy Chief Economist
June 2011
HOUSEHOLD DEBT IN CANADA: A REGIONAL
PERSPECTIVE
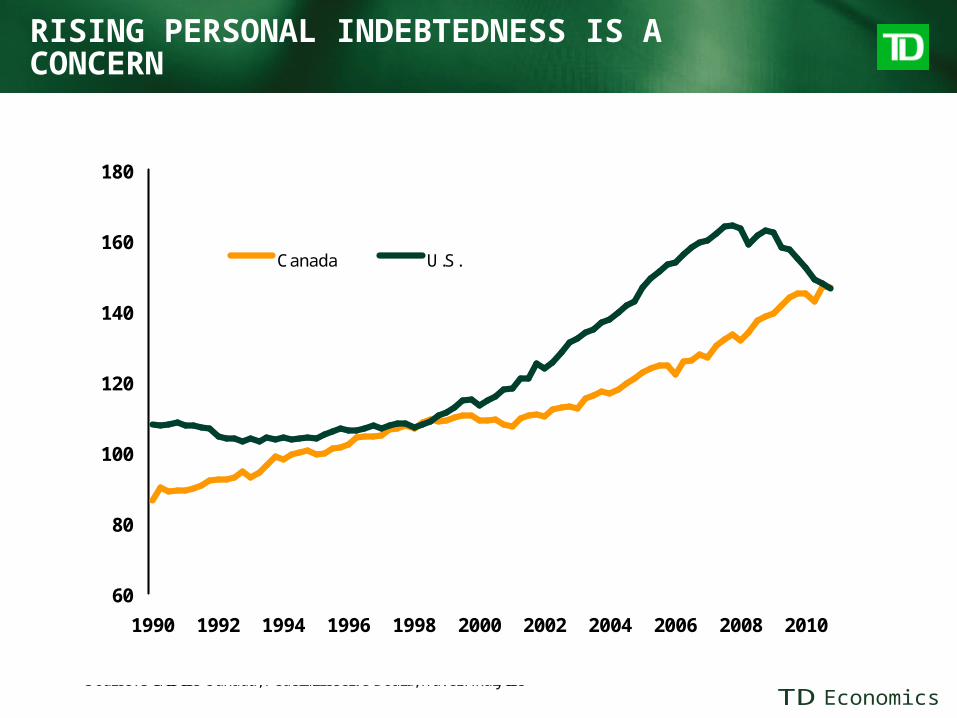
RISING PERSONAL INDEBTEDNESS IS A CONCERN
60
80
100
120
140
160
180
1990 1992 1994 1996 1998 2000 2002 2004 2006 2008 2010
Canada U.S.
Source: Statistics Canada, Federal reserve Board, Haver Analytics
Household debt to personal disposable income, %
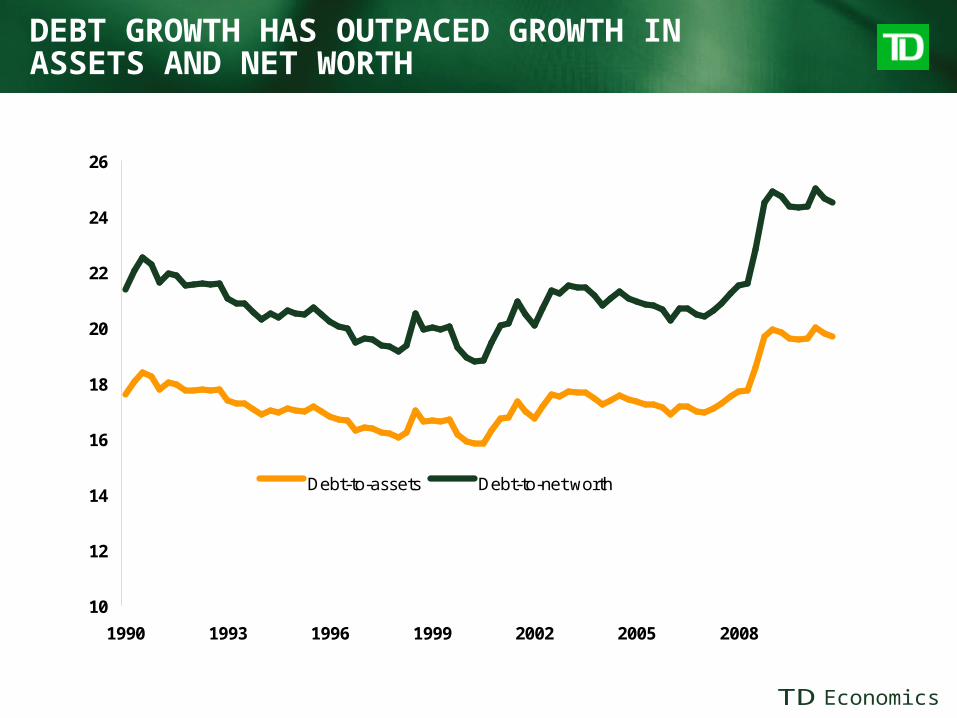
DEBT GROWTH HAS OUTPACED GROWTH IN ASSETS AND NET WORTH
10
12
14
16
18
20
22
24
26
1990 1993 1996 1999 2002 2005 2008
Debt-to-assets Debt-to-net worth
Source: Statistics Canada/Haver Analytics
Ratio
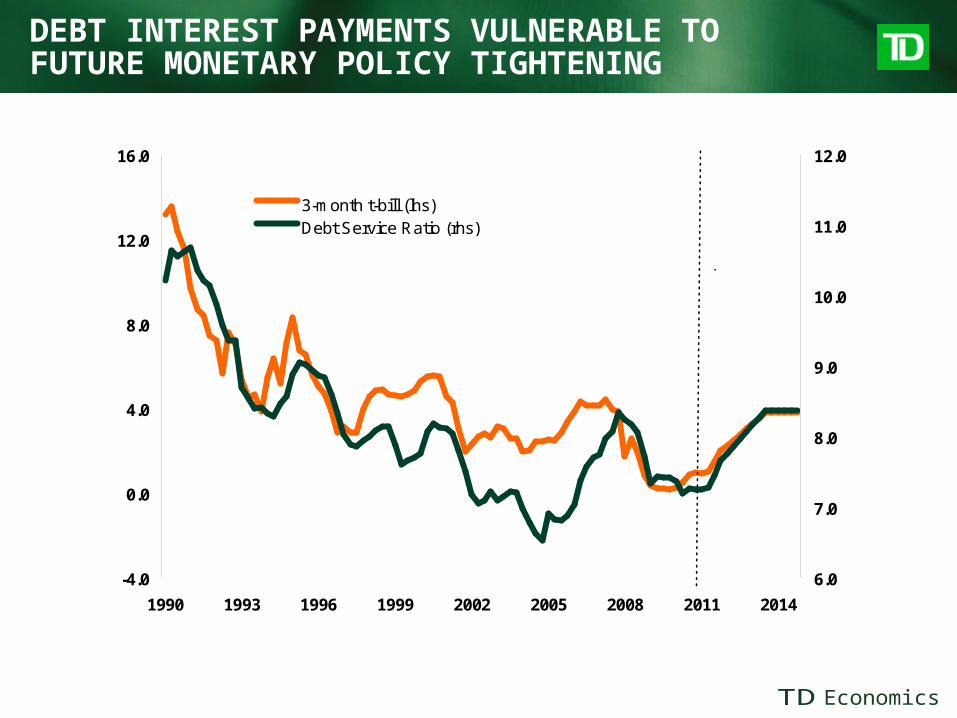
DEBT INTEREST PAYMENTS VULNERABLE TO FUTURE MONETARY POLICY TIGHTENING
-4.0
0.0
4.0
8.0
12.0
16.0
1990 1993 1996 1999 2002 2005 2008 2011 2014
6.0
7.0
8.0
9.0
10.0
11.0
12.0
3-month t-bill (lhs)Debt Service Ratio (rhs)
Yield, %%
forecast
Source: Statistics Canada, Bank of Canada, Haver Analytics, Forecast by TD Economics as of March 2011
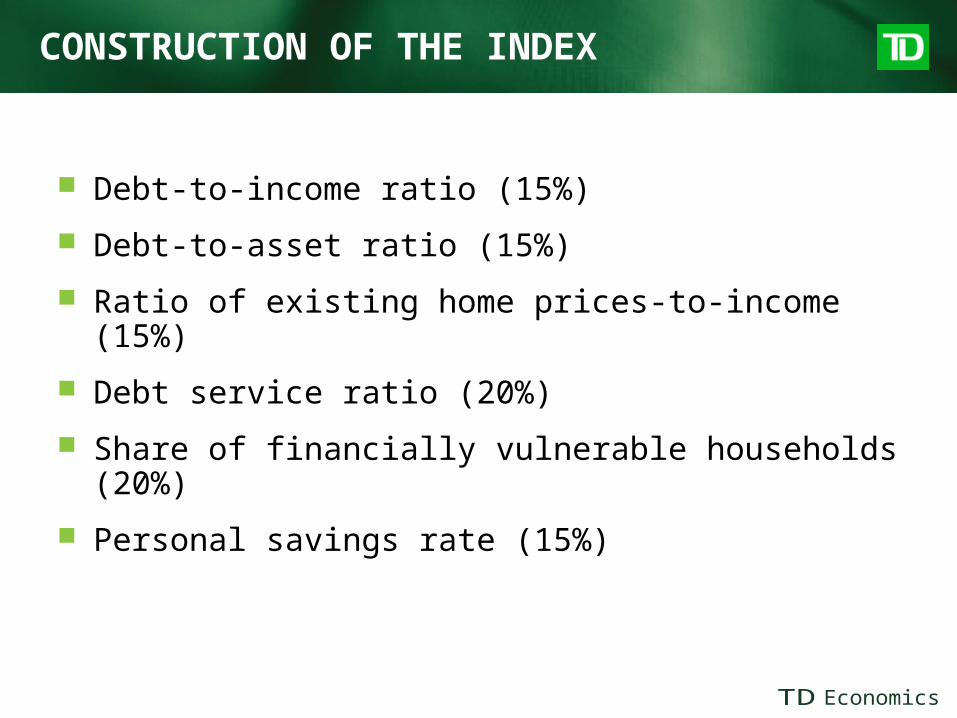
CONSTRUCTION OF THE INDEX
Debt-to-income ratio (15%)
Debt-to-asset ratio (15%)
Ratio of existing home prices-to-income (15%)
Debt service ratio (20%)
Share of financially vulnerable households (20%)
Personal savings rate (15%)
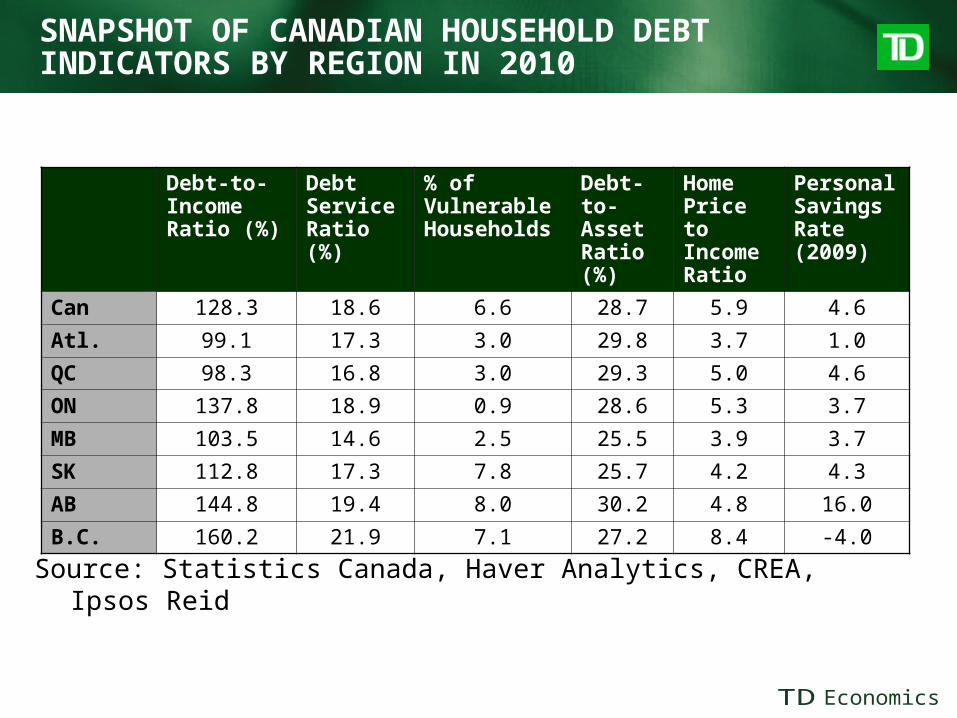
SNAPSHOT OF CANADIAN HOUSEHOLD DEBT INDICATORS BY REGION IN 2010
Debt-to-Income Ratio (%)
Debt Service Ratio (%)
% of Vulnerable Households
Debt-to-Asset Ratio (%)
Home Price to Income Ratio
Personal Savings Rate (2009)
Can 128.3 18.6 6.6 28.7 5.9 4.6
Atl. 99.1 17.3 3.0 29.8 3.7 1.0
QC 98.3 16.8 3.0 29.3 5.0 4.6
ON 137.8 18.9 0.9 28.6 5.3 3.7
MB 103.5 14.6 2.5 25.5 3.9 3.7
SK 112.8 17.3 7.8 25.7 4.2 4.3
AB 144.8 19.4 8.0 30.2 4.8 16.0
B.C. 160.2 21.9 7.1 27.2 8.4 -4.0
Source: Statistics Canada, Haver Analytics, CREA, Ipsos Reid
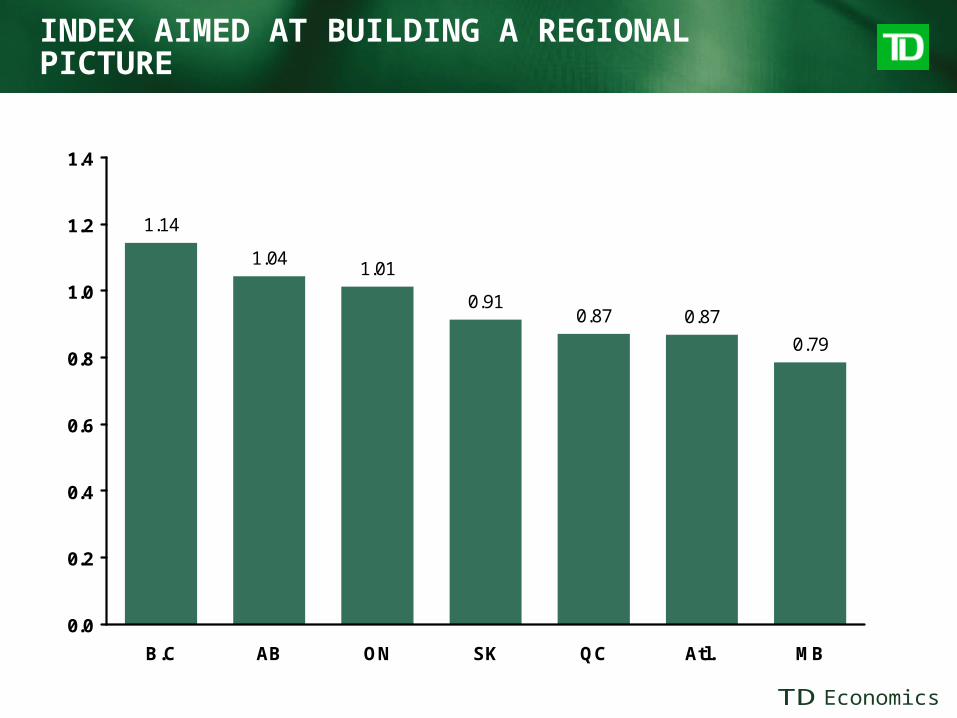
INDEX AIMED AT BUILDING A REGIONAL PICTURE
1.14
1.041.01
0.910.87 0.87
0.79
0.0
0.2
0.4
0.6
0.8
1.0
1.2
1.4
B.C AB ON SK QC Atl. MB
Source: Ipsos Reid, index generated by TD Economics
TD Economics Household Vulnerability Index 2010(Canada = 1.0)
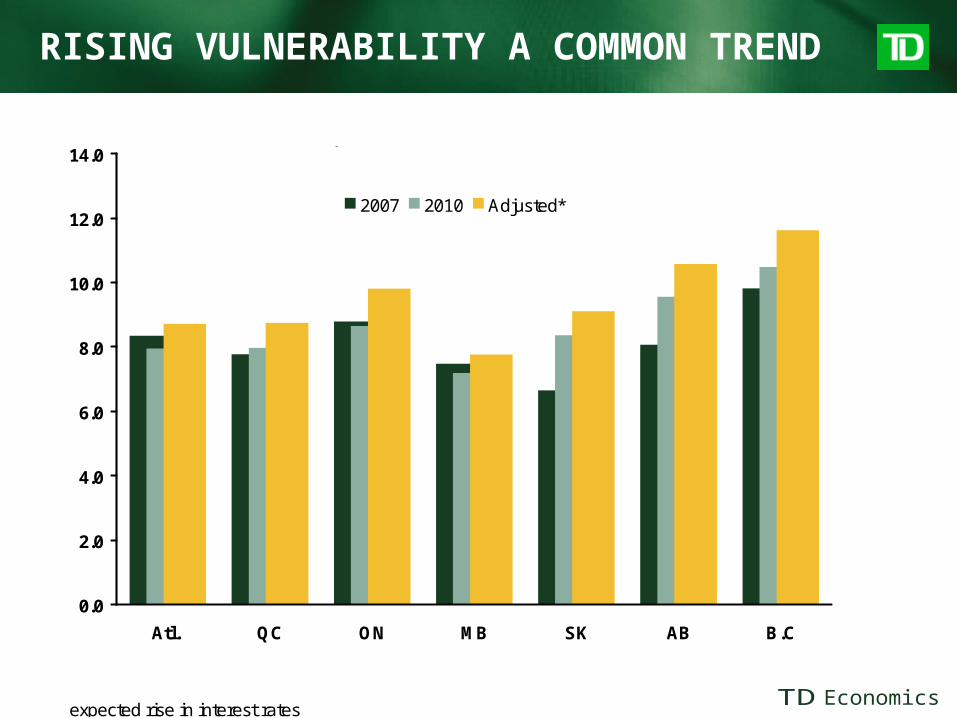
RISING VULNERABILITY A COMMON TREND
0.0
2.0
4.0
6.0
8.0
10.0
12.0
14.0
Atl. QC ON MB SK AB B.C
2007 2010 Adjusted*
TD Economics' Vulnerability Index
Source: TD Economics, Ipsos Reid, Statistics Canada, * Adjusted for the expected rise in interest rates
SOME OTHER COMMON TRENDS
Rising household debt-to-income ratio and home price-to-income ratios have been the key drivers
Debt-service ratios have been falling and remain in a comfortable range
All regions will experience a substantial increase in vulnerability in coming years
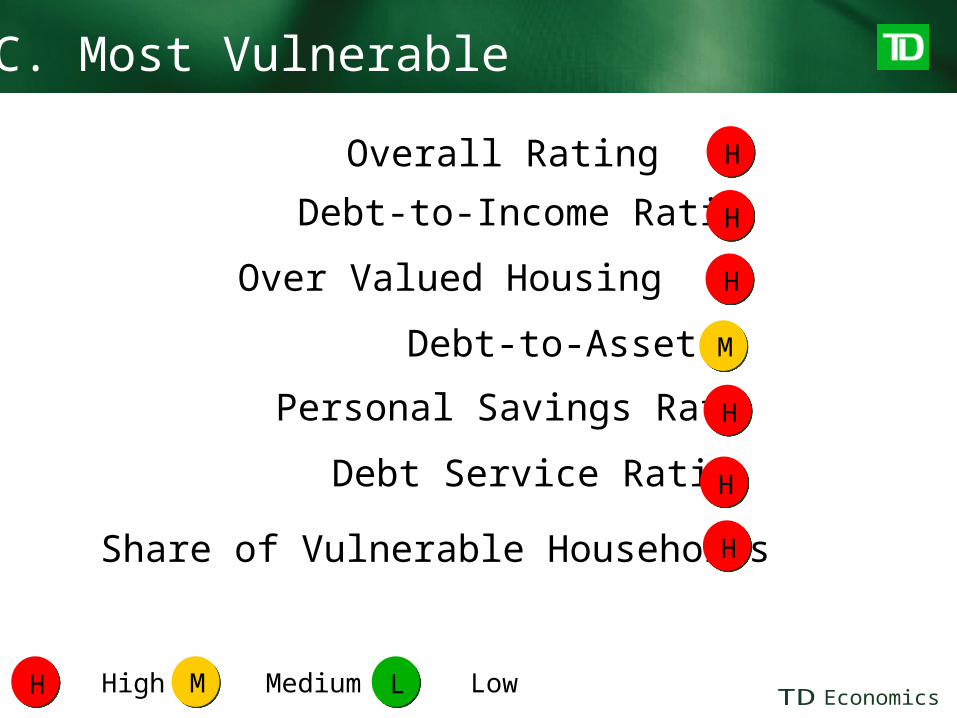
B.C. Most Vulnerable
Overall Rating
Debt-to-Income Ratio
Over Valued Housing
Debt-to-Assets
Personal Savings Rate
Debt Service Ratio
H
H
H
H
H
M
L LowM MediumH High
Share of Vulnerable Households H

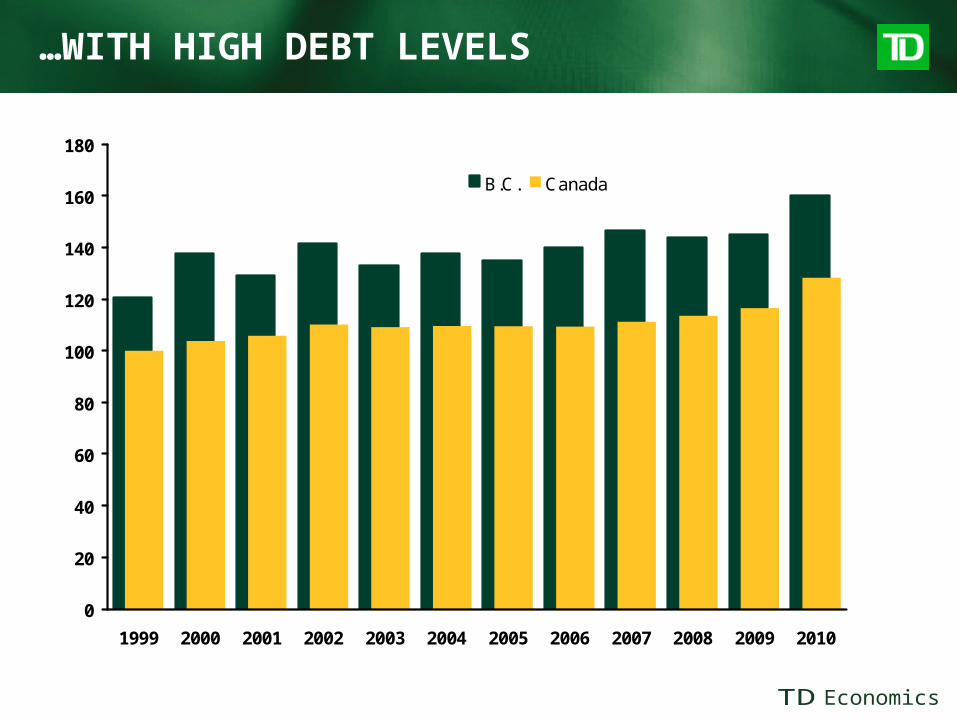
…WITH HIGH DEBT LEVELS
0
20
40
60
80
100
120
140
160
180
1999 2000 2001 2002 2003 2004 2005 2006 2007 2008 2009 2010
B.C. Canada
Household debt-to-income ratio
Source: Ipsos Reid
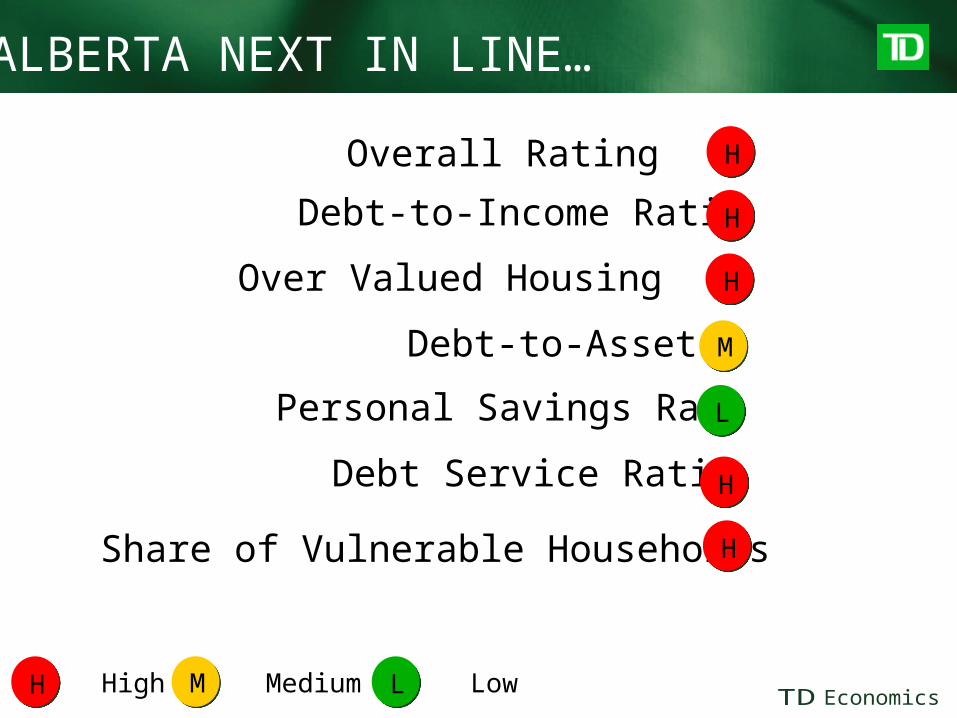
ALBERTA NEXT IN LINE…
Overall Rating
Debt-to-Income Ratio
Over Valued Housing
Debt-to-Assets
Personal Savings Rate
Debt Service Ratio
H
H
H
H
M
L LowM MediumH High
Share of Vulnerable Households H
L
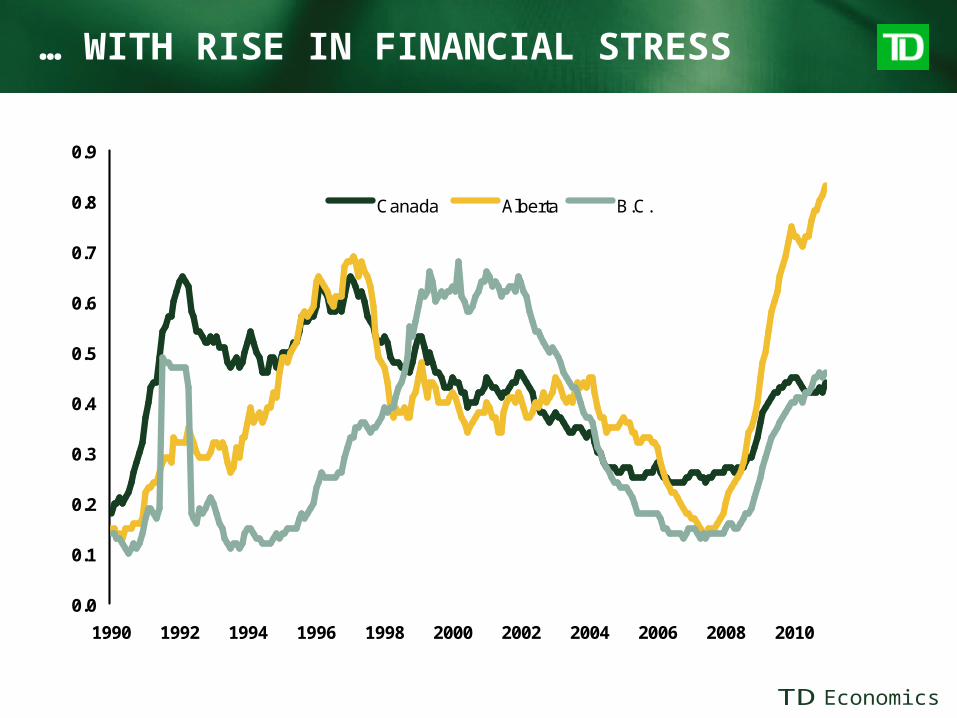
… WITH RISE IN FINANCIAL STRESS
0.0
0.1
0.2
0.3
0.4
0.5
0.6
0.7
0.8
0.9
1990 1992 1994 1996 1998 2000 2002 2004 2006 2008 2010
Canada Alberta B.C.
% of mortgages delinquent 90 days or more
Source: Canadian Banker's Association
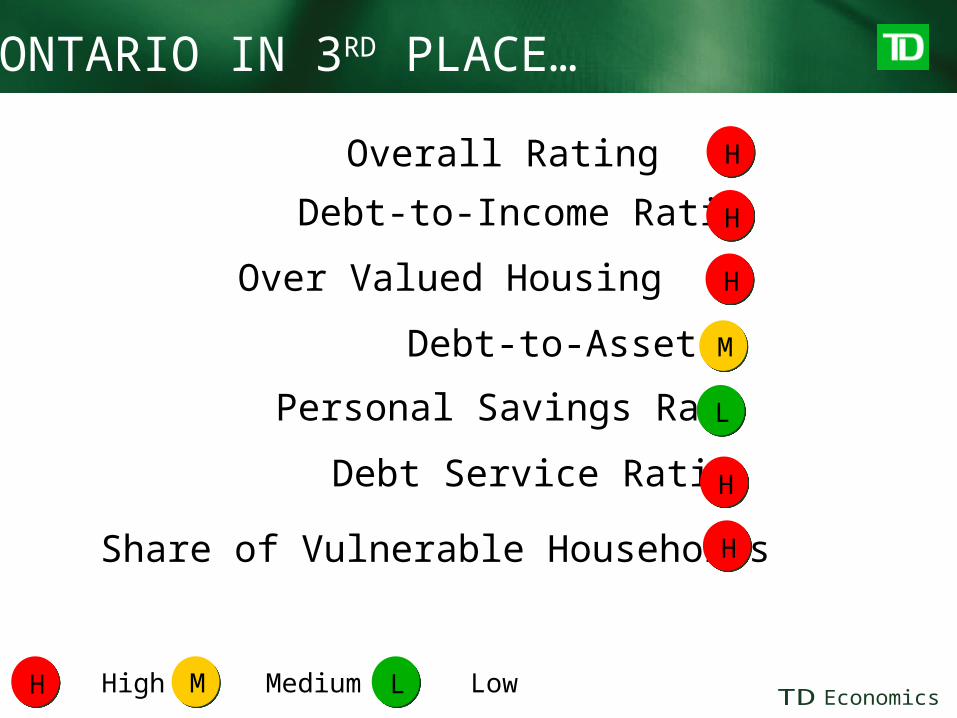
ONTARIO IN 3RD PLACE…
Overall Rating
Debt-to-Income Ratio
Over Valued Housing
Debt-to-Assets
Personal Savings Rate
Debt Service Ratio
H
H
H
H
M
L LowM MediumH High
Share of Vulnerable Households H
L
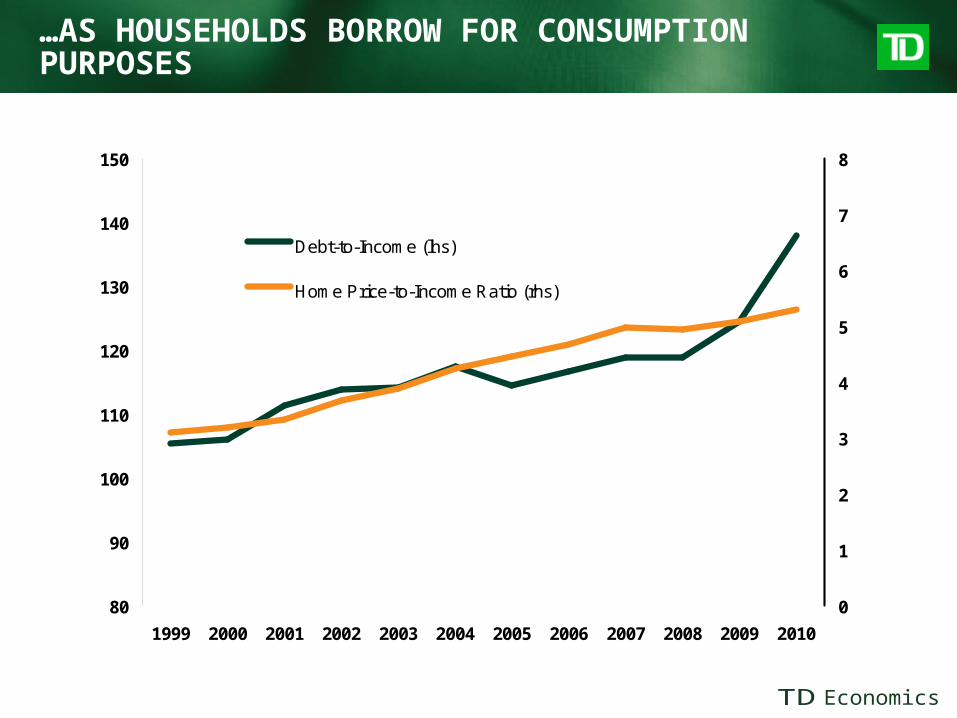
…AS HOUSEHOLDS BORROW FOR CONSUMPTION PURPOSES
80
90
100
110
120
130
140
150
1999 2000 2001 2002 2003 2004 2005 2006 2007 2008 2009 2010
0
1
2
3
4
5
6
7
8
Debt-to-Income (lhs)
Home Price-to-Income Ratio (rhs)
Source: Ipsos Reid, Statistics Canada, CREA, Haver Analytics
Ontario, % Ontario, Ratio
Overall Rating
Debt-to-Income Ratio
Over Valued Housing
Debt-to-Assets
Personal Savings Rate
Debt Service Ratio
L LowM MediumH High
Share of Vulnerable Households H
L
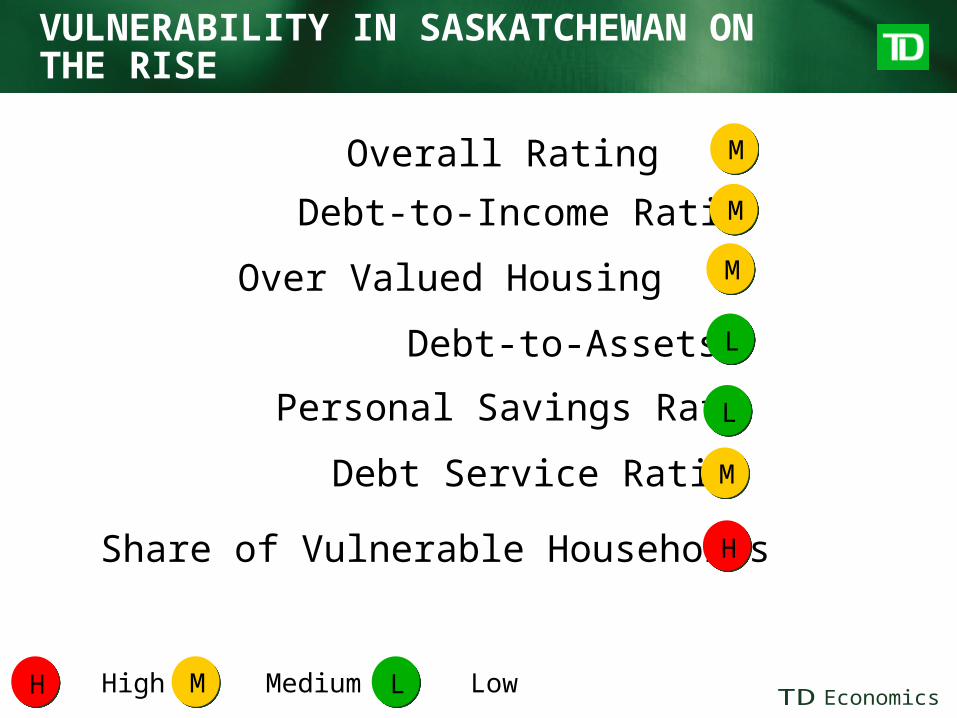
VULNERABILITY IN SASKATCHEWAN ON THE RISE
M
M
M
L
M
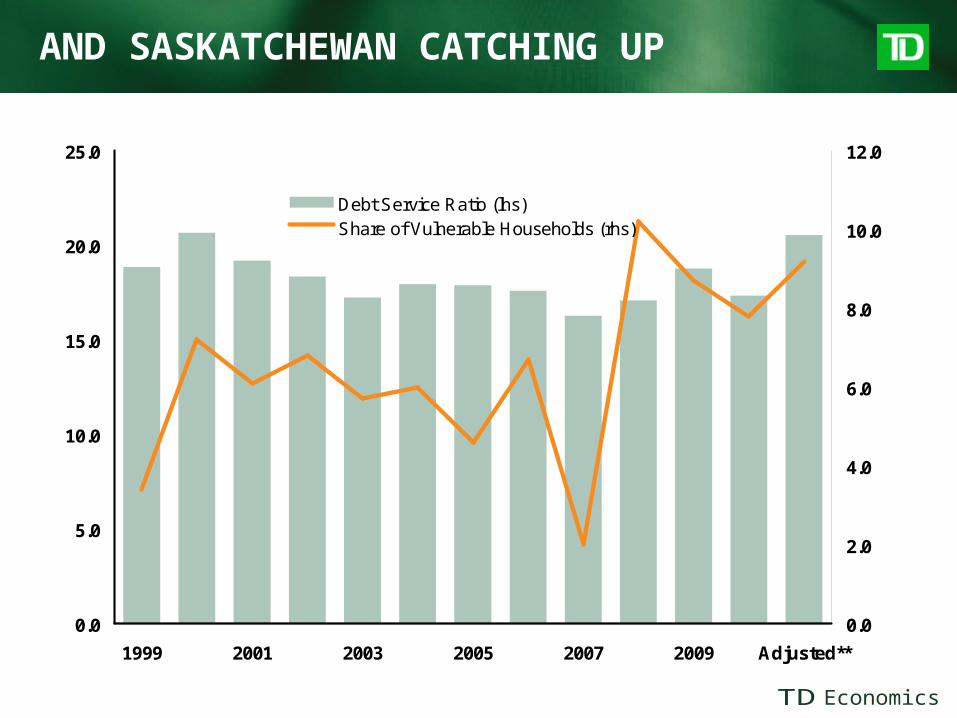
AND SASKATCHEWAN CATCHING UP
0.0
5.0
10.0
15.0
20.0
25.0
1999 2001 2003 2005 2007 2009 Adjusted**
0.0
2.0
4.0
6.0
8.0
10.0
12.0
Debt Service Ratio (lhs)Share of Vulnerable Households (rhs)
Source: Ipsos Reid, calculated by TD Economics, ** adjusted for the expected future rise in interest rates
Saskatchewan, ratio interest and debt payments to income (%)
% of households with a debt service ratio above 40% in Saskatchewan
Overall Rating
Debt-to-Income Ratio
Over Valued Housing
Debt-to-Assets
Personal Savings Rate
Debt Service Ratio
L LowM MediumH High
Share of Vulnerable Households
H
L
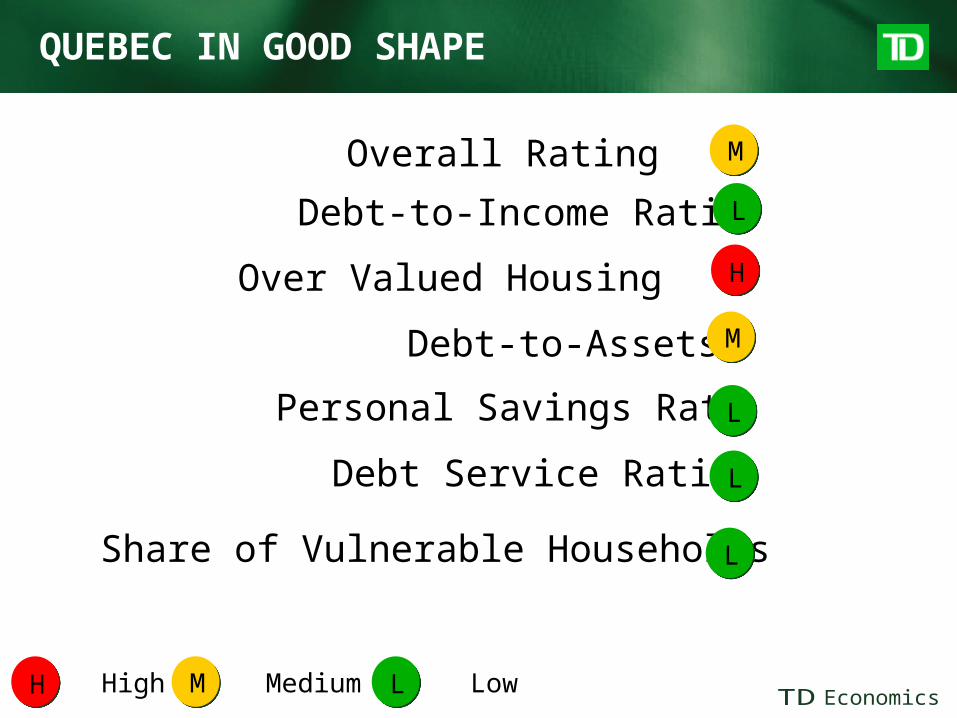
QUEBEC IN GOOD SHAPE
M
M
L
L
L
Overall Rating
Debt-to-Income Ratio
Over Valued Housing
Debt-to-Assets
Personal Savings Rate
Debt Service Ratio
L LowM MediumH High
Share of Vulnerable Households
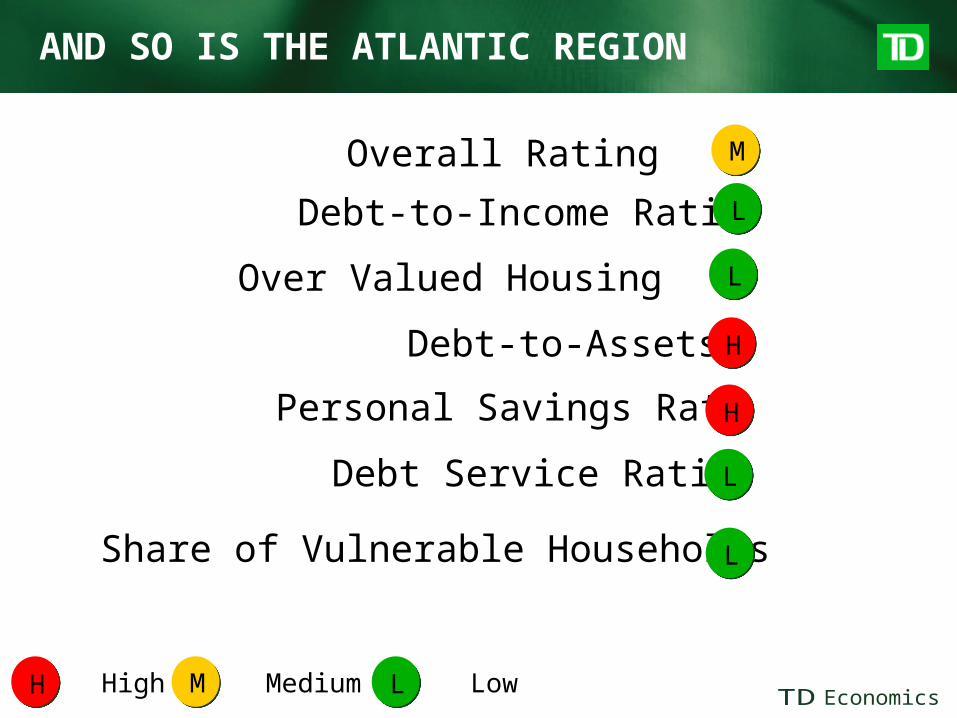
AND SO IS THE ATLANTIC REGION
M
L
L
L
L
H
H
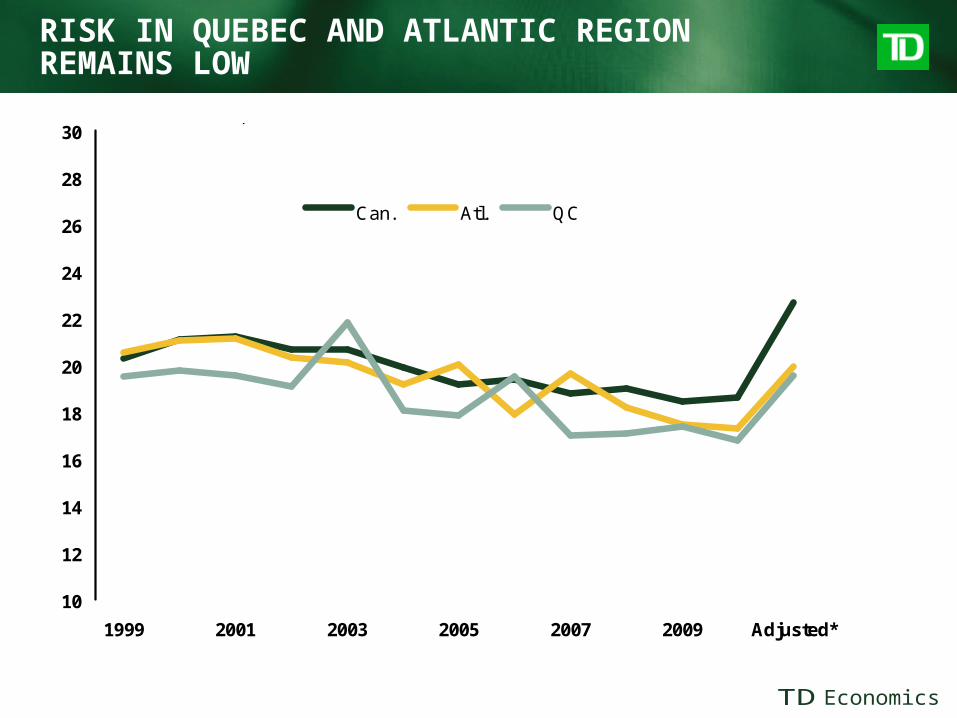
RISK IN QUEBEC AND ATLANTIC REGION REMAINS LOW
10
12
14
16
18
20
22
24
26
28
30
1999 2001 2003 2005 2007 2009 Adjusted*
Can. Atl. QC
Debt service ratio, %
Source: Ipsos Reid, * adjusted for expected future rise in interest rates by TD Economics
Overall Rating
Debt-to-Income Ratio
Over Valued Housing
Debt-to-Assets
Personal Savings Rate
Debt Service Ratio
L LowM MediumH High
Share of Vulnerable Households
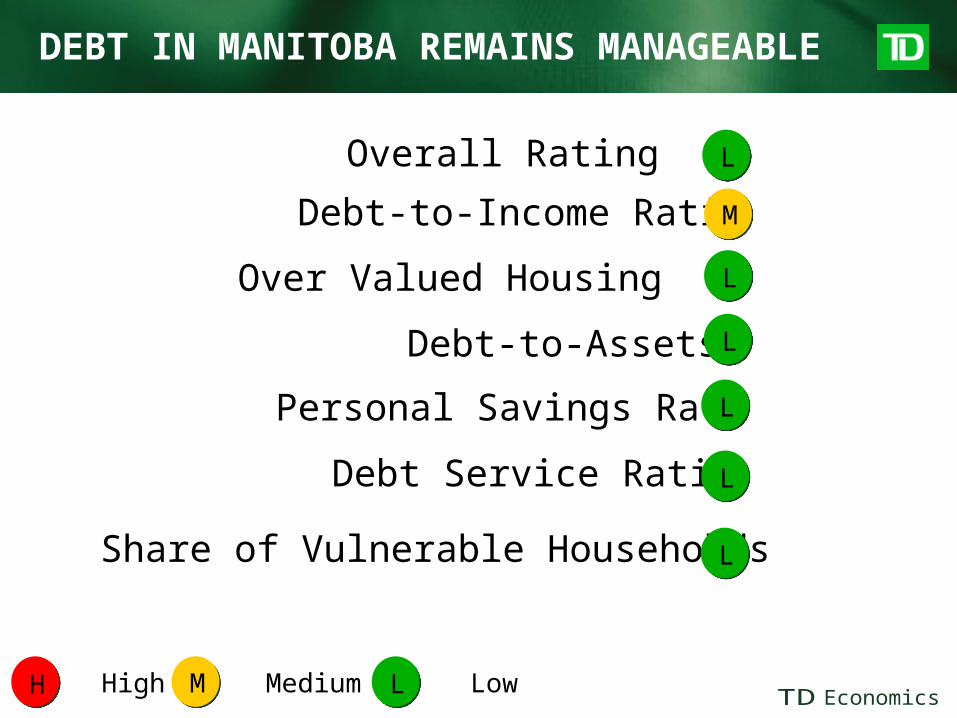
DEBT IN MANITOBA REMAINS MANAGEABLE
L
L
L
L
M
L
L

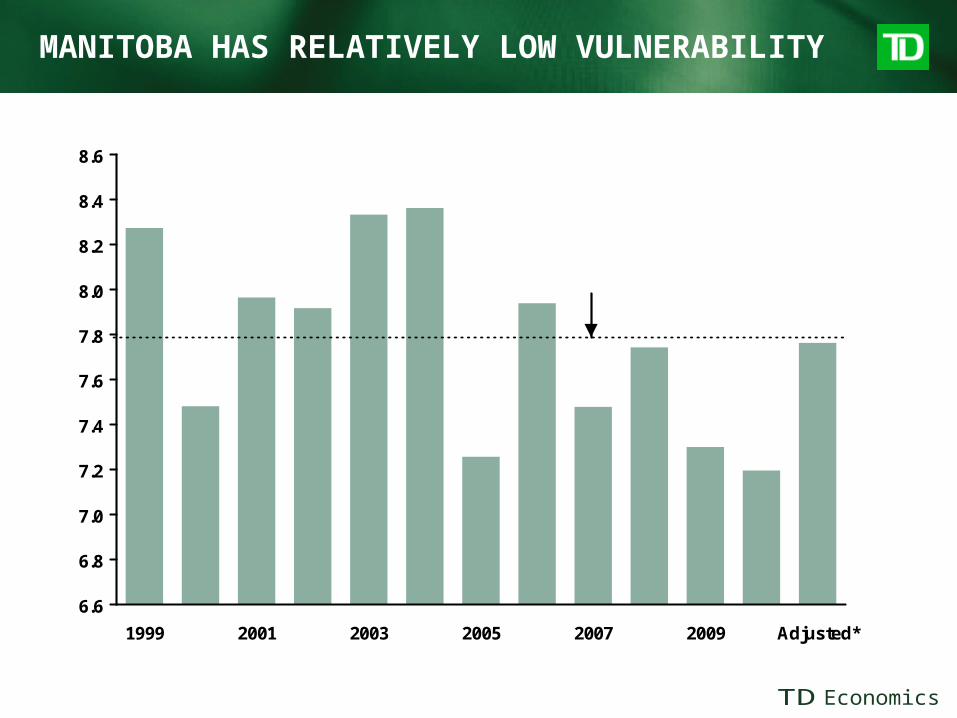
MANITOBA HAS RELATIVELY LOW VULNERABILITY
6.6
6.8
7.0
7.2
7.4
7.6
7.8
8.0
8.2
8.4
8.6
1999 2001 2003 2005 2007 2009 Adjusted*
Manitoba, Vulnerability Index
Source: Constructed by TD Economics, Ipsos Reid, * adjusted for expected future rise in interest rates
Historical Average
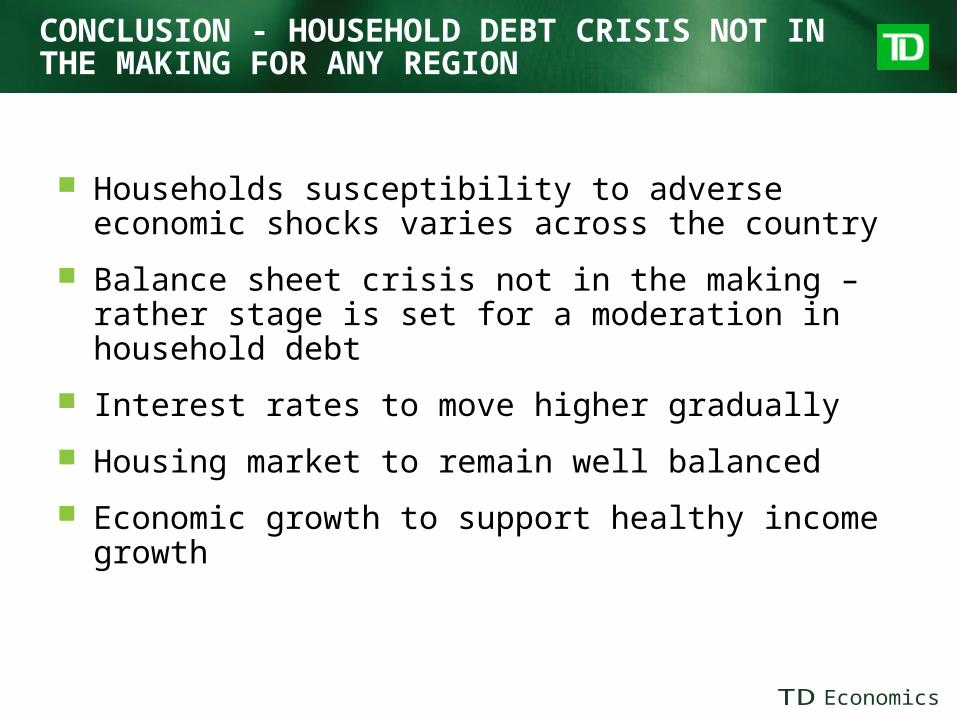
CONCLUSION - HOUSEHOLD DEBT CRISIS NOT IN THE MAKING FOR ANY REGION
Households susceptibility to adverse economic shocks varies across the country
Balance sheet crisis not in the making – rather stage is set for a moderation in household debt
Interest rates to move higher gradually
Housing market to remain well balanced
Economic growth to support healthy income growth
TD Economics
www.td.com/economics
This report is provided by TD Economics for customers of TD Bank Group. It is for information purposes only and may not be appropriate for other purposes. The report does not provide material information about the business and affairs of TD Bank Group and the members of TD Economics are not spokespersons for TD Bank Group with respect to its business and affairs. The information contained in this report has been drawn from sources believed to be reliable, but is not guaranteed to be accurate or complete. The report contains economic analysis and views, including about future economic and financial markets performance. These are based on certain assumptions and other factors, and are subject to inherent risks and uncertainties. The actual outcome may be materially different. The Toronto-Dominion Bank and its affiliates and related entities that comprise TD Bank Group are not liable for any errors or omissions in the information, analysis or views contained in this report, or for any loss or damage suffered.