Embed Size (px)
Citation preview

The importance, relevance, and revolution in our studies of a planetary climate system via the physical, and mathematical differences between a disc, a hemisphere and a sphere.
By Derek Alker.December 2010.
Dedicated to my dearly loved wife, who recently said,“that will make you famous, or get you locked up.”
I fear either, and / or both.
Most of what follows is because of the simple differences between a disc, a hemisphere, and a sphere.This centrally important issue is what I will try to expand upon,
from other peoples work that has already been done, and is widely available.Namely.
Slaying the sky dragon – death of the greenhouse gas theory.and,
Slaying the sky dragon 2 – Complementary articles and essays to the original Sky Dragon book.
by,Dr. Tim Ball, Dr. Claes Johnson, Dr Martin Hertzberg, Joseph A. Olson, Alan Siddons, Dr. Charles Anderson, Hans Schreuder, John O’Sullivan,
Miso Alkalaj, Hans Jelbring, Joe D’Aleo, Phillip Foster.Available from Amazon books at -
In the UK – http://www.amazon.co.uk/Slaying-Sky-Dragon-Greenhouse-Theory/dp/B004DNWJN6/ref=sr_1_1?ie=UTF8&qid=1290706678&sr=1-1
AND,In the USA – http://www.amazon.com/Slaying-Sky-Dragon-Greenhouse-ebook/dp/B004DNWJN6/ref=sr_1_1?amp;ie=UTF8&m=A7B2F8DUJ88VZ&s=books&qid=1290761070&sr=8-1
AND,
Solar_Flux.pdf by Joe Postma – attached to the end of this presentation. 1

In particular I would like to draw your attention to the articles and essays in the Slaying the Sky Dragon books by, Alan Siddons – His whole chapter in the first Sky Dragon book.
Hans Jelbring – Essay in the second book, Shattering the Greenhouse Effect.Joe Olson – His essays in both books.
Dr. Claes Johnson - Climate thermodynamics, Computational black body radiation essays in the first Sky Dragon book.
I hope readers would then read Joe Postma’s pdf as attached to the end of this piece.
So, where does all this leave us. ?
A disc and a sphere are obviously two different shapes,yet most planets and stars are the same shape, namely a sphere.However there is a basic difference between stars and planets,
that is commonly missed or ignored, (and frequently dismissed), where does the energy at the objects surface “come from”. ???
A star (ie, our sun) produces the energy “in house” all over it’s surface, reasonably evenly.A planet however mostly receives it’s surface energy (“surface” please see Joe Postma pdf)from an external source, usually, and in the case of earth, from only one star (ie, our sun).
Does where the energy at the planet’s or stars surface come from make a difference to how we should “view”, or rather attempt to “calculate” our planet’s climate system, or our sun’s surface temperature. ?
Yes, a massive difference.In short,
Using a “disc world” figure in the star’s case is (probably) perfectly OK, but in the planet’s case it is definitely, and completely wrong
(this will be shown and proven in this piece using very simple mathematics).The massive difference causes, and leads to, huge misconceptions, and misdirections that are
the death of the present pseudo “climate science” that is commonly referred to as AGW,or, the “theory” of “man made global warming”.
NB – AGW / Man made Global warming IS NOT A THEORY, it is an unproven hypothesis.In the rest of this piece, I will only refer to AGW “theory” CORRECTLY as a hypothesis, THAT IS unproven AND WILL BE disproven.
By the end of this piece I hope I will have shown that the mistakes in “climate science” at present are so simple, and so obvious that,
the question is actually how did this happen, and was it actually deliberate on some, if not all AGW proponents behalf.. 2

Firstly, with regards to studying a planet’s climate system, let us compare the “disc” “hemisphere”, and “sphere” methods of calculating an objects surface temperature.
What is the difference between a “disc world” figure, a hemisphere’s figures, and a sphere’s figure.Much more importantly though, why is there a difference. ?
The differences are easily explained as illustrated below.
A DISC A HEMISPHERE
From our sun
From our sun
3
From our sun
From our sun
A SPHERE
Some might think this is unphysical, I would have to agree,
but none the less this is what dividing the Power of a beam by 4
is actually doing.
Divide power of beam
by 2

4
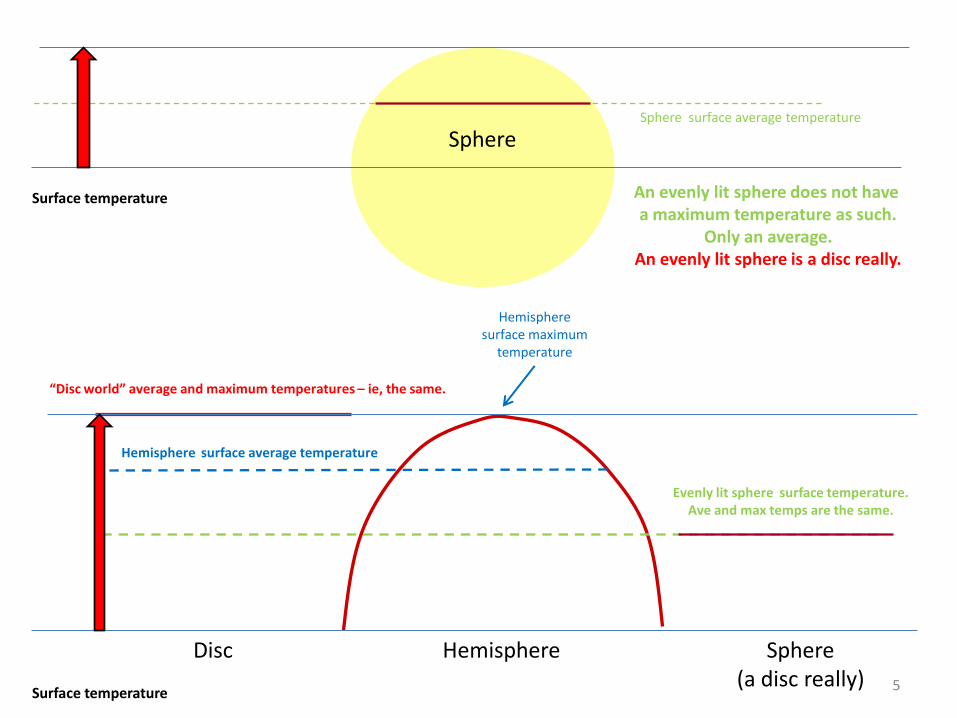
Resulting surface temperature profiles (in red), because of a single external energy source, and the curvature of a hemispheres, and sphere’s surface areas, are..
Hemisphere surface average temperature
“Disc world” average and maximum temperatures – ie, the same.
Surface temperature
Surface temperature
Disc
Hemisphere
Hemisphere surface maximum
temperature
5
Sphere surface average temperature
Evenly lit sphere surface temperature.Ave and max temps are the same.
Hemisphere surface average temperature
“Disc world” average and maximum temperatures – ie, the same.
Surface temperature
Surface temperature
Hemisphere surface maximum
temperature
Sphere
An evenly lit sphere does not have a maximum temperature as such.
Only an average.An evenly lit sphere is a disc really.
Sphere(a disc really)
HemisphereDisc

The illustrated difference between a disc, a hemisphere and a sphere is also easily expressed mathematically.
A sphere has twice the surface area of a disc (on the lit side of the sphere) of the same diameter, mathematically this is expressed as,A sphere’s lit surface area of the same diameter of THE SAME SIZED DISC = the AREA of the disc times TWO.
A common at present misinterpretation of this is that, a sphere does actually have (in total) 4 times (TIMES DISC AREA BY 4) the surface area of the same diameter disc.
The misinterpretation is very simply, HALF OF THE SPHERE IS NOT LIT.An evenly lit sphere DOES NOT HAVE A MAXIMUM TEMPERATURE, ONLY AN AVAERAGE.
These misinterpretations leads to massive errors, that are fundamental to belief in AGW pseudo science.Present computer climate models are modelled on a surface that is a perfectly flat disc of an area equal to the earth’s surface area.
This IS “disc world”, which is constantly under a one quarter solar actual strength “haze”.. There is no night in “disc world”.The “physics” used in the computer models are “supplied” by another computer software program known as MODTRAN,
which is “held” by the American navy.
The reason why the computer “disc world” is perfectly flat is that when “they” try to model hills, mountains, etc, the models produce supersonic winds, not seen in reality. There can be little faith in such “physics” but that is for a later date.
Here I will (only…) continue to try to explain the “issues” with “SHAPE” that is presently modelled in the “disc world” computer climate models and portrayed in the K&T hemisphere type energy budgets at present.
I will also have to refer to “lit hemisphere only world” that are the K&T global energy budgets. The global energy budgets are discussed at length on this thread at the GWS forum,
http://www.globalwarmingskeptics.info/forums/thread-609.htmlThese ARE the basic building blocks of the presently dominant (false) paradigm that is AGW pseudo science.
6
1) A disc maximum and average temperature are the same.2) The hemisphere maximum temperatures equal the disc average and maximum temperature, at one point only.3) Because of this, the hemisphere average temperature is lower than the disc average temperature,4) The sphere average temperature is lower than the hemisphere average temperature, because of the greater surface area.5) It is often thought the maximum temperatures for all three shapes are identical, but,a disc and sphere in this “form” do not have a maximum temperature, only an average temperature.

There are three main problem areas with the present computer modelling “disc world” and the K&T (hemisphere) global energy budgets approach to planet earth’s climate system.
1) The complete ignoring of planet earth’s permanently unlit side(hence the “disc world” and “evenly lit sphere” approaches)
This avoids “explaining” why the earth is no where near as cold as it should be (according to AGW and black body) on it’s dark side. The computer models and the K&T type plots BOTH ignore night.
2) The confused and commonly unrealised use and inappropriate mixing of “disc world”, hemisphere, and sphere average temperatures, effects, and influences.
This causes differences to be omitted, and / or included, almost all contrary to the known laws of physics. This also further “allows” the use of a mathematical “quirk” to “show” a “33 degrees greenhouse effect” that
is actually just the differences due to the difference in shapes calculated.
3) Earth’s surface is treated as a “black body” with no volume, Earth supposedly absorbs and emits all received energy within the one year time scale that K&T budgets are “calculated” over.
Earth however is undeniably a grey body with volume. And,
there is no proof of a “global radiative balance” on virtually any time scale.
I shall try to tackle all three at a rudimentary level,and offer ways forward that it would appear ARE far more reasonable.
7
The reason the K&T (hemisphere) type plots and (disc world) computer models have to be BOTH discussed,is that they are one and the same thing. Two “halves” that when added together become
the unproven hypothesis that is AGW, or rather the present false paradigm that is modern “climate science”.
Quite simply, when “shape” is mathematically incorrectly applied, then a “33 degrees” effect is created, that is actually a “quirk” of the differences between the shapes and the maths used.
This is why the “33 degrees effect” is not a physical effect that can be observed in reality.

8
1) The complete ignoring of planet earth’s unlit side by AGW “theory” – WHY.?
One of the most commonly asked questions regarding K&T global energy budgets is “Where is night. ?”
Indeed even a cursory inspection of such budgets shows there is no night represented, this quite correct question is usually “brushed off”with a reply along the lines of “We dilute the sun so it is one quarter of the sun’s actual strength over the whole global”.
As so far explained by the AGW unproven hypothesis (with the difference between discs and spheres kept in mind), this is a non-sense reply. The first reply to such AGW unproven hypothesis answers should be, “What about the under side of the disc, that is not lit. ?”
AGW unproven hypothesis will reply, “But we already have all the earth’s surface on the top side.”The reply is obvious, “Why did AGW unproven hypothesis not use a disc of half the earth’s surface area on both sides, one lit , one in dark. ?”
However, AGW unproven hypothesis times 4 “disc world” does not even begin to try to explain the real reason why the sun is diluted over the whole globe by AGW unproven hypothesis. The reason for that is surely the real question to be answered.
Looking at the K&T (hemisphere) type global energy budgets again, with fresh eyes, the reason is immediately apparent. AGW unproven hypothesis CAN NOT EXPLAIN WHY EARTH’S NIGHT TIME TEMPERATURES ARE SO WARM.
According to AGW unproven hypothesis and black body the earth’s surface temperature should be very, very cold at night , but it is not.AGW has no way to explain this, none, nothing, zip.. So, the “solution” is literally to ignore night, and hope no one notices…..
No one “officially” has.A look at some K&T type AGW unproven hypothesis global energy budgets should be illuminating, and shed light upon their “view point”.
I have chosen three different budgets to illustrate the fact that K&T type global energy budgets are based on a hemisphere type approach, or view.
This is apparent once the “greenhouse effect” depicted in each case is considered.For each plot I have calculated the temperature for solar input, and then
the temperature for solar input plus the depicted “back radiation”.Taking one from the other gives the temperature rise attributed, or depicted, for the so called ”greenhouse effect”.
The size of the depicted effect in these plots can be seen to be between 50 and 75 degrees. Nearly twice the size of the proposed “greenhouse effect” of 33 degrees.
Yet, if you add up the differences as I have for each plot there is a way that they all add up to about 33 degrees.Is that a correct sum? No,
but it is a hint that if you confuse “shapes” a 33 degrees effect is capable of being incorrectly “created”.In the end the “33 degrees effect” is due to the difference in the “shapes” calculated for,
NOT “back radiation”.

9
Disc average temp. Hemisphere average temp Sphere average temp
W/m2 Kelvin Celsius Farhenheit Kelvin Celsius Farhenheit Kelvin Celsius Farhenheit
161 230.836 -42.314 -44.166 194.109 -79.041 -110.274 163.226 -109.924 -165.864
494 305.512 32.362 90.252 256.904 -16.246 2.757 216.030 -57.120 -70.817
Disc effect depicted (K) 74.676
Hemisphere effect depicted (K) 62.795
Sphere effect depicted(K) 52.804
Disc - Sphere 21.872
Disc - Hemisphere 11.881
Sum = 33.753

10
Disc average temp. Hemisphere average temp Sphere average temp
W/m2 Kelvin Celsius Farhenheit Kelvin Celsius Farhenheit Kelvin Celsius Farhenheit
163.2 231.620 -41.530 -42.753 194.769 -78.381 -109.086 163.780 -109.370 -164.865
503.2 306.925 33.775 92.794 258.092 -15.058 4.895 217.028 -56.122 -69.019
Disc effect depicted (K) 75.304
Hemisphere effect depicted (K) 63.323
Sphere effect depicted(K) 53.248
Disc - Sphere 22.056
Disc - Hemisphere 11.981
Sum = 34.037

11
Disc average temp. Hemisphere average temp Sphere average temp
W/m2 Kelvin Celsius Farhenheit Kelvin Celsius Farhenheit Kelvin Celsius Farhenheit
168 233.305 -39.845 -39.721 196.185 -76.965 -106.537 164.971 -108.179 -162.721
492 305.202 32.052 89.694 256.644 -16.506 2.288 215.811 -57.339 -71.211
Disc effect depicted (K) 71.897
Hemisphere effect depicted (K) 60.458
Sphere effect depicted(K) 50.839
Disc - Sphere 21.058
Disc - Hemisphere 11.439
Sum = 32.497

Immediately apparent questions.1) “Where is night. ?”2) Net absorbed 0.9 Wm-2. “Absorbed by what, ( and, for how long, presumably longer than a year). ?”
To take this line of questioning a little further, “disc world” is literally 2 dimensional, as it ignores the underside of “disc world”.Unfortunately for AGW unproven hypothesis 2 dimensional is impossible in this scenario.
Unless the object is a star, or evenly heated all over…The least number of dimensions “disc world” could possibly use because the sphere is only half lit, is 3 dimensions
(length and breadth, and top and bottom), but AGW unproven hypothesis steadfastly adheres against reality to a 2 dimensional approach., length and breadth ONLY.
This is plainly unphysical, disconnected from reality in any meaningful way, and not a little ridiculous, but that is the (absurd) reality of AGW “theory”. THE REASON for this “adherence” by AGW to this “type” of approach is
the misuse of “shape” to create a “33 degrees effect” as will be illustrated again more clearly later on in this piece. 12

Next, we should try to see what AGW unproven hypothesis says the night time temperature of planet earth should be. I have looked and asked questions in many places, but so far, AGW unproven hypothesis has not given an answer to this question.
The main reason for this quite obvious omission, is that if AGW unproven hypothesis attempts to answer the question it will self implode, in a circle of self defeating “arguments”.. Or rather have to give the “game” away, by admitting it’s misuse of “shape”.
According to AGW unproven hypothesis and black body then the night time temperatures at earth’s surface should be roughly….
Absolute zero + 3K space background warming + 33 degrees “greenhouse effect” = MINUS TWO HUNDRED AND THIRTY SEVEN DEGREES CELSIUS.
0 Kelvin + 3 Kelvin + 33 Kelvin = 36 degrees Kelvin.
Why, because AGW “theory” ignores surface heating, retention, and varying later release of absorbed energy by, at , on, and under the earth’s surface (earth is a grey body, not a black body).
If surface heating, retention, and varying later release is quite rightly (mostly) used to explain why earth is so warm at night (and “cool” during the day), then the permanent daytime (or rather haze) AGW unproven hypothesis falls apart, as do the global energy budgets, and
any ideas of some sort of thermal or radiative “balance”. This is WHY AGW avoids at all costs attempting to explain earth’s n ight time temperatures. The same problem/s “reversed” also apply to daytime temperatures at earth’s surface, the anomaly isn’t as large as it is at night, but the earth’s surface is cooler than it should be according to AGW unproven hypothesis during the day (Please see my daily water
jacket plot in part 3) for a diagrammatic version of this night and day time anomaly AGW unproven hypothesis does not explain).AGW unproven hypothesis has ignored the problem completely of explaining night time temperatures upon earth that are simply too
warm, and daytime temperatures that are simply too cool, appearing to be forlornly hoping the questions will go away.. They will not just “go away”, when the reasons to ask them are so obviously depicted by the “hemisphere” K&T type global energy budgets themselves, and
modelled by the “disc world” computer climate models.
These questions are “merely” good scientific sceptical questioning, as science demands any science should always do of itself. The last thing these questions should do is “go away”, these questions DEMAND answering. That is the way of good science, like it or not, whether it be convenient or beneficial or not.
Indeed, regardless of whether the answers to the questions show the hypothesis to be proved, or disproved.
13
14
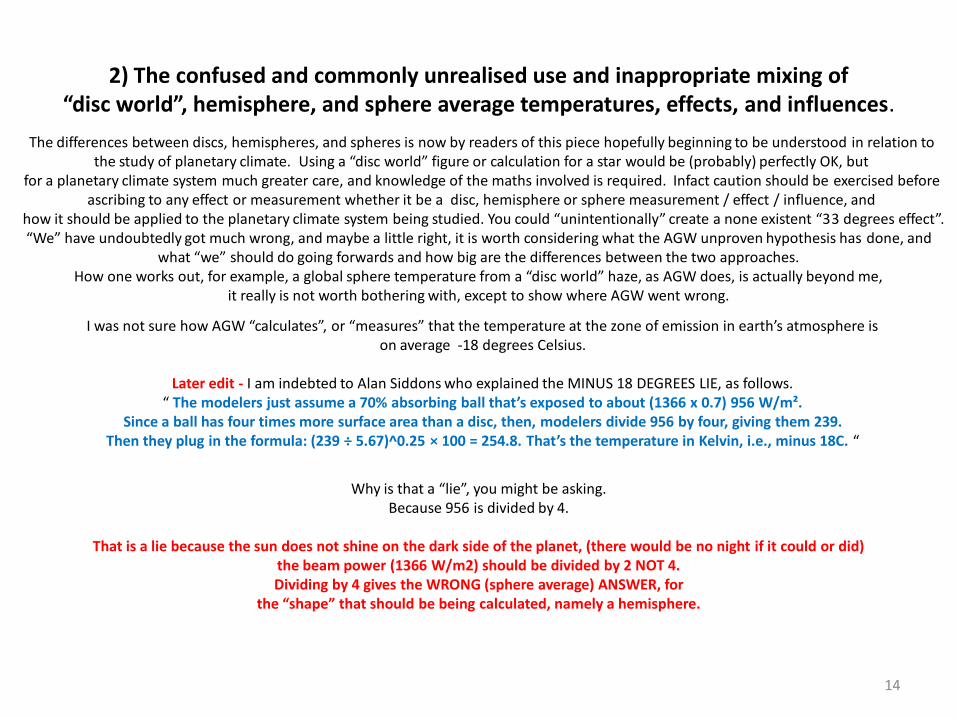
2) The confused and commonly unrealised use and inappropriate mixing of “disc world”, hemisphere, and sphere average temperatures, effects, and influences.
The differences between discs, hemispheres, and spheres is now by readers of this piece hopefully beginning to be understood in relation to the study of planetary climate. Using a “disc world” figure or calculation for a star would be (probably) perfectly OK, but
for a planetary climate system much greater care, and knowledge of the maths involved is required. Infact caution should be exercised before ascribing to any effect or measurement whether it be a disc, hemisphere or sphere measurement / effect / influence, and
how it should be applied to the planetary climate system being studied. You could “unintentionally” create a none existent “33 degrees effect”.“We” have undoubtedly got much wrong, and maybe a little right, it is worth considering what the AGW unproven hypothesis has done, and
what “we” should do going forwards and how big are the differences between the two approaches. How one works out, for example, a global sphere temperature from a “disc world” haze, as AGW does, is actually beyond me,
it really is not worth bothering with, except to show where AGW went wrong.
I was not sure how AGW “calculates”, or “measures” that the temperature at the zone of emission in earth’s atmosphere is on average -18 degrees Celsius.
Later edit - I am indebted to Alan Siddons who explained the MINUS 18 DEGREES LIE, as follows.“ The modelers just assume a 70% absorbing ball that’s exposed to about (1366 x 0.7) 956 W/m².
Since a ball has four times more surface area than a disc, then, modelers divide 956 by four, giving them 239. Then they plug in the formula: (239 ÷ 5.67)^0.25 × 100 = 254.8. That’s the temperature in Kelvin, i.e., minus 18C. “
Why is that a “lie”, you might be asking. Because 956 is divided by 4.
That is a lie because the sun does not shine on the dark side of the planet, (there would be no night if it could or did)the beam power (1366 W/m2) should be divided by 2 NOT 4.Dividing by 4 gives the WRONG (sphere average) ANSWER, for
the “shape” that should be being calculated, namely a hemisphere.

15
From our sun
From our sun
A SPHERE
Some might think this is unphysical, I would have to agree,
but none the less this is what dividing the Power of a beam by 4
is actually doing.
The below diagram is my attempt to illustrate the divide by 4 lie used to calculate Minus 18.33C.
Whilst using the formula (Power of beam W/m2/2 ÷ 5.67)^0.25 × 100 = Degrees Kelvin to calculate a hemisphere’s average temperature I could not get the correct maximum temperature for a hemisphere by multiplying the average temperature by the square root of two,
as is done for a sphere average temperature. (Which I think is incorrect because when P is divided by more than two, there must be more than one source for P for a sphere
– which is why it is physically impossible, and mathematically incorrect to divide P by more than 2 for 1 source of P with regard to our planet’s climate – there is only one sun in the solar system).
I realised however to calculate the maximum temperature for a hemisphere you must multiply the Hemisphere average temperature by the square root of the square root of two (SQRT OF TWO = 1.414213).
ie, Hemisphere average temperature x SQRT(SQRT2) = Hemisphere maximum. When you change the number P is divided by, you must also change the number to calculate the maximum temperature with.
In the case of a sphere you can not divide by four with only one source of P, so the only reasonable interpretation is that by dividing by four you are calculating for a disc, so the average and maximum temperatures are the same.No calculation, or multiplication by the square root of two is required. Indeed it would be wrong to do so.

16
The Minus 18.33 degrees “measurement” lie led me to look into the differences between a disc, a hemisphere, and a sphere more closely.Because of that, I have realised just some of the problems with the physically impossible maths of the AGW unproven hypothesis.
Before I continue however it is useful to put the Minus 18.33 degrees lie into a more real world context. “If” -18.33 degrees Celsius (C) is compared to a (near) surface temperature of about 15C, then what are we “comparing”
to get our mythical 33 degrees “Greenhouse Effect”. The minus18.33C temperature refers to a “surface” that absorbs 70% of incoming solar radiation. That is NOT the earth’s land and ocean surfaces. It is generally quoted and seemingly agreed that
a good approximation for the earth’s actual land and ocean surface received energy is, P x 0.7 x 0.67, a far smaller figure. Minus 18.33C refers to a layer higher in the atmosphere
(earth’s radiative surface as seen from space - Please see Joe Postma’s attached pdf) than the actual earth’s land and ocean surface.
I also considered the ideal gas law and gravity effect within the planet’s atmosphere, because it does not seem to appear in the K&T global energy budgets. This puzzled me and incorrectly I at first thought, minus18C at about 4 to 5 Kilometres altitude,
with a 40C increase to ground level because of the ideal gas law and gravity equals a 22C surface temperature. I then compounded my mistake by thinking that was a maximum temperature and divided it by the square root of two
to get a surface temperature of 15C, AND a 33 degrees “effect”.This seemed the right answer so presumably it was the right way to calculate the sums.
I LATER REALISED I WAS WRONG REGARDLESS OF WHETHER THE ANSWER APPEARED TO BE “RIGHT” OR NOT.
There is undoubtedly an ideal gas law and gravity effect upon atmospheric temperature, but I think it merely raises the possiblelower temperature limit, that is probably all. So, why mention something that is not in the K&T global energy budgets, and
most probably should not be in the global energy budgets. My described calculating mistake above shows how easy it is to confuse,and then incorrectly apply disc and sphere figures, with inappropriate corrections that produce the wrong answer, that seems “correct”.
I will show later in this piece using excel that there are many, many different ways to miscalculate a “33 degrees effect” when,it is not realised that disc, hemisphere, and sphere (that are disc) figures are incorrectly applied, or calculated.
Realising my mistake above, made me realise (yet again) how easy it is to miscalculate a “33 degrees effect”, that appears to be correct.

17
The often quoted 15C surface temperature is also somewhat misleading. This refers to the near surface temperature, usually measured at about six foot above the ground. The actual surface temperature is a different thing altogether,
from the actual surface it will 1) radiate (a little – “limited” by Planck’s Law), 2) conduct and convect to the air some, 3) loose some by the latent heat of water vapourisation, AND 4) some will be absorbed into the surface’s volume to released at a later time at varying rates and time scales.
Using near surface temperature is HOW the AGW unproven hypothesis ignored and dismissed surface heat retention and varying later release, which undeniably does happen on a grey body.
Near surface temperature also “ignores” latent heat of water vapourisation movements, which is in my estimation THE way in which most energy is moved within planet earth’s climate system.
Considering these, which are just some of the possibilities it will become immediately apparent that not all the energy movements fromthe earth’s land and ocean surfaces will show up in measurements taken six foot above the ground, in a limited and varying number of
locations. Very few of which are over the oceans, which are after all 70% of earth’s surface area. The Pacific ocean alone is 50% of the earth’s surface area, with how many (near surface) temperature measuring stations – errr, not many.
Is it any surprise that the ARGO buoys measurements are giving the “wrong” answers and are seemingly being “dismissed” by AGW unproven hypothesis proponents.
So, we are left with a Minus 18.33 C figure that is calculated incorrectly, and can not apply to the dark side of the planet,which we “compare” to a surface temperature, that is NOT the surface temperature.
Having miscalculated the figures, and ignored surface heat retention, “we” can then compare the two figures and get a “33 degrees Greenhouse Effect” that does not exist.
It is worth mentioning in passing that whilst following this line of thought I also tried to calculate the often quoted, and generally accepted W/m2 input from space for the 3 degrees Kelvin background warming. I was doing this to try to look at the dark side of the planet
in regards to the Minus 18.33C lie. Using the formula (Power of beam W/m2 ÷ 5.67)^0.25 × 100 = Degrees Kelvin it appears virtually impossible to calculate the W/m2 rate for the back ground warming from space. I can find a step increase
between 0.15 and 0.2 W/m2 that does give an answer of 3.007 K, but that is not the same thing. At present I am unsure if this related to the recently very little reported but covered in the Sky Dragon book problems with Planck’s Law calculations that Dr. Claes Johnson has
been doing such great work in regards of. As Planck’s Law refers to emissions, then I think there must be a link, but it is beyond my available time and abilities to look at. I am fairly certain in my own mind that this matter will be raised by others soon enough though…

18
Returning to the use correctly or incorrectly of “shapes” within formulas, and their relevance to our studies of planetary climate,using the formula: (Power of beam W/m2 ÷ 5.67)^0.25 × 100 = Degrees Kelvin in Excel I calculated the resulting surface temperatures. I calculated for a single external source covering a Power (P) range of 1 to 2000 W/m2, the resulting surface temperatures, for a disc,
for a hemisphere (Divide P by 2), and for a (YES, this is physically impossible, but..) sphere (Divide P by 4). I then plotted the results as shown below.
There is an accompanying excel sheet to this pdf, but you can easily make your own, you will get the same figures. To make your own excel sheet apply the formula (Power of beam in W/m2 ÷ 5.67)^0.25 × 100 = Degrees Kelvin to a range from
1 to 2000 W/m2, then repeat but divide P by 2, and then repeat but instead dividing P by 4. You will have three columns, Disc, Hemisphere, and Sphere average surface temperatures.
To create the following plot as well, simply follow the instructions in the descriptions of what is plotted in the legend at the bottom of the following plot. Someone with better maths training than myself (CSE Grade 1 only…)
will no doubt explain better soon enough though – or maybe they will think better of it and preserve their career and pension.I have neither to preserve however.
19
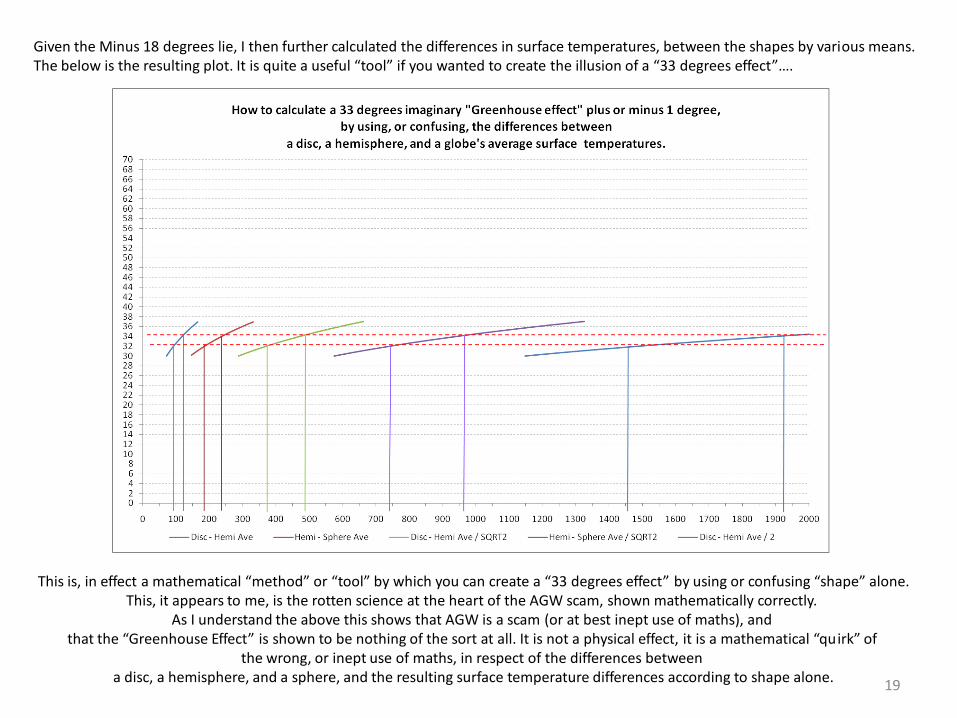
Given the Minus 18 degrees lie, I then further calculated the differences in surface temperatures, between the shapes by various means.The below is the resulting plot. It is quite a useful “tool” if you wanted to create the illusion of a “33 degrees effect”….
This is, in effect a mathematical “method” or “tool” by which you can create a “33 degrees effect” by using or confusing “shape” alone.This, it appears to me, is the rotten science at the heart of the AGW scam, shown mathematically correctly.
As I understand the above this shows that AGW is a scam (or at best inept use of maths), and that the “Greenhouse Effect” is shown to be nothing of the sort at all. It is not a physical effect, it is a mathematical “qu irk” of
the wrong, or inept use of maths, in respect of the differences between a disc, a hemisphere, and a sphere, and the resulting surface temperature differences according to shape alone.

20
If the previous two plots are correct, then there is the distinct possibility that about 20 to 30 years of “climate science” will have to be put in the bin, as it is WRONG, and therefore useless.
I have said over the last year or so on many occasions, and it is worth repeating in this piece now, the following.
So called main stream and respected “climate skeptics” should stop, wasting their and our time by
merely quibbling the figures of AGW pseudo science.
Actual (scientific) skeptics should be questioning the principles of AGW.
There are many other effects / influences / measurements that appear to be either ignored or incorrectly applied by the AGW unproven hypothesis and it’s proponents, for example, geothermal inputs on a constant “disc world” basis are
always dismissed as too small, when the answer is actually unknown.Ask any volcanologist how many volcanoes are there on this planet’s surface
(remember the answer MUST include underwater volcanoes)?Then ask how many of these volcanoes are active at present?
Also the volcanologist should be asked what is the daily or constant (due to lunar influences) geothermal energy (or heat if you prefer)input to the planet’s climate system?
The answer to these questions (particularly the last) is the same.We simply do not know.
There are many more measurements / effects / influences that need to be looked at, looked at afresh, and checked over,the most obvious being surface heating, retention, and varying later release, which is Part 3.

3) Earth’s surface is treated as a “black body” with no volume, Earth is however a grey body with volume.
That the earth has a surface (land and water) and this absorbs solar input, and later gives this heat or energy up to the atmosphere is beyond reasonable doubt. How the earth’s surface does this, and over what time scale is a subject area of much controversy though.
I find this controversy somewhat difficult to understand. Earth is a grey body, because it has volume, a black body does not have volume, simply that is the end of “the controversy”.Treat earth’s surface in K&T diagrams and computer climate models AS A GREY BODY capable of absorbing, retaining and
at varying rates over varying time scales of later release, and much will be learnt. It really is THAT SIMPLE.
But “NO” AGW disproven hypothesis refuses to treat earth’s surface as a grey body (see K&T type plots), why. ?This is all the more curious a position for AGW to adopt, when the whole alarmist position of AGW is based upon the “proof” o f
a 0.9 Wm-2 absorption of energy at the earth’s surface. Where. ? When. ? By What. ? For how long. ? AGW disproven hypothesis answers none of these questions, yet then when required, magically has the surface that does not absorb,
suddenly it absorbs 0.9 Wm-2 for over a year. Presumably this absorption must accumulate over time with no losses….AND MAGICALLY AT THE SAME TIME THE ABSORBED ENERGY TURNS UP IN GLOBAL ATMOSPHERIC TEMPERATURES,
WHERE IT IS NOT.BECAUSE ACCORDING TO AGW disproven hypothesis IT WAS ABSORBED (specifically “Net absorbed”)
BY THE EARTH’S SURFACE (oceans implied by K&T type plots but not actually specified).. ?Interestingly the oceanic ARGO buoy measurement system has shown oceanic surface temperatures falling over recent years…..
http://www.ncasi.org/publications/Detail.aspx?id=3152
21
Whilst considering the surface heating issue, I was one night running a bath, as I watched the steam rise from the bath water, and felt it heat the room, I realised, that if you run a hot bath, you undeniably get a hotter bath room.
The hot water heats the air within the bathroom considerably (I have since tested the reverse, and confirmed if you run a cold bath you get a colder bathroom as well).
On a planet that is 71% covered by oceans that are on average 4 kilometres deep, and heated constantly (on the lit side of the planet only of course..) by the sun, this is an effect that can not be ignored, nor dismissed.
I have diagrammatically represented this by the below “Daily water jacket” plot.

22

What does the above “daily water jacket” plot show. ? It shows that on the lit side of the planet, much of the solar input that reaches the earth’s surface is absorbed by the oceans. On a rotating planet, the warmed water (and land surfaces) then get the opportunity to release some of their absorbed energy on the dark side of the planet as it rotates. In short, surface heating, retention, and varying later release, and
rates and times of release are both large enough, and powerful enough to largely (and easily) explain the surface temperature anomalies actually observed on the earth’s surface that are so much larger than a AGW / black body approach would suggest is the case.
Furthermore, as briefly touched upon already, the AGW disproven hypothesis can not explain these, that are actually huge, differences.
The “daily water jacket” plot has received little attention (it has been around now for a couple of years), I would suggest because once the questions it raises are realised,
the fact there is no answer from AGW / black body is immediately realised, so the plot HAS TO BE ignored. I assume it is hoped the plot will just “go away”…
Like the unexplained night and day time anomalies, the plot, and the questions it raises, and, the difference in the actual as compared to AGW / black body “theorised” temperatures,
WILL NOT JUST “GO AWAY”.
The truth of the “climate debate” matter is simple, the climate system of planet earth is far more complicated than a “disc world” approachcould ever, possibly hope to achieve. The present paradigm (in AGW pseudo climate science) is plainly
insufficient, grossly misrepresents, and misleads.
I will finish on two more similes I have used before to compare / show the way energy is moved within our planet’s climate system.According to AGW pseudo science in it’s present black body / “disc world” “paradigm”,
thermal radiation movements dominate within the climate system. This is shown quite plainly in the K&T global energy budgets as depicted in the plot in 1) above.
This simply goes completely against virtually all every day observations we can make for ourselves. For example, Please imagine yourself scantily dressed in an open field, on a sunny, and pleasant day. You would feel the solar input warming your skin,
maybe even getting a sun tan in the process (not too long mind, we don’t want you getting or risking getting skin cancer). Your body temperature will rise, and you will feel warmer.
Ask yourself, how much heat am I losing by radiating thermal energy. Not much actually, but if you like, you could work out a reasonably close, but rough figure by using Planck’s law.
In the meantime your temperature will rise further, you may notice heat rising from your body, just like a heat haze on the roads.This is conduction of heat from your body’s surface to the surrounding cooler air. This is far more powerful than radiation loses.
23

But, again, this will not be enough, a nice cooling breeze will help tremendously. Increasing conduction and convection loses has a considerable effect. Increasing loses noticeably.
So, it is immediately apparent that conduction and convection is not “fixed” by temperature as radiation loses are, and that conduction and convection can vary considerably, over many time and space scales.
Now we come to the “daddy”, if the air is still, then your temperature would increase further, so,radiation, and conduction and convection loses would not be enough. What would you do. ?
Sweat (alternatively an assistant could throw a [warmed to your body temperature] bucket of water over you).
As sweat (or water) vaporises you are cooled, and cooled greatly, once you start sweating (or become damp all over) you will notice any, even small breezes, if it gets windy, you will soon feel cold.
Vaporisation of water is an endothermic process, it requires heat (or rather energy). This is the removal of heat from you that is required to vaporise water (your cooled).
In short, the latent heat of water vaporisation, which is commonly referred to as evaporation. This is by far the most powerful, and rapid way in which large amounts of energy are moved around within the climate system,
Because when air containing water vapour is cooled sufficiently the water vapour condenses (exothermically – a process that releases heat)your sweat is now water again, and eventually (within 11 days on average for the water cycle) it may fall
upon someone else’s head as rain, but probably not… Maybe even your own head, “Funny, I can’t remember sweating that a week last Tuesday”…
In short, solar input comes into planet earth’s climate system as short wave radiation, if absorbed at the earth’s surface it is most likely conducted or convected aloft (possibly some time later) by sensible heat or by the latent heat contained within water vapour.
The latent heat of water vapour is released at altitude (by condensation of water) in the atmosphere, where it can escape to space by long wave thermal radiation.
At present the AGW “theory” states that radiation dominates all parts of our planet’s climate system, this by various means, is a false representation of what we can observe actually happens.
Yes, a major part of the earth’s surface received input IS solar short wave radiation, and Yes, energy can only escape from this planet’s climate system by long wave thermal radiation, but
does that necessarily dictate movements within the system MUST BE DOMINATED by radiation.
No, as simple observation shows, the latent heat of water vaporisation (as every cloud in the sky attests to) is the dominant force within this planets climate system.
24

Question, have you ever looked at a thermal camera picture of a greenhouse and it’s surroundings. ?
The greenhouse will be warmer than it’s surroundings, so it will be a brighter image than it’s surroundings.AGW “theory” says the greenhouse is warmer because it traps radiation, YET the thermal image will clearly show beyond doubt that
the greenhouse IS radiating MORE than it’s surroundings (with the same solar input).What does this show. ?
It shows whatever is cooling the surroundings is far more powerful than radiation, ANDthat it is not radiation doing most of the cooling
(otherwise the higher radiating greenhouse would be cooler than it’s surroundings).
If one opened the doors and windows in the greenhouse, especially on a breezy day, the greenhouse would soon reduce it’s temperature to that of it’s surroundings. Logically the temperature difference was removed from the greenhouse to the surroundings or aloft by air.
Air transporting sensible, and latent heat (of water vapourisation), I would suggest.
When the doors and windows are closed it logically follows that the increase in temperature inside the greenhouse is due to the reduced transport of sensible and latent heat (of water vapourisation) from inside the greenhouse to the surroundings.
Obviously even with the doors and windows of the greenhouse are shut, some conduction and convection at the greenhouse glasssurfaces occurs, and this explains why a greenhouse remains warmer than it’s surroundings for some time after sunset.
Hopefully this has illustrated that a greenhouse works by reducing conduction and convection, NOT by “trapping” radiation, as AGW pseudo climate science, “physics”, and “theory” suggest.
Another obvious point, commonly misinterpreted regarding AGW “theory”, warmer cloudy nights show that clouds “back radiate” energy to the earth’s surface.
On a clear night there is nothing to stop conduction and convection of heat from the earth’s surface to space (even the mythical properties attributed to CO2 in an open and mixed atmosphere).
On a cloudy night clouds act as a blanket REDUCING convection. Heat (energy) released at the earth’s surface simply hangs around for longer, or convects slower,
because of reduced convection, due to the presence of clouds aloft.There is no need to “employ” imaginary “back radiation” from clouds (that SUPPOSEDLY reaches the earth’s surface),
as the AGW disproven hypothesis does.Reduced convection due to the presence of clouds alone simply explains what we observe.
25

26
Happy Christmas 2010 to everyone.
With special thanks to everyone who has ever helped me in regards to, and with,
my skeptical enquiries of what is undeniably the
pseudo science of AGW.
Yours,Derek Alker.
BA (hons) Geography.2-2 if you must know, and no I ain’t proud of that.
I am an English factory floor worker, who has never been paid a single penny by anyone, nor received a single penny from any other source,
in regards of my AGW skepticism or various related writings.

ONE What is the absorbed Solar flux at a distance of 1au, over a cross-section of the planet earth, given an albedo of α?
What is the radiative equilibrium temperature of the earth?
Given α=0.3, , and the other parameters which are well known,
The Stefan-Boltzmann equation is a law of physics. This result is what the radiative equilibrium temperature of the earth has to be. In the theory of the Greenhouse Effect, this temperature is compared to earth’s average temperature as measured by globally situated ground stations. Because this temperature is 150C, the differential from the radiative equilibrium temperature is said to be due to the “Greenhouse Effect”.
This is physically inaccurate and also misleading. The “dirt” surface of the earth is not the radiative surface of the earth. There is no physical reason to assume this is an appropriate comparison of temperatures. It can be proved physically that it is in fact an incorrect comparison. To measure the temperature of the radiative surface of the earth, which is the altitude at which infrared photons escape the atmosphere with an optical depth of 1, one must measure the temperature of the earth from a distance. As seen from Mars, the radiative temperature of the earth is.............
-18C.
Joe Postma - Solar_Flux pdf
27

Though it is humanly intuitive to think of the surface of the earth as being the ground, the ground is not the radiative surface of the earth. The Stefan-Boltzmann equation is one of radiative equilibrium. It is confirmed by measurement. Comparing the radiative equilibrium temperature to the ground surface temperature is misleading, unexpected, and physically inappropriate (see below).
TWO (adapted from Dr. Hans Jelbring, Swedish Climatologist, at http://hocketyschtick.blogspot.com/2010/09/shattering-greenhouse-effect.html) Why is the ground surface of the earth warmer than the radiative surface above it? Consider a vertical gas column containing a finite and constant specific energy level (U, J/kg) that is isolated from its surroundings but which is in a gravitational field. The column will in time reach equilibrium with respect to internal specific energy but the temperature will not be uniform. At static equilibrium, internal specific energy (U) is composed of both thermal energy and potential energy. Thus, according to the first and second law of thermodynamics, the specific internal energy (U) for any mass parcel in the air column has to be constant and can be expressed as a sum of the thermal and potential energies.
At equilibrium,
This is identical to the dry adiabatic lapse rate theoretically derived in meteorology for a convective adiabatic air parcel.In both cases, it is solely a function of the gravitational field strength and the heat capacity of the gas. There is no dependence on Radiative Transfer. There is no dependence on “greenhouse” gasses.
28

What is the height of the radiative equilibrium surface, and therefore, what should be the average temperature of the more-compressed air at the bottom of the atmosphere? The radiative surface of the atmosphere is found around 4km in altitude. This altitude is partly due to selective absorption of low-energy outgoing infrared radiation, but is also mainly due to atmospheric extinction. Of incident sunlight, ~50% is absorbed directly by the atmosphere (extinction), ~30% is reflected by clouds, seawater, and ground (albedo), leaving only ~20% to be absorbed at the ground surface (ground heating). Therefore the radiative surface is not the ground a-priori, independent of outgoing selective absorption, because more incoming energy is absorbed directly by the atmosphere via extinction, at altitude, than at the ground.
Given the radiative equilibrium surface is measured to be around 4km in altitude, the ground surface air should have an average temperature close to:
SUMMARY 1The radiative surface of the earth is not the same thing as the ground surface of the earth. Therefore, comparing the actual ground-air temperature to the theoretical radiative equilibrium blackbody temperature is an invalid concept – there is no reason to do this from the outset. The theoretical radiative equilibrium temperature is measured to be exactly just that, on average, as seen from space.
2The simple Ideal Gas Law, and the First and Second Laws of Thermodynamics, tell us that the atmospheric temperature increases with density in a gravitational field.
3Given the dry adiabatic lapse rate is known from thermodynamics and meteorology, and the altitude of the radiative equilibrium temperature is known from measurement, the average ground surface air temperature is calculated to be +220C, via thermodynamics.
Therefore the real question and science is found in: How much does outgoing radiative transfer contribute to the height of the radiative equilibrium surface, thus contributing to warming of the ground-air due to thermodynamics? Then, how much is this height affected by CO2? Then, how much by anthropogenic CO2? Satellite-measured data has already answered the last question for us: It’s too little to matter! Thus the need for positive feedbacks (see last).
29

Additionally: The idea that the ground-air temperature is due exclusively to the mechanics of outgoing infrared radiative transfer is false. Asignificant portion of ground-air heating must be due to simple thermodynamics a-priori, because the majority of incoming solar energy is absorbed directly by the atmosphere, raising the radiative equilibrium surface far above the ground.
There is no such thing as an atmospheric Greenhouse Effect as popularly understood by the lay-public: the analogy was never valid to begin with. A horticulturalists’ greenhouse is warm because the glass prevents convective cooling of sunlight-heated air. It is not because the glass absorbs or traps infrared radiation. IR transparent glass could be used and a greenhouse will still be warm. Air actually conducts & convects heat away from sun-lit ground, acting rather as an air-conditioner. The sun-lit surface of the moon is after-all, with no atmosphere, hundreds of degrees hotter than the Stefan-Boltzmann equation would predict. This is because there is no atmosphere present to share the thermal load, distribute the heat, and convectively cool the lunar regolith. The atmospheric greenhouse analogy is invalid and misleading, and sidesteps true understanding based on well-accepted theory and physical principles. We need a better mnemonic than the one we have.
“The present approach of dealing with climate as completely specified by a single number, globally averaged surface temperature anomaly, that is forced by another single number, atmospheric CO2, limits real understanding. So does the replacement of physical theory by model simulation”1 and simple-minded misleading mnemonics. Theory is further abused in the error of proposing that the ground-air temperature is determined exclusively by the amount of radiation in it, rather than the amount of radiation being determined by the temperature. Any stellar atmospherics astrophysicist knows that the amount of radiation in an atmosphere is determined by its temperature, not the other way around. If it was, then astrophysicists should concern themselves with the “Greenhouse Effect” in stars…They don’t.
“Skepticism involves doubts about an otherwise plausible proposition. Global warming alarm does not represent a plausible proposition. Twenty years of repetition and escalation of claims does not make it more plausible. Quite the contrary, the failure to improve the case over 20 years makes the case even less plausible...”
– 1 Dr. Richard Lindzen, M.I.T. Professor of Climate Sciences, in testimony to the U.S. Congress on climate policy.
In the best traditions of free intellectual inquiry and academic pursuit, freedom of expression and exploration of ideas, and respect for person and private property, polite critical review is always welcomed and encouraged.
Debate is fun and enjoyable, it’s what we’re here to do, and the clash of ideas is what we’re all here to develop and explore , in the best traditions of our Natural Philosophy going back thousands and thousands of years.
30

Model-Predicted rise in temperature vs. altitude, ASSUMING post-hoc positive feedback via water vapour. This is the basis of the alarmist position.
But if all this is known, you must be wondering why it’s not common knowledge and why there is still a political debate on Anthropogenic Climate Change and why “leading scientists” still promote it? To answer that you must leave the scientific realm presented here, and be and examine the work of investigators. Echoing the ancient Roman senator: follow the money. The biggest money. It’s not “big oil”. It certainly doesn’t require a skilled imagination to understand the money involved in taxing or trading carbon credits in exchange for capital-goods production and general economic activity around the entire planet. We’re talking about a new system of trade of thin-air to underlie and direct all other existing systems of currency and trade. Think about it...
31

Actual rise in temperature vs. altitude as measured by satellite – i.e. it is non-existent. The models were wrong, because THERE IS NO POSITIVE FEEDBACK.
There is no cause for alarm. Some other of the hundreds of factors is causing the surface warming.
32