Embed Size (px)
Citation preview

Derivation of Forces on a Sail using Pressure and
Shape Measurements at Full-Scale
Master of Science Thesis
DALE MORRIS
Department of Shipping and Marine Technology
Division of Sustainable Ship Propulsion
CHALMERS UNIVERSITY OF TECHNOLOGY
Göteborg, Sweden, 2011
Report No. X-11/267

0

i
REPORT NO. X-11/267
Derivation of Forces on a Sail using Pressure and Shape
Measurements at Full-Scale
DALE MORRIS
Department of Shipping and Marine Technology
CHALMERS UNIVERSITY OF TECHNOLOGY
Gothenburg, Sweden 2011

ii
Derivation of Forces on a Sail using Pressure and Shape
Measurements at Full-Scale
DALE MORRIS
© DALE MORRIS, 2011
Report No. X-11/267
Department of Shipping and Marine Technology
SE-412 96 Gothenburg
Sweden
Telephone +46 (0)31-772 1000
Cover: Orange neon stripes, detected by the sail recognition software VSPARS, and pressure
sensors on full-scale sails
Printed by Chalmers Reproservice
Gothenburg, Sweden 2011

iii
Derivation of Forces on a Sail using Pressure and Shape Measurements at Full-Scale
DALE MORRIS
Department of Shipping and Marine Technology
Chalmers University of Technology
Abstract
Aerodynamic forces are usually computed numerically or measured in a wind tunnel. These forces
may be used to predict the performance of a yacht at full-scale. The aim of this project was to
develop a new method to measure the forces and moments directly at full-scale. The theory was
that by simultaneously measuring the shape of the sails and the pressures around them the force
normal to the surface could be derived by summation of the product of the pressure, unit normal
vector and the relevant area of the discretised sail shape.
A code was written for the interpolations of the discrete shape and pressure measurements to the
full sail shapes and pressures over them. The shape was then discretised and the pressure at the
centre of each cell was assumed constant over it. The results were validated through testing at
model-scale. The calculated forces and moments were compared directly to the results obtained
from a force balance on which the model yacht was mounted. The results were also used in a VPP to
assess the accuracy when predicting heel angle and boat speed.
The first test was conducted on a set of semi-rigid sails with surface mounted pressure taps. A study
of the pressure distributions found using a VLM was used to optimise the pressure tap locations. The
results were encouraging; however it appeared that the interference on the flow caused by the taps
resulted in large under-predictions of the forces and moments. This lead to a second round of
model testing using sails with internal pressure taps leaving the sail surfaces smooth. The results
showed good agreement, although there was still a significant under-prediction of the drive force.
Full-scale testing was carried out using a purpose built pressure measuring system. Although full-
scale testing is extremely difficult due to the unsteady environment, good results were obtained
where clear trends in the boat speed and heel angle were also seen in the calculated drive force and
heeling moment.
Keywords: pressure measurement, force measurement, full-scale, model-scale, shape recognition,
sails

iv
Acknowledgements
First and foremost I would like to thank the Rolf Sörmans Fund and the Jewish Maritime League for
sponsoring my trip to New Zealand.
I would like to thank Lars Larsson for providing me with the opportunity to go and for accepting the
role of examiner and to Peter Richards in the role of supervisor for guiding my work and providing a
deep insight into the theory of sailing.
This work would not have been possible without the help of David Le Pelley. His input into this
project was immense, not only his time spent on developing the pressure system but also the help
provided in his advice for writing the code, instruction on how to use the wind tunnel and thoughts
on the analysis of the results. Of course I also have much gratitude for him providing the use of his
beautiful Stewart 34.
Julien Pilate was gracious enough to let me use his VLM code in this work. He was always helpful and
any questions or problems I had regarding the use of or the theory behind it were always taken care
promptly.
A big cheers to the boys at the YRU for helping with the full-scale testing. Alex Blakely was always
ready to lend a hand down in the workshop or to discuss any issue I was having, often with him
providing the epiphany I needed. He was also always up for a weekend of testing when the schedule
was too full during the week. Boris Horel and Rafaelle Ficco were also always ready to jump in and
help out where they could, and not to mention Boris’ contribution he made for this work with his
measurements of the heel angle, boat speed and AWS.
My loving parents, Ian and Dalene Morris, are my biggest inspiration in everything I do and I cannot
thank them enough.
Lastly I would like to thank Cathrine Waldebjer for always being close by even when she was on the
other side of the world.
(From L to R) Peter Richards, Raffaele Ficco, Alex Blakely, Dale Morris, Boris Horel & David Le Pelley

v
Table of Contents
Abstract .................................................................................................................................................. iii
Acknowledgements ................................................................................................................................ iv
Table of Contents .................................................................................................................................... v
List of Figures ....................................................................................................................................... viii
List of Tables ........................................................................................................................................... x
Nomenclature ........................................................................................................................................ xi
Symbols .............................................................................................................................................. xi
Abbreviations .................................................................................................................................... xii
1 Introduction .................................................................................................................................... 1
1.1 Background to the Current Work............................................................................................ 1
1.2 Objective ................................................................................................................................. 2
1.3 Methodology ........................................................................................................................... 2
1.4 Scope & Limitations ................................................................................................................ 3
2 Previous Work ................................................................................................................................. 4
2.1 Pressure Measurements on Sails ............................................................................................ 4
2.2 Full-Scale Force Measurements on Yachts ............................................................................. 6
2.3 Sail Shape Measurements ....................................................................................................... 8
2.4 Summary of Previous Work .................................................................................................... 8
3 Theory ............................................................................................................................................. 9
3.1 Sail Theory in Brief .................................................................................................................. 9
3.1.1 Sail Geometry and Terminology ...................................................................................... 9
3.1.2 Pressure Difference and Lift .......................................................................................... 12
3.1.3 Flow Phenomena Affecting the Pressure Field ............................................................. 13
3.1.4 Forces and Moments Generated by the Sails and Rig .................................................. 15
3.2 Difficulties in Measuring Pressure ........................................................................................ 19
3.2.1 Issues due to Measuring Equipment ............................................................................. 19
3.2.2 Fluctuations in Readings due to Pressure Environment ............................................... 19
3.2.3 Difficulties to Zero the System at Full-Scale ................................................................. 20
3.3 Theory behind VSPARS .......................................................................................................... 20
3.4 Full-Scale vs. Model-Scale or Numerical Testing .................................................................. 21
3.4.1 Details of the Twisted Flow Wind Tunnel (TFWT) ......................................................... 22
3.5 Curve Fitting Techniques....................................................................................................... 22
3.5.1 Interpolation ................................................................................................................. 22

vi
3.5.2 Least Squares ................................................................................................................ 23
4 Pressure Integration over Sail Shapes .......................................................................................... 25
4.1 Inputs for the Integration ..................................................................................................... 25
4.1.1 Shape Input ................................................................................................................... 25
4.1.2 Pressure Input ............................................................................................................... 26
4.1.3 User Input...................................................................................................................... 26
4.2 Sail Shape Generation ........................................................................................................... 27
4.3 Pressure Integration over the Sail ......................................................................................... 30
4.4 Force & Moment Calculation ................................................................................................ 32
4.5 Verification & Validation ....................................................................................................... 32
4.5.1 Sail Area Calculation ...................................................................................................... 32
4.5.2 Sail Dimensions ............................................................................................................. 33
4.5.3 Integration of Uniform Pressure Field .......................................................................... 33
5 Model Test 1: Semi-Rigid Sails ...................................................................................................... 34
5.1 Test Setup: Semi-Rigid Sails .................................................................................................. 34
5.1.1 Details of Semi-Rigid Sails and Pressure System ........................................................... 34
5.1.2 Test Procedure for the Semi-Rigid Sails ........................................................................ 37
5.2 Results: Semi-Rigid Sails ........................................................................................................ 37
5.2.1 Semi-Rigid: Recorded Pressures ................................................................................... 37
5.2.2 Semi-Rigid: Forces & Moments ..................................................................................... 42
5.2.1 Semi-Rigid: VPP Results ................................................................................................. 43
5.3 Summary of Results for the Semi-Rigid Test ......................................................................... 46
5.3.1 Possible Sources of Error for the Semi-Rigid Test ......................................................... 46
6 Model Test 2: Coreflute Sails ........................................................................................................ 47
6.1 Test Setup: Coreflute Sails .................................................................................................... 47
6.1.1 Description of the Coreflute Sails ................................................................................. 47
6.1.2 Test Procedure: Coreflute Sails ..................................................................................... 49
6.2 Results for the Coreflute Sails ............................................................................................... 49
6.2.1 Coreflute: Recorded Pressures ..................................................................................... 49
6.2.2 Coreflute: Sail Area and Depth ..................................................................................... 53
6.2.3 Coreflute: Forces & Moments ....................................................................................... 54
6.2.4 Coreflute: VPP Results................................................................................................... 55
6.3 Summary of the Results for the Coreflute Test .................................................................... 58
7 Full-Scale Testing ........................................................................................................................... 59

vii
7.1 Test Equipment ..................................................................................................................... 59
7.1.1 Details of the Pressure Measuring System ................................................................... 59
7.1.2 Calibration of the Pressure Transducers ....................................................................... 61
7.1.3 Setup of the VSPARS Stripes ......................................................................................... 61
7.1.4 Setup of the Pressure Taps ........................................................................................... 61
7.1.5 The Sails Used ............................................................................................................... 63
7.1.6 Additional Equipment ................................................................................................... 63
7.2 Test Procedure and Observations ......................................................................................... 63
7.3 Results for the Full-Scale Test ............................................................................................... 64
7.3.1 Full-Scale: Recorded Pressures ..................................................................................... 64
7.3.2 Full-Scale: Comparison of Various Measurements ....................................................... 68
7.4 Summary of the Results for the Full-Scale Test .................................................................... 72
8 General Discussion ........................................................................................................................ 73
9 Conclusions ................................................................................................................................... 74
10 Recommendations for Future Work ......................................................................................... 75
11 Bibliography .............................................................................................................................. 76
APPENDIX 1 – Base Code ...................................................................................................................... 78
APPENDIX 2 – Formulas used in Code ................................................................................................... 81
Cross-Product Theorem .................................................................................................................... 81
Arc Length ......................................................................................................................................... 82
Least Squares Curve Fitting ............................................................................................................... 83
APPENDIX 3 – Pressure Tap Testing ...................................................................................................... 84
Taps for the Semi-Rigid Sails ............................................................................................................. 84
Various Full-Scale Tap Geometries ................................................................................................... 84
Full-Scale Taps with Sail Patches ....................................................................................................... 85
APPENDIX 5 – Pressure Tap Locations .................................................................................................. 87
APPENDIX 5 – Results ............................................................................................................................ 88
Results for the Semi-Rigid Test ......................................................................................................... 88
Results for the Coreflute Test ........................................................................................................... 91

viii
List of Figures
Figure 3-1: Terminology of a sail ............................................................................................................. 9
Figure 3-2: Sail Shape Parameters ........................................................................................................ 10
Figure 3-3: Windward and leeward on port tack .................................................................................. 10
Figure 3-4: Sail dimensions ................................................................................................................... 11
Figure 3-5: Pressure distribution over a thin foil (19) ........................................................................... 12
Figure 3-6: Flat plate with circulation (9) .............................................................................................. 12
Figure 3-7: The boundary layer under various pressure gradients:...................................................... 14
Figure 3-8: Pressure distributions over a main and headsail (7) .......................................................... 14
Figure 3-9: Stagnation streamlines on the main- and headsail ............................................................ 15
Figure 3-10: Force components on a sail .............................................................................................. 16
Figure 3-11: Change in force components due to sail trim .................................................................. 16
Figure 3-12: Forces and moments created by the sails ........................................................................ 17
Figure 3-13: The heeling force balance ................................................................................................. 17
Figure 3-14: Comparison of different interpolation schemes used for a typical chordwise pressure
distribution ............................................................................................................................................ 23
Figure 3-15: The "best" fit curve through a scatter of data points (inset: vertical offsets) .................. 23
Figure 3-16: Two examples of a 3rd degree least squares curve fitted to a typical pressure
distribution compared to a linear interpolation ................................................................................... 24
Figure 4-1: Stripes with user defined number of points ....................................................................... 27
Figure 4-2: The basic sail shape extrapolated to the head and foot .................................................... 28
Figure 4-3: Sails generated at a high resolution ................................................................................... 29
Figure 4-4: Picture showing the cut and skewed cells on the headsail ................................................ 30
Figure 4-5: Area of a parallelogram ...................................................................................................... 32
Figure 5-1: Overhead view of the Semi-Rigid test setup in the wind tunnel ........................................ 34
Figure 5-2: Graph showing the recreated pressure distribution along a chord ................................... 35
Figure 5-3: Coin tap (dimensions in mm) .............................................................................................. 35
Figure 5-4: Block tap (dimensions in mm) ............................................................................................ 35
Figure 5-5: Picture of taps on the top stripe at the leading edge of the mainsail ................................ 36
Figure 5-6: Picture of mainsail, PVC tubing and stand from astern ...................................................... 36
Figure 5-7: Figures of pressure distribution around the Semi-Rigid sails ............................................. 37
Figure 5-8: Differential pressure reading on Semi-Rigid headsail for the sweep of the headsail ........ 38
Figure 5-9: Differential pressure reading on Semi-Rigid mainsail for the sweep of the headsail ........ 38
Figure 5-10: Pressure contour plot of Semi-Rigid mainsail for JS0 ....................................................... 40
Figure 5-11: Pressure contour plot of the Semi-Rigid headsail for JS0 ................................................. 40
Figure 5-12: Pressure contour plot of the mainsail using a VLM .......................................................... 41
Figure 5-13: Pressure contour plot of the headsail using a VLM .......................................................... 41
Figure 5-14: Results for each trim position in the combined sweep of the Semi-Rigid Sails ............... 44
Figure 5-15: VPP predicted boat speed (Vs) for Semi-Rigid .................................................................. 45
Figure 5-16: VPP predicted heel angle for Semi-Rigid .......................................................................... 45
Figure 5-17: Heel moment (Mx) vs VPP predicted heel angle for Semi-Rigid ...................................... 45
Figure 5-18: Photo of ridges found on the leeward, flush mounted taps ............................................ 46
Figure 6-1: Overhead view of the Coreflute test setup in the wind tunnel .......................................... 47
Figure 6-2: Cross-section of the Coreflute sails and location of pressure tap rows (15) ...................... 48

ix
Figure 6-3: Figures of pressure distribution around Semi-Rigid and Coreflute sails ............................ 50
Figure 6-4: Differential pressure reading on Coreflute headsail for the sweep of the headsail .......... 51
Figure 6-5: Differential pressure reading on Coreflute mainsail for the sweep of the headsail .......... 51
Figure 6-6: Pressure contour plot of Coreflute mainsail ....................................................................... 52
Figure 6-7: Pressure contour plot of Coreflute headsail ....................................................................... 52
Figure 6-8: Comparison of VPARS to measured values for camber and draft ...................................... 54
Figure 6-9: Results for each trim position in the combined sweep of the sails .................................... 56
Figure 6-10: VPP predicted boat speed (Vs) for Coreflute .................................................................... 57
Figure 6-11: VPP predicted heel angle for Coreflute ............................................................................ 57
Figure 6-12: Heel moment (Mx) vs VPP predicted heel angle for Coreflute ........................................ 57
Figure 7-1: Two piece housing for the pressure transducer (25) ......................................................... 60
Figure 7-2: Schematic of the wired pressure system (25) .................................................................... 60
Figure 7-3: Pictures of the pressure taps being mounted to the sail ................................................... 62
Figure 7-4: Rough representation of the course sailed ........................................................................ 64
Figure 7-5: Pressure distribution on the main top stripe for main sweep for both tacks .................... 66
Figure 7-6: Pressure distribution on the main mid stripe for main sweep for both tacks ................... 66
Figure 7-7: Pressure contour plot of full-scale mainsail ....................................................................... 67
Figure 7-8: Pressure contour plot of full-scale headsail ....................................................................... 67
Figure 7-9: Comparison of SOG and Vs to Fx for both jib sweeps ........................................................ 68
Figure 7-10: Comparison of Vs to Fx for all stbd sweeps ...................................................................... 69
Figure 7-11: Comparison of heel angle to heeling moment for all stbd sweeps .................................. 70
Figure 7-12: Comparison of heeling angle to boat speed for all stbd sweeps ...................................... 70
Figure 7-13: Comparison of heeling moment, heel angle, AWA, drive force, boat speed and AWS for
all stbd sweeps ...................................................................................................................................... 71
Figure 11-1: Calculation of arc length ................................................................................................... 82
Figure 11-2: Graph of pressure readings for model-scale taps for one sweep of the headsail ............ 84
Figure 11-3: Various tap geometries (from L-R: Volcano, Steep, Gradual, Rounded) .......................... 85
Figure 11-4: Graph of pressure readings for various full-scale tap geometries ................................... 85
Figure 11-5: Top and side views of the testing of full-scale pressure taps ........................................... 85
Figure 11-6: Graph of pressure readings for full-scale taps with sail patches ...................................... 86

x
List of Tables
Table 4-1: Data sheet for code .............................................................................................................. 25
Table 4-2: Example of a pressure matrix with varying number of taps ................................................ 31
Table 5-1: Force & moment results for Model Test 1: Semi-Rigid ........................................................ 42
Table 6-1: Rows used and corresponding percentages ........................................................................ 48
Table 6-2: Percentage difference between VSPARS and measured values .......................................... 53
Table 6-3: Force & moment results for Model Test 2: Coreflute .......................................................... 55
Table 7-1: Relative contribution of main and headsail on Fx and Mx .................................................... 69
Table 11-1: Table of average difference of different model-scale tap geometries .............................. 84
Table 11-2: Table of average difference and standard deviations for various full-scale tap geometries
.............................................................................................................................................................. 85
Table 11-3: Table of average difference and standard deviations for full-scale taps with sail patches
.............................................................................................................................................................. 86

xi
Nomenclature
Symbols
α Angle of Attack
Ahead Area of the headsail
Amain Area of the mainsail
Aref Reference Area
Β Heeling Angle
b Righting Arm
C A constant value
CF Force Coefficient
CM Moment Coefficient
CP, CPmax, ∆CP Pressure Coefficient, Maximum CP, Differential CP
∆ Buoyancy of the boat
E Maximum dimension of the foot of a mainsail
FA Aerodynamic Force
FH Hydrodynamic Force
Fside, FS Side Force
FT Resultant Force
Fvert Vertical Force
Fx, FR Drive Force
Fy Force perpendicular to the mast
Fz Force parallel to the mast
θ, θzero Analogue signal in bits, Value in bits for the zero reading
h Heeling Arm
H Luff Height, Length of Head
I Maximum hoist height of the headsail
J Distance from fore face of the mast to the forestay
LP Luff Perpendicular
m Gradient of the slope
P Maximum hoist height of the mainsail
p, p∞ Static Pressure, Static Pressure of the free stream
q, q∞ Dynamic Pressure, Dynamic Pressure of the free stream
ρ Density
U, U∞ Flow Velocity, Free Stream Velocity
V Flow Velocity
Va Apparent Wind Velocity
Vb Boat Velocity
Vs Boat Speed
Vt True Wind Velocity
W Weight of the boat
x/c x coordinate divided by chord length
xij x coordinate for the ith
data point in the chordwise direction and the
jth
in the spanwise direction

xii
Abbreviations
A/D Analogue to Digital
AoA Angle of Attack
AWA Apparent Wind Angle
AWS Apparent Wind Speed
CB Centre of Buoyancy
CE Centre of Effort
CFD Computational Fluid Dynamics
CG Centre of Gravity
CLR Centre of Lateral Resistance
CNC Computer Numerical Control
CS Combined Sweep
GPS Global Positioning System
HM Heeling Moment
IDC Insulation Displacement Connector
IMU Inertial Measurement Unit
JS Jib Sweep
MDF Medium Density Fibreboard
MS Main Sweep
PCB Printed Circuit Board
PVC Polyvinyl Chloride
RANSE Reynolds Averaged Navier Stokes Equations
SOG Speed Over Ground
STBD Starboard
TFWT Twisted Flow Wind Tunnel
TWA True Wind Angle
TWS True Wind Speed
UoA University of Auckland
USB Universal Serial Bus
VLM Vortex Lattice Method
VPP Velocity Prediction Program
VSPARS Visualisation of Sail Position And Rig Shape
YRU Yacht Research Unit

1
1 Introduction
This project is believed to be the first attempt to calculate the generated forces and moments from
full-scale or model-scale sails by measuring the pressures across them and integrating these over the
measured sail shape.
1.1 Background to the Current Work
Predicting the potential speed of a yacht is an important tool for the designer and for the sailor.
Whether being used to design the best sails for the yacht or to trim the sails to their optimum the
more accurate these predictions are the better the yacht will perform.
It is possible to use empirical formulas to predict the performance of a certain sized sail but
generally, if a higher accuracy is required, testing is done either numerically or at model-scale. These
methods have their limitations; computational power limits the accuracy of numerical testing while
scaling of all parameters is basically impossible in a wind tunnel.
Knowing this there is still few other options. Ideally all potential sails would be tested at full-scale
but this is economically not viable as the cost of doing wind tunnel tests on a full range of sails is
roughly the same as making one full-scale sail and numerical testing is even cheaper. However if an
easy and accurate method existed to test full-scale sails it could provide priceless feedback for future
designs. Specifically flying shapes, pressures and ultimately the forces and moments generated by
the sails would be the most valuable.
There have been a few sail dynamometers built over the years which have been successful (1) (2) (3).
These are yachts constructed with an internal force balance in order to measure the forces from its
sails. The results are however specific to the dynamometer and cannot be used to predict the forces
for others. Another method to look at the fluid-structure interaction between the sails and rig is to
measure the loads directly on the rigging using strain gauges (4). According to the material available
these have been the only previous attempts to measure the forces at full-scale.
Until recently full-scale pressure tests had been few and far between, the earliest was done in 1923
by Warner and Ober (5) followed by the next recorded attempt in 2006 by Puddu et al. (6).
Subsequently there has been a revival of this thread of research thanks to more appropriate
equipment being developed. Viola (7) was successful in obtaining a good resolution of the pressure
distribution over a jib and mainsail while working at the Univeristy of Auckland Yacht Research Unit
(YRU).
Le Pelley and Modral have developed a commercial package, VSPARS, which is capable of recording
the chord shapes at specific heights along the sail. This package is currently being used by top-flight
racing teams in the Volvo Ocean Race, America’s Cup and the TP52 circuit plus many more. Teams
that use it are easily identified by the bright orange or green day-glow stripes across their sails (8).
The hypothesis for this work then is that by coupling a pressure measurement system and a sail
shape recognition package it would be possible to calculate the magnitude and direction of the
resultant force generated by the sails by integrating the pressure over their surface.

2
1.2 Objective
The primary objective of this project was to simultaneously measure the shape of a set of sails and
the pressure distribution around it at full-scale. Then, by multiplying said pressures by the area and
unit normal vector of a corresponding surface, calculate the generated drive force and roll moment
A number of secondary objectives were identified in order to achieve the primary goal:
• Recreate the full sail shape and pressure distribution from discrete measurements.
• Validate the calculations through wind tunnel testing.
• Optimise the number of pressure taps necessary to obtain a reasonably accurate pressure
distribution.
• Test various geometries of pressure taps for model- and full-scale for the least interference
on the air flow.
• Assemble and test a new pressure measurement system designed for full-scale.
1.3 Methodology
Shape measurements were recorded using a commercial sail recognition package, VSPARS,
developed within the YRU. Pressures were obtained in the wind tunnel through a system developed
and used successfully in previous projects. For full-scale a new system was developed by David Le
Pelley.
Discrete measurements for both shape and pressure are interpolated in order to describe the full
sail shape and pressure distribution of the sails. Some assumptions were necessary to achieve this.
A program was needed to handle the inputs and perform the interpolations to a high density. This
was written in Matlab. It was developed using inputs obtained through model testing in a wind
tunnel before being implemented at full-scale.
A force balance in the Twisted Flow Wind Tunnel (TWFT) at the YRU was used to validate the
calculated forces. The calculated forces and results from the balance were also used in a Velocity
Prediction Program (VPP) to assess the influence on boat speed and heel.
Initially results from a Vortex Lattice Method (VLM) numerical simulation, developed by Julien Pilate
at the YRU, were used to optimise the number of pressure taps and their locations. Once sufficient
data had been recorded an analysis of it helped to assess the effectiveness of the layout.
A brief study was conducted in the wind tunnel to assess a couple of tap geometries and their effect
on the pressure readings on a model-scale sail. Further testing was conducted on proposed full-scale
taps. These were limited by the size of the pressure transducer that they were required to house.
Assembly, installation and calibration of the full-scale pressure system were carried out by the
author.
Full-scale testing was conducted on a Stewart 34, courtesy of David Le Pelley, out on the Hauraki
Gulf in Auckland, New Zealand.

3
1.4 Scope & Limitations
The project was primarily focused on the recreation of the sail’s geometry from the data output
from the sail shape capturing and the extrapolation of discrete pressure readings into a full
distribution over the sail.
The scope was limited to upwind sails, i.e. a mainsail and jib or genoa. The work required to
incorporate downwind sails was thought to be excessive for the time allotted to this project. These
sails were trimmed using only the primary controls, i.e. the sheets, to simplify the problem.
Although some analysis of the pressure distributions was done to determine if the recorded data
was valid or not, this work does not focus on the details as to what was occurring in the pressure
plots for each test run.
Leeway angle was ignored completely. The results can easily be transformed if the leeway angle is
known. However it is very complicated to measure this angle accurately for a time averaged period
and therefore was not accounted for.
The full-scale testing was conducted two weeks prior to the author commencing work at Southern
Spars NZ and therefore time was too limited for a repeat test. The delay was caused by the late
delivery of parts for the pressure system.

4
2 Previous Work
This was a multifaceted project that can be divided into three main parts when examining the
previous work leading up to it. Namely these are pressure measurement, shape measurement and
full-scale force measurement. The previous work conducted in each area is reported here in
chronological order. Some previous work combined elements from two or more categories making it
difficult to categorise and so the relevant content is discussed in each section.
2.1 Pressure Measurements on Sails
In 1923, according to Marchaj (5), full-scale pressure measurements were carried out by Warner &
Ober on the yacht Papoose. They used a number of manometers connected to small holes in the
sails using rubber tubing on only one side of the sails. Three lines or sections were measured on the
mainsail and one on the jib. There was a slightly higher density of measurement points at the leading
edge than on the remainder of a line. Simultaneous measuring was achieved by photographing the
bank of manometers and windward and leeward pressures were measured by changing tack. The
readings were then of the pressure difference between the static pressure on the sail and the static
atmospheric pressure at the deck. This eliminated the effect of wind speed variations between
different tests.
In 1971 Gentry (9) investigated sail interactions in 2D by using an Analogue Field Plotter. This was
essentially a device that uses electrical current to simulate the streamlines around a 2D foil in lines
of constant voltage across a conducting sheet. The analogy neglects viscosity in the same way as
potential flow theory. Velocities and pressures were then calculated from the readings using
Bernoulli’s equation and some significant observations were made with respect to the influence of
the headsail on the main and vice versa.
Wilkinson (10) conducted experiments in 1989 that looked at the pressure distribution on a 2D
variable camber aerofoil. The model also included a circular mast. The pressure tappings were
integral and did not disturb the flow. An investigation was done on the effect of Reynolds number,
camber ratio, incidence angle, mast diameter/chord ratio and mast angle.
In the past 5 years pressure measurements have seen a resurgence. The realisation of compact
equipment that does not significantly affect the flow field or sail shape has allowed researchers to
look at the underlying phenomena that creates the forces and moments in more detail. This has
served to better understand the problem as well as to provide full-scale validation for numerical
techniques.
In 2006 Pudda et al (6) investigated the static pressures at full-scale on the mainsail of a tornado
class catamaran. 25 wired taps were regularly spaced per side and staggered relative to the other
side to measure either the suction or pressure on the sail. The measurements were then combined
to obtain the differential pressure. They reported a full pressure distribution derived from these
measurements and compared them to numerical results but there was no mention of how the
pressures were interpolated across the sail. Where or how the reference pressure was measured
was not mentioned either. The taps were not placed very close to the leading edge where
phenomena such as separation and recirculation are known to occur and create high gradients in the
pressure.

5
In the same year Flay and Millar (11) published their work describing the considerations needed
when attempting to measure pressures on sails. Their full-scale attempt, which used 120 pressure
taps placed at 1/4, 1/2, and 3/4 luff lengths to measure static pressures connected to a reference
pressure through PVC tubing, was unsuccessful. They concluded that squashed tubing had resulted
in incorrect backing pressure to the transducers.
In 2008 a team working for BMW Oracle (12) developed their own wireless pressure measuring
system. In order to validate the system they tested it on a 25m sloop and recorded boat speed, TWS
and TWA and compared these with the changes in pressure. The results correlated well and they
suggested that the pressure readings could be highly useful as it pre-empted change in boat speed.
Pressures were also compared to computer models with good agreement. The sail shapes for the
CFD analysis were recorded through photographs and recreated using North Sails’ sail design
software, Membrain©. The number of pressure taps used was very limited, as few as five per side at
five different heights. They recommend using as many as 56 evenly spaced taps per side on the main
and 33 for the headsail in order to obtain a complete pressure map across the sail.
Richards and Lasher (13) conducted a 1/25th
model-scale experiment on downwind sails using Semi-
Rigid, fibre glassed sails with PVC tubing embedded inside. The main advantage of these sails was
that there was no interference with the flow by the pressure tappings, as opposed to having surface
mounted taps on a flexible sail. They were also able then to tap the sails at a high resolution of 47
per side on the spinnaker and 30 per side for the main distributed over 7 chords or horizontal
sections on each sail. The results of the pressure measurements were integrated over the known sail
shape taken from the geometry file used for the mould to calculate the drive and side force
generated by the sails. These were compared with the force balance measurements in the wind
tunnel with good agreement. The pressure distributions were also compared to numerical
computations using Fluent, again with good agreement.
In 2009 Viola and Flay (14) tested a range of asymmetric spinnakers at 1/15th
scale. The sails tested
were an A1, A2 and A3 and the results correlated well to the intended uses of the sails, i.e. they each
generated the maximum drive force at the AWA’s that they were designed to be flown at. They
used the same pressure measurement system as Richards and Lasher (13) albeit with different
pressure taps. It was determined that the system had a resolution of 0.1 Pa when used at this scale.
The sails this time were flexible cloth sails and the pressure taps were mounted on the sail surface.
To minimise interference from the taps only one side was tested at a time with the taps mounted on
the other side and connected to the test side through a small hole in the sail cloth. Firstly 5 chord
sections were tested with 11 taps per chord for a range of AWA’s and heel angles. Then one chord
section was tested using 34 taps to investigate the effect of sail trim. The pressure measurements
showed good agreement with sail aerodynamic theory and it was obvious to see where the leading
and trailing edge separation occurred.
Encouraged by their results on the pressure measurements, in 2010 Viola and Flay (7) used the same
system at full-scale on a Sparkman and Stephens 24ft yacht, this time at a resolution of 1.2 Pa. The
experiment was conducted on a mainsail and genoa heading upwind with taps arranged at 3
different heights along each sail. The number of taps varied along the span with 6 at the top, 9 in the
middle and 16 at the bottom. As before the taps were connected to transducers through PVC tubing
which had to be taped onto the sail to avoid disturbing the flow. The pressure taps themselves were

6
truncated cones with a base of 20mm and a height of 5mm. All this apparatus was deemed to be
within the sail boundary layer and thus would not alter the flow. The taps were only placed on one
side of the sail with the transducers connected to a reference pressure. This meant that the boat
needed to change tack in order to measure both the leeward and windward pressures. In order to
obtain useful corresponding pressures there were a few pressure taps placed on the other side of
the sail as well as a few taps placed on either side of the mast which then needed to match the
pressure recorded on the previous tack before recording the new tack. The effects on the sails from
sheet trim, leech and backstay tension, the gap between the sails and various AWA were
investigated.
Around the same time Fluck et al. (15) were working on more model-scale pressure testing. They
believed that it was not sufficient to validate numerical codes with force alone. If the code could
match the experimental pressure data then it could prove that the code is accurate to a much higher
degree. This prompted them to build Semi-Rigid pressure tapped sails with a Coreflute® core and
fibreglass and epoxy skin. The fabrication of these sails is described in section 6.1.1. The advantage
of them being semi-rigid is that the shape was known for the numerical simulations. The pressure
tubing could then also be inside the sail and not disturb the airflow. The results compared very well
to the VLM code that was used. These sails and the VLM code have been used extensively for the
research in the current work.
2.2 Full-Scale Force Measurements on Yachts
Since the 1930’s there have been efforts to predict the performance of yachts in order to design
better ones or to make racing more competitive through handicapping systems. Although initially
done by hand calculations, they are now handled by velocity prediction programs (VPPs). A VPP
essentially balances the hydro- and aerodynamic forces acting on a yacht using empirical formulas in
order to find the speed and attitude of the yacht when in equilibrium. All they require are the force
coefficients of the hull and the sails. The hydrodynamic forces from the hull and appendages are
estimated through mathematical models derived from series of tow tank tests conducted
systematically on varying hull shapes at different attitudes and speed. The aerodynamic forces from
the sails have in the past been found in various ways.
Model-scale sails can be tested in a wind tunnel, such as the Twisted Flow Wind Tunnel (TFWT) at
the Yacht Research Unit (YRU) in Auckland, by mounting the model on a force dynamometer. The
TFWT has overcome many of the issues associated with model testing, namely the wind shear from
the atmospheric boundary layer and varying apparent wind angle (AWA) over a change in height.
Hansen (16) discusses this in detail. However testing conducted at model-scale rarely matches the
Reynolds number which is associated with the transition from laminar to turbulent flow. This would
require excessive wind speeds and the delicate sail fabric necessary at model-scale would not be
able to withstand this.
Another method is to measure the maximum speed of a full-scale yacht and then replicate the
boat’s attitude and speed in a tow tank. It is then possible to calculate the corresponding sail forces.
This method includes scale effects and the added resistance from waves may not be accounted for
accurately.

7
Numerical simulations, although rapidly becoming more powerful and robust, have not been able to
account for the large amounts of separation on downwind sails.
The drawbacks from these methods have encouraged some to attempt to measure the sail force at
full-scale. The first instance of this was van Hemmen (17), in 1986, who derived empirical formulas
from tests done using 50 strain gages mounted on the rigging on a yacht. He was then able to
measure the loads on these components and thus calculate the forces created by the sails. The
major problem with this method was that it was not very accurate due to the changes in the load
were in some cases less than 1% of the total load.
Herman (1) , in 1988, designed and built a 35ft test boat that connected all the rigging to a frame
that was free floating inside the hull. This frame was then connected to the hull through six load cells
which could then measure the six principal forces and moments. This essentially turned the full-scale
yacht into a six component dynamometer much like the one mentioned previously in the wind
tunnel. Milgram et al. (18), in 1995, used this boat, named the MIT Sailing Dynamometer, to develop
a sail force model for a VPP. For this the induced drag needed to be calculated so that it could be
separated from the form and parasitic components, therefore the sails’ shape was recorded. How
this was done is covered in the next section on sail shape measurement. Using this model resulted in
better agreement between the VPP and actual performance. The major drawbacks of this method is
that the results are only relevant to that boat which is time consuming and expensive to design and
build.
In 1996 at the University of Berlin another sailing dynamometer was designed and built in order to
investigate the differences between model-testing, numerical simulations and full-scale. The boat
was called DYNA and it also incorporated a separate force balance that measured the hydrodynamic
forces on the appendages (3).
Also based on this sailing dynamometer Masuyama & Fukasawa (2) built their own, named Fujin, in
1997. They used it to validate numerical calculations of the forces using a vortex lattice method. In
this case the sail shapes again needed to be recorded so that the geometry could be used for the
CFD analysis. How the shape was captured is discussed in the following section 2.3. The results
between the numerical and experimental testing were fairly good but more insight into the effect on
sail performance from trim and AWA was found. The experimental method and its drawbacks are
the same as for Milgram (18).
More recently in 2011 Augier et al. (4) conducted a full-scale validation experiment for their
numerical FSI model. The outputs from their code were compared with test results of the loads in
the rig and the sail shape, which is also discussed in section 2.3. Turnbuckles and shackles were
equipped with stress gauges to measure the loads in the shrouds and the running rigging
respectively. 16 load sensors were used all together. The experiment was run as a steady state and
then in an unsteady run. The steady state results from their code compared well but more work was
needed for the unsteady.

8
2.3 Sail Shape Measurements
The sail shape measuring technique used by Milgram et al. (18) was based on videography from a
chase-boat instead of onboard photography. At the time, in 1995, they deemed this to be more
effective than other onboard methods. Their method required the chase-boat to circle the yacht in
order to capture the sails from all necessary angles, eight all together. The stripes marking the sails
were fairly intricate in that one stripe was made up from three lines, two horizontal and one
diagonal, chord length calibration stripes and markings called a ‘calibration arc’. The shape could
then be recreated using software developed by them. The sail shapes were then used in a CFD
analysis.
The method used by Masuyama & Fukusawa in 1997 (2) was what is known as a 2D approach. There
were six CCD (charge-coupled device) cameras mounted on the yacht to record the sails’ shape.
Three on the port side and three on the starboard side to record either tack. Their mounting
positions were at the top of the mast to record the bottom of the mainsail, on the boom to record
the head of the mainsail and at the termination of the forestay on the mast to record the headsail.
The images were analysed using SSA-2D software which is able to capture lines drawn across the sail
at varying heights. The necessary input data was the line length and vertical position of it on the sail.
Augier et al. (4) used a similar approach as Masuyama & Fukusawa to record their sail shapes. They
used ASA and ISIS image processing software to manually extract marked stripes along the sail.
Calibration grids placed on deck were used to find the cameras’ angle and position during post-
processing. The results of this were used for comparison with a numerical model, which showed
good agreement.
2.4 Summary of Previous Work
In summation, measuring pressures on sails is a maturing field but recent successes can be learnt
from. The pressure tap numbers and locations vary significantly from one work to the next and no
ideal layout has been found as yet.
The force measurement technique proposed in this work has not been seen before. Previous work in
this field in the past has little relevance to other designs. The major advantage the concept has is
that theoretically it can easily be used from one boat to the next as it is cheap and easy to setup.
Many different techniques in measuring the sail shape are known. Generally they are labour
intensive or require various pieces of expensive hardware. The package used in this work appears to
be vastly more user-friendly and less time consuming to post-process.

9
3 Theory
The following section details some basic theory that is necessary to understand the content of the
work conducted for this paper.
3.1 Sail Theory in Brief
This section explains the basic concept of how a yacht functions starting with some sailing
terminology to help understand these concepts.
3.1.1 Sail Geometry and Terminology
Sail makers have their own language when it comes to describing a sail. The front of a yacht is called
the bow while the stern is the rear. From Figure 3-1 one can then see that the luff is the leading edge
of the sail and the leech is the trailing. The foot is the bottom edge which can be attached to the
boom or left loose. Sails generally come to a point at the head, the attachment point to the mast at
the top of the sail, but it is more and more common to find mainsails with a square top as seen in
the figure. The tack and clew are then the attachment points of the foot at the luff and leech
respectively. Battens are stiffeners in the sail, normally made of composite plastic or wood. They can
be full-length, as shown in the figure, or short, where they extend from the leech forward but not all
the way to the luff. This keeps the shape of the sail, especially the leech, stiff and improves the sail’s
performance.
Figure 3-1: Terminology of a sail

10
Although the shape of a sail can vary along its height, or span, and has almost no thickness, a
horizontal section can still be classified using the terminology of a wing. The following terms are
graphically explained in Figure 3-2.
Figure 3-2: Sail Shape Parameters
The Chord is defined as the straight line between the leading and trailing edge. Camber is then the
perpendicular distance from the chord line to the foil. Draft is the position of the maximum camber
along the chord line
Entry and exit angles of the foil are, respectively, the angles of the leading and trailing edge to the
chord line. Angle of attack (AoA) is the angle between the oncoming flow and the chord line and the
twist angle is the angle between the chord line and the boat’s centre line. The twist angle ideally
varies along the span in order to keep the AoA constant for all sections. More about that can be read
in detail in Marchaj (5) or Fossati (19).
In this paper only basic sail controls were used. The sheet is the primary line for trimming the sails.
For the headsail it is attached to the clew and for the mainsail it is attached towards the aft end of
the boom. The term used to indicate if the sheet is being tightened is trim and released is ease. By
trimming a sail the AoA is increased while easing it will decrease the AoA.
Depending on the tack of the boat, the side from which the wind is blowing from depicted in Figure
3-3, will determine which side of the sail is the windward and which is the leeward side of the sail.
The windward side will generally have positive pressures while the leeward will have negative.
Figure 3-3: Windward and leeward on port tack

The maximum sail dimensions of a boat
distance to the bow. These are defined
• I : height from headsail halyard hoist to shroud chainplate or sheerline
• J : distance from the forestay termination on deck to forward surface of the mast
• P : height of maximum halyard hoist of mainsail to top surface of boom
• E : distance from aft surface of mast to the allowable aftmost position of the clew
Other dimensions useful for calculating the nominal surface area of the sails hoisted on a yacht are:
• LP : Luff Perpendicular –
• H : Head Length – length of the top side of a square top mainsail
These can be seen graphically in
To calculate the areas the following equations are used
For the headsail:
For a triangular mainsail:
For a square-top mainsail:
11
The maximum sail dimensions of a boat are limited by the mast height, boom length
are defined as the lengths I, J, P and E where:
: height from headsail halyard hoist to shroud chainplate or sheerline.
: distance from the forestay termination on deck to forward surface of the mast
P : height of maximum halyard hoist of mainsail to top surface of boom.
distance from aft surface of mast to the allowable aftmost position of the clew
Other dimensions useful for calculating the nominal surface area of the sails hoisted on a yacht are:
– length perpendicular from luff to clew of foresail
length of the top side of a square top mainsail
These can be seen graphically in Figure 3-4.
Figure 3-4: Sail dimensions
he following equations are used (20).
boom length and the
: distance from the forestay termination on deck to forward surface of the mast.
distance from aft surface of mast to the allowable aftmost position of the clew.
Other dimensions useful for calculating the nominal surface area of the sails hoisted on a yacht are:
sail
(3.1)
(3.2)
(3.3)

12
3.1.2 Pressure Difference and Lift
Sails function much like wings do, albeit with some significant differences. They both generate a
force due to a pressure difference acting over their area as seen in Figure 3-6. The major differences
are that a sail has almost no thickness but often has a large camber and generally operates at higher
angles of attack. The flow around them is also usually disturbed by the mast or stays leading to large
areas of separation (5) (9) (20).
From Bernoulli’s equation we know that pressure is inversely related to velocity and so it can be
seen through the contraction of the streamlines over the leeward side that the flow will accelerate
creating a drop in pressure or a suction. Note that the pressure distribution in Figure 3-5 is displayed
in the accepted convention of negative pressures above the x-axis (20).
The simplified explanation of how lift is created due to the particles travelling further over the
leeward side does not hold much substance for thin aerofoils such as sails. Gentry (9) gives a more
detailed explanation by looking at the numerical solution of a flat plate. Early attempts to model the
flow around the plate resulted in the solution shown in Figure 3-6, labelled as the Non-Lifting
Solution, even though it satisfied all the governing equations. It was seen through experiments that
the flow at the trailing edge followed the angle of the plate along an imaginary extension of it before
turning back towards the free-stream direction, known as the Kutta condition. This is due to a
circulation that is created around the plate increasing the velocity on top and decreasing it on the
bottom (9).
Figure 3-5: Pressure distribution over a thin foil (19)
Figure 3-6: Flat plate with circulation (9)
Thus a low, suction pressure develops on the leeward side of the sail while a high pressure develops
on the windward side. At any one point along the sail the difference of these pressures multiplied by
a relevant area equals a force acting normal to the surface. If this calculation is done over an infinite
number of areas making up the full sail area the resultant force magnitude and direction of the sail
can be found. This is the fundamental theory behind this work (13).

13
The energy balance along a streamline can approximately be calculated using Bernoulli’s equation:
� � � � � (3.4)
Where � is the static and � is the dynamic pressure, which can be expressed in terms of the air
density (�) and the fluid velocity (�):
� � �� (3.5)
The change in dynamic pressure therefore drives the change in static. With an increase in speed
there will be a decrease in static pressure and vice versa. It is the differential static pressure that
loads the sail and this is what is measured.
A pressure coefficient is given in eq 3.6 as the ratio of the static pressure at a point less the ambient
static pressure to the ambient dynamic pressure. This helps to compare pressure measurements
between model and full-scale tests (19).
� � ������ (3.6)
Note the streamlines in both Figure 3-5 and Figure 3-6 that terminate on the foil. This is known as
the stagnation streamline and it is assumed that it comes to rest at the surface thus converting all of
its kinetic energy into pressure. From equation 3.5 and 3.6 it can also be found that here the
maximum pressure is achieved as the velocity ��� becomes zero. Thus CPmax = 1 where � � � ��� � �� (21).
The difference in pressure between the two sides of a sail is referred to as ∆CP, for the windward
pressure minus the leeward. The minimum leeward CP from past experiments was found to be
around -3, therefore the approximate maximum ∆CP = ±4 (7).
3.1.3 Flow Phenomena Affecting the Pressure Field
The previous section discussed how a pressure difference is created. This section discusses how this
pressure distribution behaves and why.
There is a boundary layer around any external surface with a fluid flowing over it due to viscosity,
where the flow velocity is less than the free-stream velocity far from the surface. The velocity is zero
at the surface but as one moves perpendicularly away the velocity recovers. Figure 3-7A shows a
classic example of this. The boundary layer is extremely thin and can almost be neglected when
calculating the pressure distribution, that is until separation occurs (19).
When flow moves from a high pressure to a low pressure it is known as a favourable pressure
gradient where separation of the flow is impossible. However when the flow moves from a low
pressure to a high pressure, known as an adverse pressure gradient, the recovery of the velocity
profile begins to slow down as can be seen by the inflection point in Figure 3-7B. If the gradient
becomes too high then the flow will eventually separate and the flow will reverse, as seen in Figure
3-7C (22).
As mentioned earlier, the flow around a sail is disturbed by a number of elements such as the mast
or the forestay which creates excessive adverse pressure gradients. Figure 3-8 shows a typical

14
pressure distribution over a head- and mainsail operating together. Below that the phenomena that
affect this distribution have been illustrated. It is clear that the leeward side low pressure
contributes the most to the pressure differences that creates lift. It is also more sensitive to
separation.
Figure 3-7: The boundary layer under various pressure gradients:
(A) favourable (B) adverse (C) excessive adverse
Figure 3-8: Pressure distributions over a main and headsail (7)
The stagnation streamlines shown in Figure 3-9 are enough to explain the interaction between the
main- and headsail. As the distance, or gap, between the two sails is reduced the streamlines are
deviated to windward, especially on the headsail, and also the flow rate over the leeward side of the
mainsail is reduced. This phenomenon is known as upwash. The interaction between the sails has
negative and positive attributes but overall the product is improved performance, and not just due
to the increase in sail area (19).

• Effects on the mainsail
› The oncoming flow deviates less towards the leeside
moves closer to the leading
and therefore reduces the risk of separation.
• Effects on the headsail
› The AoA and the amount of flow on the leeward side are increased and therefore
the sail can produce more power.
› The flow velocity is also increased on the leeward side which improves the ef
and reduces the risk of stall.
Figure 3-
The flow off the trailing edge of the headsail may also impinge on the leeward side of the main.
can create a high pressure where the headsail overlaps the main. It is very noticeable where the
mainsail takes on an S shape. This is known as back
As a sail has a finite length and a pressure difference between the two sides there is a flow at the
head and foot between these two sides, from the high to low pressure. This circulation creates tip
vortices and reduces the efficiency of the sail through
drag (19). As a result of this cross
approach zero towards the head or foot
not known at present. It was therefore difficult to incorporate into this work.
3.1.4 Forces and Moments
The resultant force from a foil for a given application
or useful work and another that acts in an undesired direction
components depends on the application.
perpendicular and parallel directions relative to the oncoming
and side force are relative to the direction of motion
relevant, which can be seen graphically in
15
The oncoming flow deviates less towards the leeside and the stagnation point
closer to the leading edge (downwash). This reduces the pressure gradients
therefore reduces the risk of separation.
The AoA and the amount of flow on the leeward side are increased and therefore
the sail can produce more power.
The flow velocity is also increased on the leeward side which improves the ef
and reduces the risk of stall.
-9: Stagnation streamlines on the main- and headsail
The flow off the trailing edge of the headsail may also impinge on the leeward side of the main.
create a high pressure where the headsail overlaps the main. It is very noticeable where the
shape. This is known as back-winding.
As a sail has a finite length and a pressure difference between the two sides there is a flow at the
head and foot between these two sides, from the high to low pressure. This circulation creates tip
vortices and reduces the efficiency of the sail through loss of energy. This reduction is called induced
of this cross-flow it can be assumed that the pressure difference across the sails
towards the head or foot. Exactly how quickly and over what distance
It was therefore difficult to incorporate into this work.
oments Generated by the Sails and Rig
for a given application generally has a component that does
nother that acts in an undesired direction. How this force is resolved into these
components depends on the application. Lift and drag are the components
perpendicular and parallel directions relative to the oncoming flow, or apparent wind
and side force are relative to the direction of motion (5). In the case of a yacht
can be seen graphically in Figure 3-10.
and the stagnation point
). This reduces the pressure gradients
The AoA and the amount of flow on the leeward side are increased and therefore
The flow velocity is also increased on the leeward side which improves the efficiency
The flow off the trailing edge of the headsail may also impinge on the leeward side of the main. This
create a high pressure where the headsail overlaps the main. It is very noticeable where the
As a sail has a finite length and a pressure difference between the two sides there is a flow at the
head and foot between these two sides, from the high to low pressure. This circulation creates tip
loss of energy. This reduction is called induced
flow it can be assumed that the pressure difference across the sails
distance this occurs is
component that does positive
. How this force is resolved into these
Lift and drag are the components resolved into the
apparent wind, whereas drive
a yacht the latter is more

16
Figure 3-10: Force components on a sail
Depending on the hydrodynamics of the boat used the performance tends to deteriorate rapidly
beyond a certain heel angle. Depowering the sails so as to reduce the heel angle may result in a
faster boat speed, even if the drive force is also reduced. Depowering can be achieved by twisting,
flattening or reefing the sails (16).
It is possible that for two identical boats, one with their sail trimmed to the maximum lift while the
other has theirs slightly eased, that the latter will have a larger drive force and smaller side force
resulting in a smaller heeling moment. This is the case when the latter’s resultant force points more
into the direction of motion due to the easing of the sail (5). This observation was confirmed by Viola
and Flay (7).
These points highlight the relevance of being able to measure the drive force and heeling moment
directly on a set of sails while sailing.
Figure 3-11: Change in force components due to sail trim
Below in Figure 3-12 the forces and moments produced by the sails of a yacht and the sign
conventions used for them in this paper are shown. Take note that these forces are named
differently to the boat motions due to waves. For example the translation in the X direction would
then be called surge. The moments however have been labelled the same but these are relatively

steady moments that along with the hydrostatic and
determine the steady heel, trim and leeway angles.
Figure
The origin of the coordinate system is at the aft base of the mast. The moments are positive in the
directions according to the right
positive axis then the fingers on that hand point in the
The aerodynamic force (FA) create
from the hydrodynamic forces
buoyant forces. FA and FH are distrib
singular points which are approximated by the geometrical centres of the sails
body, known as the Centre of Effort
approximation is used for simplicity as the
boat’s attitude (19). To better understand the force balance that occurs in heel refer to
This is highly simplified 2D case
positive direction of the moment is indicated around the
acts through the centre of buoyancy
17
steady moments that along with the hydrostatic and –dynamic behaviour of the yach
determine the steady heel, trim and leeway angles.
Figure 3-12: Forces and moments created by the sails
The origin of the coordinate system is at the aft base of the mast. The moments are positive in the
right-hand rule where if one points their thumb in the direction of the
positive axis then the fingers on that hand point in the positive moment direction.
creates the moment that heels the boat over. There is also a contribution
from the hydrodynamic forces (FH) and these moments are balanced by the
are distributed loads but their resultants can be assumed to
approximated by the geometrical centres of the sails
Centre of Effort (CE) and Centre of Lateral Resistance (CLR) respectively. Th
used for simplicity as these points will migrate depending on the sails’ trim or the
To better understand the force balance that occurs in heel refer to
This is highly simplified 2D case which does not include the force components in the x direction
positive direction of the moment is indicated around the centre of gravity (CG). The
centre of buoyancy (CB).
Figure 3-13: The heeling force balance
dynamic behaviour of the yacht would
The origin of the coordinate system is at the aft base of the mast. The moments are positive in the
where if one points their thumb in the direction of the
positive moment direction.
e boat over. There is also a contribution
and these moments are balanced by the gravitational and
resultants can be assumed to act through
and the underwater
(CLR) respectively. This
will migrate depending on the sails’ trim or the
To better understand the force balance that occurs in heel refer to Figure 3-13.
the force components in the x direction. The
(CG). The buoyancy force

18
The heeling moment (HM) calculated around the CLR is:
�� � ��. � (3.7)
This is balanced by the righting moment (RM) taken around the CG:
�� � ∆. � (3.8)
FA can be resolved into the components acting parallel (Fz) and perpendicular (Fy) to the mast. The
HM can then be calculated using the horizontal and vertical distances to the CLR as moment arms.
�� � ���. � �!. " (3.9)
Note the sign convention for Fy is negative to starboard and therefore the contribution to the
moment is positive in this direction.
If the forces and location of many discrete points are known for # points at $ heights then HM can be
approximated by:
�� � ∑ ∑ ���� &' . &' � �! &'. (&''& � (3.10)
The structures that make it possible for a boat to carry its sails, such as the mast, stays and even the
boat itself, do not generate drive themselves however they do generate a force. This drag force,
known as windage, generally slows the boat down and heels it over more. When measuring the
forces in a wind tunnel using a force balance or simulating the boat speed in a VPP these forces need
to be accounted for. A common method for testing windage in a wind tunnel is to remove the sails
and measure the forces of the structure independently. This gives a reasonable prediction, however
it should be noted that the air flow is drastically changed when the sails are removed. Richards et al.
(23) conducted a study of how much the windage measurements were affected by this and found
that the force in the x direction was reduced by as much as 2/3 and the force in the y direction
increased by as much as 1.7 times.
Forces and moments are expressed in non-dimensional coefficients in order to compare results
between different tests conducted at different wind speeds or with different sails thus making
scaling of the results simple.
Force coefficient:
�) � )��*+, (3.11)
Moment coefficient:
�- � -��*+,../ (3.12)
where � is the force, � is the moment, � is the dynamic pressure upstream and 0123 is a reference
area. The reference area can be the actual surface area of the sails, which is useful if skin friction or
viscous stress is being assessed, or it can be the planform area of the sails. This is can be calculated
using the sail area formulas from section 3.1.1.

19
This is the area used in this paper. For CM a reference dimension is needed, such as the mast length;
however this does not take into account the extra area of a square top rig compared to a triangular
mainsail. Thus 01234.5 is used as the reference moment arm (16).
3.2 Difficulties in Measuring Pressure
There are numerous difficulties in measuring pressures, especially at full-scale. The following
sections detail a few of these issues.
3.2.1 Issues due to Measuring Equipment
The YRU has developed through various projects a sound understanding when it comes to measuring
the pressure on sails. In this section some of the issues that had to be solved are discussed.
A transducer can either have one side connected to the point of interest and the other connected to
a reference pressure or it can read a differential pressure by connecting one side of the transducer
to the suction and the other to the pressure side of the sail. A diaphragm inside the transducer is
deflected according to the pressure difference. This is outputted as a voltage signal; the greater the
deflection the greater the voltage. Generally this analogue signal needs to be converted to a digital
signal by an analogue-to-digital (A/D) converter.
In a dynamic system the pressures fluctuate constantly, as discussed in the following section 3.2.2. If
the dynamic response is of interest then the tube length connecting the pressure tap to the
transducer has a significant influence; the longer the tube the longer the response time. This tends
to attenuate the peaks of the signal. However when a time-averaged recording is taken the mean
will not be affected significantly as the reduction in both the maximum and minimum peaks will
negate this influence (11).
Another significant issue is that of the geometry of the tapping. Some research had been carried out
by Flay and Millar (11) into how the taps themselves affect the pressure readings. It was seen that
pressures were measured lower than a reference flush mounted tap. This may be due to the flow
accelerating over the tap and thus reducing the pressure locally. Even in the case of a flush mounted
tap, where a PVC tube is trimmed to be flush with the surface, it can often still have a lip after
trimming. This lip could create a local separation of the flow over the tapping and reduce the
reading. Any proposed surface mounted tap should therefore be tested for its effect on the pressure
reading.
3.2.2 Fluctuations in Readings due to Pressure Environment
To illustrate how unsteady the environment is the following observations can be made. Assuming a
wind velocity of 3 m/s at model-scale or 10 m/s at full-scale and a ∆CP of 4 then the range of
pressures to be measured would be ±20 Pa or ±240 Pa respectively. This pressure range is relatively
small for the following fluctuations that the environment experiences.
The atmospheric pressure at sea-level can vary between 95,000 – 105,000 Pa due to the main
weather systems and shifts over time can be as high as 8 Pa/min with a rapidly approaching low or
high pressure. This can significantly affect the pressures measured throughout a day of testing or
even between two consecutive runs. Ideally the atmospheric pressure should be recorded during the
sampling period as a reference. From equation 3.5 it can be seen that the dynamic pressure is

20
influenced by the square of the wind velocity. Therefore even a 10% increase in a 10 m/s wind can
result in a pressure shift of 12.6 Pa.
The atmospheric pressure also varies in height at around 12.5 Pa/m. This can be significant even at
model-scale. The difference in height should be noted between the measurement point and the
reference point or alternatively a differential pressure could be recorded, i.e. the difference
between both sides of the sail measured on one transducer, as these shifts will then be cancelled
out (24).
3.2.3 Difficulties to Zero the System at Full-Scale
Electronic measuring systems have a tendency to drift in the readings. This can cause an error in the
readings if it is not accounted for. This applies to the pressure measuring system at both model- and
full-scale as well as the force balance in the wind tunnel. In the wind tunnel it is easy to switch the
wind off and allow the air to settle so that all the pressure transducers are measuring the same
pressure and thus has no deflection of the diaphragm. This allows the measurement equipment to
be brought back to a zero reading.
However at full-scale it obviously is not possible to switch off the wind. This poses a serious
challenge. In order to apply same pressure on both sides of the transducer some methods were
proposed including luffing, furling or dropping the sail.
Luffing is the term used when the sails are eased or the boat heads too directly into the wind so that
the sails are left to flap in the wind. No drive is created and it can be assumed that over a period that
the pressures will be equal on both sides. This however is dependent on how accurately the
helmsman can steer the boat; alternatively he may steer the boat through a zigzag over the direction
of the wind so that each side of the sail creates a positive and a negative pressure for equal periods
during the zeroing. Another concern is when the sails flap in the wind or flog it could potentially
damage or dislodge the pressure sensors.
Furling of both the sails is possible on boats fitted with furlers. This is when the sail is rolled up
around the forestay for the headsail or inside the boom or mast for the main. Usually the sail is
furled tightly but this would not be possible as it would damage or dislodge the sensors. By sailing
downwind when furling it is possible to furl the sail loosely but there is no guarantee that it still will
not be damaged. Also the trailing edge sensors will likely still be exposed. On the test boat there is
no furling mechanism for the mainsail.
The last option, and the most viable, is to drop the sails. The headsail can then be placed into a bag
and the mainsail under its cover. Care should be taken to close most gaps in the covers but provided
that the pressure inside is reasonably constant inside then a zero can be achieved.
3.3 Theory behind VSPARS
Visualisation of Sail Position And Rig Shape (VSPARS) was used to measure the shape of the sails. It
was developed at the YRU by David Le Pelley and Owen Modral and was designed to be a simple
system that could handle large perspective effects and sails with large curvatures using off-the-shelf
cameras. The system uses one deck-mounted camera for the headsail and one camera for each tack

21
of the mainsail. It is possible to record in 3D the global position of a specific number of horizontal
stripes on the sail, which are marked out in neon orange tape to allow for easy recognition.
The user must input the 3D position of the camera relative to a datum, usually on the centreline at
the base of the aft surface of the mast, the length and height along the luff of each stripe and lastly
the camera angle. This angle then is used to determine the twist of the stripes in the 3D space. Once
everything is setup and running the luff positions of the stripes with the sails under no load need to
be manually defined within the image of the sail. This is then used as the base position of the mast
and forestay; any deviation from this is then calculated and used to determine the translation of the
stripes and the rig deflection.
The system is then ready to capture the sails. The first step of the program is to pass up and down a
user defined line that crosses all the stripes and look for pixels of the specified colour. A filter may be
necessary to improve this step. Once found the program then sweeps perpendicular to these points
and defines the bottom edge of the stripe. This process is aided by user defined settings such as
trim, which defines how steep the gradient of the curvature can be, or jump, which allows the search
function to jump an obstruction like a drop of water on the lens or a stay. The pixels of the stripe are
then defined in coordinates of the picture.
The luff and the leech are identified and the distance of each from the camera is calculated using the
known heights and the calculated twist angle. The chord line is now defined. Using the camera
position an Euler rotation is performed so that the camera is numerically placed directly below this
line. This allows the stripe and its depth to be seen in 2D. A length is then guessed for the chord and
offsets are estimated from the chord to the stripe. The length of the stripe is calculated using a
known relationship of millimetre to pixel at varying heights and then compared to the known stripe
length. Iterations are performed until they match.
The offsets are then applied to the chord in the global 3D space before the rotation, whereby the
coordinates in this space can be calculated. The output is in the form of x, y and z coordinates for
each stripe. Other data of the stripes is also calculated and given, such as twist, entry and exit angles
(8).
3.4 Full-Scale vs. Model-Scale or Numerical Testing
In a perfect world when designing a new sail the sail would be manufactured and flown by one of
two identical boats sailing alongside in a constant breeze. Immediately it would be obvious which
design was more suited for the heading chosen. Failing that a VPP is used to predict which will be
faster. One of the inputs for these is the principal force components of the sails.
The two most common tools used to find these forces are CFD and wind tunnel testing. Both
however have significant drawbacks. CFD is extremely useful for testing of upwind sails where the
flow is mostly attached, therefore simple potential flow solvers can be used effectively. Downwind
sails on the other hand can be fully separated along a chord; thereby needing more powerful RANSE
based solvers which take viscous effects into account. These solvers require much more computing
power, take longer to run and need to be validated which makes them extremely expensive.
Furthermore modelling a soft sail, where the code is able to predict the flying shape of the sail,
makes the process much longer requiring many iterations before the shape is found.

22
Wind tunnel testing is able to test all kinds of sails in constant, easily recreated conditions and using
sail cloth that behave much like the full-scale product. However it is unknown how accurate these
results are when scaled to the full dimensions. Scale factors are often not satisfied as getting the sail
to fly in the correct shape is of utmost importance. Results comparing two sails are deemed reliable
in the qualitative sense but the difference between model- and full-scale is still not understood well
enough (16).
3.4.1 Details of the Twisted Flow Wind Tunnel (TFWT)
The TFWT, first built in 1995, was the first wind tunnel purpose built for testing of yacht sails. The
feature that made this tunnel famous was the ability to change the flow direction at different
heights using vertically twist vanes. This is necessary to accurately recreate the conditions
experienced by an actual yacht sailing by the power of the wind. As mentioned in section 3.1.3 all
surfaces with a fluid flowing over it has a boundary layer; this is also the case for the earth. This
creates a velocity gradient in the vertical direction. When a yacht is moving forward the wind that it
experiences is known as the apparent wind, as opposed to the true wind. This is the resultant
velocity between the true wind and the boat’s speed. Because of the atmospheric boundary layer
the direction of the apparent wind as well as the speed changes vertically. This effect is most notable
when sailing downwind (19).
The tunnel itself is an open-circuit wind tunnel 3.5 m high and 7 m wide. Two 46 kW fans with a
diameter of three metres each and four blades suck air into the tunnel. Stators then remove some of
the rotation applied to the air before it passes through a honeycomb air-straightener. A fine mesh
further removes turbulence from the air. The following section of the tunnel can be used to create
the vertical velocity gradient by either adding roughness elements to the floor or by placing beams
across the width. The twisted vanes are the last stage before the open test platform. The yacht
models are placed into frame that sits in a trough filled with water to prevent air flowing below the
yacht. The frame is connected below the platform to a six-component force balance capable of
measuring the three principal forces and moments. To keep blockage effect to a minimum the
models used are limited to roughly 2 m high. More details can be found in (16).
3.5 Curve Fitting Techniques
One of the major parts of this work was to recreate the sails’ full shape and pressure distribution
from discrete points. In order to ‘fill the gaps’, especially at the extremities, an interpolation of the
data points was necessary. Please note that extrapolations may also be referred to as interpolations
when referring to them collectively.
3.5.1 Interpolation
MATLAB has a built-in function for interpolations. It is easy to select either a linear or a spline
function for the curve but one has to be careful to use these appropriately. In Figure 3-14 one can
see that the spline function recreates the peak very well but the curve veers off significantly towards
the trailing edge. This is only one example but it is clear that without control over the degree of the
spline curve and good monitoring checks inherent in the process the desired curves could become
heavily distorted. Although the linear scheme also has it draw backs, it is much more predictable. It
may not be able to recreate the smooth curves that the spline scheme can but neither will it create
local peaks or troughs where there should not be any.

23
Figure 3-14: Comparison of different interpolation schemes used for a typical chordwise pressure distribution
3.5.2 Least Squares
Least squares curve fitting is also a useful curve fitting technique in cases where it is assumed that
there is some deviation in the data points from the actual curve. It is able to find the best fit curve
within a scatter of points by minimising the sum of the squares of the vertical distance between the
curve and the data points. These are known as the residuals and can be seen in Figure 3-15.
Figure 3-15: The "best" fit curve through a scatter of data points (inset: vertical offsets)
With this method one can then control the degree of the curve relatively easily but constant checks
would be necessary to determine which degree works best for each curve. However some curves
cannot be represented accurately at all using this method and for some applications it may be
desirable for the curve to pass through the actual data points.

24
Figure 3-16: Two examples of a 3rd degree least squares curve fitted to a typical pressure distribution compared to a
linear interpolation
In Figure 3-16A the least squares method arguably recreates the curve relatively accurately and
captures a pressure peak that may have been missed by the sparse measurement points. However
when considering Figure 3-16B it is clear that the curve has entirely missed the leading edge
separation bubble although the rest of the curve fits the data points very well.

25
4 Pressure Integration over Sail Shapes
A code was developed using MathWorks® MATLAB to handle the output data from the pressure and
shape measuring systems and to predict the forces and moments created by the sails. Firstly the
code recreates the sails from the VSPARS coordinates. Then the discrete pressure measurements are
extrapolated over the sail area in order to obtain a full distribution. Finally these pressures are
multiplied by the normal vectors of a relevant area to find the force and then by moment arms to
find the moments.
These steps are described in detail in the following section. Refer to Appendix 1 for the base code,
Appendix 2 for some formulas and derivations used in the code and to the attached CD for the full
program with data files.
4.1 Inputs for the Integration
Various inputs are required for the recreation of the sails and calculation of the forces. These are
detailed in the following sections.
4.1.1 Shape Input
The data of interest from VSPARS is the x, y and z coordinates of each stripe which is used to
recreate the sail shape. In order to recreate it as accurately as possible some additional information
about the sail is required. A spreadsheet for each sail needs to be filled out so that the code can find
this information when necessary. VSPARS also outputs data regarding each stripe such as camber
and twist angle, which has not been used to recreate the shape but was useful in validating the
code. An example of the data spreadsheet has been given in Table 4-1.
Table 4-1: Data sheet for code
st NoSS NoSP l_h l_f z_h z_f clew x_h leech
2 3 4 12 702 1880 11 NA 25 1855
Pressure Data
Stripe
B
Stripe
D
Stripe
F
Stripe
H
Legend
Height 300 700 1100 1500 st Sail Type
Length 573 439 299 148 NoSS Number of Shape Stripes
# of Taps 11 10 8 8 NoSP Number of Pres. Stripes
Arc% 0.03 0.04 0.05 0.09 l_h Length of Head
0.05 0.10 0.09 0.17 l_f Length of Foot
0.12 0.12 0.15 0.25 z_h Height of Head
0.16 0.23 0.19 0.32 z_f Height of Foot
0.25 0.29 0.22 0.41 clew Position of Clew
0.32 0.39 0.34 0.52 x_h Position of Head
0.37 0.51 0.54 0.72 leech Length of Leech
0.48 0.64 0.72 0.92
0.59 0.78
0.79 0.91
0.90

26
The recreation of different types of sails can vary, for instance the mainsail is constrained by the
boom while the headsail is not. The first value, Sail Type, prompts the code to use different functions
where necessary.
Number of Shape Stripes and Pressure Stripes are the number of horizontal coloured stripes or
groups of pressure taps along the sail. This aids the extraction of the relevant data from the input
files and the subsequent handling of the data within the code; in other words it tells the code how
many times a loop needs to be run or how big an array is.
The Length of Head is the measured length of the head of the sail. Even in the case of the headsail it
should not be assumed that it comes to a point at the head. It can be assumed for a square-top
mainsail that the head does not hold any camber, i.e. the head can be assumed to be a straight
edge. This length, along with the Height of Head, is used to define the head.
For the foot the extrapolated shape down to the Height of Foot may not necessarily be the correct
length. The Clew Position for the main and the Length of Leech for the headsail along with the Length
of Foot are used to trim and scale the foot. More detail on how this is done can be found in section
4.2.
4.1.2 Pressure Input
In the bottom left-hand block of Table 4-1 some required data about the pressure system is given.
The height of the taps can be assumed to be constant along a chord. This height is then used in
defining the measurement point on the sails along with the percentage of arc length along the
section. The length of each section is used to calculate this, either directly in the spreadsheet or
within the code. The number of taps per stripe is also required which the code uses to extract the
correct corresponding data from the pressure input file.
The pressure data format for this work varied with each of the tests conducted. Ideally the pressures
should be presented as a differential across a singular point on each side of the sail but this was not
always possible. For the first test with the Semi-Rigid sails the pressures on either side were
recorded simultaneously by separate transducers and presented in the same output file. It was then
fairly straight forward for the code to calculate the differentials. For the core flute sails it was only
possible to record pressures on one side of the sail at a time and with slightly varying dynamic
pressure. Therefore the pressures were first reduced to a coefficient and the differentials were
calculated directly in Excel before input into the code. For the full-scale test the pressures were
recorded as differentials but were in an entirely different format as it was a totally new system. The
output was recorded in bits and had to be converted to pressures within the code using a calibration
and a zeros file.
4.1.3 User Input
In order for the code to run correctly there are a few still a few parameters that need to be set by
the user. The code can be used to only generate sail shapes and therefore the pressure interpolation
and force calculation must be switched on or off. The run numbers of interest need to be selected.
This may be for an entire test, just one sweep within it or just one particular run. The resolution of
the interpolation, i.e. how many points to use, also needs to be defined. The more points used will
increase the accuracy, especially for the sail shape, but that will also decrease the speed of the code.

27
Finally the tack of the boat needs to be specified to aid the recreation of the head and foot so that
they point in the right direction.
4.2 Sail Shape Generation
In order to be able to calculate the forces in the correct directions an accurate recreation of the
shape was necessary. Using the output coordinates of the luminescent stripes placed on the sails
from VSPARS and some measured data of the sail as well as a few assumptions it is then possible to
do so. Furthermore, as VSPARS is a commercial package utilised by top racing teams from the
America’s Cup, Volvo Ocean Race and more, there may be interest in a code that can output a
geometry file for use in CFD. This could be an important tool used to validate the design and
manufacturing processes. The steps involved in this recreation are detailed in the following section
The function file ‘extract_data3d’ is called first. In here a shape file is read and the x, y and z
coordinates for each stripe are extracted and isolated. Then for each stripe the coordinates are
parametized by their arc length percentage. In other words the arc length from the leading edge to
each point is calculated and divided by the total arc length. It is then possible to interpolate using
the spline scheme to find the x and y coordinates for the user defined chordwise resolution. This
scheme should be able to fit a fair curve for most sail shapes either with a 2nd
or 3rd
degree function
depending if the sail clearly has an inflection point or not. This loop is carried out for each stripe for
one sail at a time and independent matrices are outputted for the x, y and z coordinates for each
sail. Each column in the matrix is thus one stripe starting with the lowest stripe in the first column.
The result can be seen in Figure 4-1.
Figure 4-1: Stripes with user defined number of points
The next function file called on is ‘get_head_foot’. This file extrapolates the measured stripes to find
the head and the foot of the sails. The first step is to extrapolate the luff points to the foot and head.
This then gives the shape of the mast. A spline function is used to capture the bend in the tip of the
mast. For the head it is assumed that firstly it never comes to a single point and will always have

28
some length and secondly that it does not carry any camber; in other words the head is always a
straight line. This has been seen from experience. The angle of twist is then calculated for each
stripe from the luff and leech points and extrapolated. The head is then found using this angle and
the measured length of the head. This step requires the user to define whether the yacht is sailing
on port or starboard yacht so that the program knows which side to create the head.
The foot is created from the extrapolated luff and leech points plus a point from a predefined
camber and draft location. A 2nd
degree curve is fitted through these points. On a fair shaped sail,
such as those used for the model tests, this step would not be required and all points along the
stripes could be extrapolated down to this height, however, as will be seen, the full-scale sails had
inflection points along the chord. Ideally the camber and draft should be extrapolated from the
known stripes but due to time constraints this has not been implemented.
The above mentioned method to define the foot does not necessarily obtain the correct length of
the foot and therefore a scaling of the length is necessary. The main is slightly simpler than the
headsail as it can be assumed to be horizontal or constant height at the boom. Thus this is handled
within this function file but the headsail is dealt with later. In order to scale the foot it needs to be
centred at the origin and rotated by its twist angle so that the trailing edge is on the x axis. The x
coordinates can then be scaled by the known clew position:
(&6 � (& 6 789:; (<= > (4.1)
Now the clew is in the correct position but the arc length is still larger or smaller and therefore the Y
coordinates are iteratively scaled by the measured length of the foot over the current length of the
arc until the length of the arc equals the length of the foot. The foot is then rotated back to the
correct twist angle and returned to the correct position of the tack.
Figure 4-2: The basic sail shape extrapolated to the head and foot

29
The full sail is now represented by x, y and z matrices with the number of columns equal to the
number of stripes on the sail plus one column for the head and one for the foot. At this point the full
shape can be recreated but the surfaces are not well defined as the resolution is very poor, as shown
in Figure 4-2. The next function file, ‘resolution’, increases the spanwise resolution by interpolating
the x and y coordinates to the user defined resolution of the z coordinates. This again uses a spline
function, otherwise the surface would maintain the linear shape of the measured stripes. At this
stage the heights of the interpolated pressure points for the mainsail are found simply halfway
between the shape points. The sails now have a much more natural shapeas seen in Figure 4-3 and
the coordinate matrices now take the following form: (?? (�? … (A?(?� (�� … (A�B(?< B(�< C B… (A<
where 8 is the user defined resolution and for # � 1: F the subscript 1# is now the foot of the sail
and 8# is the head.
Figure 4-3: Sails generated at a high resolution
Finally the jib foot is dealt with in ‘jib_foot’. It is not correct to assume that the jib’s foot is horizontal
so therefore a method had to be employed to find the correct position of the clew. This is very
difficult to measure during testing, especially at full-scale, so a numerical method was developed.
The leech length can be measured and so this was used to trim the sail by iteratively calculating the
interpolated leech length starting from the head until the length was greater or equal to the
measured value. For this operation the higher the spanwise resolution the smaller the error is, as the
length will be defined as the next largest pre-existing height of the cells. This data point is then
assumed to be the new clew position. The foot coordinates then need to be recalculated along the

30
line joining the tack and the new clew. First the Z coordinates are found by dividing the clew height
by the number of points chordwise. Then for each point along the chord the height is found between
it and the head. This height is then divided by the number of points spanwise to give the ∆Z between
each cell. A new Z matrix can then be created using these values. The X and Y coordinates are then
interpolated to these Z values. A linear function can be used here as the resolution is now high. As
can be seen in Figure 4-4 the cells on the headsail have now been skewed slightly.
Once this is done the foot length can be scaled in the same fashion as for the main. In this case, as
the shape matrix is already in the full resolution, the shape needs to be re-interpolated to remove
the kink at the foot that has now been created. Five columns are isolated; one for the foot, one for
the head and three roughly at the heights of the original stripes, although they have now been
skewed. These five stripes are then used to interpolate the full sail shape once again.
Figure 4-4: Picture showing the cut and skewed cells on the headsail
The desired pressure points are located in the middle of each cell. At this point only the heights are
calculated as half the distance between the shape point heights. The sail geometry is now final and
the coordinate matrices can be exported.
The final step before moving onto the pressure section is to calculate the normal vector and area for
each cell on the sail. The cross product of the diagonals of each cell in fact gives the normal vector in
x, y and z components with their respective magnitudes equal to twice the projected area of the cell
for each direction. The proof of this theorem can be found in Appendix 2.
4.3 Pressure Integration over the Sail
Once the sail geometry has been defined the next stage is to take the discrete pressure
measurements and interpolate them to find the complete pressure distribution over the sail. Once
this is found the forces and moments can be found by multiplying the pressure at the centre of a cell
by its area in the projected x, y and z directions.
‘pressureA’ extracts the data form the pressure file. It requires some data regarding the number of
the taps which is found in Table 4-1. The pressure data, depending on the system, comes in different
formats therefore this file requires some user manipulation before it will function correctly. Some of
the variables that require different approaches are the file’s format, i.e. text or excel spreadsheet,
and if the data is divided into leeward and windward pressures or if it is already a set of differential

31
pressures. Provided that the pressure variable ‘P’ is outputted to the base code in the correct format
then the code will function correctly. The only difference to this matrix compared to the shape
matrix is that if there are different numbers of taps on different stripes then the matrix size will be
defined by the stripe with the most taps. An example is given here in Table 4-2 of a data set for 4
stripes with 11 taps on the bottom and lower middle stripe, 10 on the upper middle and 6 on the top
stripe. Zeros are used to fill the gaps.
Table 4-2: Example of a pressure matrix with varying number of taps
0.9028 0.8689 1.365 1.4802
1.0612 0.441 1.3851 1.3807
0.6513 0.5682 1.5497 1.4055
0.6611 0.8846 1.3902 1.3171
0.6968 1.1902 0.9668 0.9836
0.7464 1.3438 1.1203 0.7819
0.7929 1.3795 1.4367 0
0.7883 1.3655 1.4662 0
0.7836 1.2724 1.401 0
0.7541 1.1762 0.0818 0
0.3832 0.3336 0 0
Now ‘pressresoA’ is called to first map where on the sails the measurements are taken and then to
interpolate the pressures over the sail at the desired resolution.
In the opposite way that the shape points needed to be parametized into arc length percentages,
the pressure points are given in the arc length percentage or distance along the arc and their x and y
coordinates need to be found. First coordinates at a known distribution need to be found at the
height of the pressure measurements. A simple interpolation is done here between the x and z and
then the y and z coordinate matrices to the height of the measurements. These coordinates are at
the user defined chordwise resolution which is defined in arc length percentage. They can then be
interpolated to the arc length percentages of the actual pressure taps. Now the pressure points are
defined in x and y on the sail.
Same as for the distribution of pressure points in the spanwise direction, the chordwise distribution
for the pressures are defined as the points halfway between the shape points. The x and y values
need to be found for this distribution at the measured heights. This is another simple interpolation
of the coordinates from the measured arc lengths to the desired chordwise ones.
It is possible now to interpolate the measured pressure values to these coordinates. The curves of
the pressures vary quite significantly and are seldom regular, in other words cannot easily be fitted
with a spline curve. These issues are mentioned in section3.5. So the pressures are interpolated
linearly from the x and y values of where they were measured to the desired chordwise distribution.
These pressure values, as well as the x and y coordinates, are then interpolated along the spanwise
direction. As mentioned in section 3.1.3 in theory there should be a decrease of the pressures
towards the head and foot of a sail. However the form of this is not known and therefore cannot be

32
recreated accurately. It was also mentioned that it can be safely assumed that it occurs fairly rapidly
over a short distance and thus the pressures have been left as is.
4.4 Force & Moment Calculation
With the normal vectors of each cell having the magnitude of twice their area, as explained in
Appendix 2, and the interpolated pressures at the centre of each cell the forces can now be
calculated simply in the x, y and z directions.
�G � ∑�&' 6 HG &' 2= (4.2)
This operation is done for all three directions and for both sails. The contribution from each sail is
totalled together to find the resultant force acting on the yacht.
The Side Force reported in the results is in the plane of the force balance therefore it is a function of
Fy, Fz and the heel angle (β).
�J&K2 � �! cosO � �� sinO (4.3)
To find the moment equation 3.10 is used. The heeling arm is longer than the distance from the data
points to the datum and so this needs to be accounted for.
4.5 Verification & Validation
The main purpose of the model testing that is covered in detail in following chapters was to validate
the written code. The results for the pressure integration of these tests are covered in their
respective sections, but here other results and checks are presented to verify that the code was
functioning as desired.
4.5.1 Sail Area Calculation
The theorem that the cross product of the two diagonals of a quadrilateral equals the normal in the
x, y and z directions with their magnitudes equal to twice the projected area in that direction was
verified by calculating the projected areas of each cell assuming they are parallelograms. The cells
are in fact slightly tapered towards the head and therefore a mean base value b between the two
sides was used. The difference of this comparison was ±0.9% thus proving the accuracy of the
theorem. The area of a parallelogram is given in Figure 4-5 and the equation for its area is as follows:
0�R12SSTU1RV � �. � (4.3)
Figure 4-5: Area of a parallelogram

33
4.5.2 Sail Dimensions
For the mainsail the parameters of the foot length and clew position are scaled to the exact
measured values.
The headsail’s foot length is also scaled to the measured value but the leech length calculation is
dependent on the spanwise resolution. For 50 points the leech length is larger than the measured
value by 2% while for 100 points it is only 1% larger.
These scaling operations ensure that the sail has the correct shape and dimensions.
4.5.3 Integration of Uniform Pressure Field
A check was conducted using a uniform pressure distribution, i.e. the pressure distribution across all
taps equal to 1 Pa. The result was used to check that the results for the drive and side forces were in
fact the pressure multiplied by the area. The results confirmed this with the forces created equal to
the projected area in the respective directions.

34
5 Model Test 1: Semi-Rigid Sails
The main objective of this work was to record pressure distributions and shapes of full-scale sails
and to calculate their forces. In order to accomplish this with the required level of confidence the
system had to be validated. This was done in the YRU’s Twisted Flow Wind Tunnel (TFWT).
The first test was conducted on semi-rigid fibreglass upwind sails. They had been previously used at
the YRU and were constructed using glass fibres and epoxy resin on a male mould milled by CNC. The
reason for using semi-rigid sails instead of soft, flexible cloth sails was two-fold. Firstly the shape was
fixed which allowed it to be easily measured. This helped the development of the sail shape
recreation. Secondly the weight of the pressure taps would have distorted the flying shape of the
sails as the cloth needs to be extremely light in the wind tunnel. This is highly important for them to
function in the same way as full scale sails. Also this would have created an irregular pressure
distribution and the shape would have been more complicated to recreate.
5.1 Test Setup: Semi-Rigid Sails
The model rig can be seen in Figure 5-1. This section goes into the details of the testing equipment
used and the procedure followed during the test.
Figure 5-1: Overhead view of the Semi-Rigid test setup in the wind tunnel
5.1.1 Details of Semi-Rigid Sails and Pressure System
It was decided to use three VSPARS stripes on the headsail and four on the main as the headsail was
significantly shorter. This is known as a fractional rig, i.e. the headsail terminates at a fraction of the
mast height. The stripes were placed at 1/4, 1/2 and 3/4 luff heights on both sails and the fourth one
for the main at 7/8. It was felt for the best accuracy in the pressure and shape integration that the
pressure taps should be positioned as close to these stripes as possible. It was important to not
obstruct the camera’s view of the bottom edge of the stripes and therefore the taps were placed
above them.
A brief study of the pressure distributions along the intended heights of the taps using a VLM was
conducted in order to determine the ideal location of the pressure taps along the chord. By a
process of elimination these distributions were recreated using the least number of taps. Figure 5-2

35
shows a typical recreation of a distribution along a chord using only 7 points. For the full list of
pressure tap locations refer to Appendix 4.
Figure 5-2: Graph showing the recreated pressure distribution along a chord
The same pressure data acquisition system and transducers were used as in (15), (7), (14) and (21).
For more details refer to (15). For the pressure taps it was initially desired for them to be able to
measure two points directly across the sail thereby a differential pressure could be measured. A
concept for a block shaped tap to encase two tappings, one for windward and one for leeward, was
proposed. A small hole could be made in the sail with the leeward hole of the tap aligned with it,
allowing it to simultaneously measure both sides of the sail. These taps were fabricated and tested
against a tap that had previously been used in Flay & Millar (11) at the YRU. These other taps will
henceforth be referred to as the coin tap. Both taps and their measurements can be seen in Figure
5-3 and Figure 5-4. The results of this test can be found in Appendix 3. Both taps saw a reduced
pressure compared to a reference, flush mounted tap. The coin tap’s reading was 14% less while the
drop was twice as large for the block tap.
Figure 5-3: Coin tap (dimensions in mm)
Figure 5-4: Block tap (dimensions in mm)

36
Following this result it was decided rule out the block tap completely and to use flush mounted PVC
taps for the more critical, leeward side and the coin taps for the windward side where the flow is
less sensitive to disturbances. Unfortunately the size of the coin tap made it impossible to place the
tappings exactly where the VLM study dictated or the leeward and windward tappings on the same
chord, especially at the leading edge. Therefore the leeward taps were placed at the intended
heights and positions while the windward taps, which see less variation or steep gradients, were
placed 10 mm below and when they could not fit in the chordwise direction they were staggered,
alternating 10 mm above and below the leeward line. This can be seen in Figure 5-5. For the
calculations they were assumed to be at the intended positions. The flush mounted taps were glued
in place using a quick curing epoxy while the coin taps were stuck down using double-sided tape.
Figure 5-5: Picture of taps on the top stripe at the leading edge of the mainsail
In Figure 5-5 it can also be seen how the PVC tubing is lead aft above the locations of the taps. They
continue this way till the trailing edge. For the headsail the tubing was then attached to the shrouds
and lead down to the transducer box on the deck, while for the mainsail the tubes were lead onto an
independent stand and then back onto the transducers. This can be seen in Figure 5-6. In order to
keep the sail’s surface as clean or unobstructed as possible this was deemed the best option
although the system was then technically not floating free on the force balance. The tubes were
given enough slack to minimise this interference.
Figure 5-6: Picture of mainsail, PVC tubing and stand from astern

37
5.1.2 Test Procedure for the Semi-Rigid Sails
Tests were conducted at 20° heel and an AWA of 25°. Three sweeps of sail trims were tested,
meaning the sails were trimmed as tight as possible and then eased out in small increments. The
three sweeps were for the mainsail only, the jib only and then both simultaneously, referred to here
as the combined sweep. Including the initial trim eight positions were tested for each sweep. The
main, jib and combined sweeps are referred to as MS, JS and CS respectively with the suffix 0
indicating the initial trim position and 1, 2, 3… for every trim thereafter.
The YRU have conducted windage tests on their models and have the data readily available.
However in this case the influence of the PVC tubing could not be ignored. In order to find the
windage of the tubes the test setup had to be recreated without the presence of the sails. Spare
tubing was cut, bundled and placed in roughly the same positions and at the same attachment
points. The tubes on the mainsail were attached at the same height but directly onto the mast.
Twisting the wind is considered unnecessary for low AWAs as the effects are insignificant.
Furthermore the exact simulation of full-scale was unnecessary to validate the system. Therefore no
vanes were used for this test.
5.2 Results: Semi-Rigid Sails
The following section presents the most interesting data collected from the test. For a more
comprehensive collection of the force and moment results refer to Appendix 5 but for all the test
data please refer to the attached CD.
5.2.1 Semi-Rigid: Recorded Pressures
As the pressures were recorded separately for the leeward and windward sides the pressure
distributions could be compared to the theory in 3.1.3 and particularly Figure 3-8. For the 1/2 luff
height Figure 5-7 clearly shows the leading edge separation and reattachment on the headsail as
well as the mast separation and reattachment on the mainsail. The headsail exhibits a small amount
of trailing edge separation as the CP value does not return to zero, whereas the mainsail remains
fully attached to the trailing edge.
Figure 5-7: Figures of pressure distribution around the Semi-Rigid sails
-2
-1,5
-1
-0,5
0
0,5
1
0 0,2 0,4 0,6 0,8 1
CP
% of arc length
Headsail - 1/2H
MS0 lee MS0 wind
-2
-1,5
-1
-0,5
0
0,5
1
0 0,2 0,4 0,6 0,8 1
CP
% of arc length
Mainsail - 1/2H
MS0 lee MS0 wind

38
The sweeping of the sails also exhibited trends that were expected. Figure 5-8 and Figure 5-9 show
the 1/4 luff heights on the head and mainsail respectively as the headsail is eased out from the
tightest trim possible, trim position 0, to fully out, trim position 7.
Figure 5-8: Differential pressure reading on Semi-Rigid headsail for the sweep of the headsail
For the headsail:
• For the first change in trim from JS0 to JS1 the separation bubble is decreased but from 20%
along the arc the pressure is slightly higher. This could be due to increased upwash as the
mainsail loading is increased.
• The following trims see a reduction in the pressure distribution. This is probably due to the
decrease in AoA.
• For the leading edge separation bubble it can be seen that as the sail is eased the bubble
reduces in size until the sail no longer separates at the leading edge. This occurs between
trim position 2 and 3
• After trim position 5 the sail begins to see a positive pressure on the leeward side resulting
in a negative ∆CP. As the sails are Semi-Rigid they did not collapse or deform as a normal
cloth sail would and still managed to provide a drive force, but essentially these trim
positions are of no interest to normal sailing conditions.
Figure 5-9: Differential pressure reading on Semi-Rigid mainsail for the sweep of the headsail
-0,5
0
0,5
1
1,5
2
0 0,2 0,4 0,6 0,8 1
ΔCP
% of arc length
Headsail - 1/4H
JS0
JS1
JS2
JS3
JS4
JS5
JS6
-0,5
0
0,5
1
1,5
2
0 0,2 0,4 0,6 0,8 1
ΔCp
% of arc length
Mainsail - 1/4H
JS0
JS1
JS2
JS3
JS4
JS5
JS6
JS7

39
For the mainsail:
• The high pressure field at the trailing edge of the headsail has a negative effect on the
overlap region of the mainsail. As the headsail is eased out the gap is increased and these
negative effects are reduced, thus increasing the performance of the mainsail as can be seen
in Figure 5-9.
The pressure contour plots for the first run in the jib sweep are shown in Figure 5-10 and Figure
5-11. The contour plots of similar sails using a VLM, developed by Julien Pilate at the YRU, have also
been presented in Figure 5-12 and Figure 5-13. Note that the VLM sails are on starboard tack while
the Semi-Rigid sails are on port.
Comparing the contours from the VLM to the Semi-Rigid sails there are some marked differences.
There appears to be a large trough close to the leading edge of the Semi-Rigid mainsail which is not
seen in the VLM, while large pressure peaks at the leading edge toward the head of the VLM sails is
not seen on the Semi-Rigid sails. The pressure at the head of the Semi-Rigid headsail starts low and
builds to the peak aft of halfway along the chord. This is a very different trend than seen in the VLM.
Generally the pressure distributions and the behaviour through the sweeps looked reasonable
across most of the sail except at 3/4H on the headsail. This is where the density of pressure taps was
highest and is the most likely location where the flow would have been disturbed.
The results from the VLM are still only theoretical and it has been mentioned that numerical
methods such as this cannot capture separation of the flow. Also this method does not include the
mast on the mainsail which could account for the lack of a pressure peak on the main. The results
from the VLM can show roughly what to expect but cannot be used definitively.

40
Figure 5-10: Pressure contour plot of Semi-Rigid mainsail for JS0
Figure 5-11: Pressure contour plot of the Semi-Rigid headsail for JS0

41
Figure 5-12: Pressure contour plot of the mainsail using a VLM
Figure 5-13: Pressure contour plot of the headsail using a VLM

42
5.2.2 Semi-Rigid: Forces & Moments
Here the results from the code are presented and discussed.
To validate the results the calculated forces were compared to the windage corrected
measurements from the wind tunnel force balance using this equation:
0W:XYZ: [#\\:X:F8: �]�8Y98^9Y_:[ �`:Ya^X:[�`:Ya^X:[ 6 100
The sign convention is therefore negative when the calculation is under-predicted and positive for
an over-prediction.
The standard deviation, given in percentage, is then a measure of how much the average difference
for each run fluctuates around the mean over the entire sweep. This gives an impression of how
close the trend is replicated.
Figure 5-14 gives an example of a typical set of results for a sweep. The actual force balance readings
and the windage corrected readings are shown against the calculated results. The trends are clearly
well reproduced. This is corroborated by Table 5-1 which shows that the standard deviations for all
the sweeps were less than 6%. However there is consistently a large under-prediction of the forces
and moments.
Table 5-1: Force & moment results for Model Test 1: Semi-Rigid
Average Difference (%)
Standard Deviation (%)
Jib Sweep
Drive Force -31.1 4.8
Side Force -12.6 3.2
Roll Moment -19.0 2.5
Main Sweep
Drive Force -27.7 3.4
Side Force -10.0 1.7
Roll Moment -13.8 1.3
Combined Sweep
Drive Force -30.5 4.4
Side Force -15.2 5.2
Roll Moment -21.5 5.4
The results from the force and moment calculation are encouraging as the trends are reproduced
very well. However they were under-predicted by a margin that was too large to have full confidence
in the system.
As mentioned in 3.1.4 the windage correction may be affected by removing the sails when
measuring it. If the observations by Richards et al. (23) were applied to these results the correlation
would be far better. Without conducting further tests this is merely conjecture.
The code was thoroughly checked for bugs using the methods outlined in section 4.5 and was found
to be functioning correctly and could not explain the drastic differences between the calculations
and the force balance readings. This lead to the conclusion that the test setup was less than ideal.

43
5.2.1 Semi-Rigid: VPP Results
The results from the code and the measurements from the force balance were used in a VPP to
estimate the boat speed (Vs) and heel angle of the boat. The force balance readings were used as is
but for this comparison the calculated results had to be corrected for windage. The VPP can either
be run by keeping the heel angle that the boat was tested at fixed and varying the theoretical wind
speed to match this heel angle or by fixing the TWS and calculating the theoretical heel angle. For
this case both options have their flaws although technically the former is the standard method. By
fixing the heel angle it is harder to directly compare between two runs as the TWS will be different,
while if the heel angle is allowed to change then the affects that has on the aerodynamics of a sail
are not accounted for. These affects are explained in detail in (19), (20) & (5). For the sake of
comparison the latter option was used for the following predictions.
The plots of boat speed and heel angle are shown for each run in Figure 5-15 and Figure 5-16. The
results for boat speed are, as expected, significantly under-predicted while the trends match fairly
well, although there appears to be a slight convergence as the boat speed drops. The heel angle for
the calculated force results however does not follow the trend as well. Note from Figure 5-17 that
the heeling moment curve is offset as normally the heel would be zero at zero heeling moment. This
is because a canting keel is included in the VPP model. This is able to counteract the heeling moment
and therefore the heel is zero even when the moment is a substantial.
The VPP results were not encouraging, although the method of fixing the TWS is questionable. This is
highlighted by the heeling moment vs heel angle curve in Figure 5-17 where the two curves do not
coincide.
Note the two dips in Vs for the jib sweep at run 4 and 7. This is due to the camera having accidentally
been slightly moved during the test run. This shows how sensitive the drive force results are, as the
same affect is not seen for the heel angle.

44
Figure 5-14: Results for each trim position in the combined sweep of the Semi-Rigid Sails
0
0,05
0,1
0,15
0,2
0,25
0,3
1 2 3 4 5 6 7 8
CF
run #
Combined Sweep - Drive Force
Pressure & Shape
Integration
Force Balance
Readings
Windage Corrected
Force Balance
-1
-0,9
-0,8
-0,7
-0,6
-0,5
-0,4
-0,3
-0,2
-0,1
0
1 2 3 4 5 6 7 8
CF
run #
Combined Sweep - Side Force
Pressure & Shape
Integration
Force Balance
Readings
Windage Corrected
Force Balance
0
0,1
0,2
0,3
0,4
0,5
0,6
0,7
0,8
0,9
1 2 3 4 5 6 7 8
CM
run #
Combined Sweep - Roll Moment
Pressure & Shape
Integration
Force Balance
Readings
Windage Corrected
Force Balance

45
Figure 5-15: VPP predicted boat speed (Vs) for Semi-Rigid
Figure 5-16: VPP predicted heel angle for Semi-Rigid
Figure 5-17: Heel moment (Mx) vs VPP predicted heel angle for Semi-Rigid
0
2
4
6
8
10
12
14
0 8 16 24
(kn
ots
)
run #
Vs
measured
calculated
Main
Sweep
Jib
Sweep
Combined
Sweep
0
5
10
15
20
25
30
0 8 16 24
(de
g)
run #
Heel
measured
calculated
Jib
Sweep
Main
Sweep
Combined
Sweep
0
5
10
15
20
25
30
0 5 10 15 20 25 30
Mx
(N
m)
Heel (deg)
measured
calculated

46
5.3 Summary of Results for the Semi-Rigid Test
Generally the measured pressures were in good agreement with the previous work. There were
however areas where the pressure seemed more distorted than others, in particular the 3/4H of the
headsail. This suggests that, at least at model-scale, the effect of the pressure taps, the way in which
they are held in place and the presence of the PVC tubing that conveys the pressure to the
transducers cannot be ignored. The VPP results show the inaccuracy of the test setup. Therefore an
alternative means of testing the system was desired. The possible sources of error are discussed in
the following section.
5.3.1 Possible Sources of Error for the Semi-Rigid Test
The reduction in the pressure measurement seen by the coin tap was unavoidable, but when
factored in this would reduce the actual pressure differential on average by 3%. The test was for a
single tap with no other interference around it, however as seen in Figure 5-5 the pressure taps may
have seen even more interference, especially towards the leading edge. Arguably these taps have a
larger influence on the drive force as the normal vectors of the relevant surface are oriented more
towards that direction.
Upon inspection some of the flush mounted taps on the leeward side appeared not to be trimmed
right down to the sail, again especially towards the leading edge. That may have been due to the
epoxy used to set the tubes in place not having cured sufficiently and allowing the tubes to move
further through. These ridges can be seen in Figure 5-18. This may also have contributed to a
reduction in the local pressure at the taps.
The stand used to lead the PVC tubing off the trailing edge of the mainsail may also have influenced
the force balance readings. This setup was not ideal but another solution could not be found.
Figure 5-18: Photo of ridges found on the leeward, flush mounted taps

47
6 Model Test 2: Coreflute Sails
Following the testing conducted on the Semi-Rigid sails it was decided to utilise the sails built and
used by Fluck et al. (15). Using a special core they managed to create airtight flutes on the inside of
the sail to transfer the pressures down to the transducers on the deck. This eliminated the possible
influence from the tubing and the coin taps on the flow around the pressure tappings. The idea was
that using these sails would prove if this was what caused the large under-predictions in Model Test
1 of the forces and moments or not.
6.1 Test Setup: Coreflute Sails
The use of the new sails slightly affected the test procedure. These changes are highlighted here
along with a description of the sails themselves.
Figure 6-1: Overhead view of the Coreflute test setup in the wind tunnel
6.1.1 Description of the Coreflute Sails
The sails are made of fibreglass reinforced epoxy with a Coreflute® sandwich core. They were
laminated on a male mould and put under vacuum pressure to ensure a high quality product.
Coreflute® is a corrugated plastic board material most commonly used for advertising or real-estate
signs. The product has two sheets of polypropylene joined by transverse walls thus creating airtight
flutes. These flutes were oriented in the spanwise direction so that tappings could be perforated
straight through the sail and by covering the hole on one side at a time the pressure could be
transferred to PVC tubing connected to the foot of the sail. This tubing was then connected to the
transducers. In this way no interference on the flow around points of interest would be created.
Figure 6-2 shows the sails construction and the heights of the pressure taps (15).
Many tappings were perforated into the sail by the previous users and often more than one tap was
connected to a single flute. Furthermore over time through general wear and tear some flutes were
leaking and there had been some delamination of the fibreglass/epoxy from the core which
rendered some flutes unusable. For the purposes of this work a range of independent tappings over
a range of heights was needed, such as for Model Test 1. Much time was spent repairing the sails,
locating the usable taps and deciding which rows would give the best distribution over the chord-
and spanwise directions.

48
Fiberglass skin Pressure tap
Pressure taps on one side of sail sealed with tape
18
60
B
D
F
H
D
F
H
J
K
I
15
00
1
10
0
70
0
30
0
50
0
90
0
X X
Section X-X:
13
00
1
50
0
19
00
1
70
0
22
00
Corrugated plastic as used for core
690
646
Pneumatic tubes or “flutes”
Figure 6-2: Cross-section of the Coreflute sails and location of pressure tap rows (15)
For the Semi-Rigid sails the tap heights were placed at a fraction of the luff height, but as can be
seen in Figure 6-2 these taps were placed at 200-400 mm intervals along the vertical height. Table
6-1 shows the rows of taps used in this study and the corresponding percentage of luff height (H).
For a full list of locations of the taps refer to Appendix 4.
Table 6-1: Rows used and corresponding percentages
Mainsail
C F I K
0.14H 0.43H 0.71H 0.90H
Headsail
B D F H
0.16H 0.37H 0.58H 0.80H
The VSPARS stripes were limited this time to three on both sails. From the previous test it was felt
that this was enough to recreate the sails adequately. These were placed at 1/4, 1/2 and 3/4 luff
heights on both sails. Thus the pressure taps were not located as close to the VSPARS stripes as
before. Neon green stripes were used in this test as a new filter was being tested for the VSPARS
system.
For these sails a 3D modelling file in .igs format was available from which the mould was created.
This in theory provided the actual sail area with which to validate the code. The sail area and
pressures directly influences the results from the integration, so therefore this is a valuable check.

49
6.1.2 Test Procedure: Coreflute Sails
The same baisc procedure was followed as for the Semi-Rigid sails. The exact trim positions used
were not recorded sufficiently to recreate from this test but the same method was used, i.e. the sails
were trimmed to the tightest position and gradually eased in small increments. The number of trim
positions recorded was reduced to five as during the post-processing of the data from Test 1 it was
seen that further easing of the sails resulted in positive pressures on the leeward side. These trims
would not be of much interest for normal sailing conditions using flexible cloth sails. They would not
be able to hold the same shape that the rigidness of these sails allowed.
As each tapping was connected directly to both sides of the sail two runs were needed for each trim
position. The tappings on one side were taped closed so that the measurements could be recorded
for the other side. The tape was then switched to the other side and the test repeated for the same
trim position before moving to the next one. In order to remove the influence of slight free-stream
dynamic pressure variations between the two runs the pressure results were converted to
coefficients before finding the differential. The shape data was averaged over both runs, although it
was assumed that the shape was constant throughout the testing.
The same pressure measuring system for Model Test 1 was used in this test, but a different model
boat and rig were used. It was found that the rig used in the previous test was bent significantly and
could not be straightened through tensioning of the rigging. It was also desired to better
accommodate the boxes of transducers on the deck.
6.2 Results for the Coreflute Sails
The data presented here aims to highlight the differences from the Semi-Rigid test.
6.2.1 Coreflute: Recorded Pressures
The pressure distributions from Figure 5-7 are included in Figure 6-3 for comparison purposes. It
appears in Figure 6-3 that the taps were not close enough to the leading and trailing edges at 0.58H
on the Coreflute headsail to capture the separation if it occurred. For the Semi-Rigid headsail the
local maximum pressure at the leading edge occurs roughly between 6-10% of the arc length. The
taps on the Coreflute headsail are located at around 6 and 10 % and no closer, therefore they may
have captured the local maximum but not the steep drop off seen for the Semi-Rigid sails.
What can also be seen here, but will be clearer in Figure 6-4, is that the Coreflute sails manage to
produce a higher ∆CP. The local minimum occurs at around 35% on the Coreflute headsail while
there is a large gap on the Semi-Rigid sail from 20-75% arc length. However comparing the values
available at 20% arc length on both headsails it can be seen that on the leeward side the Coreflute
sails have a CP of -2 while the Semi-Rigid only have -1.5.
The mainsail is mostly the same in both cases although there is a noticeable plateau of the leeward
pressures on the Coreflute sail from 30-60% arc length. This may be visible due to the higher density
of taps in this area.

50
Figure 6-3: Figures of pressure distribution around Semi-Rigid and Coreflute sails
The importance of the pressure tap distribution is highlighted in the above comparisons between
the Semi-Rigid and Coreflute results. When extrapolating data points where they have not captured
a negative to positive shift in gradient that should have been seen the delta pressure at the leading
edge will be greatly under-predicted. Without the taps closer to the leading edge capturing this
gradient shift and establishing the correct trend then the pressure distribution will not be captured
correctly.
The differential pressure distributions for the Coreflute sails, seen in Figure 6-4 and Figure 6-5 show
similar trends for both sails across the sweep compared to the Semi-Rigid sails in Figure 5-8 and
Figure 5-9. The obvious differences have been covered above regarding the pressure distribution on
both sides of the sails.
The pressure contour plots for the main- and headsail for the initial trim position of the jib sweep are
shown in Figure 6-6 and Figure 6-7. For the headsail the same large pressure peak towards the head
that was seen in Figure 5-13 of the VLM headsail is present. However this was not the case for all the
trims.
-2,5
-2
-1,5
-1
-0,5
0
0,5
1
0 0,2 0,4 0,6 0,8 1
Cp
% of arc length
Coreflute Headsail - 0.58H
JS0 wind JS0 lee
-2,5-2
-1,5-1
-0,50
0,51
0 0,2 0,4 0,6 0,8 1
Cp
% of arc length
Coreflute Mainsail - 0.43H
JS0 wind JS0 lee
-2,5
-2
-1,5
-1
-0,5
0
0,5
1
0 0,2 0,4 0,6 0,8 1
Cp
% of arc length
Semi-Rigid Headsail - 1/2H
MS0 lee MS0 wind
-2,5
-2
-1,5
-1
-0,5
0
0,5
1
0 0,2 0,4 0,6 0,8 1
Cp
% of arc length
Semi-Rigid Mainsail - 1/2H
MS0 lee MS0 wind

51
Figure 6-4: Differential pressure reading on Coreflute headsail for the sweep of the headsail
Figure 6-5: Differential pressure reading on Coreflute mainsail for the sweep of the headsail
0
0,5
1
1,5
2
2,5
3
0 0,2 0,4 0,6 0,8 1
∆Cp
% of arc length
Headsail - 0.58H
JS0
JS1
JS2
JS3
JS4
0
0,2
0,4
0,6
0,8
1
1,2
1,4
1,6
1,8
0 0,2 0,4 0,6 0,8 1
∆Cp
% of arc length
Mainsail - 0.43H
JS0
JS1
JS2
JS3
JS4

52
Figure 6-6: Pressure contour plot of Coreflute mainsail
Figure 6-7: Pressure contour plot of Coreflute headsail

53
Arguably the pressure contours were smoother for this test showing that the flow was less
disturbed. This indicates that the tappings were able to capture a better pressure distribution
corresponding to the whole sail. This, as opposed to measuring a locally disturbed flow while the
rest of the sail operates under an undisturbed flow, would result in a closer match of the force
balance and calculated results.
The number of rows of pressure tappings was increased from three to four and the location of the
top and bottom stripes were much closer to the head and foot of the sail. This may also have
improved the pressure map across the full sail.
6.2.2 Coreflute: Sail Area and Depth
The VSPARS system was validated using the Coreflute sails. Measurements of the depth or camber of
the sails were measured at 50 mm increments along the chord line for the first 150 mm and
thereafter in 100 mm increments. The estimated error margin in these measurements was ±2 mm.
These were then compared to the average sail shape over all the sweeps in the Corefulte test. As the
sails were very rigid their shape is assumed to be constant even though they were loaded in the
VSPARS measurements and not for the manual ones.
The results are presented as a percentage difference between the VSPARS and measured values
over the chord length.
�:X8:F_YZ: [#\\:X:F8: � ��cd0�c �`:Ya^X:[�8�eX[ 9:FZ_� 6 100
The sign convention for draft is thus positive where the VSPARS found the position to be further aft
and for camber where it found it deeper.
As can be seen in Table 6-2 the draft is generally found by VSPARS to be further aft and the camber
to be deeper than the actual sail. This can be seen visually in Figure 6-8.
Table 6-2: Percentage difference between VSPARS and measured values
Mainsail (values in %)
Top Middle Bottom Average
Draft 4.46 1.44 4.18 3.36
Camber 0.08 0.13 0.48 0.23
Headsail (values in %)
Top Middle Bottom Average
Draft -1.04 2.98 3.05 1.67
Camber 2.54 1.62 1.18 1.78

54
Figure 6-8: Comparison of VPARS to measured values for camber and draft
As mentioned in section 6.1.1 there was a digital 3D model, in .igs format, available for these sails.
From this, using 3D software, a precise sail area could be found to validate the area calculation done
by the code. The calculated area for the headsail was found to be 8% smaller than what was found
using this file, while the mainsail was 4% less. However after comparing the measured values of the
edges of the sail, i.e. the foot, luff, etc., it was found that they did not match up exactly. By
calculating the nominal area of the sails using equations 3.1 and 3.3 and comparing the difference
the error margin was estimated at ±3%.
The results from this section were somewhat contradicting. Although the sail area is under-predicted
by the calculation compared to the 3D model, VSPARS has a tendency to over-estimate the depth of
the sails which should result in an over-prediction. The accuracy of the 3D model is questionable as it
was found that the edge lengths of the sails did not match up.
Without a more accurate measurement of the actual sail area this validation method is misleading.
6.2.3 Coreflute: Forces & Moments
The results here are expressed in the same fashion as for the Semi-Rigid sails, where a negative sign
indicates an under-prediction of the results from the code compared to the force balance.
As can be seen in Table 6-3 the average difference and standard deviation for each run was
significantly improved, however the drive force was still under-predicted more than the other forces
and moments. This could be due to the low density of pressure taps close to the leading edge for
some rows. Figure 6-9 shows the same plots as for the Semi-Rigid sails where the trends and
differences can be compared visually.
0
10
20
30
40
50
60
0 50 100 150 200 250 300 350 400
Ca
mb
er
(mm
)
chord length (mm)
Headsail - 1/2H
Actual
VSPARS

55
Table 6-3: Force & moment results for Model Test 2: Coreflute
Average Difference (%)
Standard Deviation (%)
Main Sweep
Drive Force -16.5 2.8
Side Force 8.9 5.5
Roll Moment -5.0 3.7
Jib Sweep
Drive Force -12.8 1.9
Side Force 3.2 2.3
Roll Moment -6.5 1.8
Combined Sweep
Drive Force -19.4 6.0
Side Force 5.7 3.0
Roll Moment -8.9 2.4
6.2.4 Coreflute: VPP Results
The results were run in the same fashion as for the Semi-Rigid sails. The boat speed in Figure 6-10
was still slightly under-predicted, as was expected from the comparison of the forces. Interestingly
the jib sweep, which was arguably the most accurate when comparing forces and moments, shows
the largest under-prediction in Vs. The comparison of the heel angle in Figure 6-11 shows a good
agreement between the two data sets. The righting moment curve in Figure 6-12 are more closely
matched than they were for the Semi-Rigid sails.
Again it should be mentioned that the results in this section are not definitive but are an interesting
assessment of the quality of the results. The results, as expected from the force and moments
compared to the force balance, showed a better agreement for boat speed and heel angle than the
Semi-Rigid results.

56
Figure 6-9: Results for each trim position in the combined sweep of the sails
0
0,15
0,3
0,45
1 2 3 4 5
CF
run#
CS - Drive Force
Pressure & Shape
Integration
Force Balance
Readings
Windage Corrected
Force Balance
-1,2
-1
-0,8
-0,6
-0,4
-0,2
0
1 2 3 4 5
CF
run#
CS - Side Force
Pressure & Shape
Integration
Force Balance
Readings
Windage Corrected
Force Balance
0
0,2
0,4
0,6
0,8
1
1,2
1 2 3 4 5
CM
run#
CS - Roll Moment
Pressure & Shape
Integration
Force Balance
Readings
Windage Corrected
Force Balance

57
Figure 6-10: VPP predicted boat speed (Vs) for Coreflute
Figure 6-11: VPP predicted heel angle for Coreflute
Figure 6-12: Heel moment (Mx) vs VPP predicted heel angle for Coreflute
0
2
4
6
8
10
12
14
16
0 5 10 15
(kn
ots
)
run #
Vs
measured
calculated
Main
Sweep
Jib
SweepCombined
Sweep
0
5
10
15
20
25
30
0 5 10 15
(de
g)
run #
Heel
measured
calculated
Main
Sweep
Jib
Sweep
Combined
Sweep
0
2
4
6
8
10
12
14
0 5 10 15 20 25 30
Mx
(N
m)
Heel (deg)
measured
calculated

58
6.3 Summary of the Results for the Coreflute Test
The results across the board are significantly improved from the Semi-Rigid test. But there are a
number of elements that have changed from Test 1 to Test 2. The most obvious change was the
removal of the pressure taps, PVC tubing and support stand and the increase in pressure tappings.
The number of taps was increased and this contributed to a better definition of the pressure
distribution across the chord. This may have increased the accuracy of the results. Even the large
suction peaks seen in the VLM contours were defined, although the constant increase in pressure
does not decrease towards the head. The capturing of this was not the case for all the test runs but
more research is required as to when this peak should or should not be present. The VLM results can
only be used as a rough guide as to what may occur due to the reasons stated in section 5.2.1.
Notably it does not include the mast and it is safe to assume that the large peak seen on the main in
the VLM does not actually occur in reality.
Overall the agreement between the calculations and the measurements were very good, especially
in the VPP results. This proves that this system could potentially be used to assess the performance
of sails as it is capable of obtaining the same information as the force balance in the wind tunnel.
The advantage of this system is that it can be applied in the same way to sails on a full-scale yacht.

59
7 Full-Scale Testing
With the confidence attained through the model testing and with a newly developed pressure
system ready for use the testing was taken to the water aboard David Le Pelley’s Stewart 34. The
testing was done over two days with the first predominately used for troubleshooting the issues that
came up. The second day saw fine weather with a fresh breeze of around 10-15 knots, ideal
conditions for upwind testing.
7.1 Test Equipment
A completely new pressure system was used in this test for the first time. The following section gives
the details of this system along with some additional equipment that was used alongside this
project.
7.1.1 Details of the Pressure Measuring System
The development of the system detailed below was done by David Le Pelley. Some assembly,
calibration and testing was done by the author.
The same type of pressure transducers used at model-scale, Honeywell XSCL04DC, were used at
full-scale, however in this case it was desired to place the transducers on the sails. This avoids a
number of issues mentioned in 3.2.1, such as the influence of long pressure tubing and not needing
to record a reference pressure by measuring the differential pressure across the sail. However the
minimum dimensions of the pressure tap were limited by the size of the transducer.
A housing for the transducers was designed with two openings, one on either side, in line with the
openings of the transducer when assembled. Figure 7-1 shows the two parts to the housing and the
transducer nested in the half which is attached to the sail. They were limited by the transducers to a
diameter of 40 mm and a height of ±9.5 mm. Rubber o-rings were used to seal the connection
between the transducer and these openings which were clamped in place when the tap was
assembled using four screws.
An operation amplifier (op-amp) was connected directly onto each transducer which amplifies their
analogue output (in mV) to a signal in the ±2.5 V range. Using ribbon cable and IDC connectors the
transducers were easily connected to a ribbon cable running along the chord. A maximum of 8 taps
per chord was possible, limited by the number of individual wires in the 11 wire ribbon cable. 3 wires
were common for all the taps leaving 8 for the analogue output from each tap to be sent.
Each chordwise cable terminated on an analogue-to-digital (A/D) converter chip which converts the
analogue voltage signal into a 12-bit digital signal. Theoretically the system can handle 10 of these
chips, and therefore 10 sets of 8 transducers. This work was limited to 3 due to the budget and the
infancy of the system. The A/D chips were connected to a continuous ribbon cable along the luff of
the sail which terminated at a microcontroller box at the tack. All the A/D chips shared 6 common
wires for supply voltage, signal sending, etc. but each required an independent wire that the
microcontroller uses to call on each chip one at a time. The microcontroller also provided a time
stamp on the recordings. For a diagram of the full system refer to Figure 7-2.
Data acquisition of a single tap could occur at a frequency of 3000 Hz and so for 24 taps, 8 per stripe
for 3 stripes, the frequency was reduced to 125 Hz. However there was a high frequency noise from

60
the power supply that disturbed the signal. It was possible to filter this signal by averaging over 30
readings for each transducer. This resulted in an effective frequency of 7.5 Hz.
The transducers themselves are temperature compensated and provide a range of ±1 kPa. Therefore
from the 12-bit A/D resolution the effective resolution was 0.5 Pa per bit. This is a significant
improvement on the system used in the full-scale testing done by Viola (7). This can be further
improved by changing the resistor adjacent to the op-amp. This can be seen in the calibration file
found on the attached CD where the taps towards the leech used different resistors and did not
provide a resolution as high as the others (25).
Figure 7-1: Two piece housing for the pressure transducer (25)
Figure 7-2: Schematic of the wired pressure system (25)

61
7.1.2 Calibration of the Pressure Transducers
In order to read a pressure from the transducers they had to be calibrated and a zero reading
needed to be recorded.
The calibration was dependent on the resistance in the wire connecting the tap to the A/D converter
and therefore the taps had to be setup on the sail before this could be done. Before they were
finally stuck onto the sails the taps were clamped using a purpose built calibration jig. This jig was
designed to secure a rubber tube to one side of the transducer while allowing the ambient pressure
onto the other side. Then the tube could be connected to a calibrator so that a known pressure
could be applied to the diaphragm inside the transducer. By recording three pressures and the
corresponding reading in bits from the data logger a slope could be found. The gradient (m) can then
be used along with a zero reading to calculate the pressure for any reading in bits (θ) from equation
7.1.
� � �f�fg+*h�V (7.1)
Once the calibration gradients were found for all the taps they were left for a day. Some taps were
then recalibrated to assess the amount of drift. This was found to be negligible and so they did not
require recalibration before testing.
For the actual testing the transducers recorded the fluctuating pressures over an acquisition period.
The period was determined by how steady the conditions were. The time was increased if the
conditions were more erratic. The results were then averaged over this period.
7.1.3 Setup of the VSPARS Stripes
The 3 VSPARS stripes used in the Coreflute test proved adequate to recreate the sails. Again they
were placed at 1/4, 1/2 and 3/4 of the luff height. The sail shapes, much the same as for the
pressures, were averaged over the data acquisition period to account the fluctuations of the
unsteady environment.
7.1.4 Setup of the Pressure Taps
Again it was desired to locate the taps close to the VSPARS stripes as it was thought that this would
improve the accuracy. The tap location study conducted using the VLM for the Semi-Rigid test
proved to be ineffective. The nature of the peaks and troughs of a pressure field move depending on
the trim of the sail. The limit on the number of taps meant that the placement of them needed to be
refined for this test. The pressure results of both model tests were thoroughly analysed to assess the
most appropriate positions.
For the mainsail the first tap was placed as close to the leading edge as possible, 35 mm from the
luff, to capture the leading edge suction peak. It was seen that any measurements taken within the
first 10% of the arc length were likely to be located in the large separation bubble created by the
mast and thus record similar pressures as to the first tap. Then the highest gradients in the pressure
field occur between 10% and 25%. To capture this four taps were placed, starting at 10%, at 5%
intervals. The pressure peaks between 25% and 45% after which it plateaus until around 70%. Three
taps were therefore placed at these percentages. The last tap was placed at 95% to be able to assess
the trailing edge separation.

62
The pressure distribution at the leading edge of the headsail is more critical and the high gradients
occur earlier on along the arc length. The first tap was again placed as close as possible to the
leading edge followed by three taps placed at 4% intervals going up to 12% along the arc. The rest of
the distribution follows what can be described as a sine curve. To capture this adequately the
remaining taps are placed at regular intervals of 24% starting from 24%, i.e. 24%, 48%, 72% and 96%.
Perforations were burnt through the cloth at the desired locations to connect the taps to both sides
of the sails. For areas of more than a single layer of cloth, such as near the luff rope and on other
patchings, the layers were melted together thereby sealing them. The tap could then be stuck to the
sails using double-sided tape placed around the opening as seen in Figure 7-3A. This also provided a
sufficient seal enclosing the opening of the transducer and the perforation in the sail. From the study
conducted on the full-scale tap geometry, refer to appendix 3, a patch of sail cloth with a hole
perforated in the middle was used to cover the tap in order to improve its aerodynamics, this can be
seen in Figure 7-3B. This was also stuck to the tap using double-sided tape. The edges of the patch
were stuck down onto the sail in the same fashion. The density of the taps at the leading edge of the
top stripes made it difficult to use separate patches for each tap and were placed under the same
patch. This can be seen in Figure 7-3C. It can also be seen how the ribbon cables, IDC connectors and
A/D chips were secured to the sail using sticky-backed sail cloth.
The taps were placed on the starboard side of the sails. This means that on port tack they were on
the leeward side and windward on starboard.
(A) (B)
(C)
Figure 7-3: Pictures of the pressure taps being mounted to the sail

63
7.1.5 The Sails Used
An old main and headsail were used for the test. They were the only sails available that the owner,
David Le Pelley, was willing to have holes burnt into. They were fairly stretched and thus much
deeper than the sails that would normally be flown on this type of boat. It was seen through the
VSPARS program that the average depth of the mainsail was 15% of the chord length while a good
sail should be no more than 10%.
The headsail was an overlapping jib hoisted on a roller-furler. The roller-furler forestay was relatively
large with a cross-section of roughly 30x15 mm.
7.1.6 Additional Equipment
Full advantage of all the resources of the YRU was taken. The boat was rigged with as much data
capturing equipment as possible. A GPS and all the data from the boat instruments were logged to
provide additional information regarding the speed of the boat, heading, AWA and AWS.
Two sonic anemometers were installed at the top of the mast and off the stern to measure the wind
velocity and angle and boat motions, while an Inertial Measurement Unit (IMU) was used to
measure the boat motions at the masthead. These measurements were part of a project conducted
by Boris Horel who was researching the turbulence of the wind. However some of the data from this
equipment was useful for the work presented here, such as the heel angle from the IMU and the
AWS and AWA from the anemometers.
7.2 Test Procedure and Observations
The test was heavily weather dependant as the taps would be rendered useless if the holes became
water logged and the sails and sheets used were old and stretched making sailing difficult in heavy
winds. The testing was scheduled for the 18th
– 20th
of July, right in the middle of the New Zealand
winter. Fortunately these days were graced with ideal weather for testing. The first day, when all the
equipment was setup, the wind was a light breeze which made the process easier. Once everything
was operating correctly it was possible to sail out and mark the sheets on either tack to the same
positions. The wind was not strong enough to collect any useful data that day. The sheets were
removed from the headsail at the end of the day as the sail required some extra work. It was
attempted to mark the position of the knot although it proved difficult to reattach them the next day
at the same place.
On the morning of the second day the wind had increased to a very stable, moderate breeze around
10-15 knots with a sea state of 3-4 on the Beaufort scale. A zero reading of the pressure system was
taken on the way out of the marina with the sails in their covers. The sails were then hoisted but it
was noticed that the zero readings on some taps on the headsail were not taken correctly. These
taps were located towards the luff and so a furling method to zero the taps was tried. This seemed
to work adequately and it was proved that the taps and A/D chips could handle being loosely furled
without damage.
Referring to Figure 7-4, the number 1 course was the jib sweep on starboard (stbd) tack. Number 2
was again the jib sweep but on port. This was followed by the main sweep on port at 3 and then on
stbd at 4. Number 5 was the stbd combined sweep. All sweeps were begun with the sails sheeted

64
tightly in and eased in increments of 100 mm on the sheet. The final trim returned the sails to the
initial position of the sweep.
During the tack to port after this sweep the sails accidently were allowed to flog and a pressure tap
was dislodged from the headsail but remained attached to the ribbon cable. Repairs were required
and so the anchor was dropped in Te Whau Bay on Waiheke Island. A zero reading was taken at this
point. Repairs were done and another zero reading was taken. Finally course number 6, the port
combined sweep, was done. However the wind had died down and had begun to shift considerably
and thus the conditions for this sweep were erratic. It was felt that enough data had been recorded
by then to be satisfied with no need for testing the following day.
The sails were less than ideal due to their age. The mainsail clearly was backwinding on most runs
and the headsail did not either fly in the typical shape that would be expected.
All the tests were conducted from around 11:30am till 1:00pm on Tuesday 19 July 2011. High tide of
3.1 m occurred at 10:06am on this day (26).
Figure 7-4: Rough representation of the course sailed
7.3 Results for the Full-Scale Test
The results for the full-scale test are presented below.
7.3.1 Full-Scale: Recorded Pressures
The pressure distributions for course 6, the combined sweep on port tack, showed that a couple of
taps had been damaged or disconnected. This sweep was therefore unusable and is not presented
here. The taps were secured robustly enough to last half a day of regular tacking, hoisting, dropping
and furling. It was only when the sails were allowed to flog that any damage occurred. Ideally they
should be able to handle this too.
It was extremely fortunate to have had such steady wind for the morning of the testing. The results
from the afternoon, once the wind became more erratic, were less useful for direct comparisons

65
between runs although they still produced consistent results. The malfunctioning of the taps during
this run also would have contributed to this.
For the zero readings on some taps very little drift was seen between the readings at the start of the
day and those at the end. However in some instances random taps recorded strange values that
were extremely high or low. In order to get usable values for post-processing, averages were taken
of the different zero readings with the anomalies omitted. These zero values were less than ideal as
there was a clear offset between the two tacks for a few taps. For an example refer to
Figure 7-5 where all the pressure curves have a kink in the same direction at the second tap from the
leading edge. This indicates that the zero value was too low which resulted in pressures that were
too high. For reference the taps generally recorded a positive differential on starboard tack a, i.e.
when there was a negative pressure on leeward and positive on windward, and a negative of port.
The attempt to get corresponding results for both tacks was unsuccessful. The fact that the sheets
for the headsail were removed the previous day negated the exercise of marking them in
corresponding locations. Had this worked well it would have been very useful in determining the
correct zero values as a symmetry in the readings would be expected and any deviation from this
could be corrected.
The pressure distributions were not similar to what was seen for the Coreflute model testing. This
was expected due to the large areas of backwinding on the main and poor behaviour of the headsail.
In other words the flying shape was not the same therefore the pressure distribution was not either.
Although the distribution shown in
Figure 7-5 is fairly regular, it is of the top stripe on the mainsail it was less affected by backwinding.
Figure 7-6 clearly shows the affect where the recorded leading edge pressures were in fact the
differential pressure crosses the x axis indicating that there was a positive pressure on leeward. In
the end the mainsail displayed the pressure distribution that was expected considering its shape.
The high pressure created from the headsail’s trailing edge flow impinging on the main created a
high pressure on the leeward side thereby resulting in a negative ∆CP, taking into consideration the
sign convention between the two tacks.
Furthermore the pressure tap distribution was not justified due the non-corresponding flying
shapes between model- and full-scale. Had they not been backwinding the pressure distribution may
have been much more similar. Sail shapes as these have had no previous work conducted on them in
regards to pressure measurement. That made it difficult to judge exactly how well the pressures
were measured. The full pressure map is shown in the pressure contour plot in Figure 7-7.
Figure 7-8 shows the pressure distribution over the headsail. The expected large pressure peak at
the leading edge was not present. The size of the forestay may have influenced the readings.

66
Figure 7-5: Pressure distribution on the main top stripe for main sweep for both tacks
Figure 7-6: Pressure distribution on the main mid stripe for main sweep for both tacks
-150
-100
-50
0
50
100
0 0,2 0,4 0,6 0,8 1
Pre
ssu
re (
Pa
)
% of arc length
Mainsail - Top Stripe
25
26
27
28
29
30
31
32
33
34
35
36
-150
-100
-50
0
50
100
0 0,2 0,4 0,6 0,8 1Pre
ssu
re (
Pa
)
% of arc length
Mainsail - Middle Stripe
25
26
27
28
29
30
31
32
33
34
35
36

67
Figure 7-7: Pressure contour plot of full-scale mainsail
Figure 7-8: Pressure contour plot of full-scale headsail

68
7.3.2 Full-Scale: Comparison of Various Measurements
Initially the Speed Over Ground (SOG) from the GPS was used to compare with the drive force (Fx)
derived from the pressure and shape measurements as the GPS was more trusted than the
paddlewheel sensor measuring the boat speed (Vs). Although they displayed similar trends there
was a significantly large gap between the two tacks. The comparison then between Vs brought the
data points closer together. This may indicate that there was a tidal stream contributing to the SOG.
The time of the tests coincided with the strongest tidal streams at mid-tide. The area where course
number 1 and 2 were sailed, between the two islands, is believed to have been the most likely areas
for this to affect the results. Without actual tidal stream charts available the exact influence cannot
be determined, but this did prompt further comparisons to be made using Vs instead.
The data can be seen in Figure 7-9. There was however still a gap between the data points which is
unaccounted for. The difference in results between each tack could be due to a variety of reasons.
Some boats have a characteristic asymmetry in performance between one side and another due to
hull shape or its centre of gravity.
Figure 7-10 shows the drive force compared to boat speed for all the sweeps on the starboard tack.
The jib sweep shows an increase in boat speed with an increase in drive force. The main sweep
however has roughly the same drive force across the sweep but a range of different boat speeds.
The combined sweep, as would be expected, shows characteristics of both.
Figure 7-10 is interesting in that it highlights the contribution from each sail. It is apparent that the
headsail provides the majority of the total drive force as there is only a noticeable change in it when
the headsail is eased. Normally this difference in contribution may not be as drastic but the
backwinding of the main may have seriously reduced the drive force produced by it. However the
main still produces a large heeling moment and so when eased the significant reduction in heel
increases the boat speed. This is confirmed in Table 7-1 where the heel moment of the main is
reduced from 40% to 20% of the total, while for the drive force the main initially only contributes
20% and this is reduced to 10% at the end of the sweep.
Figure 7-9: Comparison of SOG and Vs to Fx for both jib sweeps
3
3,5
4
4,5
5
5,5
6
6,5
0 200 400 600 800 1000 1200
(kn
ots
)
Fx (N)
JIB SWEEP
STBD (SOG)
PORT (SOG)
STBD (Vs)
PORT (Vs)

69
Figure 7-10: Comparison of Vs to Fx for all stbd sweeps
Table 7-1: Relative contribution of main and headsail on Fx and Mx
Drive Force (N) Heel Moment (Nm)
Run # Main Head Main Head
31 253 838 -10516 -14921
32 223 843 -9346 -14850
33 177 888 -7797 -15519
34 118 841 -5817 -14680
35 104 979 -4779 -16007
36 251 828 -10671 -15236
The heel angle was recorded by the IMU at the masthead. This has been compared to the calculated
heeling moment in Figure 7-11. The result is a classic righting moment curve.
In Figure 7-12 the heel angle was also compared against the boat speed measured by the
paddlewheel sensor. It shows that there is a deterioration in boat speed over a certain heel angle. In
this case the maximum boat speed is achieved at a heel angle of 25°. The agreement between the
these parameters was very good. As was seen for the model testing the heeling moment is generally
better predicted than the drive force.
4
4,5
5
5,5
6
6,5
0 200 400 600 800 1000 1200
(kn
ots
)
Fx (N)
Vs (STBD)
STBD JS
STBD MS
STBD CS

70
Figure 7-11: Comparison of heel angle to heeling moment for all stbd sweeps
Figure 7-12: Comparison of heeling angle to boat speed for all stbd sweeps
The results for the boat speed compared to the drive force were not quite as expected, although the
comparison between the boat speed and heel angle shows that the connection between the former
is not as straight forward. In order to clearly see what occurred during the trim all the relevant
parameters are shown together for each sweep in Figure 7-13.
For the jib sweep and combined sweep it has already been seen that the boat speed is generally
related to the drive force as the sail is eased. The main sweep however clearly shows the inverse
relationship of the boat speed to heel angle while the drive force remains relatively constant. These
figures again show the strong correspondence between heel angle and heeling moment, while other
fluctuations in the trends are likely due to variations in AWS and AWA.
0
5
10
15
20
25
30
35
40
0 5000 10000 15000 20000 25000 30000
He
el
(de
g)
Mx (Nm)
STBD JS
STBD MS
STBD CS
0
1
2
3
4
5
6
7
0 5 10 15 20 25 30 35 40
Vs
(kn
ots
)
Heel (deg)

71
Figure 7-13: Comparison of heeling moment, heel angle, AWA, drive force, boat speed and AWS for all stbd sweeps
0
1
2
3
4
5
6
7
8
9
0
5
10
15
20
25
30
35
40
45
0 1 2 3 4 5 6
Fx
(k
N)
Vs
(kn
ots
) A
WS
(m
/s)
Mx
(k
Nm
) H
ee
l (d
eg
) A
WA
(d
eg
)
trim position
STBD Jib Sweep
Mx Heel AWA Fx Vs AWS
0
2
4
6
8
10
0
5
10
15
20
25
30
35
40
45
0 1 2 3 4 5F
x (
kN
) V
s (k
no
ts)
AW
S (
m/s
)
Mx
(k
Nm
) H
ee
l (d
eg
) A
WA
(d
eg
)
trim position
STBD Main Sweep
Mx Heel AWA Fx Vs AWS
0
1
2
3
4
5
6
7
8
9
0
5
10
15
20
25
30
35
40
45
0 1 2 3 4 5 6
Fx
(k
N)
Vs
(kn
ots
) A
WS
(m
/s)
Mx
(k
Nm
) H
ee
l (d
eg
) A
WA
(d
eg
)
trim position
STBD Combined Sweep
Mx Heel AWA Fx Vs AWS

72
7.4 Summary of the Results for the Full-Scale Test
Some of the recorded zeros were not completely trusted but generally the results for the pressure
measurements were satisfactory. Pressures were recorded that were of the correct magnitude and
showed plausible distributions for the behaviour of the sails. In retrospect some of the test
procedure could have been improved for instance the zero readings should have been taken more
regularly during the testing and using purpose built covers that ensure no flow resulting in pressure
variations.
However, even considering the above, the results were good and showed plausible trends. The
contribution to the forces and moments of the each sail shows some interesting relationships
between them on what was occurring. This is not possible to see using a force balance in the wind
tunnel. Once the system is mature, with most of the limitations dealt with, it could be an interesting
tool for further research topics.
The unsteady nature of full-scale testing makes comparison of the results between different runs
difficult. Because of this model and numerical testing will never be replaced by full-scale testing, but
there certainly is a potential for this system to be used to close the loop between the design and the
finished product.

73
8 General Discussion
The difference between the pressure tappings in the two model tests made for some interesting
comparisons.
The placement of the pressures taps proved to be of utmost importance in order to capture the
correct pressure distribution. There was no way to determine if a local trough or peak was missed
for any particular run and the results had to be used in blind faith that they represented the true
values. More work could have been done to predict where the peaks and troughs were likely to
occur. For a random sail it would likely have its own optimum tap distribution and therefore a
generic sail study is not suitable.
Although the placement is of most importance and accuracy can be improved greatly with a smart
distribution the number of taps used plays a large role too. The more taps used the more likely that
the critical points would be captured, although the numbers suggested by Graves et al. (12) of 89
differential readings over both sails may be excessive.
There is a price to an increase in tap numbers. The pressure field around a sail appears to be highly
sensitive and any interference introduced will affect the flow. The more taps used the more
interference there will be. In order to counteract this, the taps could be staggered further apart in
the spanwise direction.
A staggered setup goes against the desire for the pressure readings to be as close to the shape
inputs as possible. The thought behind this was to ensure accuracy but the results between the
model tests proved that this is not necessarily the case. The fact that assumptions can be made to
the shape of the foot and head of a sail negates the need to measure the shape in these areas,
however the same is not possible for the pressure. In fact it could be said that the increased span
between the pressure measurements ensured a greater accuracy. In other words it is far more
important for the interpolated values to be as accurate as possible than for the discrete values of the
shape and pressure to be measured at the same point.
Where a high density is necessary is the area close to the leading edge of the sail. Arguably this area
contributes the most to the drive force due to its orientation and large differential pressures. Thus it
is critical that the sail shape and pressure field here are captured correctly. This is where the
gradients are highest in the pressure distribution and the curvature is greatest for the sail shape
which makes this the most difficult area to measure.
The VSPARS system was not 100% accurate although it was close. However for the cells away from
the leading edge where their orientation is more sideways the drive force component is affected
more than the side force by a small error in the cells orientation. In other words if the cell’s
orientation is rotated slightly then the force component in the x direction will be affected by a larger
percentage than that for the side force. This has to do with the relative magnitudes of the two
components. This again highlights the sensitivity of measuring the drive force compared to the
heeling moment.
The easy comparison between the model tests was possible due to the steady conditions and
repeatable test procedures. The data captured there was enough to validate the system and prove
the value of it. The confidence in the system should then be applicable at full-scale provided the sail

74
shape and the scale of the taps are held constant. The Full-Scale test in this case resembled the
Semi-Rigid test more than the Coreflute. Although not as quantitatively accurate as the Coreflute
test, the results from the Semi-Rigid test do provide a qualitative comparison between trim
positions. This was proven again in the Full-Scale test although more information was required
regarding the conditions to fully understand what was occurring between the different trims.
9 Conclusions
The main aim of the project was achieved. Overall the system proved itself to be a valid method for
measuring forces at full-scale, although full-scale testing is unsteady and as such direct comparisons
of trim adjustments are difficult. All parameters need to be taken into account when analysing the
results.
Using simple interpolations of discrete data points it is possible to recreate a sail’s shape and the
pressure distribution around it. From this the resultant forces and moments can be derived with
reasonable accuracy by discretising the shape into many cells and summing the product of the unit
normal vector and area of each cell by the corresponding pressure at their centres.
The pressure distribution over a sail is dynamic; the peaks and troughs migrate and the maximum
and minimum pressures fluctuate depending on the sail’s trim. The effectiveness of the system
developed in this work is dependent on the limited number of pressure taps capturing the local
maxima and minima and the transition between them.
The flow over the sail is highly sensitive and the introduction of pressure measuring devices onto the
sail’s surface will influence the flow and thus the recordings. This can be minimised through the
devices shape or size and density around a point on the sail.

75
10 Recommendations for Future Work
For increased accuracy of the pressure map and therefore the accuracy of the system the following
recommendations can be made:
• Test the relative accuracy of the system using varying number of taps and locations, but the
following suggestions can be made:
o Spread the taps widely over the sail from the foot to the head while maintaining a
high density at the leading edge.
o Place the first tap as close as possible to the leading edge. The flow in this area is
likely to be separated and so tap aerodynamics is less important. A specialised
leading edge tap design could be used.
• Improve the aerodynamics of the taps at full-scale. This can be achieved through an
intelligent housing design or by merely reducing the size.
The written code can be improved in the following areas:
• Certain user inputs can be extracted or interpolated from the shape inputs, namely the tack
of the run and the camber and draft of the foot of the sail.
• A function should be found for the decrease of the pressure field towards the head and foot
and applied to the interpolated field.
• The code should be made to run in real-time thereby information on the quality of the trim
can be seen immediately.
More validation of the results would be valuable, namely:
• Precise measurements of the sails’ areas should be done to validate the calculated areas.
• Results from a VPP using the calculated forces at full-scale. More hydrodynamic data of the
boat used is necessary for this.
The system can be used for further studies in:
• The effect at full-scale of secondary sail controls, such as the main sheet traveller or the jib
sheet car.
• The effect at full-scale of various AWA’s on the performance of a set of sails.
• The contribution on drive force and heeling moment of each sail when acting together.
• The contribution on drive force and heeling moment of various areas on a sail, e.g. the first
10% of the chord length compared to the rest of the sail or the top half of the sail compared
to the bottom.

76
11 Bibliography
1. Herman, J. S. A Sail Force Dynamometer: Design, Implementation and Data Handling. Cambridge :
Massachusetts Institute of Technology, 1988.
2. Full Scale Measurement of Sail Force and the Validation of Numerical Calculation Method.
Masuyama, Y. and Fukasawa, T. Annapolis : SNAME, 1997. The 13th Chesapeake Sailing Yacht
Symposium.
3. Hochkirch, K. Entwicklung einer Meßyacht zur Analyse der Segelleistung im Orginalmaßstab
(Design and Construction of a Full-Scale Measurement System for the Analysis of Sailing
Performance). Berlin : Technische Universität Berlin, 2000.
4. Experimental full scale study on yacht sails and rig under unsteady sailing conditions and
comparison to fluid structure interaction unsteady models. Augier, B., Bot, P. and Hauville, F.
Chesapeake Bay : s.n., 2011. The Twentieth Chesapeake Sailing Yacht Symposium. pp. 19-32.
5. Marchaj, C. A. Sailing theory and practise. London : Adlard Coles Limited, 1964.
6. Full scale investigation of one-design class catamaran sails. Puddu, P, et al., et al. Auckland : s.n.,
2006. Proceeding of the Second High Performance Yacht Design Conference. pp. 14-16.
7. Full-scale pressure measurements on a Sparkman and Stephens 24-foot. Viola, I. M. and Flay, R. G.
J. 2010, Journal of Wind Engineering and Industrial Aerodynamics, pp. 800-807.
8. V-SPARS: A Combined Sail and Rig Shape Recognition System Using Imaging Techniques. Le Pelley,
D. and Modral, O. Auckland : University of Auckland, 2008. The Third High Performance Yacht
Design Conference. pp. 57-66.
9. The Aerodynamics of Sail Interaction. Gentry, A. Redondo Beach, California : s.n., 1971. the Third
AIAA Symposium on the Aero/Hydronautics of Sailing.
10. Static pressure distribution over 2D mast/sail geometries. Wilkinson, S. 1989, Journal of Marine
Technology 26 (4), pp. 333–337.
11. Experimental considerations concerning pressure measurements on sails: Wind Tunnel and Full-
Scale. Flay, R. J. and Millar, S. Auckland : s.n., 2006. The Second High Performance Yacht Design
Conference. pp. 123-130.
12. Measurements and simulation of pressure distribution on full size scales. Graves, W., et al., et al.
Auckland : s.n., 2008. ProceedingsoftheThirdHighPerformance YachtDesignConference. pp. 2-4.
13. Wind tunnel and CFD modelling of pressures on downwind sails. Richards, P J and Lasher, W C.
Milan : s.n., 2008. Proceedings of the Sixth International Colloquium on Bluff Bodies Aerodynamics &
Applications. pp. 20-24.
14. Force and pressure investigation of modern asymmetric spinnakers. Viola, I. M. and Flay, R. G. J.
2009, International Journa lof Small Craft Technology, pp. 31–40.

77
15. Comparison of Potential Flow-Based and Measured Pressure Distributions over Upwind Sails.
Fluck, M., et al., et al. 2010, Journal of Aircraft, pp. 2174-2177.
16. Hansen, H. Enhanced Wind Tunnel Techniques and Aerodynamic Force Models for Yacht Sails.
s.l. : PhD Thesis, University of Auckland, 2006.
17. 12 meter design: state of the art in 1986. van Hemmen, R. F. s.l. : Marine Technology, 1986,
Marine Technology, pp. 320-338.
18. Modelling IACC Sail Forces by Combining Measurements with CFD. Milgram, J. H., Peters, D. B.
and Eckhouse, D. N. Chesapeake Bay : s.n., 1995. The Eleventh Chesapeake Sailing Yacht
Symposium. pp. 65-73.
19. Fossati, F. Aero-Hydrodynamics and the Performance of Sailing Yachts. The Science behind Sailing
Yachts and their Design. Milan : International Marine/McGraw-Hill, 2009.
20. Larsson, L. and Eliasson, R. E. Principles of Yacht Design. Camden, Maine : International
Marine/McGraw-Hill, 2007.
21. Pressure Measurements on Full-Scale and Model-Scale Upwind Sails. Viola, I.M., Gauvain, E. and
Flay, R.G.J. Auckland : s.n., 2010. 17th Australasian Fluid Mechanics Conference.
22. White, F. M. Fluid Mechanics. New York : McGraw-Hill, 2008.
23. The Use of Independent Supports and Semi-Rigid Sails in Wind Tunnel Studies. Richards, P., et al.,
et al. Auckland : University of Auckland, 2006. The Second High Performance Yacht Design
Conference. pp. 114-122.
24. Viola, I. M. PMonS overview report. Auckland : Internal report for YRU (UoA).
25. Le Pelley, D. Wired Pressure System (Internal report for the YRU). 2011.
26. http://www.linz.govt.nz/hydro/tidal-info/tide-tables/index.aspx. Land Information New Zealand :
s.n., 07/08/2011.
27. Jr., James Stackpole Herman. A Sail Force Dynamometer: Design, Implementation and Data
Handling. Cambridge : Massachusettes Institute of Technology, 1988.

78
APPENDIX 1 – Base Code %%%%%%%%%%%%%%%%%%%%%%%%%%%%%% BASE CODE %%%%%%%%%%%%%%%%%%%%%%%%%%%%%%%%%% clear all close all clc clf
%% %%%%%%%%%%%%%%%%%%%%%%%%%%%% INPUTS %%%%%%%%%%%%%%%%%%%%%%%%%%%%%%%%%%%% global l lp N res pressures heel tack pressures_display sr fr Pplot Pchord;
%Sail generation only (0) %or pressure integration included (1)?? pressures = 1;
%Displays sails_low_display = 0; %surface plot of sail shape - initial resolution sails_high_display = 0; %surface plot of sail shape - high resolution pressures_display = 1; %contour plot of pressures over the sails Pplot = 0; %pressure plot along chords for full scale Pchord = 0; %plot of measured and interpolated pressures along a chord Pcheck = 0; %writes measured pressures to excel (full scale only) tap_distr = 0; %pressure point distribution over the sails
%%%Specify test runs for computation: sr = 18; %start of sweep: run# fr = 23; %finish of sweep: run#
size = 1 + fr-sr; %number of runs
%%%Specify which tack the run was recorded on %PORT(1) or STBD(2) tack = 1;
%Heel angle of test runs heel = 20;
%%%Specify chordwise resolution for interpolated data points l = 0 : 1/50 : 1; %chord-wise arc% resolution for shape points N = length(l); %number of points chord-wise
%%%Calculate arc% for pressure points (halfway between shape points) lp(N-1) = 0; for i = 1:N-1 lp(i) = l(i) + 0.5 * (l(i+1) - l(i)); end
%%%Specify spanwise resolution for interpolated data points res = 100; %span-wise resolution of pressure (shape = res + 1)
%%%Specify Data file file_D = 'Data\File D\full scale';
%%%Specify Pressure file file_P = 'full scale';
Result(size, 8) = 0; %initialise result matrix c = 0; %loop counter for each run

79
%Loop for each test run specified for computation for run = sr:fr;
%%%Specify VSPARS file for Mainsail M_VSPARS = sprintf... ('Full Scale\\VSPARS\\Jib Sweep PORT 18-23\\Main\\%d.txt', run);
%%%Load sail data sheet M_sheet = 'Main'; %name of relevant sheet in excel data doc [num] = xlsread(file_D, M_sheet); %read excel file
Mst = num(1,1); %sail type mainsail = 1 M_NoSS = num(1,2); %number of shape stripes on each sail M_NoSP = num(1,3); %number of pressure stripes Ml_h = num(1,4); %length of head Ml_f = num(1,5); %length of foot Mz_h = num(1,6); %height of head Mz_f = num(1,7); %height of foot Mclew = num(1,8); %position of clew along boom
%%%Specify VSPARS file for Headsail H_VSPARS = sprintf... ('Full Scale\\VSPARS\\Jib Sweep PORT 18-23\\Head\\%d.txt', run);
%%%Load sail data sheet H_sheet = 'Jib'; %name of relevant sheet in excel data doc [num] = xlsread(file_D, H_sheet); %read excel file
Hst = num(1,1); %sail type jib/genoa = 2 H_NoSS = num(1,2); %number of shape stripes on each sail H_NoSP = num(1,3); %number of pressure stripes Hl_h = num(1,4); %length of head Hl_f = num(1,5); %length of foot Hz_h = num(1,6); %height of head Hz_f = num(1,7); %height of foot %Hx_h = num(1,9); %distance of head fore of mast H_leech = num(1,10); %length of leech
%% %%%%%%%%%%%%%%%%%%%%% SAIL SHAPE GENERATION %%%%%%%%%%%%%%%%%%%%%%%%%%%% %%%Import data from VSPARS and manipulate into usable structure [Mx, My, Mz] = extract_data3D (M_VSPARS, M_NoSS, Mst); [Hx, Hy, Hz] = extract_data3D (H_VSPARS, H_NoSS, Hst);
%%%Extrapolate to get points for the head and foot of the sail [MX MY MZ] = get_head_foot (Mx, My, Mz, Ml_h, Mz_f, Mz_h, Mclew, Ml_f,... Mst, M_NoSS); [HX HY HZ] = get_head_foot (Hx, Hy, Hz, Hl_h, Hz_f, Hz_h, 0, Hl_f,... Hst, H_NoSS);
%%%Increase number of data points to desired resolution [MXr, MYr, MZr, MPZr] = resolution(MX, MY, MZ, M_NoSS, Mst); [HXr, HYr, HZr, HPZr] = resolution(HX, HY, HZ, H_NoSS, Hst);
%%%Trim and scale jib foot to correct dimensions [HX_new, HY_new, HZ_new, HPZr] = jib_foot(HXr, HYr, HZr, Hl_f, H_leech);
%%%Calculate normals on sail surface [Mnx, Mny, Mnz] = normals(MXr, MYr, MZr);

80
[Hnx, Hny, Hnz] = normals(HX_new, HY_new, HZ_new);
%%%Calculate sail areas M_SA = sqrt(sum(sum(Mnx))^2 + sum(sum(Mny))^2 + sum(sum(Mnz))^2)/2; H_SA = sqrt(sum(sum(Hnx))^2 + sum(sum(Hny))^2 + sum(sum(Hnz))^2)/2;
%% %%%%%%%%%%%%%%%%% PRESSURE INTEGRATION OVER THE SAIL %%%%%%%%%%%%%%%%%%% if pressures == 1 %%%Extract & isolate pressure data from file [MP, M_tapno] = pressureA(file_P, file_D, run, M_NoSP, Mst, M_sheet); [HP, H_tapno] = pressureA(file_P, file_D, run, H_NoSP, Hst, H_sheet);
%%%Interpolate measured pressures to desired resolution [MPrh, MPYrh, MPXrh, MPs] = pressresoA(file_D, M_sheet, M_NoSP,... MXr, MYr, MZr, MP, MPZr, M_tapno, Mst, run); [HPrh, HPYrh, HPXrh, HPs] = pressresoA(file_D, H_sheet, H_NoSP,... HX_new, HY_new, HZ_new, HP, HPZr, H_tapno, Hst, run);
%%%Calculate forces in x,y,z directions [MFx, MFy, MFz] = forces(MPrh, Mnx, Mny, Mnz); [HFx, HFy, HFz] = forces(HPrh, Hnx, Hny, Hnz);
%%%Sum the forces from the main and foresail FX = sum(sum(MFx)) + sum(sum(HFx)); FY = sum(sum(MFy)) + sum(sum(HFy)); FZ = sum(sum(MFz)) + sum(sum(HFz));
%%%Calculate the heeling moment [MRM, MYM] = moments(MFx, MFy, MFz, MPZr, MPYrh, MPXrh); [HRM, HYM] = moments(HFx, HFy, HFz, HPZr, HPYrh, HPXrh);
%%%Sum the moments from the main and foresail ARM = HRM + MRM; AYM = HYM + MYM;
%%%Step the loop counter before recording c=c+1;
%%%Record the measured pressures (full scale only) if Pcheck == 1 presscheck(1:24,1) = [MPs(1:8, 3);MPs(1:8, 2);MPs(1:8, 1)]; presscheck(1:24,run+1) = [MP(1:8, 3);MP(1:8, 2);MP(1:8, 1)];
presscheck(26:49,1) = [HPs(1:8, 3);HPs(1:8, 2);HPs(1:8, 1)]; presscheck(26:49,run+1) = [HP(1:8, 3);HP(1:8, 2);HP(1:8, 1)]; end
%%%Record the forces and heeling moment for each run Result(c,:) = [run, FX, ARM, FY, FZ, H_SA, M_SA, AYM];
end end
%%%Write the final result to excel xlswrite('Result', Result); if Pcheck == 1 xlswrite('Presscheck', presscheck); end

81
APPENDIX 2 – Formulas used in Code
Cross-Product Theorem
This theorem proves that the magnitude of the normal calculated using the cross product of two
diagonals of a quadrilateral is equal to twice the projected area in each direction
This proof is shown for a rectangle but it can easily be extended for any quadrilateral.
Given the rectangle:
Where Y and � are the lengths of the sides and X is the length of the diagonals and i is the angle
between the diagonal and the short side. The area of this rectangle is therefore Y�.
We know that the cross product of 2 vectors equals their magnitudes multiplied by each other times
by the sine of the angle between them. It can also be seen that the angle between then equals 2i.
Therefore:
XxX � X� sin2i
� X� 2sin i cos i
� 2X� �X YX
� 2Y�

82
Arc Length
For the task of calculating the arc lengths of curves such as the chordwise sections of the sail an
iterative calculation is used which approaches the actual value by increasing the number of data
points. For a simple explanation refer to Figure 11-1
Figure 11-1: Calculation of arc length
Using Pythagoras it is possible to find the straight line distance between two points from their X and
Y coordinates.
∆a?� � k�(� � (?�� � � � � ?��� (A2.1)
Then for F number of points the curve length a equals:
a � ∑ l∆(&� � ∆ &�<&m? (A2.2)

83
Least Squares Curve Fitting
For a nth degree polynomial:
� Y4 � Y?( �o� Yp(p, (A2.3)
the residuals can be described as:
�� � ∑ q & � rY4 � Y?(& �o� Yp(&pst�<&m? . (A2.4)
By taking the partial derivatives:
Y4F � Y?∑ (?<&m? �o� Yp ∑ (&p<&m? � ∑ &<&m? (A2.5)
This polynomial can be written:
u ? �B <v � wxxy1 (?1 (� o (?po (�pB B1 (< C Bo (<pz{
{| }Y4Y?BYp~ or expressed as:
� � �� (A2.6)
To solve for � premultiply by ��:
��� � ���� (A2.7)
and then:
� � r���s����� (A2.8)

84
APPENDIX 3 – Pressure Tap Testing
Taps for the Semi-Rigid Sails
The results of the test of the taps referred to in section 5.1.1 are shown here. They were placed on
the headsail of the Semi-Rigid model along a line of constant percentage of chord length. The sail
was then trimmed in a sweep starting from tightly trimmed in. The vertical order of the taps was
then varied to make sure that the results were consistent.
The results are referenced to the flush mounted tap. It can clearly be seen that the block tap was not
suitable for testing and had to be discarded. The coin tap was not ideal either but there were no
other taps available. The results are presented in Figure 11-2 and
Table 11-1:
Table 11-1: Table of average difference of different model-scale tap geometries
Coin Block
Avg Diff (Pa) 0.82 1.82
Avg Diff (%) 14 31
Figure 11-2: Graph of pressure readings for model-scale taps for one sweep of the headsail
Various Full-Scale Tap Geometries
The pressure system developed for full-scale required taps that encased the transducer. This limited
the minimum thickness of the tap to 9mm. This is a significant thickness and therefore the geometry
of the tap had to be designed to minimise the influence on the flow.
Mock-ups of a range of pressure taps were fabricated out of MDF with varying side gradients and
curvatures. They were tested for a range of AoA but they were all deemed unsuitable as they did not
follow the trend of the reference pressure. The standard deviation ranged from 0.7 – 1.5.
3
3,5
4
4,5
5
5,5
6
1 2 3 4 5
Pre
ssu
re (
Pa
)
Trim Position
Flush
Coin
Block

85
Figure 11-3: Various tap geometries (from L-R: Volcano, Steep, Gradual, Rounded)
Table 11-2: Table of average difference and standard deviations for various full-scale tap geometries
Volcano Steep Gradual Rounded
Avg Diff (Pa) 1.24 1.73 1.01 0.94
Std Dev (Pa) 1.01 1.52 0.70 0.68
Figure 11-4: Graph of pressure readings for various full-scale tap geometries
Full-Scale Taps with Sail Patches
The next step was to test the same sized tap, with suitable dimensions to house the transducer, but
covered with a patch of sail cloth. The patches used were circular and a range of patch diameters
were tested. They were mounted on a flat plate and tested at a range of AoA’s. These were again
referenced to a flush mounted PVC tube.
Figure 11-5: Top and side views of the testing of full-scale pressure taps
-6
-4
-2
0
2
4
6
-80 -60 -40 -20 0 20 40Pre
ssu
re
AoA
Flush
Volcano
Steep
Gradual
Rounded

86
Table 11-3: Table of average difference and standard deviations for full-scale taps with sail patches
Blocks with patches of sail - Diameter (mm)
270 200 165 120
Avg Diff (Pa) 0.86 1.16 0.82 0.65
Std Dev (Pa) 0.48 0.53 0.44 0.64
Figure 11-6: Graph of pressure readings for full-scale taps with sail patches
Although the D120 tap recorded values closer to the reference pressure than that of the D165, its
standard deviation was higher. This is evident of the curve’s intersection with the reference curve.
Therefore the D165 patch was chosen for the full-scale measurements.
Note that the patches actually used in testing are square. The circular shape was exceedingly difficult
to affix without distorting the shape. The sides of the square patch were then made to be 165mm.
-10
-8
-6
-4
-2
0
2
4
6
-40 -20 0 20 40
Pre
ssu
re (
Pa
)
AoA
Flush
270
200
165
120
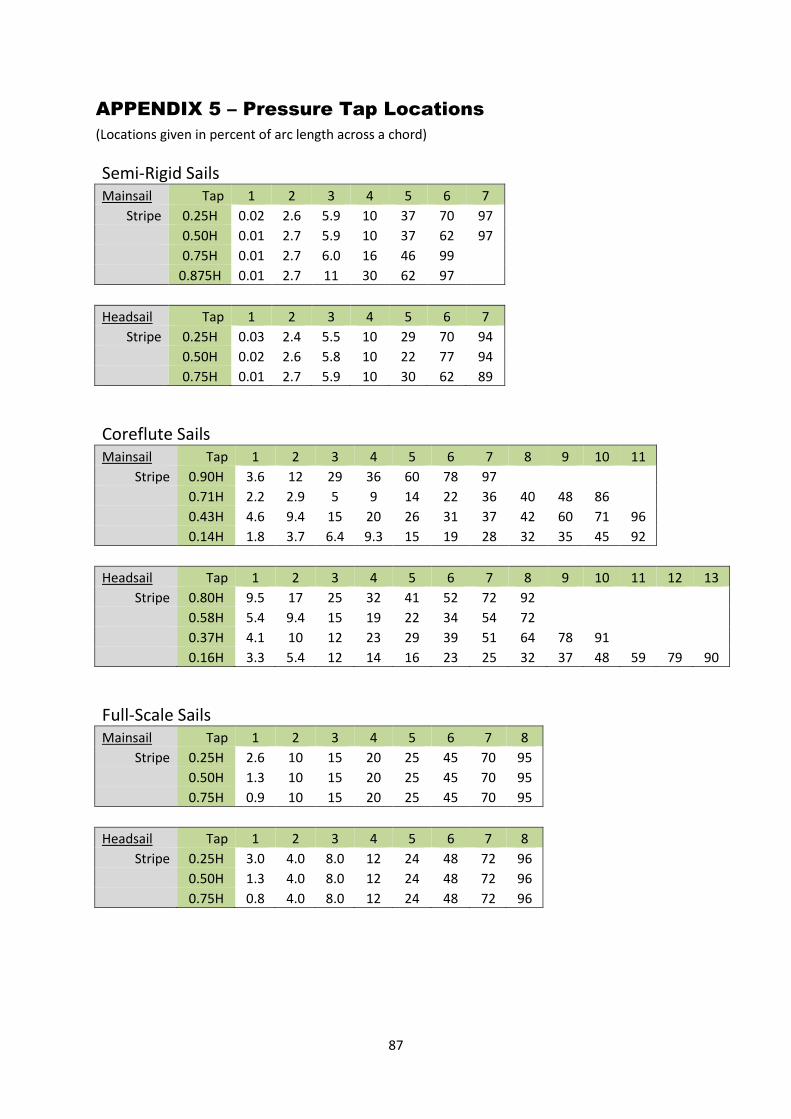
87
APPENDIX 5 – Pressure Tap Locations
(Locations given in percent of arc length across a chord)
Semi-Rigid Sails Mainsail Tap 1 2 3 4 5 6 7
Stripe 0.25H 0.02 2.6 5.9 10 37 70 97
0.50H 0.01 2.7 5.9 10 37 62 97
0.75H 0.01 2.7 6.0 16 46 99
0.875H 0.01 2.7 11 30 62 97
Headsail Tap 1 2 3 4 5 6 7
Stripe 0.25H 0.03 2.4 5.5 10 29 70 94
0.50H 0.02 2.6 5.8 10 22 77 94
0.75H 0.01 2.7 5.9 10 30 62 89
Coreflute Sails Mainsail Tap 1 2 3 4 5 6 7 8 9 10 11
Stripe 0.90H 3.6 12 29 36 60 78 97
0.71H 2.2 2.9 5 9 14 22 36 40 48 86
0.43H 4.6 9.4 15 20 26 31 37 42 60 71 96
0.14H 1.8 3.7 6.4 9.3 15 19 28 32 35 45 92
Headsail Tap 1 2 3 4 5 6 7 8 9 10 11 12 13
Stripe 0.80H 9.5 17 25 32 41 52 72 92
0.58H 5.4 9.4 15 19 22 34 54 72
0.37H 4.1 10 12 23 29 39 51 64 78 91
0.16H 3.3 5.4 12 14 16 23 25 32 37 48 59 79 90
Full-Scale Sails Mainsail Tap 1 2 3 4 5 6 7 8
Stripe 0.25H 2.6 10 15 20 25 45 70 95
0.50H 1.3 10 15 20 25 45 70 95
0.75H 0.9 10 15 20 25 45 70 95
Headsail Tap 1 2 3 4 5 6 7 8
Stripe 0.25H 3.0 4.0 8.0 12 24 48 72 96
0.50H 1.3 4.0 8.0 12 24 48 72 96
0.75H 0.8 4.0 8.0 12 24 48 72 96

88
APPENDIX 5 – Results
Results for the Semi-Rigid Test
0
0,05
0,1
0,15
0,2
0,25
0,3
1 2 3 4 5 6 7 8
CF
run #
Jib Sweep - Drive Force
Pressure & Shape
Integration
Force Balance
Readings
Windage Corrected
Force Balance
-1
-0,8
-0,6
-0,4
-0,2
0
1 2 3 4 5 6 7 8
CF
run #
Jib Sweep - Side Force
Pressure & Shape
Integration
Force Balance
Readings
Windage Corrected
Force Balance
0
0,1
0,2
0,3
0,4
0,5
0,6
0,7
0,8
0,9
1 2 3 4 5 6 7 8
CM
run #
Jib Sweep - Roll Moment
Pressure & Shape
Integration
Force Balance
Readings
Windage Corrected
Force Balance

89
0
0,05
0,1
0,15
0,2
0,25
0,3
1 2 3 4 5 6 7 8
CF
run #
Main Sweep - Drive Force
Pressure & Shape
Integration
Force Balance
Readings
Windage Corrected
Force Balance
-1
-0,9
-0,8
-0,7
-0,6
-0,5
-0,4
-0,3
-0,2
-0,1
0
1 2 3 4 5 6 7 8
CF
run #
Main Sweep - Side Force
Pressure & Shape
Integration
Force Balance
Readings
Windage Corrected
Force Balance
0
0,1
0,2
0,3
0,4
0,5
0,6
0,7
0,8
0,9
1 2 3 4 5 6 7 8
CM
run #
Main Sweep - Roll Moment
Pressure & Shape
Integration
Force Balance
Readings
Windage Corrected
Force Balance

90
0
0,05
0,1
0,15
0,2
0,25
0,3
1 2 3 4 5 6 7 8
CF
run #
Combined Sweep - Drive Force
Pressure & Shape
Integration
Force Balance
Readings
Windage Corrected
Force Balance
-1
-0,9
-0,8
-0,7
-0,6
-0,5
-0,4
-0,3
-0,2
-0,1
0
1 2 3 4 5 6 7 8
CF
run #
Combined Sweep - Side Force
Pressure & Shape
Integration
Force Balance
Readings
Windage Corrected
Force Balance
0
0,1
0,2
0,3
0,4
0,5
0,6
0,7
0,8
0,9
1 2 3 4 5 6 7 8
CM
run #
Combined Sweep - Roll Moment
Pressure & Shape
Integration
Force Balance
Readings
Windage Corrected
Force Balance

91
Results for the Coreflute Test
0
0,05
0,1
0,15
0,2
0,25
0,3
0,35
0,4
0,45
1 2 3 4 5
CF
run#
Main Sweep - Drive Force
Pressure & Shape
Integration
Force Balance
Readings
Windage Corrected
Force Balance
-1,2
-1
-0,8
-0,6
-0,4
-0,2
0
1 2 3 4 5
CF
run#
Main Sweep - Side Force
Pressure & Shape
Integration
Force Balance
Readings
Windage Corrected
Force Balance
0
0,2
0,4
0,6
0,8
1
1,2
1 2 3 4 5
CM
run#
Main Sweep - Roll Moment
Pressure & Shape
Integration
Force Balance
Readings
Windage Corrected
Force Balance

92
0
0,05
0,1
0,15
0,2
0,25
0,3
0,35
0,4
0,45
1 2 3 4 5
CF
run#
Jib Sweep - Drive Force
Pressure & Shape
Integration
Force Balance
Readings
Windage Corrected
Force Balance
-1,2
-1
-0,8
-0,6
-0,4
-0,2
0
1 2 3 4 5
CF
run#
Jib Sweep - Side Force
Pressure & Shape
Integration
Force Balance
Readings
Windage Corrected
Force Balance
0
0,2
0,4
0,6
0,8
1
1,2
1,4
1,6
1,8
1 2 3 4 5
CM
run#
Jib Sweep - Roll Moment
Pressure & Shape
Integration
Force Balance
Readings
Windage Corrected
Force Balance

93
0
0,05
0,1
0,15
0,2
0,25
0,3
0,35
0,4
0,45
1 2 3 4 5
CF
run#
Combined Sweep - Drive Force
Pressure & Shape
Integration
Force Balance
Readings
Windage Corrected
Force Balance
-1,2
-1
-0,8
-0,6
-0,4
-0,2
0
1 2 3 4 5
CF
run#
Combined Sweep - Side Force
Pressure & Shape
Integration
Force Balance
Readings
Windage Corrected
Force Balance
0
0,2
0,4
0,6
0,8
1
1,2
1 2 3 4 5
CM
run#
Combined Sweep - Roll Moment
Pressure & Shape
Integration
Force Balance
Readings
Windage Corrected
Force Balance