Embed Size (px)
Citation preview
Copyright © 2013 Tech Science Press MCB, vol.10, no.1, pp.27-42, 2013
Derivation of the Stress-Strain Behavior of the constituentsof Bio-Inspired Layered TiO2/PE-Nanocomposites by
Inverse Modeling Based on FE-Simulations ofNanoindentation Test
G. Lasko∗, I. Schäfer∗, Z. Burghard†, J. Bill†, S. Schmauder∗U. Weber∗ and D. Galler‡
Abstract: Owing to the apparent simple morphology and peculiar properties,nacre, an iridescent layer, coating of the inner part of mollusk shells, has attractedconsiderable attention of biologists, material scientists and engineers. The basicstructural motif in nacre is the assembly of oriented plate-like aragonite crystalswith a ’brick’ (CaCO3 crystals) and ’mortar’ (macromolecular components likeproteins) organization. Many scientific researchers recognize that such structuresare associated with the excellent mechanical properties of nacre and biomimeticstrategies have been proposed to produce new layered nanocomposites. During thepast years, increasing efforts have been devoted towards exploiting nacre’s struc-tural design principle in the synthesis of novel nanocomposites. However, the di-rect transfer of nacre’s architecture to an artificial inorganic material has not beenachieved yet. In the present contribution we report on laminated architecture, com-posed of the inorganic oxide (TiO2) and organic polyelectrolyte (PE) layers whichfulfill this task.To get a better insight and understanding concerning the mechanical behaviourof bio-inspired layered materials consisting of oxide ceramics and organic layers,the elastic-plastic properties of titanium dioxide and organic polyelectrolyte phaseare determined via FE-modelling of the nanoindentation process. With the use ofinverse modeling and based on numerical models which are applied on the micro-scopic scale, the material properties of the constituents are derived.
Keywords: Nanoindentation, stress-strain constitutive law, inverse modeling, bio-
∗ Institute for Materials Testing, Materials Science and Strength of Materials, University of Stuttgart,Pfaffenwaldring 32, D 70569, Stuttgart, Germany. E-mail: [email protected]
† Institute of Materials Science, University of Stuttgart,Heisenbergstrasse 3, D 70569 Stuttgart, Ger-many.
‡ Stuttgart University, 070569, Stuttgart, Germany.
28 Copyright © 2013 Tech Science Press MCB, vol.10, no.1, pp.27-42, 2013
mimetics
1 Introduction
Biomaterials are perfect models for specialized materials that can reveal amaz-ing combinations of mechanical properties. Some of their properties such as stiff-ness, hardness and fracture toughness are hardly attained by artificial materials (1).Nacre, which is the inner layer of mollusk shells, shows a high performance. Alsoit is build out of relatively weak components. Based on this prototype, new mate-rials can be developed which are stiff but also have high fracture toughness. Oneexample of the bio-inspired synthesis route to inorganic layers is the chemical bathdeposition technique (CBM) (2). Combined with the layer-by-layer technique itwas possible to create Titandioxide (TiO2)/ Polyelectrolyte (PE) multilayered filmswith a nacre-like architecture (3). The chemical bath deposition method operates atlow temperatures (30–100˚C), similar to the biomineralization process that occursin natural organic–inorganic nanocomposites. One of the main problems is thatthe constitutive properties of the components of the nanocomposites are almost un-known. For macroscopic objects there exists the possibility of verification of theconstitutive behavior of the constituents by comparison of the stress-strain curvesobtained by inverse modeling with the experimentally obtained ones. When per-forming an analysis of the thin coatings, the performance of experimental tests isdifficult or even impossible and here a simple and easy method to define the me-chanical properties is the nanoindentation technique. Nanoindentation testing wascarried out with a scanning nanoindenter including a depth-sensing force trans-ducer (HysitronTriboScope), combined with a commercial scanning probe micro-scope (NanoScope III Multimode, Digital Instruments). Indentations were madewith a cube corner diamond indenter with a nominal tip radius of ∼40 nm. In allexperiments, a maximum force of 80 µN was applied, which yields a penetrationdepth of about 100 nm. In the present work, we report on the computer simulationof mechanical properties of the components of this nanocomposite film, composedof alternating layers of TiO2 as inorganic component and PE as the organic com-ponent. The stress-strain behavior of separate phases of the nanostructured layeredTiO2/PE nanocomposite are analyzed, and have been inversely obtained by nu-merical modeling with the finite element (FE) method of nanoindentation test ofseparate phases of the TiO2/PE nanocomposite. For the first time, the stress-straincurves of the constituents of the bio-inspired TiO2/PE layered nanocomposite havebeen determined by coupling the results of the experiments with the FE simulationsof nanoindentation.
Derivation of the Stress-Strain Behavior 29
2 Definition of Young’s modulus from nanoindentation tests
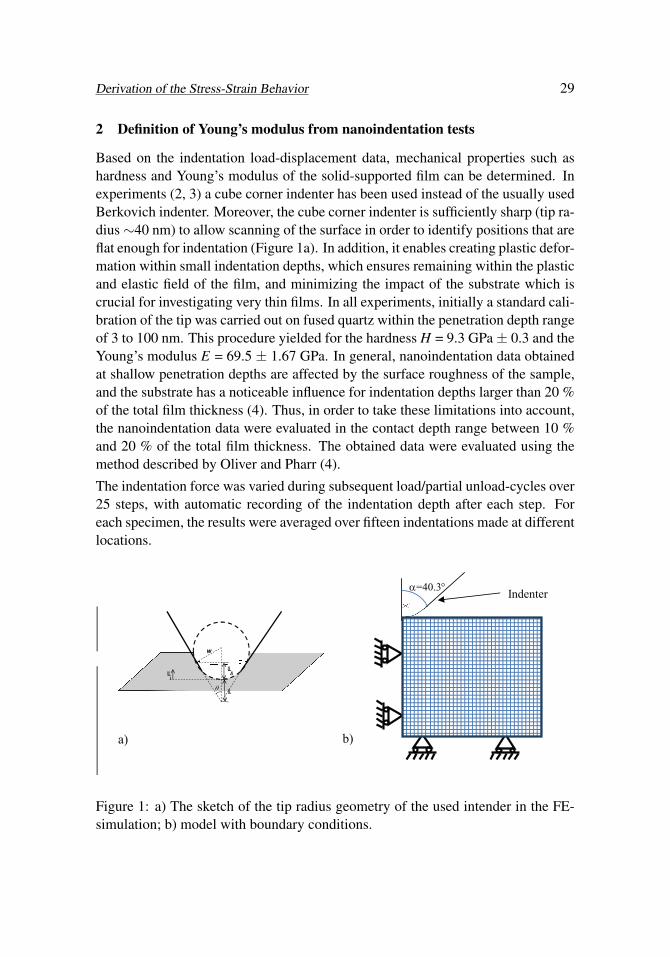
Based on the indentation load-displacement data, mechanical properties such ashardness and Young’s modulus of the solid-supported film can be determined. Inexperiments (2, 3) a cube corner indenter has been used instead of the usually usedBerkovich indenter. Moreover, the cube corner indenter is sufficiently sharp (tip ra-dius∼40 nm) to allow scanning of the surface in order to identify positions that areflat enough for indentation (Figure 1a). In addition, it enables creating plastic defor-mation within small indentation depths, which ensures remaining within the plasticand elastic field of the film, and minimizing the impact of the substrate which iscrucial for investigating very thin films. In all experiments, initially a standard cali-bration of the tip was carried out on fused quartz within the penetration depth rangeof 3 to 100 nm. This procedure yielded for the hardness H = 9.3 GPa± 0.3 and theYoung’s modulus E = 69.5 ± 1.67 GPa. In general, nanoindentation data obtainedat shallow penetration depths are affected by the surface roughness of the sample,and the substrate has a noticeable influence for indentation depths larger than 20 %of the total film thickness (4). Thus, in order to take these limitations into account,the nanoindentation data were evaluated in the contact depth range between 10 %and 20 % of the total film thickness. The obtained data were evaluated using themethod described by Oliver and Pharr (4).
The indentation force was varied during subsequent load/partial unload-cycles over25 steps, with automatic recording of the indentation depth after each step. Foreach specimen, the results were averaged over fifteen indentations made at differentlocations.
w
╙Ă
╙�
╙ľ
a) b)
=40.3 Indenter
Figure 1: a) The sketch of the tip radius geometry of the used intender in the FE-simulation; b) model with boundary conditions.
30 Copyright © 2013 Tech Science Press MCB, vol.10, no.1, pp.27-42, 2013
According to Oliver and Pharr (4), the hardness H of the tested material is given asthe maximal applied load Pmax (read from the load-displacement curve) divided bythe projected contact area of the indentation at this load Ac:
H =Pmax
Ac(1)
The contact area Ac is considered as an area function of the contact depth hc:
Ac = F (hc) =C0h2c +C1hc +C2h1/2
c +C3h1/4c +C4h1/8
c +C5h1/16c (2)
where C is 2.598 for a cube corner probe, Ci(i = 1-5) are positive coefficients, F isthe force and the contact depth hc is given by the equation:
hc = hmax− ε · Pmax
S(3)
The latter term describes the deflection of the surface at the contact parameter. Thegeometric constant ε is founded on the geometry of the indenter tip (ε = 0.75) andthe initial unloading contact stiffness S. S is the slope of the upper portion of theunloading curve during the initial stage of unloading and is defined as followingequation:
S =dPdh
(4)
The reduced elastic modulus Er can be calculated from the contact area Ac and theunloading contact stiffness S as follows:
Er =
√π
2√
Ac·S (5)
The reduced elastic modulus Er is defined by the Young’s modulus of the sampleEs:
1Er
=
(1−υ2
i)
Ei+
(1−υ2
s)
Es(6)
The symbols ν and E denote the Poisson’s ratio and Young’s modulus for the sam-ple with subscript s and the indenter material with subscript i. In the experiments,the nanoindenterconsists out of diamond with Ei = 1141 GPa and ν I = 0.07.
According to the procedure described above the Young’s modulus of pure titaniumdioxide and polyelectrolyte have been obtained from nanoindentation. The aver-aged Young’s modulus of over 50 indents in cross sections as well as the surfacefor the different indentation depth have been obtained and are equal to 27 GPa forTiO2 and 5 GPa for PE.
Derivation of the Stress-Strain Behavior 31
3 Finite element modeling of nanoindentation
Limited studies are available to obtain the plastic properties with the nanoinden-tation technique. Therefore, the indentation loading process is simulated with theFinite Element Method (FEM) and the software ABAQUS/CAE (Version 6.11-1,Dassault Systemes Simulia Corp., Providence, RI, USA), assuming finite deforma-tion characteristics. Instrumented indentation using a conical indenter (shown inFig. 1a) has been simulated assuming axisymmetric and frictionless contact. Forthe simulation of deformation response of the pure titanium dioxide layer and thepure PE layer 80000 four-node axisymmetric elements (CAX4) were used.
The model of the indenter used in the present simulations has a conical shape witha tip-radius of 40 nm and a semi vertical angle of 40.3˚ which gives the samearea to depth function as that of a cube-corner indenter, used in the experiment.Since large deformation takes place near the indenter tip, mesh refinement wasaccomplished near the contact zone. The conical indenter was modeled by theuse of an analytical rigid surface. Symmetry boundary conditions were applied tothe cut faces of the quadrant while the remaining edges were unconstrained in themodeling of indentation by a conical indenter. In the case of indentation of theconical indenter the nodes along the axis of rotation were free to move only alongthe Y-axis (Fig. 1b).
By applying a downward displacement to the rigid body reference node of the in-denter the indentation process was simulated. The indentation depth was measuredfrom the displacement of the node, situated directly under the indenter tip, i. e. atthe point of first contact and the indentation load for the conical indenter was thereaction force of the reference node of the rigid indenter.
The friction between the material and indenter does not require special considera-tion and can be omitted in the inverse analysis (5).
For the definition of the plastic properties of the constituent phases (TiO2 and PE)the method of inverse modeling has been applied in two steps:
At first, the stress-strain curve for pure titanium dioxide has been obtained by com-paring the P-h curve obtained from the FE-calculations with the experimentallyobtained one for pure titanium dioxide. The second step was to follow the sameprocedure for the stress-strain curve of polyelectrolyte.
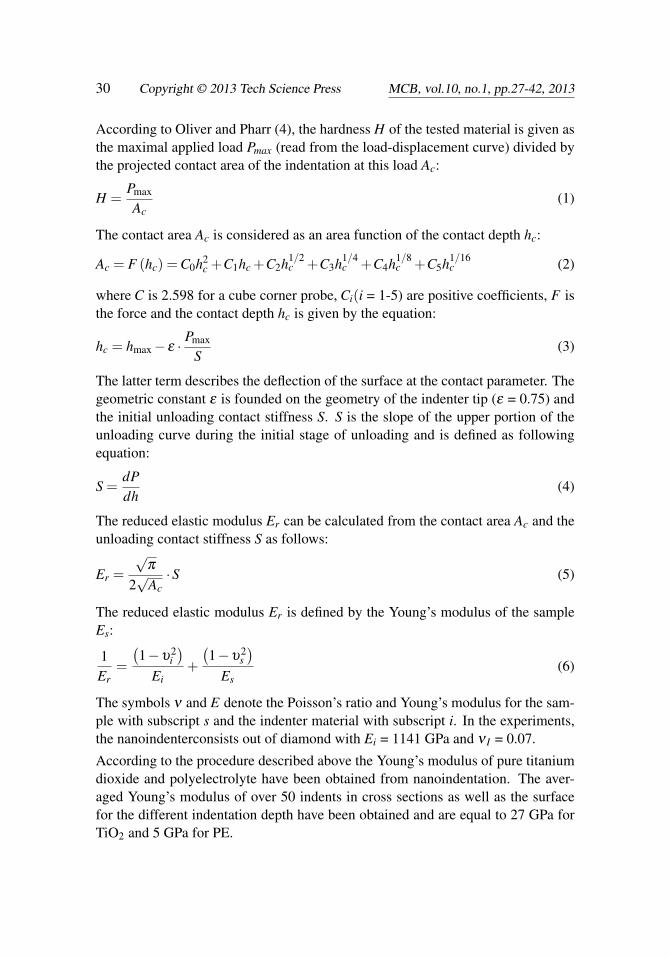
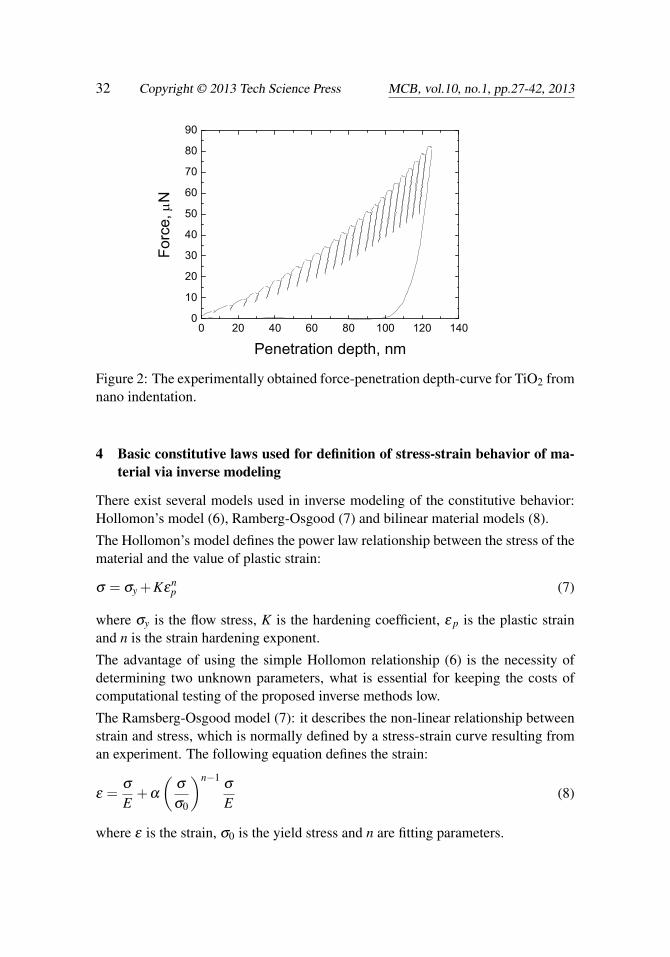
Shown in Fig. 2 is the force-penetration curve that has been obtained in the exper-iment. Nanoindentation tests have been performed till the penetration depth beingequal to 120 nm following the procedure loading-unloading, the maximum forceattained in the experiment was around 80 µN and the penetration depth around120 nm. The material is supposed to be homogeneous, isotropic and elasto-plasticusing the classical plasticity model with von Mises criterion.
32 Copyright © 2013 Tech Science Press MCB, vol.10, no.1, pp.27-42, 2013
0 20 40 60 80 100 120 1400
10
20
30
40
50
60
70
80
90
Forc
e,
N
Penetration depth, nm Figure 2: The experimentally obtained force-penetration depth-curve for TiO2 fromnano indentation.
4 Basic constitutive laws used for definition of stress-strain behavior of ma-terial via inverse modeling
There exist several models used in inverse modeling of the constitutive behavior:Hollomon’s model (6), Ramberg-Osgood (7) and bilinear material models (8).
The Hollomon’s model defines the power law relationship between the stress of thematerial and the value of plastic strain:
σ = σy +Kεnp (7)
where σy is the flow stress, K is the hardening coefficient, ε p is the plastic strainand n is the strain hardening exponent.
The advantage of using the simple Hollomon relationship (6) is the necessity ofdetermining two unknown parameters, what is essential for keeping the costs ofcomputational testing of the proposed inverse methods low.
The Ramsberg-Osgood model (7): it describes the non-linear relationship betweenstrain and stress, which is normally defined by a stress-strain curve resulting froman experiment. The following equation defines the strain:
ε =σ
E+α
(σ
σ0
)n−1σ
E(8)
where ε is the strain, σ0 is the yield stress and n are fitting parameters.
Derivation of the Stress-Strain Behavior 33
The last model used here is the bilinear model (8). A bilinear constitutive law(relationship between the true stress and the true strain) is defined by the elasticmodulus E, the yield stress and the work hardening rate β .
The model is expressed by the following equations for the stress σ I:
σi = Eεi if σi ≥ σy (9)
σi = σy +β (Eεi−σy) if σi < σy (10)
with 0 ≤ β ≤ 1; β = 1 for ideal elastic materials, β = 0 for ideal plastic materials.
5 Modeling the titanium dioxide elasto-plastic behavior
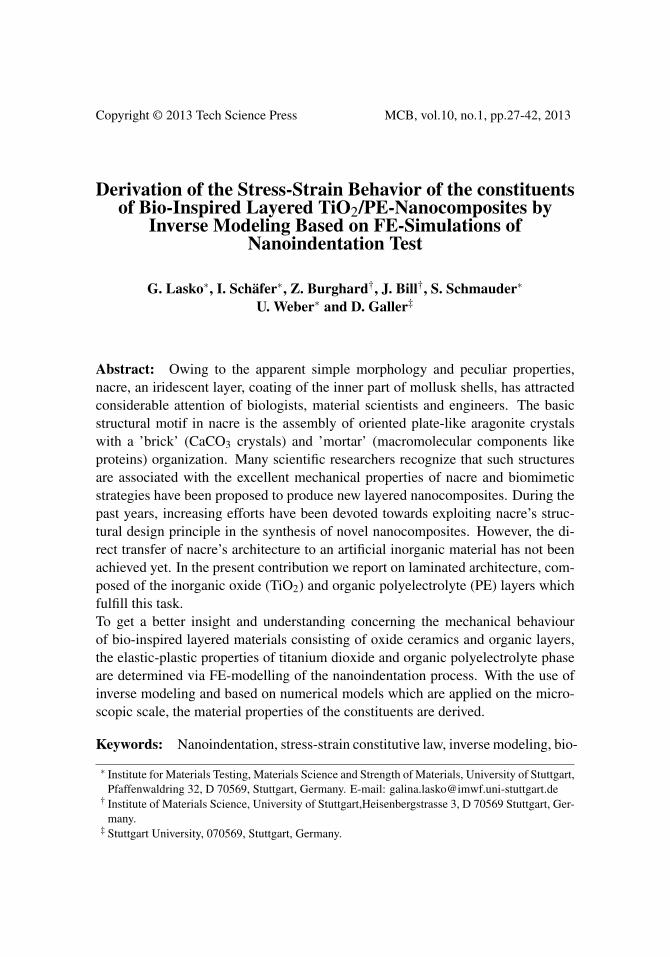
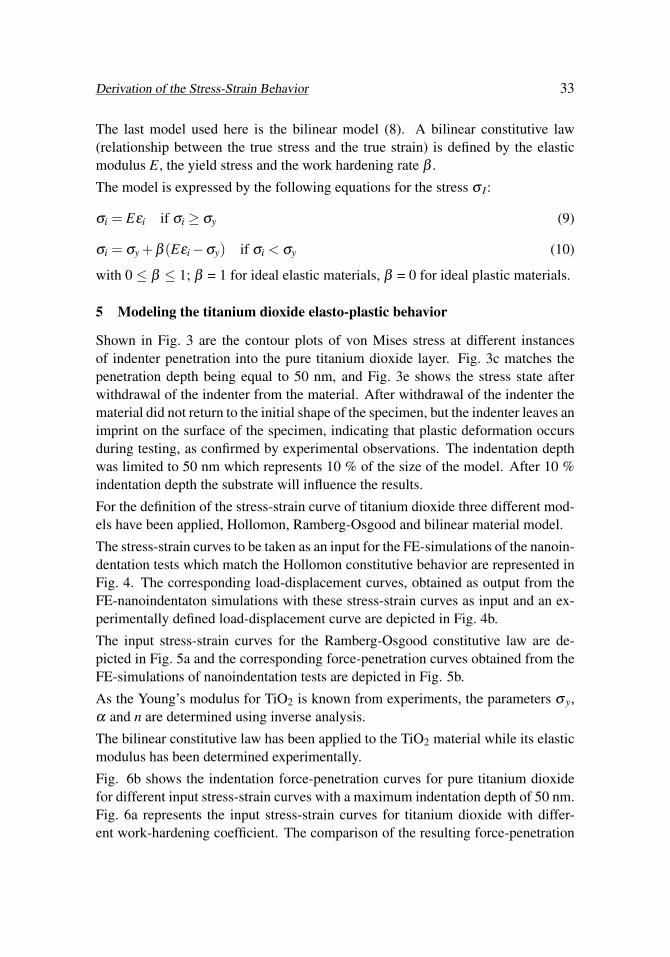
Shown in Fig. 3 are the contour plots of von Mises stress at different instancesof indenter penetration into the pure titanium dioxide layer. Fig. 3c matches thepenetration depth being equal to 50 nm, and Fig. 3e shows the stress state afterwithdrawal of the indenter from the material. After withdrawal of the indenter thematerial did not return to the initial shape of the specimen, but the indenter leaves animprint on the surface of the specimen, indicating that plastic deformation occursduring testing, as confirmed by experimental observations. The indentation depthwas limited to 50 nm which represents 10 % of the size of the model. After 10 %indentation depth the substrate will influence the results.
For the definition of the stress-strain curve of titanium dioxide three different mod-els have been applied, Hollomon, Ramberg-Osgood and bilinear material model.
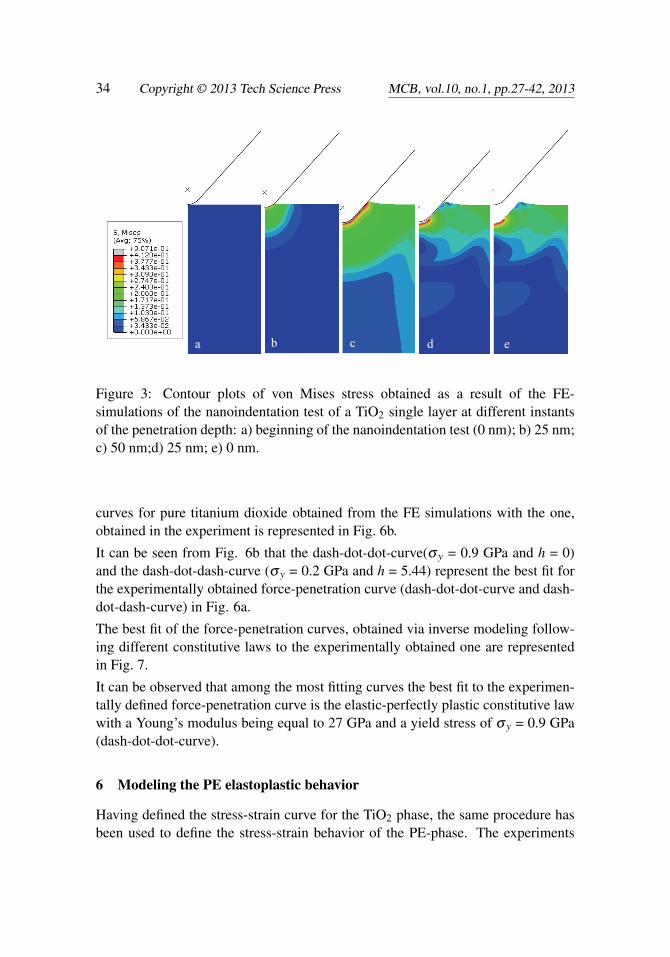
The stress-strain curves to be taken as an input for the FE-simulations of the nanoin-dentation tests which match the Hollomon constitutive behavior are represented inFig. 4. The corresponding load-displacement curves, obtained as output from theFE-nanoindentaton simulations with these stress-strain curves as input and an ex-perimentally defined load-displacement curve are depicted in Fig. 4b.
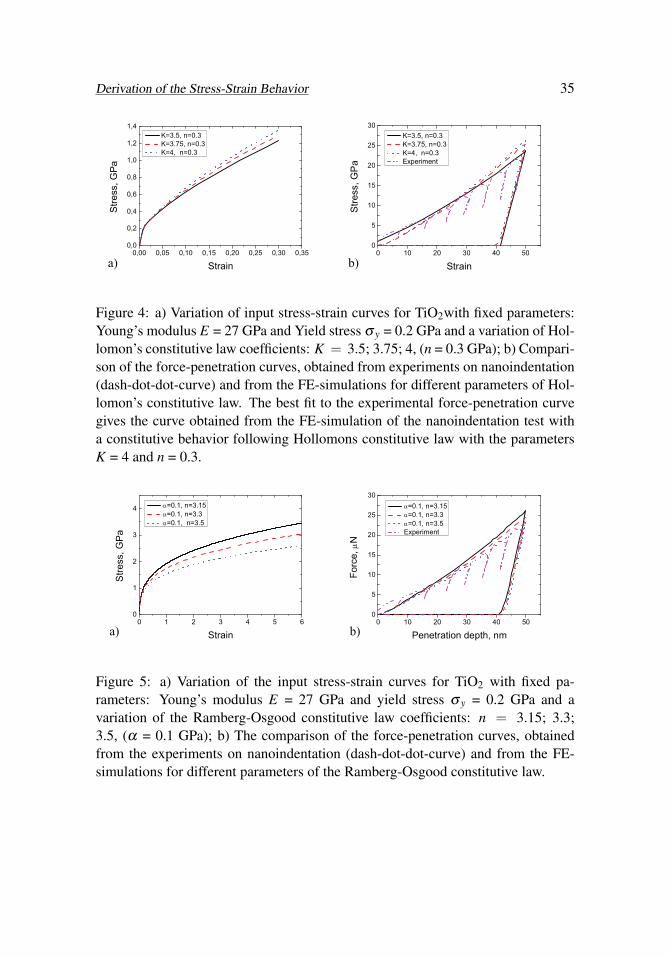
The input stress-strain curves for the Ramberg-Osgood constitutive law are de-picted in Fig. 5a and the corresponding force-penetration curves obtained from theFE-simulations of nanoindentation tests are depicted in Fig. 5b.
As the Young’s modulus for TiO2 is known from experiments, the parameters σ y,α and n are determined using inverse analysis.
The bilinear constitutive law has been applied to the TiO2 material while its elasticmodulus has been determined experimentally.
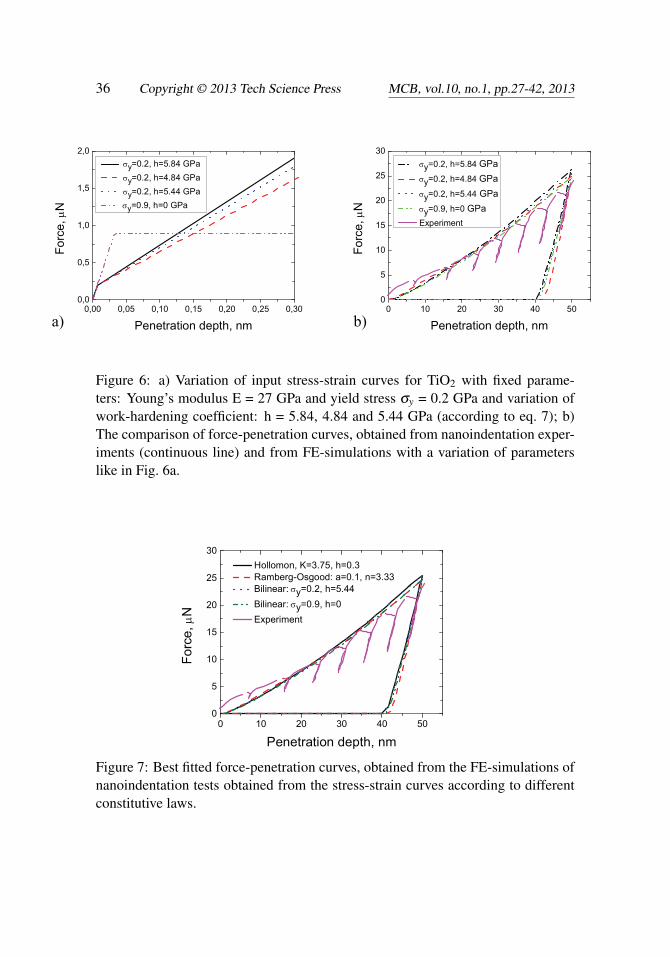
Fig. 6b shows the indentation force-penetration curves for pure titanium dioxidefor different input stress-strain curves with a maximum indentation depth of 50 nm.Fig. 6a represents the input stress-strain curves for titanium dioxide with differ-ent work-hardening coefficient. The comparison of the resulting force-penetration
34 Copyright © 2013 Tech Science Press MCB, vol.10, no.1, pp.27-42, 2013
b c d e a
Figure 3: Contour plots of von Mises stress obtained as a result of the FE-simulations of the nanoindentation test of a TiO2 single layer at different instantsof the penetration depth: a) beginning of the nanoindentation test (0 nm); b) 25 nm;c) 50 nm;d) 25 nm; e) 0 nm.
curves for pure titanium dioxide obtained from the FE simulations with the one,obtained in the experiment is represented in Fig. 6b.
It can be seen from Fig. 6b that the dash-dot-dot-curve(σ y = 0.9 GPa and h = 0)and the dash-dot-dash-curve (σ y = 0.2 GPa and h = 5.44) represent the best fit forthe experimentally obtained force-penetration curve (dash-dot-dot-curve and dash-dot-dash-curve) in Fig. 6a.
The best fit of the force-penetration curves, obtained via inverse modeling follow-ing different constitutive laws to the experimentally obtained one are representedin Fig. 7.
It can be observed that among the most fitting curves the best fit to the experimen-tally defined force-penetration curve is the elastic-perfectly plastic constitutive lawwith a Young’s modulus being equal to 27 GPa and a yield stress of σ y = 0.9 GPa(dash-dot-dot-curve).
6 Modeling the PE elastoplastic behavior
Having defined the stress-strain curve for the TiO2 phase, the same procedure hasbeen used to define the stress-strain behavior of the PE-phase. The experiments
Derivation of the Stress-Strain Behavior 35
0,00 0,05 0,10 0,15 0,20 0,25 0,30 0,350,0
0,2
0,4
0,6
0,8
1,0
1,2
1,4
Stre
ss, G
Pa
Strain
K=3.5, n=0.3 K=3.75, n=0.3 K=4, n=0.3
0 10 20 30 40 500
5
10
15
20
25
30
Stre
ss, G
Pa
Strain
K=3.5, n=0.3 K=3.75, n=0.3 K=4, n=0.3 Experiment
a) b)
Figure 4: a) Variation of input stress-strain curves for TiO2with fixed parameters:Young’s modulus E = 27 GPa and Yield stress σ y = 0.2 GPa and a variation of Hol-lomon’s constitutive law coefficients: K = 3.5; 3.75; 4, (n = 0.3 GPa); b) Compari-son of the force-penetration curves, obtained from experiments on nanoindentation(dash-dot-dot-curve) and from the FE-simulations for different parameters of Hol-lomon’s constitutive law. The best fit to the experimental force-penetration curvegives the curve obtained from the FE-simulation of the nanoindentation test witha constitutive behavior following Hollomons constitutive law with the parametersK = 4 and n = 0.3.
0 1 2 3 4 5 60
1
2
3
4
Stre
ss, G
Pa
Strain
=0.1, n=3.15 =0.1, n=3.3 =0.1, n=3.5
0 10 20 30 40 500
5
10
15
20
25
30
Forc
e,
N
Penetration depth, nm
=0.1, n=3.15 =0.1, n=3.3 =0.1, n=3.5 Experiment
a) b)
Figure 5: a) Variation of the input stress-strain curves for TiO2 with fixed pa-rameters: Young’s modulus E = 27 GPa and yield stress σ y = 0.2 GPa and avariation of the Ramberg-Osgood constitutive law coefficients: n = 3.15; 3.3;3.5, (α = 0.1 GPa); b) The comparison of the force-penetration curves, obtainedfrom the experiments on nanoindentation (dash-dot-dot-curve) and from the FE-simulations for different parameters of the Ramberg-Osgood constitutive law.
36 Copyright © 2013 Tech Science Press MCB, vol.10, no.1, pp.27-42, 2013
0,00 0,05 0,10 0,15 0,20 0,25 0,300,0
0,5
1,0
1,5
2,0 y=0.2, h=5.84 GPa y=0.2, h=4.84 GPa y=0.2, h=5.44 GPa y=0.9, h=0 GPa
Forc
e,
N
Penetration depth, nm0 10 20 30 40 50
0
5
10
15
20
25
30 y=0.2, h=5.84 GPa y=0.2, h=4.84 GPa y=0.2, h=5.44 GPa y=0.9, h=0 GPa Experiment
Forc
e,
N
Penetration depth, nm
a) b)
Figure 6: a) Variation of input stress-strain curves for TiO2 with fixed parame-ters: Young’s modulus E = 27 GPa and yield stress σy = 0.2 GPa and variation ofwork-hardening coefficient: h = 5.84, 4.84 and 5.44 GPa (according to eq. 7); b)The comparison of force-penetration curves, obtained from nanoindentation exper-iments (continuous line) and from FE-simulations with a variation of parameterslike in Fig. 6a.
0 10 20 30 40 500
5
10
15
20
25
30
Forc
e,
N
Penetration depth, nm
Hollomon, K=3.75, h=0.3 Ramberg-Osgood: a=0.1, n=3.33 Bilinear:y=0.2, h=5.44 Bilinear:y=0.9, h=0 Experiment
Figure 7: Best fitted force-penetration curves, obtained from the FE-simulations ofnanoindentation tests obtained from the stress-strain curves according to differentconstitutive laws.
Derivation of the Stress-Strain Behavior 37
0 100 200 300 400 5000
50
100
150
200
250
300
Forc
e,
N
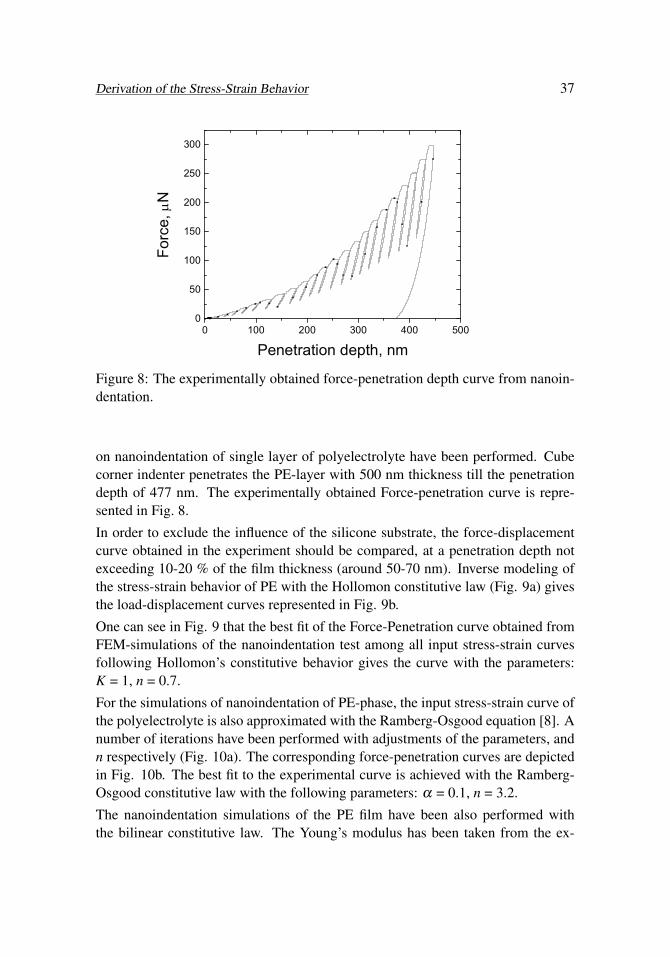
Penetration depth, nm Figure 8: The experimentally obtained force-penetration depth curve from nanoin-dentation.
on nanoindentation of single layer of polyelectrolyte have been performed. Cubecorner indenter penetrates the PE-layer with 500 nm thickness till the penetrationdepth of 477 nm. The experimentally obtained Force-penetration curve is repre-sented in Fig. 8.
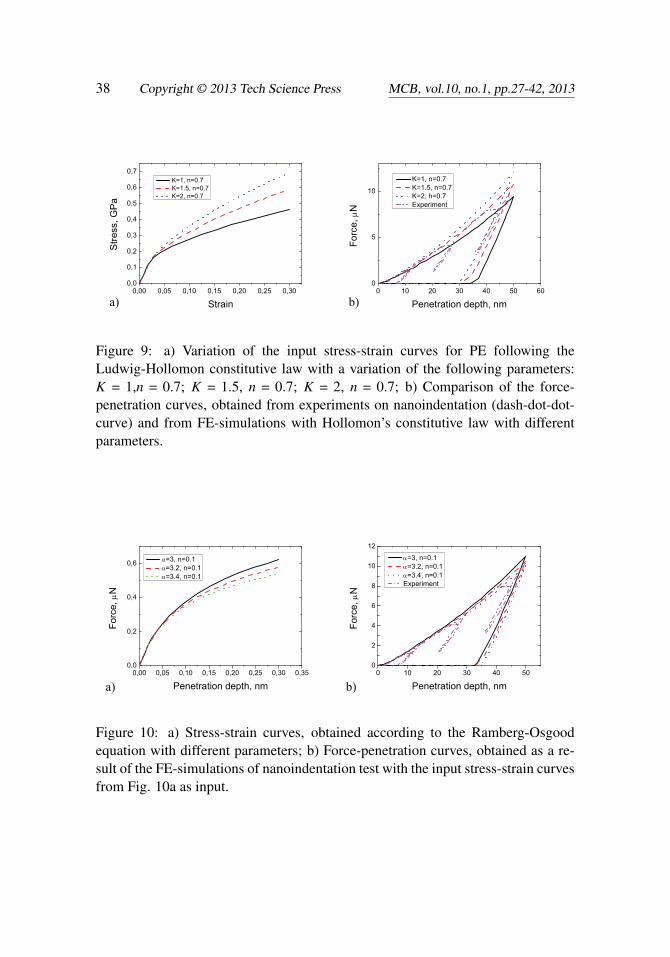
In order to exclude the influence of the silicone substrate, the force-displacementcurve obtained in the experiment should be compared, at a penetration depth notexceeding 10-20 % of the film thickness (around 50-70 nm). Inverse modeling ofthe stress-strain behavior of PE with the Hollomon constitutive law (Fig. 9a) givesthe load-displacement curves represented in Fig. 9b.
One can see in Fig. 9 that the best fit of the Force-Penetration curve obtained fromFEM-simulations of the nanoindentation test among all input stress-strain curvesfollowing Hollomon’s constitutive behavior gives the curve with the parameters:K = 1, n = 0.7.
For the simulations of nanoindentation of PE-phase, the input stress-strain curve ofthe polyelectrolyte is also approximated with the Ramberg-Osgood equation [8]. Anumber of iterations have been performed with adjustments of the parameters, andn respectively (Fig. 10a). The corresponding force-penetration curves are depictedin Fig. 10b. The best fit to the experimental curve is achieved with the Ramberg-Osgood constitutive law with the following parameters: α = 0.1, n = 3.2.
The nanoindentation simulations of the PE film have been also performed withthe bilinear constitutive law. The Young’s modulus has been taken from the ex-
38 Copyright © 2013 Tech Science Press MCB, vol.10, no.1, pp.27-42, 2013
0,00 0,05 0,10 0,15 0,20 0,25 0,300,0
0,1
0,2
0,3
0,4
0,5
0,6
0,7
Stre
ss, G
Pa
Strain
K=1, n=0.7 K=1.5, n=0.7 K=2, n=0.7
0 10 20 30 40 50 600
5
10
K=1, n=0.7 K=1.5, n=0.7 K=2, h=0.7 Experiment
Forc
e,
N
Penetration depth, nm
a) b)
Figure 9: a) Variation of the input stress-strain curves for PE following theLudwig-Hollomon constitutive law with a variation of the following parameters:K = 1,n = 0.7; K = 1.5, n = 0.7; K = 2, n = 0.7; b) Comparison of the force-penetration curves, obtained from experiments on nanoindentation (dash-dot-dot-curve) and from FE-simulations with Hollomon’s constitutive law with differentparameters.
0,00 0,05 0,10 0,15 0,20 0,25 0,30 0,350,0
0,2
0,4
0,6
Forc
e,
N
Penetration depth, nm
=3, n=0.1 =3.2, n=0.1 =3.4, n=0.1
0 10 20 30 40 500
2
4
6
8
10
12
Forc
e,
N
Penetration depth, nm
=3, n=0.1 =3.2, n=0.1 =3.4, n=0.1 Experiment
a) b)
Figure 10: a) Stress-strain curves, obtained according to the Ramberg-Osgoodequation with different parameters; b) Force-penetration curves, obtained as a re-sult of the FE-simulations of nanoindentation test with the input stress-strain curvesfrom Fig. 10a as input.
Derivation of the Stress-Strain Behavior 39
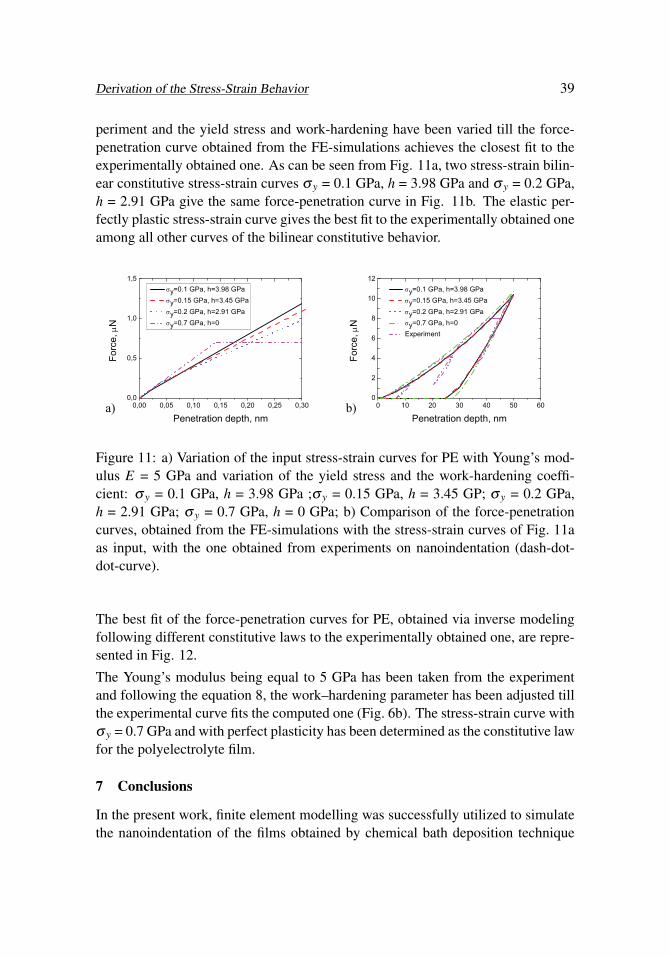
periment and the yield stress and work-hardening have been varied till the force-penetration curve obtained from the FE-simulations achieves the closest fit to theexperimentally obtained one. As can be seen from Fig. 11a, two stress-strain bilin-ear constitutive stress-strain curves σ y = 0.1 GPa, h = 3.98 GPa and σ y = 0.2 GPa,h = 2.91 GPa give the same force-penetration curve in Fig. 11b. The elastic per-fectly plastic stress-strain curve gives the best fit to the experimentally obtained oneamong all other curves of the bilinear constitutive behavior.
0,00 0,05 0,10 0,15 0,20 0,25 0,300,0
0,5
1,0
1,5 y=0.1 GPa, h=3.98 GPa y=0.15 GPa, h=3.45 GPa y=0.2 GPa, h=2.91 GPa y=0.7 GPa, h=0
Forc
e,
N
Penetration depth, nm0 10 20 30 40 50 60
0
2
4
6
8
10
12 y=0.1 GPa, h=3.98 GPa y=0.15 GPa, h=3.45 GPa y=0.2 GPa, h=2.91 GPa y=0.7 GPa, h=0 Experiment
Forc
e,
N
Penetration depth, nm
a) b)
Figure 11: a) Variation of the input stress-strain curves for PE with Young’s mod-ulus E = 5 GPa and variation of the yield stress and the work-hardening coeffi-cient: σ y = 0.1 GPa, h = 3.98 GPa ;σ y = 0.15 GPa, h = 3.45 GP; σ y = 0.2 GPa,h = 2.91 GPa; σ y = 0.7 GPa, h = 0 GPa; b) Comparison of the force-penetrationcurves, obtained from the FE-simulations with the stress-strain curves of Fig. 11aas input, with the one obtained from experiments on nanoindentation (dash-dot-dot-curve).
The best fit of the force-penetration curves for PE, obtained via inverse modelingfollowing different constitutive laws to the experimentally obtained one, are repre-sented in Fig. 12.
The Young’s modulus being equal to 5 GPa has been taken from the experimentand following the equation 8, the work–hardening parameter has been adjusted tillthe experimental curve fits the computed one (Fig. 6b). The stress-strain curve withσ y = 0.7 GPa and with perfect plasticity has been determined as the constitutive lawfor the polyelectrolyte film.
7 Conclusions
In the present work, finite element modelling was successfully utilized to simulatethe nanoindentation of the films obtained by chemical bath deposition technique

40 Copyright © 2013 Tech Science Press MCB, vol.10, no.1, pp.27-42, 2013
0 10 20 30 40 50 600
2
4
6
8
10
12 Hollomon, K=1.5, n=0.7 Ramberg-Osgood, a=3.2, n=0.1 Bilinear: sy=0.7 GPa, h=0 Experiment
Forc
e,
N
Penetration depth, nm Figure 12: Best fit force-penetration curves, obtained from FE-simulations ofnanoindentation tests obtained from stress-strain curves according to different con-stitutive laws. Young’s modulus was taken from the experiment (5 GPa).
Derivation of the Stress-Strain Behavior 41
(TiO2) and layer by layer technique (PE) to obtain the mechanical properties (elas-tic and plastic properties) of inorganic (TiO2) and organic (PE) thin films.
The output force-penetration curves, obtained from the FE-simulations of nanoin-dentation tests of thin TiO2 and PE films based on inverse modelling with takinginto account the input stress-strain curves following different constitutive laws havebeen compared with force-penetration curves, obtained from the experiment.
For the TiO2 film, the force-penetration curves, obtained from the FE–simulationsof nanoindentation tests is obtained being identical to the experimental one eitherwith lower yield σ y = 0.2 GPa and work-hardening (h = 5.44), or with perfect plas-ticity and higher yield stress (σ y = 0.9 GPa). For the polyelectrolyte film the force-penetration curve, obtained from the FE–simulations of nanoindentation tests, isobtained being identical to the experimental one with perfect plasticity and stress(σ y = 0.9 GPa).
The work-hardening behaviour and higher yield stress of ceramics (TiO2) and or-ganic (PE) are not typical for materials produced by chemical bath deposition tech-nique (TiO2) and layer-by-layer deposition technique (PE). For amorphous or non-metallic materials, the work-hardening is assumed to be very low (9). Both effectscould be explained by the manifestation of the influence of the more rigid substrate.In the present work we did not take into account the influence of the substrate, as-suming that at the shallow penetration of 10 % there is no influence of the sub-strate. The ambiguity of bilinear stress-stain constitutive law with work-hardeningand without it (with perfect plasticity) will be the topic of our further investigations.
Acknowledgement: The authors acknowledge funding by the German ResearchFoundation (Deutsche Forschungs gemeinschaft, DFG), project number Schm 746/88-1.
References
1. Barthelat F (2007) Biomimetics for next generation materials. Philosophi-cal transactions Series A, Mathematical, physical, and engineering sciences365:2907–19.
2. Burghard Z et al. (2007) Nanomechanical Properties of Bioinspired Organic–Inorganic Composite Films. Advanced Materials 19:970–974.
3. Burghard Z et al. (2009) Toughening through nature-adapted nanoscale de-sign. Nano letters 9:4103–8.
4. Oliver W, Pharr G (1992) An improved technique for determining hardness
42 Copyright © 2013 Tech Science Press MCB, vol.10, no.1, pp.27-42, 2013
and elastic modulus using load and displacement sensing indentation exper-iments. Journal of Materials Research 7 (6):1564–1583.
5. Kopernik M, Szeliga D (2007) Modelling of nanomaterials-sensitivity anal-ysis with respect to the material parameters. Computer Methods in MaterialsScience 7:255–261.
6. Hollomon J (1945) Tensile deformation. Transactions of the American Insti-tute of Mining, Metallurgical and Petroleum Engineers 162:268–290.
7. Ramberg W, Osgood W (1943) Description of stress-strain curves by threeparameters. National Advisory Committee for Aeronautics, Washington, DC,Technical Note No 902 07.
8. Kopernik M, Pietrzyk M (2007) 2D numerical simulation of elasto-plasticdeformation of thin hard coating systems in deep nanoindentation test withsharp indenter. Archives of Metallurgy and Materials 52:299–310.
9. Knapp J a., Follstaedt DM, Myers SM, Barbour JC, Friedmann T a. (1999)Finite-element modeling of nanoindentation. Journal of Applied Physics85:1460.