Embed Size (px)
Citation preview

Derivatives on CNXINFRA & CNXPSE

NSE Derivative Product Basket
Stock Futures & Options: 226 securities
Index Futures & Options:
Nifty
Mini Nifty
Bank Nifty
CNX IT
Nifty Midcap 50
Global Indices

NSE Derivative Market Statistics
• Daily average number of contracts – 51 Lakhs• Daily average End of Day OI – Rs 1.29 Lakh Crores.
Composition of F&O turnover

Growth of Index Products & NSE’s International standing

Background• Success of index products contracts particularly NIFTY which is
a broad based index
• BANKNIFTY and CNXIT are the only available sector basedindices
• Demand for additional sector based indices which have ideally20 – 25 constituent stocks
• Public and Infrastructure sectors emerged as an attractiveinvestment segment
• IISL maintains CNX PSE and CNX INFRA indices which havebeen approved by SEBI for derivative contracts

CNX PSE Index is comprised of public sector companies that have over 51% of their outstandingshare capital held by the Central Government and/or State Government, directly or indirectly.
Methodology:• Calculated using free float market capitalization weighted method
Selection Criteria:
CNX PSE Index
• Companies must rank within the top 500 companies by average free-float market capitalisation and
aggregate turnover for the last six months.
• Companies must have 51% of their outstanding share capital held by the Central Government
and/or State Government, directly or indirectly.
• The company's trading frequency should be at least 90% in the last 6 months.
• The company should have reported a positive net worth.
• The company should not form part of the Banking & Financial Services sector.
• The company should have a listing history of 6 months. A company which comes out with an IPO
will be eligible for inclusion in the index, if it fulfills the normal eligibility criteria for the index for a 3
month period instead of a 6 month period.
• Final selection of 20 companies shall be done based on the free-float market capitalization of the
companies. The review will take place on a semi-annual basis.

CNX Infrastructure Index includes companies belonging to Telecom, Power, Port, Air, Roads,Railways, Shipping and other Utility Services providers.
Methodology:• Calculated using free float market capitalization weighted method
Selection Criteria:
CNX INFRA Index
• Companies must rank within the top 500 companies by average free-float market capitalisation and
aggregate turnover for the last six months.
• The company's trading frequency should be at least 90% in the last 6 months.
• The company should have reported a positive net worth.
• A company which comes out with an IPO will be eligible for inclusion in the index, if it fulfills the
normal eligibility criteria for the index for a 3 month period instead of a 6 month period.
• Final selection of 25 companies shall be done based on the free-float market capitalization of the
companies.
• The review will take place on a semi-annual basis.

Composition by Sector
IndustryWeightage
(%)POWER 20.11
OIL EXPLORATION/PRODUCTION 19.84
MINING 14.55
ELECTRICAL EQUIPMENT 12.04
REFINERIES 9.86
GAS 9.11
FINANCIAL INSTITUTION 5.33
STEEL AND STEEL PRODUCTS 3.15
TRAVEL AND TRANSPORT 2.27
ELECTRONICS - INDUSTRIAL 1.45
ALUMINIUM 0.92
ENGINEERING 0.77
SHIPPING 0.6
CNX PSE Index CNX INFRA Index
IndustryWeightage
(%)
ENGINEERING 27.39
POWER 25.78
TELECOMMUNICATION - SERVICES 21.58
ELECTRICAL EQUIPMENT 15.57
CONSTRUCTION 4.97
SHIPPING 3.03
TRAVEL AND TRANSPORT 1.66
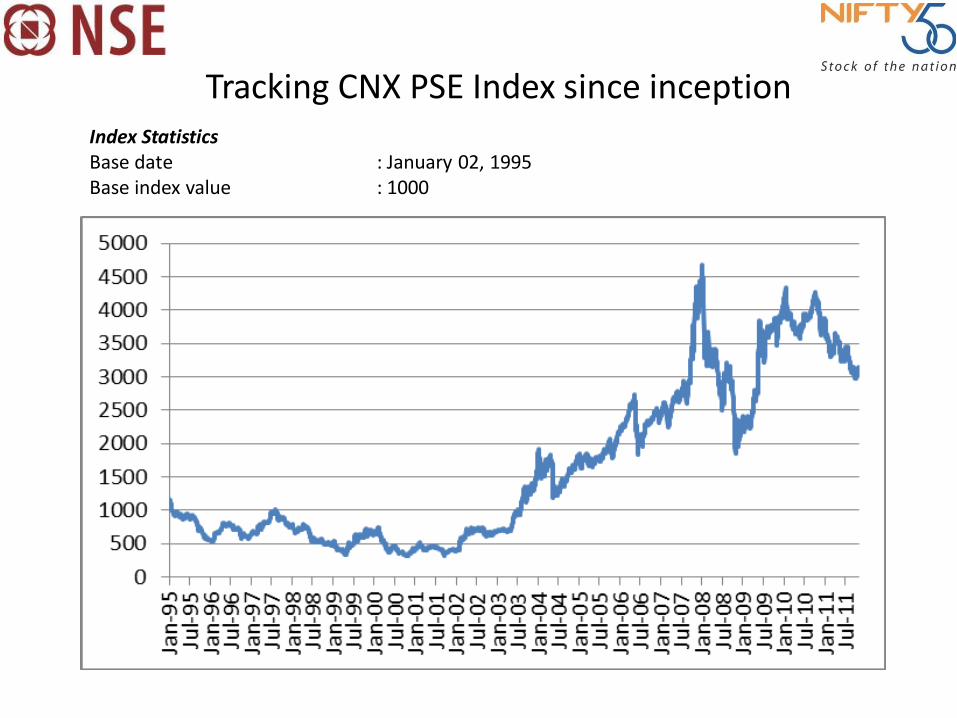
Tracking CNX PSE Index since inception Index StatisticsBase date : January 02, 1995Base index value : 1000

Tracking CNX INFRA Index since inception Index StatisticsBase date : January 01, 2004Base index value : 1000

CNX PSE, CNX INFRA Vs. S&P CNX NIFTY(As on October 31 , 2011) CNX PSE CNX Infra S&P CNX Nifty
Average Market Cap (in Rs. Mn.) (Nov 10 – Oct 11) 2,011,290 3,279,920 16,537,210
P/E Ratio 13.6 19.91 18.9
Price to Book Ratio 2.56 2.58 3.19
Dividend Yield % 2.17 0.96 1.42
Volatility % (of Avg. Daily Returns Nov 10 – Oct 11) 1.04 1.34 1.26
VolatilityCNX PSE CNX Infra
S&P CNX Nifty
(%) (%) (%)
Jan 2007 – Dec 2007 1.74 1.83 1.6
Jan 2008 – Dec 2008 2.79 3.24 2.8
Jan 2009 – Dec 2009 1.9 2.34 2.14
Jan 2010 – Dec 2010 0.98 1.06 1.02
Jan 2011 – Oct 2011 1.04 1.37 1.3
ReturnsCNX PSE CNX Infra
S&P CNX Nifty
(%) (%) (%)
Jan 2007 – Dec 2007 86.07 95.15 54.77
Jan 2008 – Dec 2008 -49.28 -57.15 -51.79
Jan 2009 – Dec 2009 79.25 39.66 75.76
Jan 2010 – Dec 2010 -6.12 -4.01 17.95
Jan 2011 – Oct 2011 -19.67 -22.43 -13.17
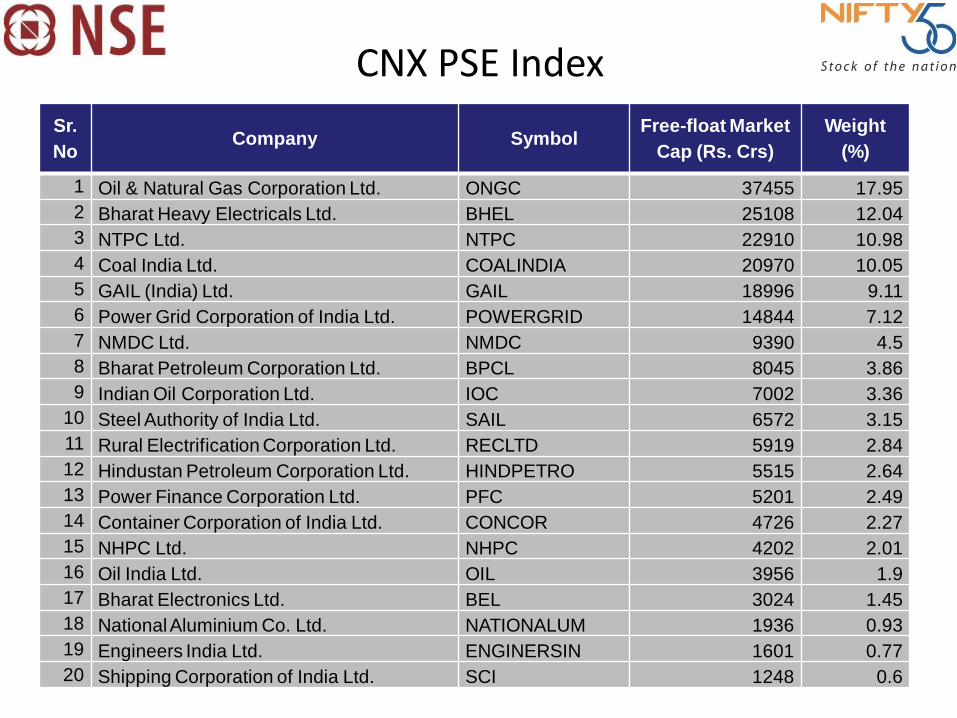
Sr. No
Company Symbol Free-float Market Cap (Rs. Crs)
Weight (%)
1 Oil & Natural Gas Corporation Ltd. ONGC 37455 17.952 Bharat Heavy Electricals Ltd. BHEL 25108 12.043 NTPC Ltd. NTPC 22910 10.984 Coal India Ltd. COALINDIA 20970 10.055 GAIL (India) Ltd. GAIL 18996 9.116 Power Grid Corporation of India Ltd. POWERGRID 14844 7.127 NMDC Ltd. NMDC 9390 4.58 Bharat Petroleum Corporation Ltd. BPCL 8045 3.869 Indian Oil Corporation Ltd. IOC 7002 3.36
10 Steel Authority of India Ltd. SAIL 6572 3.1511 Rural Electrification Corporation Ltd. RECLTD 5919 2.8412 Hindustan Petroleum Corporation Ltd. HINDPETRO 5515 2.6413 Power Finance Corporation Ltd. PFC 5201 2.4914 Container Corporation of India Ltd. CONCOR 4726 2.2715 NHPC Ltd. NHPC 4202 2.0116 Oil India Ltd. OIL 3956 1.917 Bharat Electronics Ltd. BEL 3024 1.4518 National Aluminium Co. Ltd. NATIONALUM 1936 0.9319 Engineers India Ltd. ENGINERSIN 1601 0.7720 Shipping Corporation of India Ltd. SCI 1248 0.6
CNX PSE Index

Sr. No
Company Name Symbol Free-float Market Cap (Rs. Crs)
Weight(%)
1 Larsen & Toubro Ltd. LT 75832 26.592 Bharti Airtel Ltd. BHARTIARTL 47177 16.543 Bharat Heavy Electricals Ltd. BHEL 25108 8.804 NTPC Ltd. NTPC 22910 8.035 Tata Power Co. Ltd. TATAPOWER 16256 5.706 Power Grid Corporation of India Ltd. POWERGRID 14844 5.217 Jaiprakash Associates Ltd. JPASSOCIAT 8755 3.078 Idea Cellular Ltd. IDEA 7788 2.739 Mundra Port and Special Economic Zone Ltd. MUNDRAPORT 7392 2.59
10 Siemens Ltd. SIEMENS 7273 2.5511 Reliance Infrastructure Ltd. RELINFRA 6374 2.2412 Reliance Communications Ltd. RCOM 5296 1.8613 Crompton Greaves Ltd. CROMPGREAV 5290 1.8614 Reliance Power Ltd. RPOWER 5245 1.8415 Container Corporation of India Ltd. CONCOR 4726 1.6616 NHPC Ltd. NHPC 4202 1.4717 ABB Ltd. ABB 3761 1.3218 Adani Power Ltd. ADANIPOWER 3677 1.2919 GMR Infrastructure Ltd. GMRINFRA 3090 1.0820 Suzlon Energy Ltd. SUZLON 2971 1.0421 Voltas Ltd. VOLTAS 2293 0.8022 Tata Communications Ltd. TATACOMM 1285 0.4523 Shipping Corporation of India Ltd. SCI 1248 0.4424 Punj Lloyd Ltd. PUNJLLOYD 1240 0.4325 Lanco Infratech Ltd. LITL 1124 0.39
CNX INFRA Index

Sr. No Company Symbol No. Of Trades
1Coal India Ltd. COALINDIA 64,4572Oil & Natural Gas Corporation Ltd. ONGC 48,4753Bharat Heavy Electricals Ltd. BHEL 36,8974Power Finance Corporation Ltd. PFC 26,0125Steel Authority of India Ltd. SAIL 25,500
Sr. No Company Name Symbol No. Of Trades
1Larsen & Toubro Ltd. LT 85,5502Jaiprakash Associates Ltd. JPASSOCIAT 66,3073Bharti Airtel Ltd. BHARTIARTL 55,3514Reliance Communications Ltd. RCOM 43,8865Bharat Heavy Electricals Ltd. BHEL 36,897
CNX PSE Index – Top 5 Stocks
CNX INFRA Index – Top 5 Stocks

Use of Index Futures & Options• Market exposure• Hedging• Trading with a view• Arbitrage
Some possible opportunities
CNX PSE and CNX INFRA
• Buy index contracts to invest in the emerging sectors of Public sector and Infrastructure
• Possible to do futures-futures arbitrage between PSE and INFRA index futures with theirconstituent stock futures
• Traders having bullish view on PSE and INFRA sectors can buy their Index Futures
• Traders having bearish view on PSE and INFRA sectors can sell their Index Futures
• Hedge for constituents stocks having better correlation with any of these indices by sellingIndex futures

Portfolio Hedging
Scrip Price Shares Value Portfolio
Weight (A) Stocks Beta
(B) Portfolio Beta
(AxB)
BHEL 329.95 100 32995 21% 0.85 0.18
BPCL 569.65 50 28483 18% 0.53 0.10
COALINDIA 326.10 100 32610 21% 0.50 0.10
NTPC 174.05 200 34810 22% 0.74 0.17
ONGC 271.15 100 27115 17% 0.55 0.10
TOTAL 156013 0.64
Investor holding above stocks included in the CNX PSE index can hedge the portfolio
Market sentiments appear to be negative for the short term
To hedge the portfolio against loss in value, use CNX PSE Futures
Take a short position in CNX PSE Futures for Rs 100,119 (0.64 x 156,013)
Any loss in portfolio value will be more than compensated by gain on the PSE Index Futures short position

Waiver on Transaction ChargesNo transaction charges will be levied on the trades done in futures andoptions contracts of CNX PSE and CNX INFRA till six months from thecommencement of trading.

Contract SpecificationLaunch Date: November 25, 2011
Underlying Index CNX PSE INDEX CNX INFRASTRUCTURE INDEX
Security descriptor Futures : FUTIDX CNXPSE Futures : FUTIDX CNXINFRAOptions : OPTIDX CNXPSE Options : OPTIDX CNXINFRA
Contract Size Permitted lot size shall be 75 and multiplesthereof
Permitted lot size shall be 100 and multiplesthereof
Price steps Re. 0.05
Price BandsNo Price bands. However operating range of 10% of base price would be applicable forFutures contracts and a delta based daily price range would be applicable for Optionscontracts.
Trading CycleMaximum of three months – the near month, the next month and the far month. Newcontract shall be introduced on the next trading day following the expiry of near monthcontract
Spread Order Book Futures Spread order contracts will be available for M1-M2, M2-M3 and M1-M3 expiries.
Expiry dayLast Thursday of the expiry month or the previous trading day if the last Thursday is a tradingholiday
Strike Scheme* 6 ITM – 1 ATM – 6 OTM with an interval of 100
Settlement basis Cash settlementStyle of option EuropeanQuantity Freeze 15000
*Based on the current index level as of November 17, 2011

Thank you


![[XLS]food.njau.edu.cnfood.njau.edu.cn/Editor/attached/file/201507/... · Web view271 6.0449999999999999 272 5.33 273 4.5679999999999996 274 4.5679999999999996 275 4.5679999999999996](https://img.pdfslide.net/doc/110x75/5aa7074b7f8b9a424f8bcf4a/xlsfoodnjauedu-view271-60449999999999999-272-533-273-45679999999999996-274.jpg)