Embed Size (px)
Citation preview

DER/Load behaviour during disturbances & dynamic model developmentNERC SPIDERWGOctober 2019
Jenny Riesz
Principal, Operational Analysis & Engineering

About AEMOAEMO operates Australia's National Electricity Market and power grid in Australia’s eastern and south-eastern seaboard, and the Wholesale Electricity Market and power grid in south-west WA.
Both markets supply more than 220 terawatt hours of electricity each year.
We also operate retail and wholesale gas markets across south-eastern Australia and Victoria’s gas pipeline grid.
Collectively NEM & WEM traded over A$20 billion in the last financial year.
Ownership
Marketparticipants
40%Governments of Australia
60%
2

Context
Rooftop PV
Minimum demand in South Australia:
3
DER generation could soon match entire demand in some regions.
• What will this mean for the power system?
• How do we affordably maintain security and reliability for customers throughout this transition?
• What actions do we need to take?

Technical challenges
This presentation will focus on:• DER behaviour during disturbances• Development of accurate dynamic
models
Many technical challenges have been identified and a program of work has been established
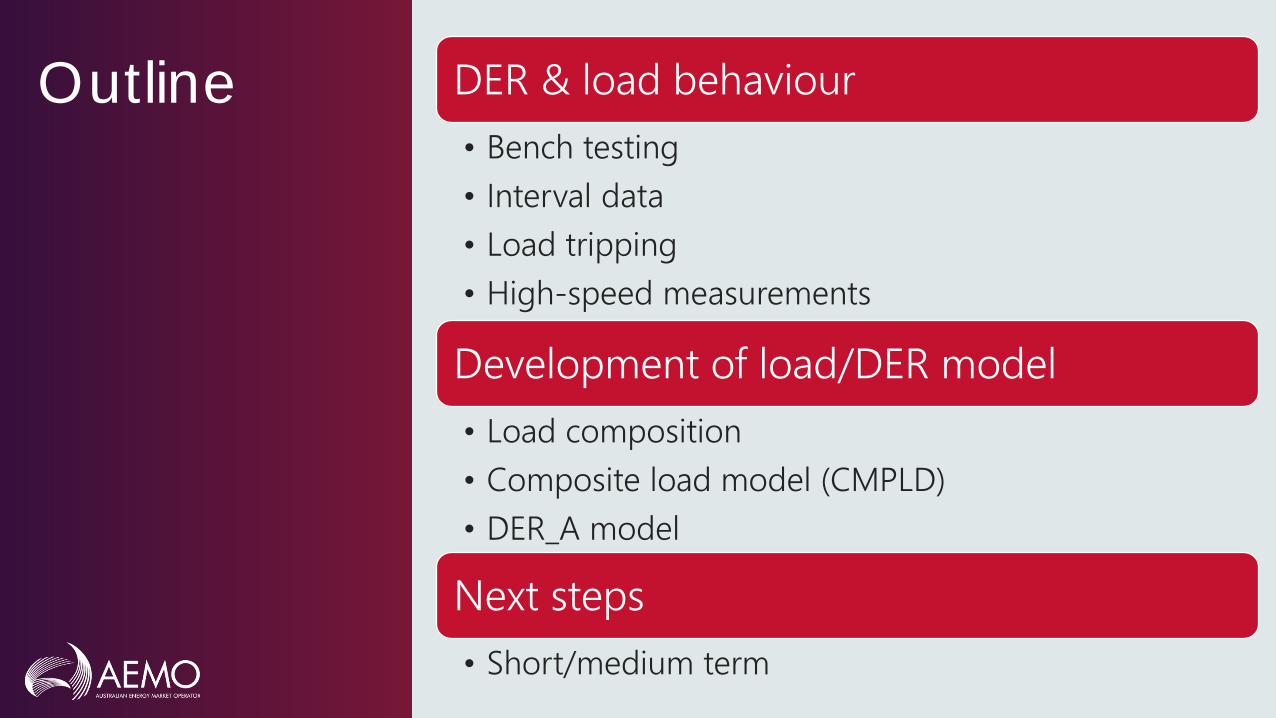
Outline DER & load behaviour• Bench testing• Interval data• Load tripping• High-speed measurements
Development of load/DER model• Load composition• Composite load model (CMPLD)• DER_A model
Next steps• Short/medium term
Bench testing
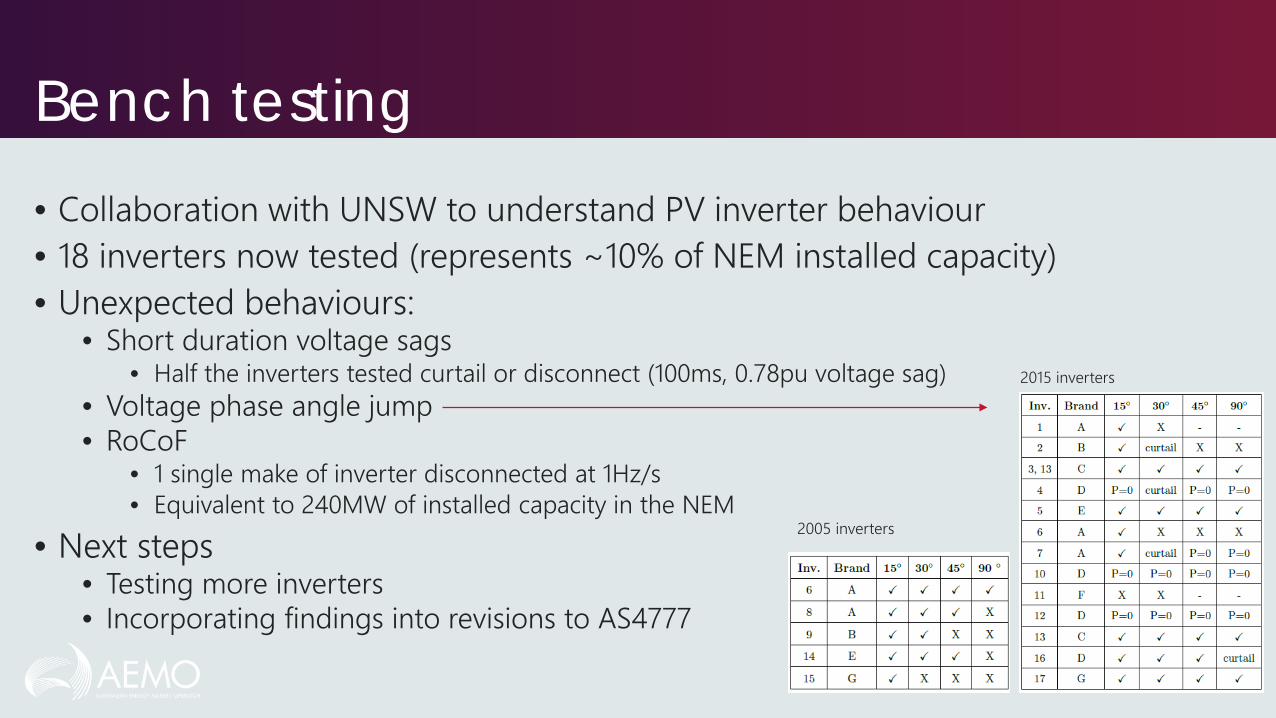
• Collaboration with UNSW to understand PV inverter behaviour• 18 inverters now tested (represents ~10% of NEM installed capacity)• Unexpected behaviours:
• Short duration voltage sags• Half the inverters tested curtail or disconnect (100ms, 0.78pu voltage sag)
• Voltage phase angle jump• RoCoF
• 1 single make of inverter disconnected at 1Hz/s• Equivalent to 240MW of installed capacity in the NEM
• Next steps• Testing more inverters• Incorporating findings into revisions to AS4777
2005 inverters
2015 inverters

Interval data• 30s/60s data for individual PV inverters• Provided by Solar Analytics as part of a collaboration
• Funded by Australian Renewable Energy Agency (ARENA)• Solar Analytics monitors individual PV systems and provides customers with analytics on system performance
• Example: NSW bushfires, 15/04/2018, 07:52-13:00, 13 incidents• 1725 PV systems in Solar Analytics sample, post cleaning

0930 - 0943 hrs
0.90 p.u.
0.95 p.u.
0.93 p.u.
0.78 p.u.0.87 p.u.
0.59 p.u.0.71 p.u.

Frequency events• 10 frequency disturbances analysed, most mild.• No response from DER for ±0.5Hz• One severe frequency event observed:
• PV disconnections• Installed prior to Oct 2015: Consistent with expectations, confirms survey results• Installed post Oct 2016: 4-7% disconnected, inconsistent with AS4777.2:2015
• Frequency-Watt behaviour• AS4777.2:2015 requires droop response to over-frequency exceeding 50.25Hz• At least 15-30% of systems did not respond
• Need for improved auditing and encouragement of compliance with standards
AEMO (10 January 2019), “Final Report – Queensland and South Australia system separation on 25 August 2018 – An operating incident report for the National Electricity Market”. Available at: https://www.aemo.com.au/-/media/Files/Electricity/NEM/Market_Notices_and_Events/Power_System_Incident_Reports/2018/Qld---SA-Separation-25-August-2018-Incident-Report.pdf
AEMO (April 2016), “Response of Existing PV Inverters to Frequency Disturbances”. Available at: https://aemo.com.au/-/media/Files/PDF/Response-of-Existing-PV-Inverters-to-Frequency-Disturbances-V20 pdf

Calculate response in zones (distance from fault location)

Voltage events• Analysis of PV
disconnecting in daytime voltage disturbances 2016-2018 for which high speed data is available
• n=x indicates number of PV systems in sample
<50km
50-150km 150-250km

Load TrippingQuantify load tripping from 4s SCADA data

Energy Queensland dataset• High speed data provided from locations in the Queensland distribution
network (11kV)• 2016-2018• Locations:
• Brendale 11A – Primarily residential• Brendale 14B – Primarily small commercial/industrial• Currimundi – Primarily residential

Typical load response (BRD11A)
Some load loss for deeper faults

Load behaviour• All “normal” events
with distributed PV generation estimated <10%
Commercial shows
significantly more load loss
-3% for -0.35pu
-3% for -0.35pu-8% for -0.5pu
-15% for -0.35pu-35% for -0.5pu

Typical response with high DER operating (BRD11A)
Transient response (<1s)
“steady state” response (>1s)
Load + PV response combined

DER behaviour
• Estimated likely PV generation and underlying load for each event
• Estimated likely loss of load due to voltage dip (based upon trends from overnight data), to add to ΔP observed, and calculate likely change in PV generation.
• BRD11A consistent with disconnection findings from Solar Analytics datasets (<50km)
• May not be adequate data on deep faults at Currimundi for suitable comparison
10-15%For -0.3pu
30-40%For -0.14pu

Model development
• Need to incorporate behaviour into dynamic models (PSSE/PSCAD)
• CMPLD + DER_A• Assistance from PEACE
Consulting• Load model first
• Essential foundation for developing a DER model
1:TMotor A
ElectronicLoad
Static Load
Bss
Bf1 Bf2
Rfdr + j Xfdr
jXxf
DER
Motor B
Motor C
Motor D
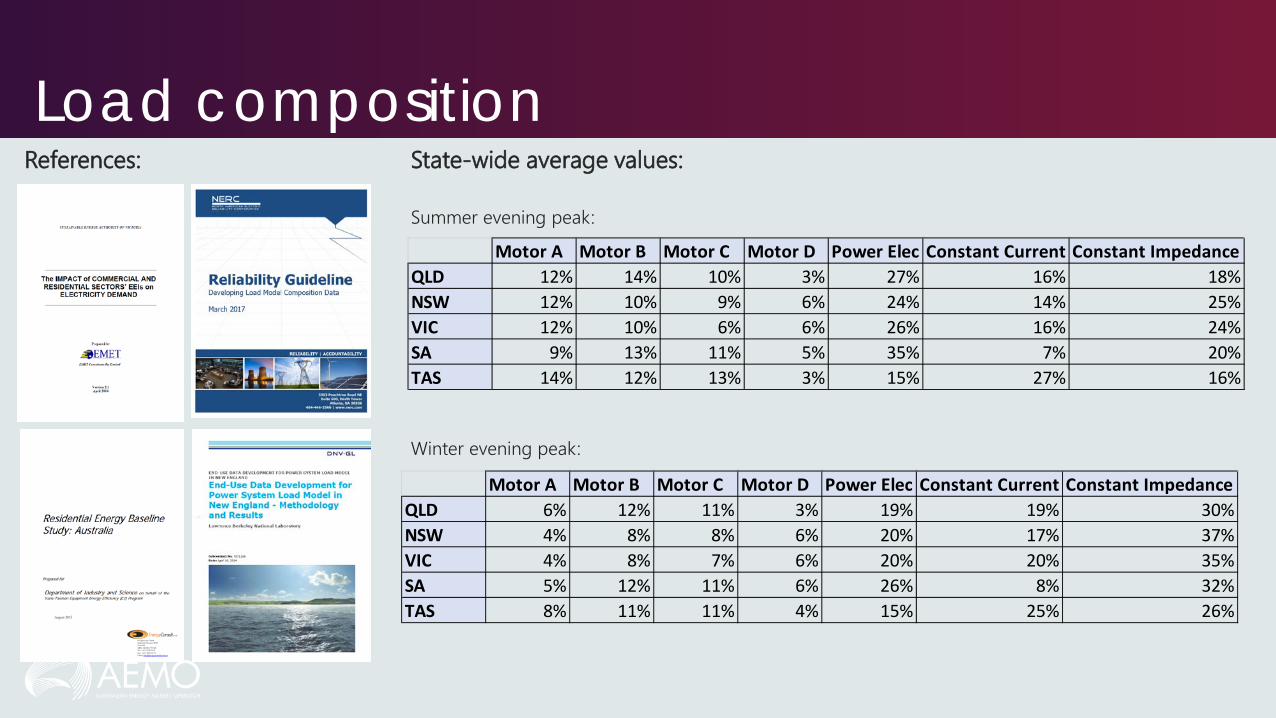
Load composition
Motor A Motor B Motor C Motor D Power Elec Constant Current Constant ImpedanceQLD 12% 14% 10% 3% 27% 16% 18%NSW 12% 10% 9% 6% 24% 14% 25%VIC 12% 10% 6% 6% 26% 16% 24%SA 9% 13% 11% 5% 35% 7% 20%TAS 14% 12% 13% 3% 15% 27% 16%
Motor A Motor B Motor C Motor D Power Elec Constant Current Constant ImpedanceQLD 6% 12% 11% 3% 19% 19% 30%NSW 4% 8% 8% 6% 20% 17% 37%VIC 4% 8% 7% 6% 20% 20% 35%SA 5% 12% 11% 6% 26% 8% 32%TAS 8% 11% 11% 4% 15% 25% 26%
Summer evening peak:
Winter evening peak:
State-wide average values:References:

Playback of distribution events
• Selected events that are relatively balanced• Value in comparison against positive-sequence simulation tool
• Play the positive sequence component of recorded 3-phase voltage into CMLD, and compare measured and simulated P & Q
11 kV
Load Model(CMLD or AEMO’s original ZIP model)
Playback Voltage Source
Small Impedancej0.01 pu

Validation: Distribution events
BRD11A: Comparison of playback simulation using “residential” QLD CMLD composition numbers:
• CMLD is significantly better at replicating reactive power response
• Slightly better at replicating real power response
• Active power spike likely related to motor parameters
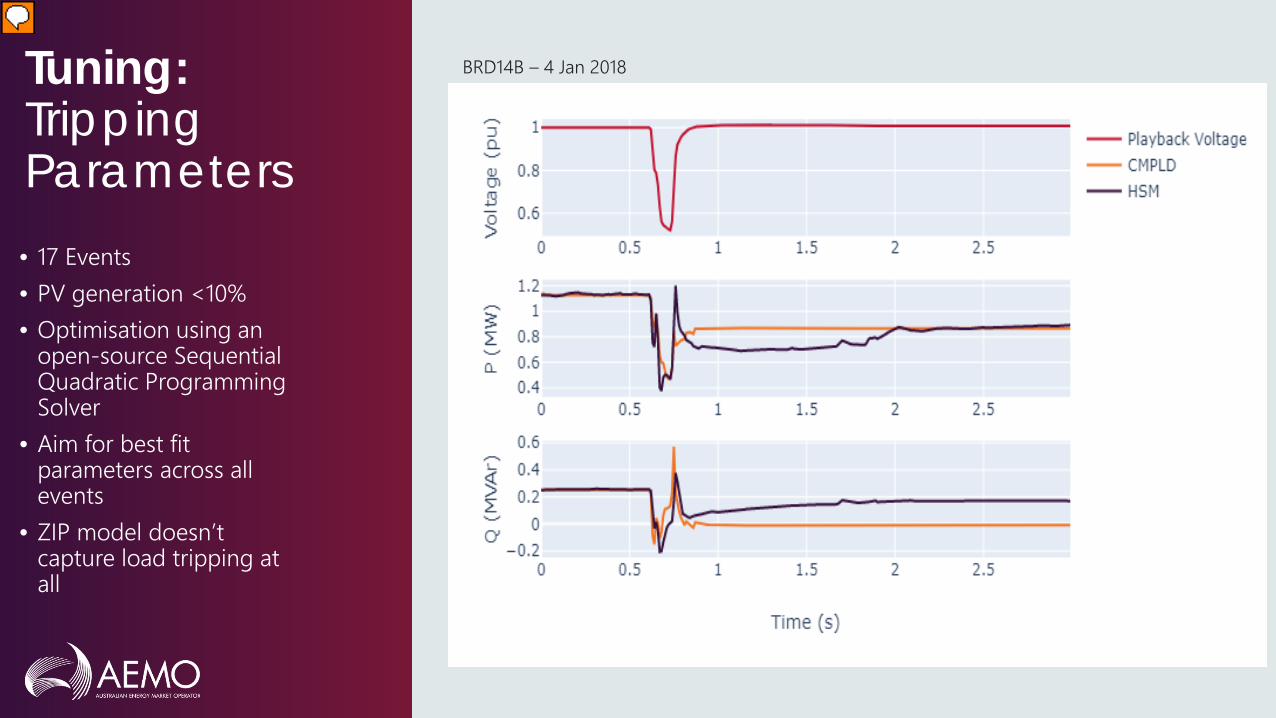
Tuning:Tripping Parameters
22
• 17 Events• PV generation <10%• Optimisation using an
open-source Sequential Quadratic Programming Solver
• Aim for best fit parameters across all events
• ZIP model doesn’t capture load tripping at all
BRD14B – 4 Jan 2018

Validation: System-wide disturbances
15/10/2019 23
NSW 4th Feb 2019, Canberra – Upper Tumut 330kV
Voltage at Lower Tumut NSW Area Load
• CMPLD shows slower recovery, more similar to HSM• Load tripping represented accurately• Voltage overshoot in both models

Validation: System-wide disturbances
15/10/2019Example footer text 24
SA 11th April 2018, Cherry – TIPS B – 275kV
Voltage at Para SA Area Load
• CMPLD shows slower recovery, more similar to HSM• Load tripping represented accurately• Voltage overshoot in both models
Validation: System-wide disturbances
15/10/2019 25
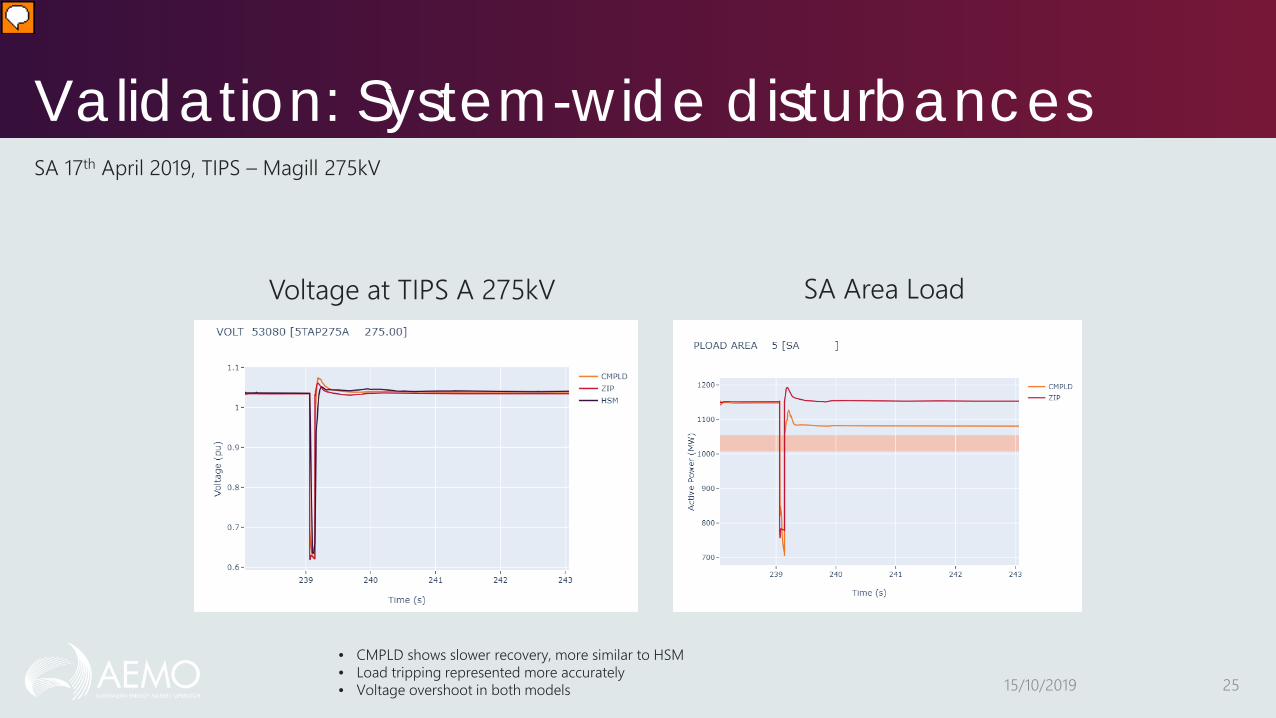
SA 17th April 2019, TIPS – Magill 275kV
Voltage at TIPS A 275kV SA Area Load
• CMPLD shows slower recovery, more similar to HSM• Load tripping represented more accurately• Voltage overshoot in both models

Summary of Results
15/10/2019 26
Event Voltage Recovery speed Load Loss Voltage Overshoot
ZIP CMPLD ZIP CMPLD Observed ZIP CMPLD
NSW 4th February 2019 Faster Faster Accurate Accurate 0MW High Moderate
VIC 8th March 2018 Faster Slower None 23% of Observed 276 MW Moderate Moderate
VIC 9th December 2018 Faster Slower Accurate Accurate 0MW Moderate High
SA 11th April 2018 Faster Faster None Accurate 117 MW Moderate High
VIC 15th February 2019 Faster Faster Accurate Accurate 0MW High Moderate
NSW 15th August 2019 Faster Slower Accurate Accurate 0MW Moderate Moderate
SA 17th April 2019 Faster Faster None 59% of Observed 118 MW Moderate High
VIC 18th February 2019 Faster Slower None Accurate 69 MW High High
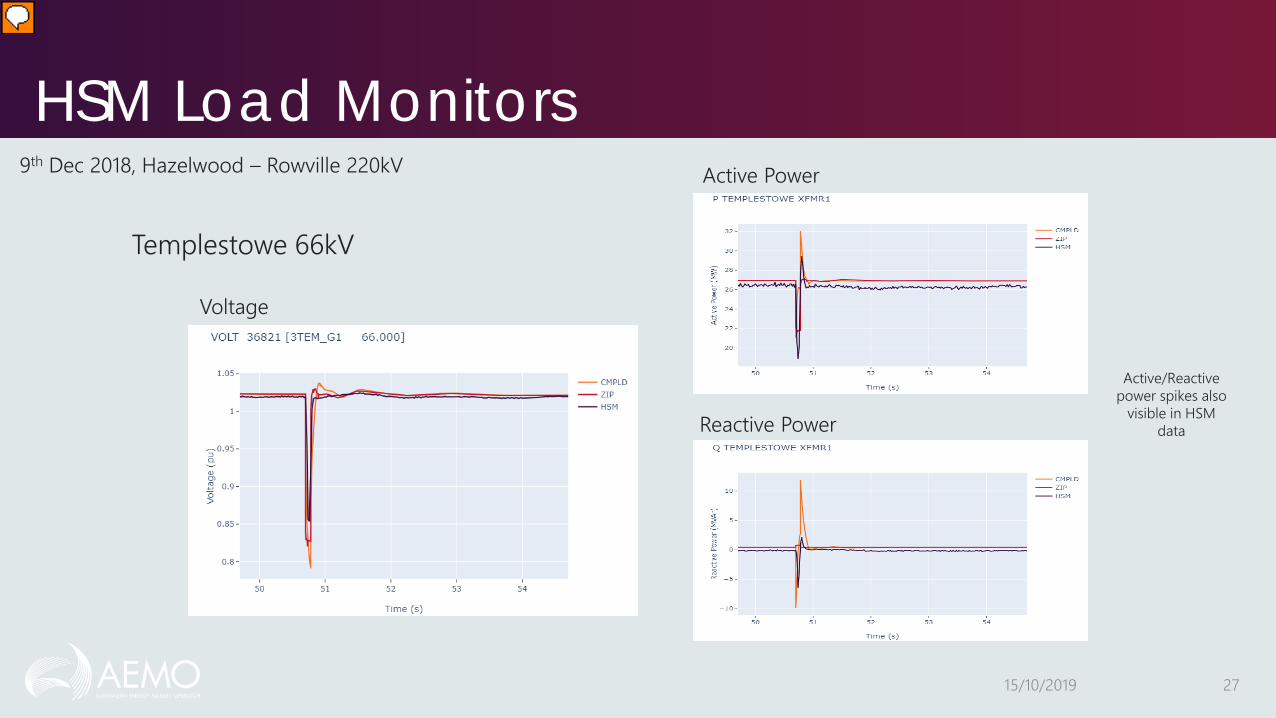
HSM Load Monitors
15/10/2019 27
9th Dec 2018, Hazelwood – Rowville 220kV
Templestowe 66kV
Voltage
Active Power
Reactive Power
Active/Reactive power spikes also
visible in HSM data

DER_A model

DER_A model testing
Motor load composition reduced, majority of load moved to electronic load

DER_A model testing
Trip levels for power electronic load and trip time for first trip setting of DER_A adjusted.

DER_A adjustments (UNSW)• DER_A can’t capture some
important behaviours observed
• Introduce aggregate partial frequency tripping model
• Survey of 2005 tripping frequencies/pick-up times
• Introduce RoCoF tripping• Incorporate proportion of
2015/2015 standards in the model
• Voltage phase angle jump response?
Next Steps
• Load tripping analysis, assessment of operational implications of DER tripping• DER_A model – refine parameters, incorporate new features• Operationalise the model• Load composition
• Motor D composition (motor drive small air conditioning)• Commercial load composition• Update of Residential Baseline Study• Large Industrial Loads
• Improve high resolution monitoring systems (more load data)• Dx parameters• Solar Analytics ARENA collaboration

DERWorkstream
Networkincentives
Datavisibility
System & Marketframework
Technical standards& connections
Operationalprocess
Industry-widecollaboration
Workstreamobjectives
Networkregulation &pricing facilitate DER andbetter customer serviceofferings.
Visibility of DER foroperational, forecasting,planning, and market(incl settlement) functions.
A consistent access regime for all market participants within the confines of customer consent and privacy.
Integrate DER into energy,ancillary and reserve markets.
Market arrangements recognise non-retailer models, including third-party/aggregator concepts.
Evolve market arrangement to a distributed market model.
Where appropriate,a nationally consistentapproach to DERconnections anddevelop DERtechnical standards.
To better understandoperational challenges and DER capabilities to inform operationalprocesses and tools.
Enablers Pilot programs
Cyber security
Digital & Technology Strategies
Integrating DER to maximise consumer value
Industry working together to deliver outcomes for consumers
33