Embed Size (px)
Citation preview
Article
Dermal Condensate Niche Fate Specification Occurs
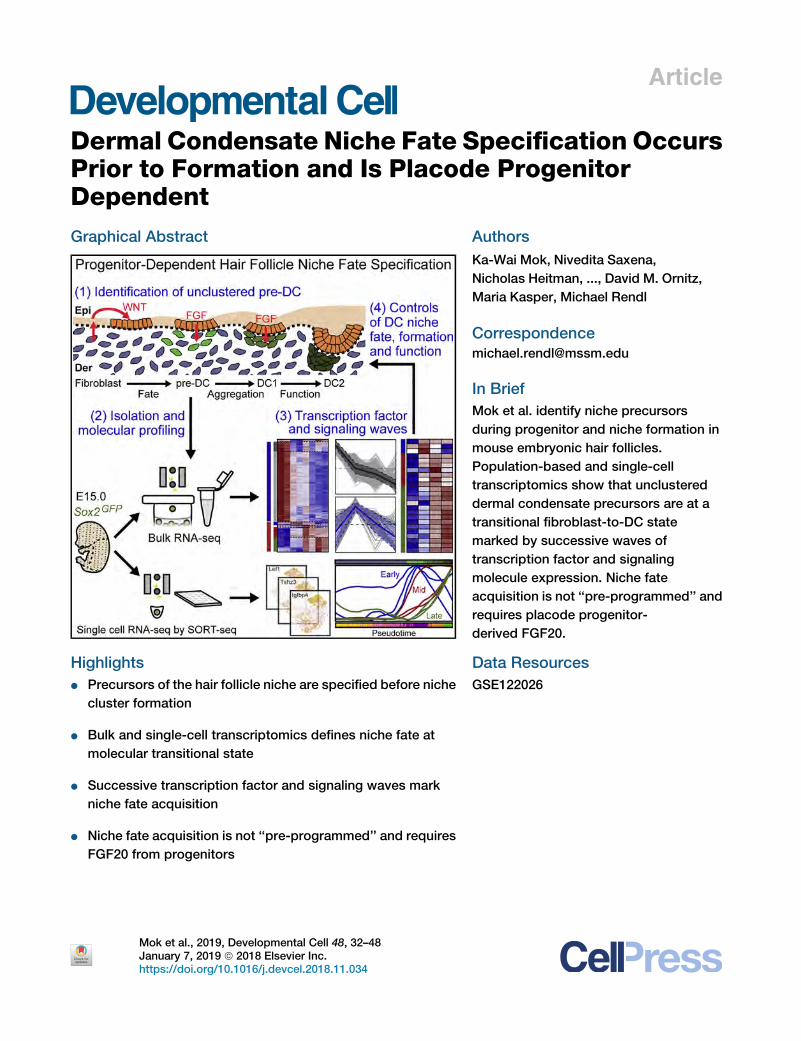
Prior to Formation and Is Placode ProgenitorDependentGraphical Abstract
Highlights
d Precursors of the hair follicle niche are specified before niche
cluster formation
d Bulk and single-cell transcriptomics defines niche fate at
molecular transitional state
d Successive transcription factor and signaling waves mark
niche fate acquisition
d Niche fate acquisition is not ‘‘pre-programmed’’ and requires
FGF20 from progenitors
Mok et al., 2019, Developmental Cell 48, 32–48January 7, 2019 ª 2018 Elsevier Inc.https://doi.org/10.1016/j.devcel.2018.11.034
Authors
Ka-Wai Mok, Nivedita Saxena,
Nicholas Heitman, ..., David M. Ornitz,
Maria Kasper, Michael Rendl
In Brief
Mok et al. identify niche precursors
during progenitor and niche formation in
mouse embryonic hair follicles.
Population-based and single-cell
transcriptomics show that unclustered
dermal condensate precursors are at a
transitional fibroblast-to-DC state
marked by successive waves of
transcription factor and signaling
molecule expression. Niche fate
acquisition is not ‘‘pre-programmed’’ and
requires placode progenitor-
derived FGF20.
Data Resources
GSE122026

Developmental Cell
Article
Dermal Condensate Niche FateSpecification Occurs Prior to Formationand Is Placode Progenitor DependentKa-Wai Mok,1,2,9 Nivedita Saxena,1,2,3,9 Nicholas Heitman,1,2,3,9 Laura Grisanti,1,2 Devika Srivastava,1,2 Mauro J. Muraro,4
Tina Jacob,5 Rachel Sennett,1,2 Zichen Wang,6 Yutao Su,7 Lu M. Yang,7 Avi Ma’ayan,6 David M. Ornitz,7 Maria Kasper,5
and Michael Rendl1,2,3,8,10,*1Black Family Stem Cell Institute, Icahn School of Medicine at Mount Sinai, Atran Building AB7-10C, Box 1020, New York, NY 10029, USA2Department of Cell, Developmental, and Regenerative Biology, Icahn School of Medicine at Mount Sinai, Atran Building AB7-10C, Box 1020,
New York, NY 10029, USA3Graduate School of Biomedical Sciences, Icahn School of Medicine at Mount Sinai, Atran Building AB7-10C, Box 1020, New York,
NY 10029, USA4Oncode Institute, Hubrecht Institute–KNAW (Royal Netherlands Academy of Arts and Sciences), and University Medical Center Utrecht,
Utrecht 3584 CT, the Netherlands5Department of Biosciences and Nutrition and Center for Innovative Medicine, Karolinska Institutet, Huddinge 141 83, Sweden6Department of Pharmacological Sciences, Mount Sinai Center for Bioinformatics, BD2K-LINCS Data Coordination and Integration Center,Knowledge Management Center for Illuminating the Druggable Genome (KMC-IDG), Icahn School of Medicine at Mount Sinai, New York,
NY 10029, USA7Department of Developmental Biology, Washington University School of Medicine, St. Louis, MO 63110, USA8Department of Dermatology, Icahn School of Medicine at Mount Sinai, Atran Building AB7-10C, Box 1020, New York, NY 10029, USA9These authors contributed equally10Lead Contact
*Correspondence: [email protected]://doi.org/10.1016/j.devcel.2018.11.034
SUMMARY
Cell fate transitions are essential for specification ofstem cells and their niches, but the precise timingand sequence of molecular events during embryonicdevelopment are largely unknown. Here, we identify,with 3D and 4D microscopy, unclustered precursorsof dermal condensates (DC), signaling niches forepithelial progenitors in hair placodes. With popula-tion-based and single-cell transcriptomics, we defineamolecular time-lapse frompre-DC fate specificationthrough DC niche formation and establish the devel-opmental trajectory as the DC lineage emerges fromfibroblasts. Co-expression of downregulated fibro-blast and upregulated DC genes in niche precursorsreveals a transitory molecular state following a prolif-eration shutdown. Waves of transcription factor andsignaling molecule expression then coincide withDC formation. Finally, ablation of epidermal Wntsignaling and placode-derived FGF20 demonstratestheir requirement for pre-DC specification. Thesefindings uncover a progenitor-dependent niche pre-cursor fate and the transitory molecular events con-trolling niche formation and function.
INTRODUCTION
Many adult tissues are maintained during homeostasis or re-
paired after injury by resident stem cells as a resource of reserve
32 Developmental Cell 48, 32–48, January 7, 2019 ª 2018 Elsevier In
cells with multilineage potential. Stem cell functions are
controlled both intrinsically and by a large variety of long-range
neuronal and hormonal inputs and short-range signals from the
microenvironment or niche (Ge and Fuchs, 2018; Heitman
et al., 2018; Rezza et al., 2014). In many cases, signals are
derived from specialized niche cells that control stem cell quies-
cence for long periods of time, regulate stem cell self-renewal, or
guide their differentiation into one or more lineages of the
respective tissue. Neighboring niche cell types and their signals
have been identified in several tissues such as bonemarrow (Wei
and Frenette, 2018), intestine (Shoshkes-Carmel et al., 2018),
brain (Falk and Gotz, 2017), lung (Lee et al., 2017), and skin
(Ge and Fuchs, 2018; Sennett and Rendl, 2012). But a detailed
understanding of the molecular controls of niche fate specifica-
tion during embryonic development remains limited. Equally un-
clear is the precise timing of niche cell emergence relative to
stem and progenitor cells and their mutual impact on each other.
In hair follicles, rapidly dividing progenitors in the proximal
bulb region receive signals from the centrally located dermal
papilla (DP) niche, which controls hair follicle progenitor prolifer-
ation, migration, and differentiation into several lineages of the
hair shaft and its channel during continuous hair growth (Clavel
et al., 2012; Sennett and Rendl, 2012). During the hair cycle after
bulb degeneration and rest, the DP niche sends activating sig-
nals to the stem cells in the hair germ to regenerate a new hair
bulb (Ge and Fuchs, 2018). Many studies have investigated the
developmental processes and morphogenetic events during
embryonic hair follicle formation, including the emergence of
stem cell and niche compartments (Sennett and Rendl, 2012).
Around embryonic day (E) 12.5, secreted epidermal Wnts
activate broad dermal Wnt/b-catenin signaling (Chen et al.,
2012). This is upstream of yet unidentified dermal signals that
c.

at�E13.5 induce the fate specification of hair follicle progenitors
in patterned pre-placodes (Zhang et al., 2009) (Figure 1A, hair
follicle stage 0 (Paus et al., 1999)), which can be molecularly
identified by Dkk4 and Edar expression (Sennett and Rendl,
2012). Progenitor cell migration then forms the physically identifi-
able placode (Pc) (Figure 1A, stage 1) (Ahtiainen et al., 2014).
Following this, Pc progenitors signal back to the dermis for for-
mation of dermal condensates (DC) (Figure 1A, stage 1, DC1),
specialized cell clusters derived from fibroblasts (Fb), which
act as signaling niches for Pc progenitors to regulate continued
hair follicle development (Sennett and Rendl, 2012; Sennett
et al., 2015). Pc progenitors also give rise to suprabasal Sox9+
precursors of the future adult hair follicle stem cells in the bulge
after completion of hair follicle morphogenesis (Ouspenskaia
et al., 2016). Continued signal exchange between the DC and
Pc leads to progenitor proliferation and downgrowth of the polar-
ized hair germ (Figure 1A, stage 2, DC2), with the DC at the lead-
ing edge that, after an elongated hair peg stage, becomes en-
gulfed by the progenitors to form the DP niche of the hair-
shaft-producing bulb (Grisanti et al., 2013; Sennett and Rendl,
2012). Several key signaling pathways have been identified for
progenitor and niche formation (Sennett and Rendl, 2012).
Wnt/b-catenin signaling is essential and most upstream for Pc
(DasGupta and Fuchs, 1999; Huelsken et al., 2001) and conden-
sate (Tsai et al., 2014) formation. Eda signaling is then required
for maintaining Wnt signaling and Pc stabilization (Zhang et al.,
2009). FGF20, another Wnt target, is a key Pc-derived signal
required for DC niche formation (Huh et al., 2013) in a process
involving cell aggregation (Biggs et al., 2018).
Themorphological detection of the DC after Pc initiation (Chen
et al., 2012), combined with discovery of DC markers (Chen
et al., 2012; Sennett and Rendl, 2012; Huh et al., 2013) and the
definition of a DC gene expression signature (Sennett et al.,
2015), has led to the current model of niche fate specification
in response to progenitor signal(s) that coincides with conden-
sate formation. However, the identification of unclustered dermal
cells with localized high Wnt activity beneath Pcs (Zhang et al.,
2009) and low-level expression of DC genes in immunopheno-
typically non-DC dermal cells (Sennett et al., 2015) raise the
possibility of DC fate acquisition prior to cluster formation.
Contextualizing these early events in hair follicle formation is
further complicated by the rapidity with which morphogenesis
occurs; Wnt signaling activity appears virtually simultaneously
in Pc and DC (DasGupta and Fuchs, 1999; Tsai et al., 2014;
Zhang et al., 2009), rendering the parsing of the precise order
and timing difficult. Recent work also demonstrated direct
mesenchymal self-organization ability in the absence of an
epidermal pre-pattern (Glover et al., 2017), further calling into
question the origin and timing of niche fate specification (Fig-
ure 1A): (1) is the niche fate specified before niche cluster forma-
tion and signaling function, and (2) how is the timing of niche fate
acquisition related to progenitor fate and signaling?
Here, by combining 3D and 4D time-lapse live imaging with
fluorescence-activated cell sorting (FACS), bulk and single-cell
transcriptomics, proliferation kinetics, and mutant mouse
models, we identify fated unclustered precursors of the DC niche
prior to signaling center formation. Based on a molecular time-
lapse of dynamically changing niche gene signatures and
ordering the cell fates in developmental pseudotime, we define
the cell fate trajectory from Fb through DC niche precursors
that are fated to become the clustered niche. In this process,
DC precursors (pre-DC) undergo a transitional molecular state
that is consolidated toward the DC niche biological fate through
waves of transcription factor and signaling molecule upregula-
tion. Finally, with epidermal Wnt signaling ablation, which pre-
vents Pc formation, and with deletion of Pc-derived FGF20,
which precludes DC aggregation, we demonstrate that early
niche fate and emergence of unclustered DC precursors de-
pends on pre-existing Pc progenitors and their signals.
RESULTS
Identification of Unclustered Precursors of DermalCondensatesPrevious studies have demonstrated that cell aggregation is the
cellular mechanism inciting DC formation (Biggs et al., 2018;
Glover et al., 2017), but when the DC niche fate is acquired
and how this timing relates to placode progenitor specification
remains unknown. To identify potential DC-fated precursors
before cluster formation and niche establishment, we followed
up on our previous work where we isolated, with FACS, the DC
as GFP+ cells from embryonic Sox2GFP knockin reporter skin
(Figure S1A) (Sennett et al., 2015). Both Sox2 promoter-driven
GFP (Figures 1B and S1A) and Sox2 mRNA (Figure S1B) are
highly expressed in the established DC (Driskell et al., 2009;
Clavel et al., 2012), where condensed cells are visible under-
neath flat and barely invaginated EDAR+ hair placodes of stage
1 hair follicles (Figure 1B, open arrow) (Paus et al., 1999; Sennett
et al., 2015). GFP levels remain high after initial Pc downgrowth
and polarization of stage 2 hair follicle germs (Figure 1B, arrow).
We named these two DC stages with high Sox2 expression DC1
and DC2 accordingly. We also observed by flow cytometry a
low-level GFP population that was a mix of Schwann and DC-
like cells (Figures S1A–S1C) (Sennett et al., 2015), but the diffi-
culty of detecting low Sox2GFP levels in sagittal skin sections
and absence of know-how to separately sort DC-like cells pre-
cluded further resolving this population (Figure 1B).
We surmised that low Sox2GFP-expressing DC-like cells could
represent a precursor state that ramps up Sox2 expression to-
ward a DC fate. To detect GFP-low cells with high sensitivity,
we performed multicolor immunofluorescence in whole-mount
skin of E15.0 Sox2GFP embryos. In the top view, the anti-GFP
signal was strong in DC1 (Figure 1C, open arrow) and DC2 (Fig-
ure 1C, arrow). Also, low GFP levels were now detectable in
Schwann cells (Figure 1C, asterisks), highlighted by ITGA6,
forming a GFP-low/ITGA6+ network within the developing skin
(Figure 1C, asterisks). Importantly, we also found a few loosely
arranged GFP-low/ITGA6� non-Schwann cells in the dermis in
a location fitting a hair follicle pattern (Figure 1C, arrowhead).
Co-labeling with previously identified DC marker FOXD1 (Fig-
ure S1C) (Sennett et al., 2015) labeled DC1, DC2, and these
GFP-low cells, suggesting that they might be DC precursors
(pre-DC) before DC niche formation. High magnification images
suggested that potential pre-DC cells are still unclustered, unlike
the clearly visible cell aggregations of DC1 in stage 1 hair follicles
(Figure 1D).
To demonstrate that potential pre-DC cells are associated
with hair follicles, we next performed whole-mount
Developmental Cell 48, 32–48, January 7, 2019 33
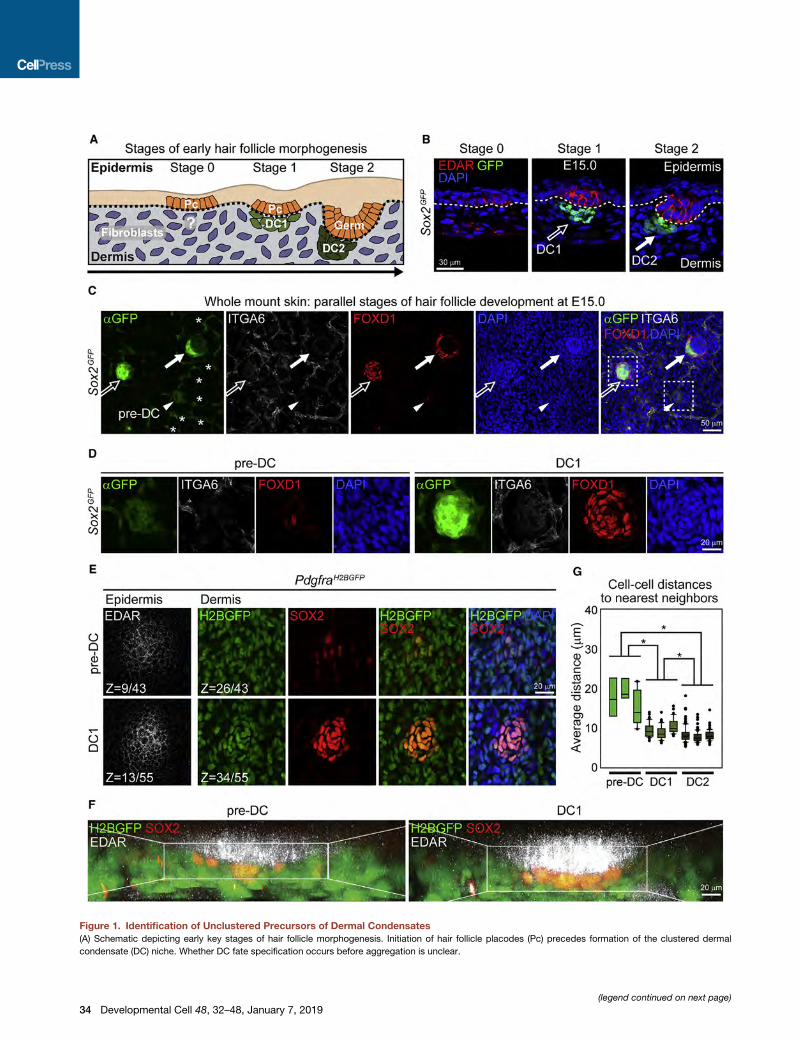
Figure 1. Identification of Unclustered Precursors of Dermal Condensates
(A) Schematic depicting early key stages of hair follicle morphogenesis. Initiation of hair follicle placodes (Pc) precedes formation of the clustered dermal
condensate (DC) niche. Whether DC fate specification occurs before aggregation is unclear.
(legend continued on next page)
34 Developmental Cell 48, 32–48, January 7, 2019
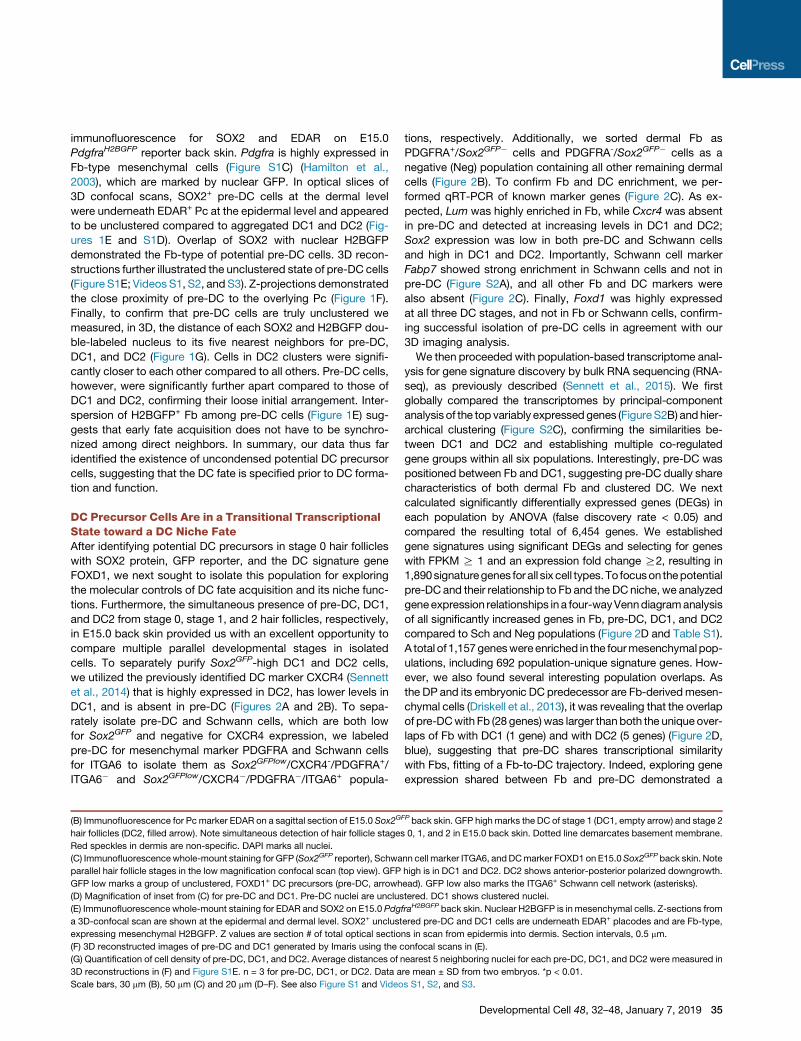
immunofluorescence for SOX2 and EDAR on E15.0
PdgfraH2BGFP reporter back skin. Pdgfra is highly expressed in
Fb-type mesenchymal cells (Figure S1C) (Hamilton et al.,
2003), which are marked by nuclear GFP. In optical slices of
3D confocal scans, SOX2+ pre-DC cells at the dermal level
were underneath EDAR+ Pc at the epidermal level and appeared
to be unclustered compared to aggregated DC1 and DC2 (Fig-
ures 1E and S1D). Overlap of SOX2 with nuclear H2BGFP
demonstrated the Fb-type of potential pre-DC cells. 3D recon-
structions further illustrated the unclustered state of pre-DC cells
(Figure S1E; Videos S1, S2, and S3). Z-projections demonstrated
the close proximity of pre-DC to the overlying Pc (Figure 1F).
Finally, to confirm that pre-DC cells are truly unclustered we
measured, in 3D, the distance of each SOX2 and H2BGFP dou-
ble-labeled nucleus to its five nearest neighbors for pre-DC,
DC1, and DC2 (Figure 1G). Cells in DC2 clusters were signifi-
cantly closer to each other compared to all others. Pre-DC cells,
however, were significantly further apart compared to those of
DC1 and DC2, confirming their loose initial arrangement. Inter-
spersion of H2BGFP+ Fb among pre-DC cells (Figure 1E) sug-
gests that early fate acquisition does not have to be synchro-
nized among direct neighbors. In summary, our data thus far
identified the existence of uncondensed potential DC precursor
cells, suggesting that the DC fate is specified prior to DC forma-
tion and function.
DC Precursor Cells Are in a Transitional TranscriptionalState toward a DC Niche FateAfter identifying potential DC precursors in stage 0 hair follicles
with SOX2 protein, GFP reporter, and the DC signature gene
FOXD1, we next sought to isolate this population for exploring
the molecular controls of DC fate acquisition and its niche func-
tions. Furthermore, the simultaneous presence of pre-DC, DC1,
and DC2 from stage 0, stage 1, and 2 hair follicles, respectively,
in E15.0 back skin provided us with an excellent opportunity to
compare multiple parallel developmental stages in isolated
cells. To separately purify Sox2GFP-high DC1 and DC2 cells,
we utilized the previously identified DC marker CXCR4 (Sennett
et al., 2014) that is highly expressed in DC2, has lower levels in
DC1, and is absent in pre-DC (Figures 2A and 2B). To sepa-
rately isolate pre-DC and Schwann cells, which are both low
for Sox2GFP and negative for CXCR4 expression, we labeled
pre-DC for mesenchymal marker PDGFRA and Schwann cells
for ITGA6 to isolate them as Sox2GFPlow/CXCR4-/PDGFRA+/
ITGA6� and Sox2GFPlow/CXCR4�/PDGFRA�/ITGA6+ popula-
(B) Immunofluorescence for Pcmarker EDAR on a sagittal section of E15.0 Sox2G
hair follicles (DC2, filled arrow). Note simultaneous detection of hair follicle stages
Red speckles in dermis are non-specific. DAPI marks all nuclei.
(C) Immunofluorescencewhole-mount staining for GFP (Sox2GFP reporter), Schwa
parallel hair follicle stages in the low magnification confocal scan (top view). GFP
GFP low marks a group of unclustered, FOXD1+ DC precursors (pre-DC, arrowh
(D) Magnification of inset from (C) for pre-DC and DC1. Pre-DC nuclei are unclus
(E) Immunofluorescence whole-mount staining for EDAR and SOX2 on E15.0 Pdg
a 3D-confocal scan are shown at the epidermal and dermal level. SOX2+ unclust
expressing mesenchymal H2BGFP. Z values are section # of total optical sectio
(F) 3D reconstructed images of pre-DC and DC1 generated by Imaris using the c
(G) Quantification of cell density of pre-DC, DC1, and DC2. Average distances of n
3D reconstructions in (F) and Figure S1E. n = 3 for pre-DC, DC1, or DC2. Data a
Scale bars, 30 mm (B), 50 mm (C) and 20 mm (D–F). See also Figure S1 and Video
tions, respectively. Additionally, we sorted dermal Fb as
PDGFRA+/Sox2GFP� cells and PDGFRA-/Sox2GFP� cells as a
negative (Neg) population containing all other remaining dermal
cells (Figure 2B). To confirm Fb and DC enrichment, we per-
formed qRT-PCR of known marker genes (Figure 2C). As ex-
pected, Lum was highly enriched in Fb, while Cxcr4 was absent
in pre-DC and detected at increasing levels in DC1 and DC2;
Sox2 expression was low in both pre-DC and Schwann cells
and high in DC1 and DC2. Importantly, Schwann cell marker
Fabp7 showed strong enrichment in Schwann cells and not in
pre-DC (Figure S2A), and all other Fb and DC markers were
also absent (Figure 2C). Finally, Foxd1 was highly expressed
at all three DC stages, and not in Fb or Schwann cells, confirm-
ing successful isolation of pre-DC cells in agreement with our
3D imaging analysis.
We then proceeded with population-based transcriptome anal-
ysis for gene signature discovery by bulk RNA sequencing (RNA-
seq), as previously described (Sennett et al., 2015). We first
globally compared the transcriptomes by principal-component
analysis of the top variably expressedgenes (FigureS2B) andhier-
archical clustering (Figure S2C), confirming the similarities be-
tween DC1 and DC2 and establishing multiple co-regulated
gene groups within all six populations. Interestingly, pre-DC was
positioned between Fb and DC1, suggesting pre-DC dually share
characteristics of both dermal Fb and clustered DC. We next
calculated significantly differentially expressed genes (DEGs) in
each population by ANOVA (false discovery rate < 0.05) and
compared the resulting total of 6,454 genes. We established
gene signatures using significant DEGs and selecting for genes
with FPKM R 1 and an expression fold change R2, resulting in
1,890signaturegenes forall six cell types.To focuson thepotential
pre-DCand their relationship to Fb and the DCniche, we analyzed
geneexpression relationships ina four-wayVenndiagramanalysis
of all significantly increased genes in Fb, pre-DC, DC1, and DC2
compared to Sch and Neg populations (Figure 2D and Table S1).
A total of 1,157geneswereenriched in the fourmesenchymalpop-
ulations, including 692 population-unique signature genes. How-
ever, we also found several interesting population overlaps. As
the DP and its embryonic DC predecessor are Fb-derivedmesen-
chymal cells (Driskell et al., 2013), it was revealing that the overlap
of pre-DCwith Fb (28 genes) was larger thanboth the unique over-
laps of Fb with DC1 (1 gene) and with DC2 (5 genes) (Figure 2D,
blue), suggesting that pre-DC shares transcriptional similarity
with Fbs, fitting of a Fb-to-DC trajectory. Indeed, exploring gene
expression shared between Fb and pre-DC demonstrated a
FP back skin. GFP highmarks the DC of stage 1 (DC1, empty arrow) and stage 2
0, 1, and 2 in E15.0 back skin. Dotted line demarcates basement membrane.
nn cell marker ITGA6, andDCmarker FOXD1 on E15.0Sox2GFPback skin. Note
high is in DC1 and DC2. DC2 shows anterior-posterior polarized downgrowth.
ead). GFP low also marks the ITGA6+ Schwann cell network (asterisks).
tered. DC1 shows clustered nuclei.
fraH2BGFP back skin. Nuclear H2BGFP is in mesenchymal cells. Z-sections from
ered pre-DC and DC1 cells are underneath EDAR+ placodes and are Fb-type,
ns in scan from epidermis into dermis. Section intervals, 0.5 mm.
onfocal scans in (E).
earest 5 neighboring nuclei for each pre-DC, DC1, and DC2 were measured in
re mean ± SD from two embryos. *p < 0.01.
s S1, S2, and S3.
Developmental Cell 48, 32–48, January 7, 2019 35

Figure 2. DC Precursor Cells Are in a Transitional Transcriptional State toward a DC Niche Fate
(A) Immunofluorescence for DC marker CXCR4 and Pc marker EDAR in E15.0 back skin. CXCR4 is expressed at higher levels in DC2 (filled arrow) compared to
DC1 (open arrow). Dotted line marks basement membrane. DAPI marks all nuclei.
(legend continued on next page)
36 Developmental Cell 48, 32–48, January 7, 2019

transitionofhigh-to-lowexpressionofFbgenes fromFb toDCwith
intermediate levels in pre-DC (Figure 2E). Several genes included
extracellular matrix components such as Ccbe1 and Eln (Fig-
ure 2F). Conversely, differential expression analysis confirmed a
high overlap of 119 genes between pre-DC, DC1, and DC2 (Fig-
ure 2D, red), which included 58 previously describedDC signature
genes (Sennett etal., 2015). Furthermore,pre-DCexpressedmany
of thesesharedDCsignaturegenesat intermediate levelsbetween
Fb, and DC1 and DC2, suggestive of its developmental precursor
status to morphologically identifiable DC (Figures 2E and 2G).
We next complemented population-based bulk RNA-seq with
single-cell transcriptome analyses to allow for exploration of
minute cell-to-cell transcriptional changes that define cell het-
erogeneity and differentiation (Gr€un et al., 2016). Importantly, it
also enables a high-resolution definition of lineage relationships
along a developmental trajectory (Herman et al., 2018). To
corroborate the developmental link of pre-DC between Fb and
DC1/DC2, we used SORT-seq (Muraro et al., 2016) to index-
sort DC cells with our established strategy and obtain single-
cell transcriptomes that are linked to the isolated cell identities
(Figure 2H). We sequenced 1,371 Fb, 149 pre-DC, 152 DC1,
and 151 DC2. Of those, we used 1,076 Fb, 107 pre-DC, 118
DC1, and 82 DC2 for analysis based on a minimum requirement
of 6,000 transcripts/cell and established quality controls to
exclude poorly sequenced cells. Based on population fre-
quencies observed by flow cytometry, it would require
�15,000 total unenriched cells to obtain similar transcriptome in-
formation of our sorted pre-DC cells (1503 enrichment). We then
applied the Rare Cell Type Identification 3 (RaceID3) clustering
algorithm that was previously used to identify rare intestinal
cell types and lineage relationships between stem cells and
differentiated cells (Gr€un et al., 2016; Herman et al., 2018).
RaceID3 clustered gene expression similarities were then visual-
ized using t-distributed stochastic neighbor embedding (tSNE).
Superimposing the Fb and DC cell identities onto the tSNE plot
revealed clear distinctions between all isolated populations, con-
firming our cell isolation strategy (Figure 2I). At the same time, it
highlighted similarities between all DC stages and placed pre-
DC between Fbs and DC1/DC2, suggesting a lineage trajectory
from Fb to DC through an intermediate pre-DC fate transition. As
expected, all sorted DC populations expressed established DC
signature genes, including Fgf10, Sox2, Foxd1, and Tbx18 (Gri-
santi et al., 2013; Sennett et al., 2015) (Figure 2J), and sorted
(B) FACS isolation of pre-DC, DC1, DC2, Fb, Schwann cells (Sch), and a popula
(C) qRT-PCR verification of marker genes in isolated Fb, pre-DC, DC1, DC2, and
(D) Venn diagram of gene signatures in Fb, pre-DC, and twoDC stages. All genes a
genes in corresponding populations compared to all others. Blue outlines increas
overlap of pre-DC with mature DC stages.
(E) Transitional transcriptional state of pre-DC. Left: Z-score normalized expres
progressive downregulation of Fb genes. Right: Z score normalized expression of
shows increased DC gene expression (Sennett et al., 2015). Pre-DC has interme
(F and G) FPKM barplots of representative Fb (down) (F) and DC (up) (G) transitio
(H) Experimental strategy for combined single-cell sorting and single-cell transcrip
in (A). Each index-sorted cell is connected to its transcriptome through the plate
(I) tSNE map of all sorted cells color-coded by cell type.
(J) Expression of representative DC signature genes projected onto the tSNE ma
(K) Expression of representative Fb signature genes projected onto the tSNE ma
(L) Expression of representative transitional Fb and DC genes from the Fb and pre
Scale bar, 50 mm (A). See also Figure S2 and Table S1.
Fb expressed established markers Col1a1, Lrig1, Dcn, and
Lum (Driskell et al., 2013) (Figure 2K). In addition, expression
patterns revealed gradual downregulation of Fb genes and
upregulation of DC genes (Figure 2L). Altogether, these bulk
and single-cell transcriptome data from purified embryonic
skin cells indicate that unclustered pre-DC precursors are at a
transcriptionally transitional state from Fb toward a permanent
DC niche fate.
DC Precursors Are Developmental Intermediatesbetween Fibroblasts and the Mature DC NicheAs the identified pre-DC cells express genes characteristics of
both Fbs and DC, we hypothesized that they are precursors of
the mature DC niche at an intermediate developmental state
between Fb and DC. To explore this lineage trajectory, we uti-
lized RaceID3 to identify distinct cell clusters with similar tran-
scriptome as a basis for calculating lineage relationships
between related cell types (Figure 3A). Clusters 6, 7, and 8
were primarily comprised of sorted pre-DC, DC1, and DC2
cells, respectively (Figures 2H, 3A, and S3A), again validating
our sorting strategy. We then applied the Stem Cell Identifica-
tion (StemID2) algorithm (Gr€un et al., 2016) to order RaceID3-
identified clusters based on degree of transcriptional similarity
(Figure 3B), inferring differentiation trajectories from single-cell
RNA-seq data (Gr€un et al., 2016). Among DC clusters (clusters
6, 7, 8), the pre-DC-enriched cluster 6 was closest to the Fb
clusters. Among sorted Fb, cluster 5 was the sole calculated
link to pre-DC cluster 6, suggesting that pre-DC cells emerge
from closely related Fb (Figure 3B). It also demonstrated that
pre-DC are the link for transition into DC1/DC2. To indepen-
dently confirm the developmental trajectory, we utilized the
Scanpy toolkit for UMAP (Uniform Manifold Approximation
and Projection), Louvain clustering, and diffusion maps (Wolf
et al., 2018). Louvain clustering with the same 1,383 cells
used for RaceID3 clustering, showed again clear distinctions
between all sorted populations, placing pre-DC between Fb
and DC1 (Figures 3C and S3B). Importantly, applying diffusion
pseudotime, a method for ordering cells along lineage trajec-
tories (Haghverdi et al., 2016), clearly demonstrated the lineage
path from nearest Fb (Louvain cluster 5) through pre-DC toward
DC1 and DC2 (Figures 3D and S3C).
Having established, by single-cell RNA-seq analyses, the dif-
ferentiation trajectory from Fb to DC2, we next re-examined
tion of negative cells (Neg) from live EpCAM- cells.
Schwann cells. Data are mean ± SD from 2 biological replicates.
re enriched compared to Sch andNeg. Overlaps represent commonly enriched
ed overlap between Fb/pre-DC, compared to Fb/DC1 or Fb/DC2. Red outlines
sion of Fb/pre-DC overlap genes (blue) in Fb, pre-DC, DC1, and DC2 reveal
overlap of pre-DC, DC1, and DC2 (red), and 58 established DC signature genes
diate levels for both Fb and DC genes.
nal genes. Data are mean ± SD from two biological replicates.
tome analysis by SORT-seq. Fb, pre-DC, DC1, and DC2were FACS-purified as
position.
p from (I). Transcript counts are in linear scale.
p from (I).
-DC and pre-DC, DC1, and DC2 overlaps projected onto the tSNEmap from (I).
Developmental Cell 48, 32–48, January 7, 2019 37

Figure 3. DC Precursors Are Developmental Intermediates between Fibroblasts and the Mature DC Niche
(A) tSNE map from Figure 2I color-coded according to RaceID3 k-medoids clustering.
(B) StemID2 lineage tree of RaceID3 k-medoids clustering output. Color of the line connecting clusters indicates p value of link.
(legend continued on next page)
38 Developmental Cell 48, 32–48, January 7, 2019
our bulk RNA-seq for gene expression trends. For this, we per-
formed hierarchical clustering noting four major trends: genes
with highest expression in Fb (down A and down B), and genes
with highest expression in pre-DC (up C), DC1 (up D), and DC2
(up E) (Figure 3E and Table S2). 2,687 genes were downregu-
lated from Fbs through DC2 (Figure 3F). Closer examination of
these genes revealed major downregulation of Fb transcription
factors, adhesion and ECM molecules, and signaling factors
(Figures 3G and 3H), suggesting their involvement in rapid and
sustained loss of Fb function as the DC fate is acquired and
throughout DC differentiation.
Finally, we utilized our single-cell transcriptome data to define
the pseudotemporal ordering of Fb andDCpopulations along the
differentiation trajectory and explore patterns of gene regulation
during niche fate acquisition. For this, we devised a self-orga-
nizing map using the Fb clusters closest to DC and the DC-en-
riched clusters (Figure 3I).We excludedDlk1-expressing Fb clus-
ters 1–3 that likely represented lower dermal Fb unrelated to DC
(FigureS3D) (Driskell et al., 2013) and includedFbclusters 4 and5
as both were closest to pre-DC-enriched cluster 6 (Figure S3E).
Pseudotime gene expression analysis revealed refined trends
of genes with highest expression in Fb (down clusters 1 and 2),
pre-DC (upclusters 3and4),DC1 (upcluster 6), andDC2 (upclus-
ters 5 and 7) (Figure 3I and Table S3). Among 2,687 genes down-
regulated from Fb through DC2 in population-based RNA-seq
(Figure 3F) and the 1,342 genes identified in single-cell transcrip-
tomes (Figure 3J), 951 geneswere in common (35%of bulk-iden-
tified targets and 70% of single-cell-identified targets) (Fig-
ure S3F). Also here, these included several transcription factors
(Lambert et al., 2018), adhesion and ECM components, and
signaling molecules (Ramilowski et al., 2015) necessary for Fb
function (Figure 3K). Creb3l1 is a secreted factor essential for
collagen metabolism (Keller et al., 2018), while Irx1 and Twist1
are transcription factors that control expression of matrix-stiff-
ening components (Garcıa-Palmero et al., 2016), and Zeb1 is
known for promoting expression of vimentin (Liu et al., 2008).
Additionally, expression of numerous collagens such as
Col1a1, Col1a2, and Col3a1 and other ECM components such
asDcn,Bgn, andP4hbwere decreasedbetween FbandDCpop-
ulations. Finally, we identified signaling molecules that are
uniquely expressed in Fb, such as Efna5, Cntn4, Fbln1, and
Wnt4, and that are all downregulated on the path to DC lineage
differentiation. Altogether thesedata demonstrate that Fbquickly
halt transcription of Fb-associated genes as they transition
through the pre-DC intermediate into the definitive DC niche fate.
(C) UMAP plot of Fb, pre-DC, DC1, and DC2 using Scanpy. Sorted cell identities
(D) Diffusion map highlighting the developmental trajectory from Fb through pre-
(E) Trend analysis by Spearman rank clustering of differentially expressed genes
(F) Expression trajectories of downregulated genes from Fb to pre-DC. Solid bla
(G) Heatmaps of relative expression of downregulated transcription factors, adhes
trajectory.
(H) Absolute FPKM expression levels of representative genes from each categor
(I) Self-organizing map of co-regulated gene clusters across the plotted pseudo
scriptomes. Bottom bar represents ordered cells color-coded by RaceID3 cluste
(J) Cumulative expression plots of downregulated genes along pseudotime. Each
from (I). The black line is the running average across pseudotime.
(K) Expression of representative transcription factors, adhesion and ECM molecu
map from Figure 2I.
See also Figure S3 and Tables S2 and S3.
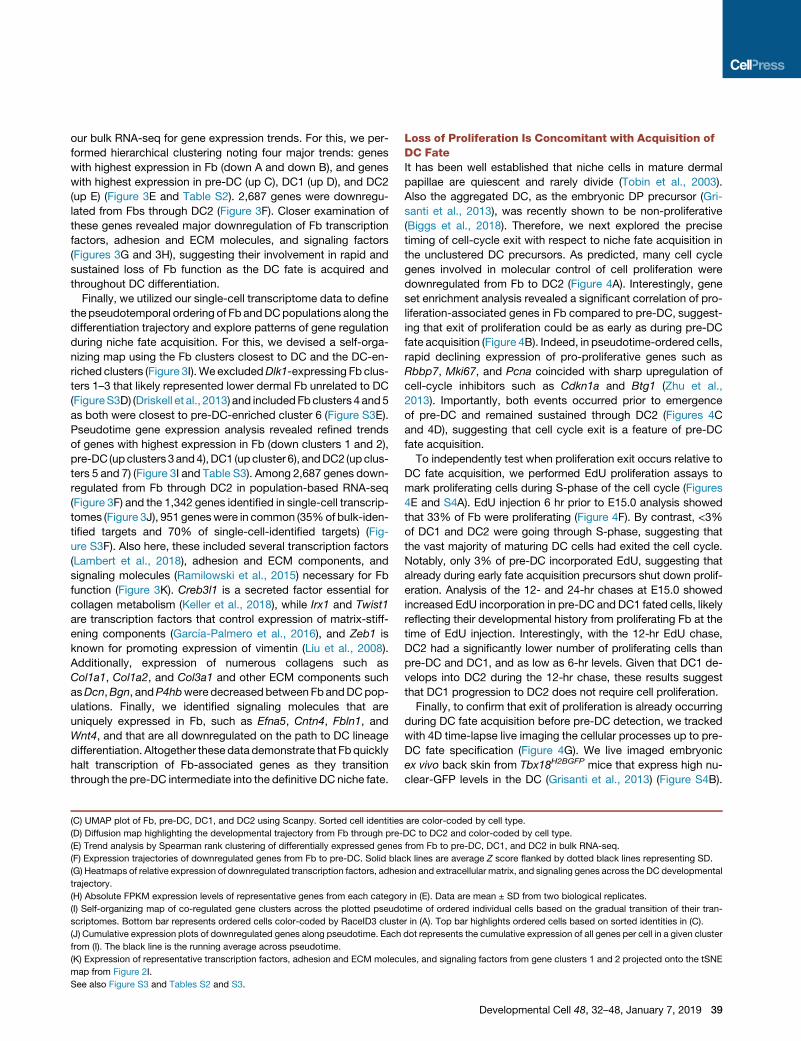
Loss of Proliferation Is Concomitant with Acquisition ofDC FateIt has been well established that niche cells in mature dermal
papillae are quiescent and rarely divide (Tobin et al., 2003).
Also the aggregated DC, as the embryonic DP precursor (Gri-
santi et al., 2013), was recently shown to be non-proliferative
(Biggs et al., 2018). Therefore, we next explored the precise
timing of cell-cycle exit with respect to niche fate acquisition in
the unclustered DC precursors. As predicted, many cell cycle
genes involved in molecular control of cell proliferation were
downregulated from Fb to DC2 (Figure 4A). Interestingly, gene
set enrichment analysis revealed a significant correlation of pro-
liferation-associated genes in Fb compared to pre-DC, suggest-
ing that exit of proliferation could be as early as during pre-DC
fate acquisition (Figure 4B). Indeed, in pseudotime-ordered cells,
rapid declining expression of pro-proliferative genes such as
Rbbp7, Mki67, and Pcna coincided with sharp upregulation of
cell-cycle inhibitors such as Cdkn1a and Btg1 (Zhu et al.,
2013). Importantly, both events occurred prior to emergence
of pre-DC and remained sustained through DC2 (Figures 4C
and 4D), suggesting that cell cycle exit is a feature of pre-DC
fate acquisition.
To independently test when proliferation exit occurs relative to
DC fate acquisition, we performed EdU proliferation assays to
mark proliferating cells during S-phase of the cell cycle (Figures
4E and S4A). EdU injection 6 hr prior to E15.0 analysis showed
that 33% of Fb were proliferating (Figure 4F). By contrast, <3%
of DC1 and DC2 were going through S-phase, suggesting that
the vast majority of maturing DC cells had exited the cell cycle.
Notably, only 3% of pre-DC incorporated EdU, suggesting that
already during early fate acquisition precursors shut down prolif-
eration. Analysis of the 12- and 24-hr chases at E15.0 showed
increased EdU incorporation in pre-DC and DC1 fated cells, likely
reflecting their developmental history from proliferating Fb at the
time of EdU injection. Interestingly, with the 12-hr EdU chase,
DC2 had a significantly lower number of proliferating cells than
pre-DC and DC1, and as low as 6-hr levels. Given that DC1 de-
velops into DC2 during the 12-hr chase, these results suggest
that DC1 progression to DC2 does not require cell proliferation.
Finally, to confirm that exit of proliferation is already occurring
during DC fate acquisition before pre-DC detection, we tracked
with 4D time-lapse live imaging the cellular processes up to pre-
DC fate specification (Figure 4G). We live imaged embryonic
ex vivo back skin from Tbx18H2BGFP mice that express high nu-
clear-GFP levels in the DC (Grisanti et al., 2013) (Figure S4B).
are color-coded by cell type.
DC to DC2 and color-coded by cell type.
from Fb to pre-DC, DC1, and DC2 in bulk RNA-seq.
ck lines are average Z score flanked by dotted black lines representing SD.
ion and extracellular matrix, and signaling genes across the DC developmental
y in (E). Data are mean ± SD from two biological replicates.
time of ordered individual cells based on the gradual transition of their tran-
r in (A). Top bar highlights ordered cells based on sorted identities in (C).
dot represents the cumulative expression of all genes per cell in a given cluster
les, and signaling factors from gene clusters 1 and 2 projected onto the tSNE
Developmental Cell 48, 32–48, January 7, 2019 39
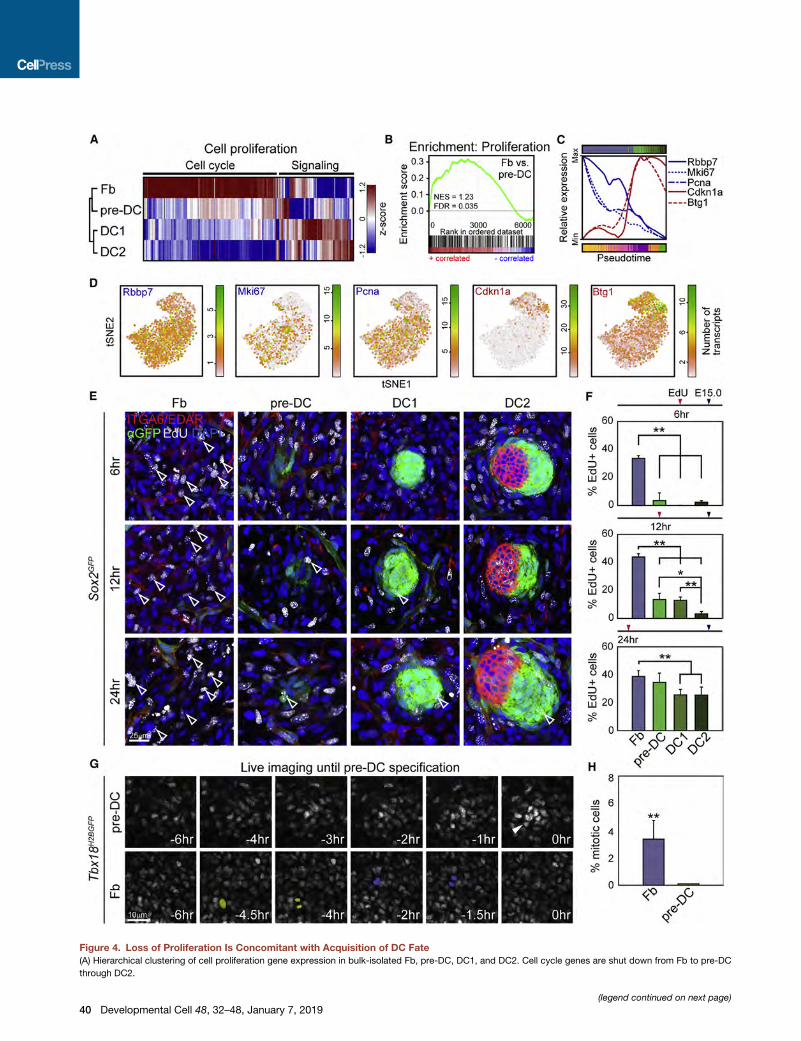
Figure 4. Loss of Proliferation Is Concomitant with Acquisition of DC Fate
(A) Hierarchical clustering of cell proliferation gene expression in bulk-isolated Fb, pre-DC, DC1, and DC2. Cell cycle genes are shut down from Fb to pre-DC
through DC2.
(legend continued on next page)
40 Developmental Cell 48, 32–48, January 7, 2019

Importantly, pre-DC cells also already expressed high nuclear-
GFP, while Fb exhibited lowGFP levels (Figure 4G). Live-tracking
cell divisions during a 6-hr period prior to pre-DC fate acquisition
detected actively proliferating interfollicular Fb (Figures 4G and
4H). By contrast, no cells giving rise to pre-DC cells were dividing
during the same time span, indicating that proliferation exit is
occurring during DC fate acquisition in the Fb-to-pre-DC
transition.
Three Distinct Waves of Transcription Factor andSignaling Molecule Upregulation Occur along the DCNiche Developmental TrajectoryBesides proliferation shutdown and gradual loss of Fb gene
expression signature, gradual upregulation of the DC niche
signature occurs during DC fate acquisition (Figures 2E, 2G, 2L,
3E, and 3I). We next explored the precise timing of molecular
fate acquisition and consolidation from Fb to pre-DC, through
DC1 and DC2. We discovered three distinct waves of gene upre-
gulation for pre-DC fate acquisition, DC1 clustering, and hair
germdowngrowth stages atDC2, in bothbulk (Figure 5A) and sin-
gle-cell (Figure 5C and Table S3) transcriptional analyses. The
first wave included gene clusters whose expression peaked early
in a transientmanner at pre-DCand thendropped,which likely in-
cludes factors necessary for fate acquisition andother early func-
tions. Two additional waves of co-regulated gene clusters had
sustained expression through DC2 but differed only in when their
expression peaked: mid genes were enriched in genes achieving
maximal expression at DC1, and late genes reached maximal
expression in DC2, at the end of the pseudotime. Of the three up-
regulated clusters, the mid cluster contained the most heteroge-
neity in expression dynamics, and included genes with gradually
ramped-up expression beginning in pre-DC that is sustained
throughout and genes with more delayed upregulation patterns.
All three waves contained many transcription factors that
could represent potential master regulators for DC specification
and development (Figures 5B–5G; Table S4). Transcription fac-
tors expressed in the early wave included known key fate regu-
lators such as Twist2 (Dermo1) (Li et al., 1995), the Wnt signaling
transcription factor Lef1, and the TGF-b effector Smad3 (Figures
5B, 5D, 5F, and S5A). Twist2 knockout animals have sparse hair,
among many other abnormalities (�So�si�c et al., 2003). Similarly,
Lef1 knockout results in abrogation of whiskers and back skin
hair follicles (van Genderen et al., 1994). We confirmed Twist2
mRNA expression in pre-DC by in-situ hybridization, which is
later shut down at the DC1 stage (Figure 5D). Many more tran-
(B) Gene set enrichment analysis for cell proliferation genes shows positive corre
(C) Normalized running means of expressed transcript numbers in pseudotime or
(Cdkn1a and Btg1) genes.
(D) Expression of pro-proliferative and anti-proliferative genes projected onto the
(E) EdU pulse-chase assay for proliferation rates in Fb, pre-DC, DC1, and DC2. EdU
skin by immunofluorescence for GFP, ITGA6, and EDAR. Representative z-sectio
DC2. Examples of EdU+ proliferating cells are highlighted by empty arrowheads.
(F) Quantification of EdU+ Fb, pre-DC, DC1, and DC2. Note drastic drop of prolife
n = 3 interfollicular Fb areas, pre-DC, DC1, and DC2. Data are mean ± SD from
(G) Representative stills from time-lapse live imaging in Tbx18H2BGFP embryonic s
after transitioning from Fbs and backtracked in time for 6 hr. Fbs were H2BGFP-lo
Two examples for mitotic cell divisions in Fb are pseudocolored in yellow or blue
(H) Quantification of mitotic cells during 6-hr tracking. n = 2. Data are mean ± SD
Scale bars, 25 mm (E) and 10 mm (G). See also Figure S4.
scription factors were in the mid gene cluster (Figures 5E, 5F,
and S5B). Mid-expressing transcription factors include Trps1,
Tshz1, Foxd1, Prdm1, and Sox18. Mutations in Trps1 are associ-
ated with Ambras Syndrome, a hypertrichosis disorder (Fan-
tauzzo et al., 2008). Mutations in Sox18 have been shown to
impact differentiation of adult dermal papillae (Villani et al.,
2017). Finally, we resolved many transcription factors whose
expression peaked in DC2, including Notch target genes Hey1
and Hes5, as well as Glis2, Foxp1, and Alx4 (Figures 5E, 5F,
and S5C). Foxp1 has noted functions in maintaining hair follicle
stem cell quiescence (Leishman et al., 2013). In total, we discov-
ered 11 early-wave, 16mid-wave, and 24 late-wave transcription
factors (Figure 5G) that followed these temporally restricted up-
regulation patterns along pseudotime, suggesting that a coordi-
nated array of molecular changes is required for pre-DC to
mature through DC1 and DC2.
As the dermal papilla acts as a major signaling niche for
epithelial progenitors during postnatal hair growth and for stem
cells in cycling adult hair follicles, we explored the expression
and upregulation of signaling molecules during DC fate specifi-
cation and niche formation. Here, we discovered a distinct
pattern of signaling waves (Figures 5H–5K; Table S4). Signaling
factors expressed in the short time window around pre-DC
include the Wnt inhibitor Dkk1, Cyr61, and Fst (Figures 5I, 5J,
and S5D). Cyr61 is dynamically expressed in wound healing to
reduce fibrosis (Jun and Lau, 2010). Fst knockout is associated
with abrogated hair follicle development (Nakamura et al.,
2003). The mid-acting signaling molecules included well-known
regulators Fgf10, the TGF-bmodulator Ltbp1, and Sema6a (Fig-
ures 5I, 5J, and S5E); late-acting signaling molecules included
key ligands such as Igfbp4, Inhba, and Rspo3 (Figures 5I, 5J,
and S5F)—many of which continue to be expressed in dermal
papillae (Rezza et al., 2016). The global display, as cumulative
percent of total, corroborates a resolution of 8 early, 11 mid,
and 24 late upregulated signaling factors (Figure 5K). Overall,
these data suggest that DC development, from fate acquisition
in a subset of Fb through aggregated DC1 andDC2, is accompa-
nied by three distinct waves of transcription factor and signaling
molecule expression that in concert are likely regulating the
specification of DC fate and initiation of niche function.
DC Cell Fate Specification Requires Signals fromPre-existing PlacodesOur data suggest that the transition from Fb to pre-DC fate and
to niche formation is coordinated by waves of transcription
lation for Fb and negative correlation for pre-DC.
dered cells for pro-proliferative (Rbbp7,Mki67, and Pcna) and anti-proliferative
tSNE map from Figure 2I.
was injected 6 hr, 12 hr, or 24 hr prior to harvest and analysis of E15.0Sox2GFP
ns from confocal scans are shown for interfollicular Fb and pre-DC, DC1, and
ration rate at 6-hr time point from Fb to DC precursors, sustained through DC2.
two embryos. *p < 0.05, **p < 0.01.
kin for detection of cell divisions. Pre-DC was identified as H2BGFP-high cells
w. Note absence of cell divisions in pre-DC through 6 hr before fate acquisition.
.
from two embryos. **p < 0.01.
Developmental Cell 48, 32–48, January 7, 2019 41

Figure 5. Three Waves of Transcription Factor and Signaling Molecule Upregulation Occur along the DC Niche Developmental Trajectory
(A) Bulk RNA-seq expression trajectories of upregulated genes from Fb to DC2 comprising Spearman rank clustered groups C (early, pre-DC peak), D (mid, DC1
plateau), and E (late, maximum at DC2) from Figure 3E.
(legend continued on next page)
42 Developmental Cell 48, 32–48, January 7, 2019

factor and signaling molecule upregulation. Resolving whether
this is a pre-programmed cell-autonomous process or whether
it relies on intercompartmental signals from pre-existing epithe-
lial placode progenitors directly establishes the developmental
hierarchy of progenitor and niche fate specification.Wnt/b-cate-
nin signaling in the epidermis is essential for Pc formation and
hair follicle morphogenesis, including the formation of themature
DC (Huelsken et al., 2001; Zhang et al., 2009). We next asked
whether the early pre-DC fate, which developmentally precedes
DC1 and DC2, is established in the absence of Pc progenitors.
To this end, we blocked Pc formation by conditional Wnt/
b-catenin signaling ablation in embryonic epidermis of K14-
Cre;b-cateninfl/fl mice. In E14.5 control skin, we confirmed
the developmental stages of SOX2+ ITGA6� DCs underneath
EDAR+ Pcs, including pre-DC (Figures 6A and S6A). Additional
double immunofluorescence with FOXD1 confirmed pre-DC
cell identity (Figure S6B). In b-catenin-ablated skin, as predicted,
EDAR+ Pc and SOX2+ ITGA6� mature DCs were absent (Figures
6B and S6A). Intriguingly, in the absence of Pc, we also failed to
detect groups of unclustered pre-DC, by either SOX2+/ITGA6�
(Figure 6B, S6A, and S6C) or SOX2+/FOXD1+/ITGA6� (Fig-
ure S6B) immunofluorescence, indicating that fate acquisition
of pre-DC cells was entirely abolished. These data demonstrate
that DC cell fate specification from Fb requires the presence of
placode progenitors that likely provide essential Pc-derived
signals.
Placode Progenitor-Derived FGF20 Is Required for DCCell Fate SpecificationA placode-derived signal potentially important for specifying the
DC precursor fate is FGF20, which is both a well-known down-
stream target of Wnt/b-catenin signaling and also required for
the formation of the mature DC (Huh et al., 2013). Recent studies
have further demonstrated that FGF signaling is required for cell
migration to form mature DC clusters; however, it is unclear
whether it regulates DC fate acquisition itself (Biggs et al.,
2018; Glover et al., 2017). Having discovered unclustered DC
precursors prior to formation of mature DC, we next asked
whether Fgf20 is required for induction of the pre-DC fate. To
this end, we generated Fgf20-ablated embryos by crossing
viable and fertile Fgf20Cre-GFP/Cre-GFP knockout mice with
Fgf20LacZ/+ mice (Huh et al., 2012, 2015). In E14.5 heterozygous
(B) Heatmap of relative expression (Z score) of transcription factors in groups C,
(C) Cumulative expression plots of early, mid, and late upregulated genes along p
genes per cell in a given cluster. The black line is the running average across ps
(D) Left panel: expression of early upregulated transcription factors projected o
Twist2 and immunofluorescence for anti-GFP staining. Note Twist2 expression i
(E) Expression of mid and late upregulated transcription factors projected onto t
(F) Normalized running means of expressed transcript numbers in pseudotime
specification of DC precursors toward the mature DC niche fate.
(G) Cumulative percent of sum of upregulated expression of 51 transcription facto
transcription factor wave are represented by thin solid and thick faded lines, res
(H) Heatmap of relative expression (Z score) of signaling-related genes in groups
(I) Expression of representative upregulated signaling molecules projected onto
(J) Normalized running means of expressed transcript numbers in pseudotime o
specification of DC precursors and consolidation of DC niche fate.
(K) Cumulative percent of sum of upregulated expression of 43 signaling molecule
transcription factor wave are represented by thin solid and thick faded lines, res
Scale bar, 50 mm (D). See also Figure S5 and Table S4.
Fgf20Cre-GFP/+ control skins, we observed normal hair follicle
development withmultiple DC stages underneathGFP+ Pcs (Fig-
ures 6C and S6D). In Fgf20 knockout skins of Fgf20Cre-GFP/LacZ
embryos, aggregated mature DCs were absent underneath
GFP+ Pcs, as described previously (Figures 6D and S6D) (Huh
et al., 2013). Intriguingly, here like in the Wnt/b-catenin signaling
ablation above, SOX2+/ITGA6� or SOX2+/FOXD1+ pre-DC cells
were also entirely absent (Figures 6D and S6D–S6F), suggesting
that FGF20 is a key Pc-derived signal essential for DC fate spec-
ification prior to cell aggregation.
DISCUSSION
The timing of Fb-to-DC niche transformation has been tradition-
ally described by the emergence of a characteristic tightly clus-
tered DC beneath a thickened epidermal placode (Millar, 2002).
At the earliest identified stage of bona fide hair follicle morpho-
genesis, distinct Pcs develop before morphological DC clusters
form. Recently, two studies have demonstrated that the struc-
tured DC forms through directed migration of dermal Fb (Biggs
et al., 2018; Glover et al., 2017), but the precise timing and spe-
cific molecular drivers of DC fate-acquisition in relation to the
physical aggregation process and to the timing of Pc progenitor
specification remained unexplored.
Here we demonstrate that de novo expression of the definitive
(clustered) DC markers, Sox2 (Clavel et al., 2012; Driskell et al.,
2009) and Foxd1 (Sennett et al., 2015), first appears before any
appreciable DC clustering. Taking advantage of Sox2 and other
DC molecular markers, both pre– and post-clustering, we were
now able to define the molecular landscape of the earliest fate-
acquired DCprecursors and their most closely related Fb, further
refining our previous molecular characterization of the estab-
lished DC niche (Sennett et al., 2015). Reinforcing our novel sort-
ing strategy for population-based RNA-seq analyses of distinct
unclustered DC precursors and clustered DC stages, unbiased
lineage prediction from single-cell transcriptomes further
reconstructed the DC differentiation path of the bulk approach.
Importantly, it also provided a highly resolved account of the
molecular transitional states and developmental trajectory from
non-committed Fb to DC precursors through DC1 and DC2.
Complementing the model of DC niche formation through
directed migration from ex vivo live imaging (Biggs et al., 2018;
D, and E (blue, red, green bars) from Figure 3E.
seudotime from Figure 3I. Each dot represents the cumulative expression of all
eudotime.
nto the tSNE map from Figure 2I. Right panel: parallel in situ hybridization for
n pre-DC, which is downregulated in DC1. DAPI marks all nuclei.
he tSNE map from Figure 2I.
ordered cells. Transcription factors are upregulated in three waves during
rs in early, mid, and late waves. Means and range of cumulative percent in each
pectively.
C, D, and E (blue, red, green bars).
the tSNE map from Figure 2I.
rdered cells. Signaling molecules are upregulated in three waves early during
s in early, mid, and late waves. Means and range of cumulative percent in each
pectively.
Developmental Cell 48, 32–48, January 7, 2019 43
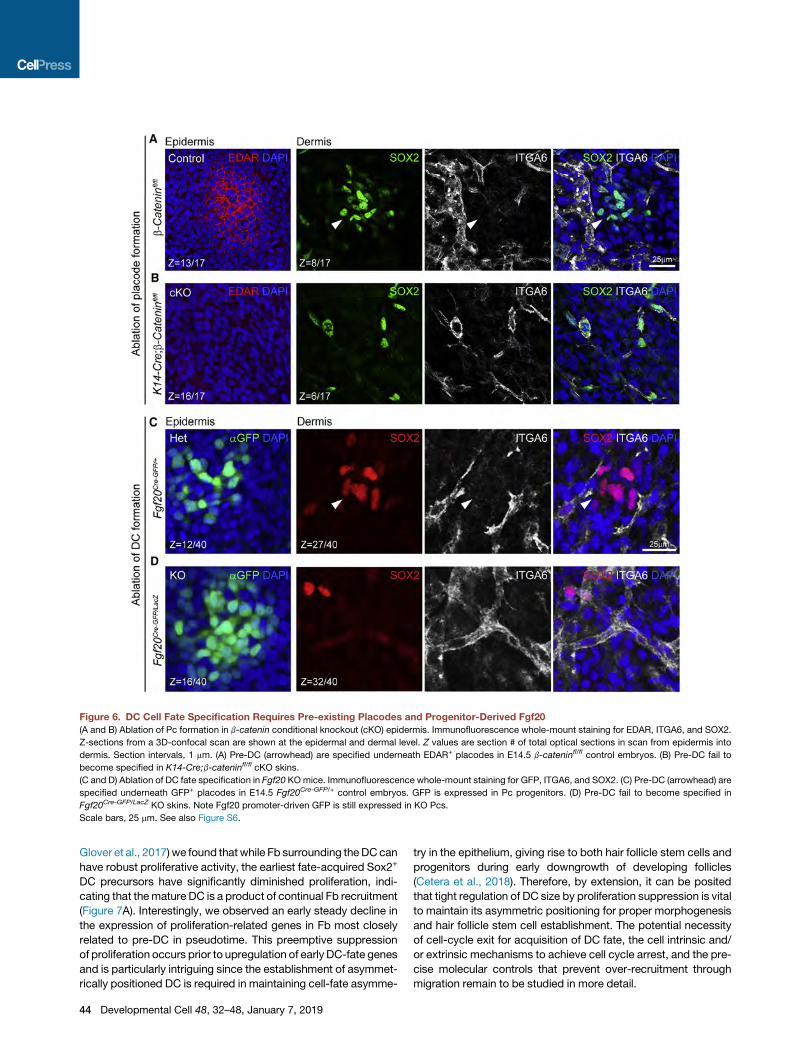
Figure 6. DC Cell Fate Specification Requires Pre-existing Placodes and Progenitor-Derived Fgf20
(A and B) Ablation of Pc formation in b-catenin conditional knockout (cKO) epidermis. Immunofluorescence whole-mount staining for EDAR, ITGA6, and SOX2.
Z-sections from a 3D-confocal scan are shown at the epidermal and dermal level. Z values are section # of total optical sections in scan from epidermis into
dermis. Section intervals, 1 mm. (A) Pre-DC (arrowhead) are specified underneath EDAR+ placodes in E14.5 b-cateninfl/fl control embryos. (B) Pre-DC fail to
become specified in K14-Cre;b-cateninfl/fl cKO skins.
(C and D) Ablation of DC fate specification in Fgf20 KOmice. Immunofluorescence whole-mount staining for GFP, ITGA6, and SOX2. (C) Pre-DC (arrowhead) are
specified underneath GFP+ placodes in E14.5 Fgf20Cre-GFP/+ control embryos. GFP is expressed in Pc progenitors. (D) Pre-DC fail to become specified in
Fgf20Cre-GFP/LacZ KO skins. Note Fgf20 promoter-driven GFP is still expressed in KO Pcs.
Scale bars, 25 mm. See also Figure S6.
Glover et al., 2017) we found thatwhile Fb surrounding theDCcan
have robust proliferative activity, the earliest fate-acquired Sox2+
DC precursors have significantly diminished proliferation, indi-
cating that themature DC is a product of continual Fb recruitment
(Figure 7A). Interestingly, we observed an early steady decline in
the expression of proliferation-related genes in Fb most closely
related to pre-DC in pseudotime. This preemptive suppression
of proliferation occurs prior to upregulation of early DC-fate genes
and is particularly intriguing since the establishment of asymmet-
rically positioned DC is required in maintaining cell-fate asymme-
44 Developmental Cell 48, 32–48, January 7, 2019
try in the epithelium, giving rise to both hair follicle stem cells and
progenitors during early downgrowth of developing follicles
(Cetera et al., 2018). Therefore, by extension, it can be posited
that tight regulation of DC size by proliferation suppression is vital
to maintain its asymmetric positioning for proper morphogenesis
and hair follicle stem cell establishment. The potential necessity
of cell-cycle exit for acquisition of DC fate, the cell intrinsic and/
or extrinsic mechanisms to achieve cell cycle arrest, and the pre-
cise molecular controls that prevent over-recruitment through
migration remain to be studied in more detail.
Figure 7. Model of DC Fate Specification and Maturation during Hair Follicle Formation
(A) Schematic depicting the developmental hierarchy and timing of Pc and DC niche fate specification and maturation. Unknown dermal signals induce Pc
progenitors. Local Wnt signaling activity upregulates FGF20. Pc-derived FGF20 is first required for fate specification of DC precursors that are at a transitional
molecular state toward the DC niche biological fate. FGF20 then regulates cell aggregation to form the mature DC niche.
(B) Key steps of the DC niche fate trajectory during the Fb-to-DC transition. Exit from the cell cycle and progressive loss of Fb fate coincide with progressive
acquisition of the DC niche fate through three upregulation waves of DC transcription factors and signaling molecules.
From both our bulk and single-cell transcriptome analyses, we
identified transcription factors enriched in pre-DC—including
Twist2, Lef1, and Smad3, indicating an immediate shift in the
gene regulatory network during early niche fate acquisition—
potentially acting as trailblazers for downstream upregulation
of mid- and late-expressed transcription factors and genes for
DC formation and function, such as those encoding cell-adhe-
sion and signaling proteins (Figure 7B). The reconstructed line-
age order in pseudotime also revealed a subset of Fb closely
related to pre-DC, raising the possibility of a yet earlier precursor
stage to the DC niche fate. While pinpointing their precise spatial
location poses a considerable challenge because of the paucity
of distinctly expressed marker genes, clustering analyses place
these cells broadly among upper dermal Fb which harbor multi-
potent dermal Fb progenitors (Driskell et al., 2013).
Epithelial-mesenchymal interdependence during early HF
morphogenesis has been shown by multiple compartment-spe-
cific disruptions affecting the development of its counterpart
(Chen et al., 2012; Tsai et al., 2014; Zhang et al., 2009). By pre-
venting Pc formation through epidermal b-catenin ablation
(Huelsken et al., 2001), we determined from the absence of
pre-DC that early DC fate acquisition is not an autonomous
pre-program of the upper dermis but rather requires local direc-
tive signals from spatially patterned Pc. Genetic ablation of Fgf20
has previously demonstrated its requirement for DC formation by
hair follicle stage 1 through cell migration (Biggs et al., 2018; Huh
et al., 2013). Here we provide evidence that FGF20 directly pro-
motes the early DC precursor fate before DC cluster formation.
Similarly, recent identification of an Fgf20-expressing olfactory
epithelial stem cell niche revealed a Wnt-regulated FGF20
requirement for formation of the underlying mesenchymal con-
densations that form nasal turbinates (Yang et al., 2018a; Yang
and Ornitz, 2018b). Taken together, these data indicate that
the progenitors in nascent hair follicle pre-Pc signal to underlying
Fb, at least in part, through FGF20 to induce the early DC fate
prior to cluster-forming migration, and unequivocally demon-
strate that progenitor fate precedes establishment of its support-
ive niche.
We now propose an updated model of progenitor and niche
specification during early hair follicle morphogenesis (Figures
7A and 7B): Wnt-dependent Pc progenitors signal to underlying
dermal Fb via the FGF/FGFR signaling axis, initiating a cascade
of dynamic transcriptional waves that regulate DC niche fate
specification. Through multifaceted signaling interactions be-
tween Pc, pre-DC, and unspecified interfollicular dermal Fb,
fate-specified DC precursor cells centrally migrate to form the
Developmental Cell 48, 32–48, January 7, 2019 45
clustered DC (DC1). Continued pre-DC fate acquisition and
migration incorporates additional cells to the DC cluster, while
in the earliest established DC the new transcriptional regulatory
network—set up by the first transcriptional wave—begins to up-
regulate expression of the molecular machinery crucial for
signaling functions from the DC niche to the progenitors above.
STAR+METHODS
Detailed methods are provided in the online version of this paper
and include the following:
d KEY RESOURCES TABLE
d CONTACT FOR REAGENT AND RESOURCE SHARING
d EXPERIMENTAL MODEL AND SUBJECT DETAILS
46
B Mice
d METHOD DETAILS
B EdU Incorporation
B Immunofluorescence Staining
B Image Acquisition and Processing
B Single-Molecule mRNA Fluorescence In Situ Hybridi-
zation
B E15.0 Cell Isolation and Sorting
B Real-Time qRT-PCR
B cDNA Library Preparation for Bulk RNA Sequencing
B cDNA Library Preparation for Single-Cell RNA
Sequencing
B 4D Time-Lapse Live Imaging
d QUANTIFICATION AND STATISTICAL ANALYSIS
B Quantification of DC Clustering State
B Quantification of Proliferation by EdU-Uptake
B Quantification of Proliferation by Cell Division during
Time-Lapse Live Imaging
B Quantification of Number of DCs per Field of View
B Bulk RNA Sequencing Data Analysis
B Single-Cell RNA Sequencing Data Analysis
d DATA AND SOFTWARE AVAILABILITY
B Software
B Data Resources
SUPPLEMENTAL INFORMATION
Supplemental Information includes six figures, four tables, and three videos
and can be found with this article online at https://doi.org/10.1016/j.devcel.
2018.11.034.
ACKNOWLEDGMENTS
We thank Elena Ezhkova (ISMMS) for sharing mice and reagents. Many thanks
to the personnel at the ISMMS Flow Cytometry and Microscopy CoRE and to
Venu Pothula for technical assistance with single-cell sorting. Thanks go to the
personnel at theGenome Technology Center at NYU and to Judith Vivie for sin-
gle-cell RNA sequencing at the Hubrecht Institute (Netherlands). Additionally,
we thank Marja Mikkola (U. Helsinki), Peggy Myung (Yale), and Martina Rangl
(Cornell) for helpful discussions and valuable comments. K.-W.M was sup-
ported by The Science Appearance Career Development Award fellowship
from the Dermatology Foundation. N.H. was supported by grants
T32GM007280 from NIH/NIGMS and F30AR070639 from NIH/NIAMS. A.M.
was supported by NIH grants U54-HL127624 (LINCS-DCIC) and U24-
CA224260 (IDG-KMC). D.M.O. was supported by NIH grant HL111190 and
R21DC017042. M.R. was supported by grants from NIH/NIAMS
Developmental Cell 48, 32–48, January 7, 2019
(R01AR071047; R01AR063151) and New York State Department of Health
(NYSTEM-C029574) and a fellowship from the Irma T. Hirschl Trust.
AUTHOR CONTRIBUTIONS
K.-W.M., R.S., and M.R. conceived the overall project design. K.-W.M., N.S.,
N.H., L.G., D.S., Y.S., and L.M.Y. performed experiments. K.-W.M., N.S., N.H.,
and Z.W. analyzed bulk RNA-seq data. N.S., M.-J.M., and T.J. performed bio-
informatics analysis of single-cell RNA-seq data. All authors discussed results
and participated in the preparation and editing of the manuscript. K.-W.M,
N.S., N.H., and M.R. wrote the manuscript. M.R. supervised the study.
DECLARATION OF INTERESTS
The authors declare no competing interests.
Received: September 11, 2018
Revised: October 31, 2018
Accepted: November 27, 2018
Published: December 27, 2018
REFERENCES
Ahtiainen, L., Lefebvre, S., Lindfors, P.H., Renvoise, E., Shirokova, V.,
Vartiainen, M.K., Thesleff, I., and Mikkola, M.L. (2014). Directional cell migra-
tion, but not proliferation, drives hair placode morphogenesis. Dev. Cell 28,
588–602.
Biggs, L.C., M€akel€a, O.J.M., Myllym€aki, S.M., Das Roy, R., N€arhi, K., Pispa, J.,
Mustonen, T., and Mikkola, M.L. (2018). Hair follicle dermal condensation
forms via FGF20 primed cell cycle exit, cell motility, and aggregation. Elife
7, 1–33.
Blondel, V.D., Guillaume, J.L., Lambiotte, R., and Lefebvre, E. (2008). Fast
unfolding of communities in large networks. J. Stat. Mech. Theory Exp.
2008, 1–12.
Brault, V., Moore, R., Kutsch, S., Ishibashi, M., Rowitch, D.H., McMahon, A.P.,
Sommer, L., Boussadia, O., and Kemler, R. (2001). Inactivation of the beta-cat-
enin gene by Wnt1-Cre-mediated deletion results in dramatic brain malforma-
tion and failure of craniofacial development. Development 128, 1253–1264.
Cetera, M., Leybova, L., Joyce, B., and Devenport, D. (2018). Counter-rota-
tional cell flows drive morphological and cell fate asymmetries in mammalian
hair follicles. Nat. Cell Biol. 20, 541–552.
Chen, D., Jarrell, A., Guo, C., Lang, R., and Atit, R. (2012). Dermalb-catenin ac-
tivity in response to epidermal Wnt ligands is required for fibroblast prolifera-
tion and hair follicle initiation. Development 139, 1522–1533.
Chen, E.Y., Tan, C.M., Kou, Y., Duan, Q.,Wang, Z., Meirelles, G.V., Clark, N.R.,
and Ma’ayan, A. (2013). Enrichr: interactive and collaborative HTML5 gene list
enrichment analysis tool. BMC Bioinformatics 14, 128.
Clavel, C., Grisanti, L., Zemla, R., Rezza, A., Barros, R., Sennett, R., Mazloom,
A.R., Chung, C.Y., Cai, X., Cai, C.L., et al. (2012). Sox2 in the dermal papilla
niche controls hair growth by fine-tuning BMP signaling in differentiating hair
shaft progenitors. Dev. Cell 23, 981–994.
DasGupta, R., and Fuchs, E. (1999). Multiple roles for activated LEF/TCF tran-
scription complexes during hair follicle development and differentiation.
Development 126, 4557–4568.
Dassule, H.R., Lewis, P., Bei, M., Maas, R., and McMahon, A.P. (2000). Sonic
hedgehog regulates growth and morphogenesis of the tooth. Development
127, 4775–4785.
Driskell, R.R., Giangreco, A., Jensen, K.B., Mulder, K.W., and Watt, F.M.
(2009). Sox2-positive dermal papilla cells specify hair follicle type in mamma-
lian epidermis. Development 136, 2815–2823.
Driskell, R.R., Lichtenberger, B.M., Hoste, E., Kretzschmar, K., Simons, B.D.,
Charalambous, M., Ferron, S.R., Herault, Y., Pavlovic, G., Ferguson-Smith,
A.C., et al. (2013). Distinct fibroblast lineages determine dermal architecture
in skin development and repair. Nature 504, 277–281.
Ellis, P., Fagan, B.M., Magness, S.T., Hutton, S., Taranova, O., Hayashi, S.,
McMahon, A., Rao, M., and Pevny, L. (2004). SOX2, a persistent marker for
multipotential neural stem cells derived from embryonic stem cells, the embryo
or the adult. Dev. Neurosci. 26, 148–165.
Falk, S., and Gotz, M. (2017). Glial control of neurogenesis. Curr. Opin.
Neurobiol. 47, 188–195.
Fantauzzo, K.A., Tadin-Strapps, M., You, Y., Mentzer, S.E., Baumeister,
F.A.M., Cianfarani, S., Van Maldergem, L., Warburton, D., Sundberg, J.P.,
and Christiano, A.M. (2008). A position effect on TRPS1 is associated with
Ambras syndrome in humans and the Koala phenotype in mice. Hum. Mol.
Genet. 17, 3539–3551.
Garcıa-Palmero, I., Torres, S., Bartolome, R.A., Pelaez-Garcıa, A., Larriba,
M.J., Lopez-Lucendo, M., Pena, C., Escudero-Paniagua, B., Munoz, A., and
Casal, J.I. (2016). Twist1-induced activation of human fibroblasts promotes
matrix stiffness by upregulating palladin and collagen a1(VI). Oncogene 35,
5224–5236.
Ge, Y., and Fuchs, E. (2018). Stretching the limits: from from homeostasis to
stem cell plasticity in wound healing and cancer. Nat. Rev. Genet. 19, 311–325.
vanGenderen, C., Okamura, R.M., Farinas, I., Quo, R.G., Parslow, T.G., Bruhn,
L., and Grosschedl, R. (1994). Development of several organs that require
inductive epithelial-mesenchymal interactions is impaired in LEF-1-deficient
mice. Genes Dev. 8, 2691–2703.
Glover, J.D., Wells, K.L., Matth€aus, F., Painter, K.J., Ho, W., Riddell, J.,
Johansson, J.A., Ford, M.J., Jahoda, C.A.B., Klika, V., et al. (2017).
Hierarchical patterning modes orchestrate hair follicle morphogenesis. PLoS
Biol. 15, e2002117.
Grisanti, L., Clavel, C., Cai, X., Rezza, A., Tsai, S.Y., Sennett, R., Mumau, M.,
Cai, C.L., and Rendl, M. (2013). Tbx18 targets dermal condensates for label-
ing, isolation, and gene ablation during embryonic hair follicle formation.
J. Invest. Dermatol. 133, 344–353.
Gr€un, D., Muraro, M.J., Boisset, J.C., Wiebrands, K., Lyubimova, A.,
Dharmadhikari, G., van den Born, M., van Es, J., Jansen, E., Clevers, H.,
et al. (2016). De novo prediction of stem cell identity using single-cell transcrip-
tome data. Cell Stem Cell 19, 266–277.
Haghverdi, L., B€uttner, M., Wolf, F.A., Buettner, F., and Theis, F.J. (2016).
Diffusion pseudotime robustly reconstructs lineage branching. Nat. Methods
13, 845–848.
Hamilton, T.G., Klinghoffer, R.A., Corrin, P.D., and Soriano, P. (2003).
Evolutionary divergence of platelet-derived growth factor alpha receptor
signaling mechanisms. Mol. Cell. Biol. 23, 4013–4025.
Heitman, N., Saxena, N., and Rendl, M. (2018). Advancing insights into stem
cell niche complexities with next-generation technologies. Curr. Opin. Cell
Biol. 55, 87–95.
Herman, J.S., Sagar, and Gr€un, D. (2018). FateID infers cell fate bias in multi-
potent progenitors from single-cell RNA-seq data. Nat. Methods 15, 379–386.
Huelsken, J., Vogel, R., Erdmann, B., Cotsarelis, G., andBirchmeier,W. (2001).
b-catenin controls hair follicle morphogenesis and stem cell differentiation in
the skin. Cell 105, 533–545.
Huh, S.H., N€arhi, K., Lindfors, P.H., H€a€ar€a, O., Yang, L., Ornitz, D.M., and
Mikkola, M.L. (2013). FGF20 governs formation of primary and secondary
dermal condensations in developing hair follicles. Genes Dev. 27, 450–458.
Huh, S.H., Jones, J., Warchol, M.E., and Ornitz, D.M. (2012). Differentiation of
the lateral compartment of the cochlea requires a temporally restricted FGF20
signal. PLoS Biol. 10, e1001231.
Huh, S.H., Warchol, M.E., and Ornitz, D.M. (2015). Cochlear progenitor num-
ber is controlled through mesenchymal FGF receptor signaling. Elife 4, 1–27.
Jun, J.Il., and Lau, L.F. (2010). The matricellular protein CCN1 induces fibro-
blast senescence and restricts fibrosis in cutaneous wound healing. Nat.
Cell Biol. 12, 676–685.
Keller, R.B., Tran, T.T., Pyott, S.M., Pepin, M.G., Savairayan, R., McGillivray,
G., Nickerson, D.A., Bamshad, M.J., and Byers, P.H. (2018). Monoallelic and
biallelic CREB3L1 variant causes mild and severe osteogenesis imperfecta,
respectively. Genet. Med. 20, 411–419.
Lambert, S.A., Jolma, A., Campitelli, L.F., Das, P.K., Yin, Y., Albu, M., Chen, X.,
Taipale, J., Hughes, T.R., and Weirauch, M.T. (2018). The human transcription
factors. Cell 172, 650–665.
Langmead, B., and Salzberg, S.L. (2012). Fast gapped-read alignment with
Bowtie 2. Nat. Methods 9, 357–359.
Lee, J.H., Tammela, T., Hofree, M., Choi, J., Marjanovic, N.D., Han, S., Canner,
D., Wu, K., Paschini, M., Bhang, D.H., et al. (2017). Anatomically and function-
ally distinct lungmesenchymal populationsmarked by Lgr5 and Lgr6. Cell 170,
1149–1163.e12.
Leishman, E., Howard, J.M., Garcia, G.E., Miao, Q., Ku, A.T., Dekker, J.D.,
Tucker, H., and Nguyen, H. (2013). Foxp1 maintains hair follicle stem cell
quiescence through regulation of FGF18. Development 140, 3809–3818.
Li, L., Cserjesi, P., andOlson, E.N. (1995). Dermo-1: a novel twist-related bHLH
protein expressed in the developing dermis. Dev. Biol. 172, 280–292.
Liu, Y., El-Naggar, S., Darling, D.S., Higashi, Y., and Dean, D.C. (2008).
Zeb1 links epithelial-mesenchymal transition and cellular senescence.
Development 135, 579–588.
Van Der Maaten, L.J.P., and Hinton, G.E. (2008). Visualizing high-dimensional
data using t-sne. J. Mach. Learn. Res. 9, 2579–2605.
McInnes, L., and Healy, J. (2018). UMAP: uniform manifold approximation and
projection for dimension reduction. J. Open Source Softw. 3, 861.
Millar, S.E. (2002). Molecular mechanisms regulating hair follicle development.
J. Invest. Dermatol. 118, 216–225.
Muraro, M.J., Dharmadhikari, G., Gr€un, D., Groen, N., Dielen, T., Jansen, E.,
van Gurp, L., Engelse, M.A., Carlotti, F., de Koning, E.J.P., et al. (2016). A sin-
gle-cell transcriptome atlas of the human pancreas. Cell Syst. 3, 385–394.e3.
Nakamura, M., Matzuk, M.M., Gerstmayer, B., Bosio, A., Lauster, R., Miyachi,
Y., Werner, S., and Paus, R. (2003). Control of pelage hair follicle development
and cycling by complex interactions between follistatin and activin. FASEB J.
17, 497–499.
Ouspenskaia, T., Matos, I., Mertz, A.F., Fiore, V.F., and Fuchs, E. (2016). WNT-
SHH antagonism specifies and expands stem cells prior to niche formation.
Cell 164, 156–169.
Paus, R., M€uller-Rover, S., Van Der Veen, C., Maurer, M., Eichm€uller, S., Ling,
G., Hofmann, U., Foitzik, K., Mecklenburg, L., and Handjiski, B. (1999).
A comprehensive guide for the recognition and classification of distinct stages
of hair follicle morphogenesis. J. Invest. Dermatol. 113, 523–532.
Ramilowski, J.A., Goldberg, T., Harshbarger, J., Kloppmann, E., Lizio, M.,
Satagopam, V.P., Itoh, M., Kawaji, H., Carninci, P., Rost, B., et al. (2015).
A draft network of ligand-receptor-mediated multicellular signalling in human.
Nat. Commun. 6, 7866.
Reich, M., Liefeld, T., Gould, J., Lerner, J., Tamayo, P., and Mesirov, J.P.
(2006). GenePattern 2.0 [2]. Nat. Genet. 38, 500–501.
Rezza, A., Sennett, R., and Rendl, M. (2014). Adult stem cell niches: cellular
and molecular components. Curr. Top. Dev. Biol. 107, 333–372.
Rezza, A., Wang, Z., Sennett, R., Qiao, W., Wang, D., Heitman, N., Mok, K.W.,
Clavel, C., Yi, R., Zandstra, P., et al. (2016). Signaling networks among stem
cell precursors, transit-amplifying progenitors, and their niche in developing
hair follicles. Cell Rep. 14, 3001–3018.
Sennett, R., and Rendl, M. (2012). Mesenchymal-epithelial interactions during
hair follicle morphogenesis and cycling. Semin. Cell Dev. Biol. 23, 917–927.
Sennett, R., Rezza, A., Dauber, K.L., Clavel, C., and Rendl, M. (2014). Cxcr4 is
transiently expressed in both epithelial and mesenchymal compartments of
nascent hair follicles but is not required for follicle formation. Exp. Dermatol.
23, 748–750.
Sennett, R., Wang, Z., Rezza, A., Grisanti, L., Roitershtein, N., Sicchio, C.,
Mok, K.W., Heitman, N.J., Clavel, C., Ma’ayan, A., et al. (2015). An integrated
transcriptome atlas of embryonic hair follicle progenitors, their niche, and the
developing skin. Dev. Cell 34, 577–591.
Shoshkes-Carmel, M., Wang, Y.J., Wangensteen, K.J., Toth, B., Kondo, A.,
Massasa, E.E., Itzkovitz, S., and Kaestner, K.H. (2018). Subepithelial telocytes
are an important source of Wnts that supports intestinal crypts. Nature 557,
242–246.
�So�si�c, D., Richardson, J.A., Yu, K., Ornitz, D.M., and Olson, E.N. (2003). Twist
regulates cytokine gene expression through a negative feedback loop that re-
presses NF-kappaB activity. Cell 112, 169–180.
Developmental Cell 48, 32–48, January 7, 2019 47

Subramanian, A., Tamayo, P., Mootha, V.K., Mukherjee, S., Ebert, B.L.,
Gillette, M.A., Paulovich, A., Pomeroy, S.L., Golub, T.R., Lander, E.S., et al.
(2005). Gene set enrichment analysis: a knowledge-based approach for inter-
preting genome-wide expression profiles. Proc. Natl. Acad. Sci. USA 102,
15545–15550.
Tobin, D.J., Gunin, A., Magerl, M., Handijski, B., and Paus, R. (2003). Plasticity
and cytokinetic dynamics of the hair follicle mesenchyme: implications for hair
growth control. J. Invest. Dermatol. 120, 895–904.
Torre, D., Lachmann, A., and Ma’ayan, A. (2018). BioJupies: automated
Generation of interactive notebooks for RNA-seq data analysis in the cloud.
Cell Syst. 352476, https://doi.org/10.1016/j.cels.2018.10.007.
Trapnell, C., Pachter, L., and Salzberg, S.L. (2009). TopHat: discovering splice
junctions with RNA-Seq. Bioinformatics 25, 1105–1111.
Trapnell, C., Williams, B.A., Pertea, G., Mortazavi, A., Kwan, G., Van Baren,
M.J., Salzberg, S.L., Wold, B.J., and Pachter, L. (2010). Transcript assembly
and quantification by RNA-seq reveals unannotated transcripts and isoform
switching during cell differentiation. Nat. Biotechnol. 28, 511–515.
Tsai, S.Y., Sennett, R., Rezza, A., Clavel, C., Grisanti, L., Zemla, R., Najam, S.,
and Rendl, M. (2014). Wnt/b-catenin signaling in dermal condensates is
required for hair follicle formation. Dev. Biol. 385, 179–188.
48 Developmental Cell 48, 32–48, January 7, 2019
Villani, R., Hodgson, S., Legrand, J., Greaney, J., Wong, H.Y., Pichol-
Thievend, C., Adolphe, C., Wainwight, B., Francois, M., and Khosrotehrani,
K. (2017). Dominant-negative Sox18 function inhibits dermal papilla matura-
tion and differentiation in all murine hair types. Development 144, 1887–1895.
Wei, Q., and Frenette, P.S. (2018). Niches for hematopoietic stem cells and
their progeny. Immunity 48, 632–648.
Wolf, F.A., Angerer, P., and Theis, F.J. (2018). SCANPY: large-scale single-cell
gene expression data analysis. Genome Biol. 19, 15.
Yang, L.M., Huh, S.H., and Ornitz, D.M. (2018a). FGF20-expressing, Wnt-
responsive olfactory epithelial progenitors regulate underlying turbinate
growth to optimize surface area. Dev. Cell 46, 564–580.e5.
Yang, L.M., and Ornitz, D.M. (2018b). Sculpting the skull through neurosen-
sory epithelial-mesenchymal signaling. Dev. Dyn. https://doi.org/10.1002/
dvdy.24664.
Zhang, Y., Tomann, P., Andl, T., Gallant, N.M., Huelsken, J., Jerchow, B.,
Birchmeier, W., Paus, R., Piccolo, S., Mikkola, M.L., et al. (2009). Reciprocal
requirements for EDA/EDAR/NF-kappaB and Wnt/b-catenin signaling path-
ways in hair follicle induction. Dev. Cell 17, 49–61.
Zhu, R., Zou, S.T., Wan, J.M., Li, W., Li, X.L., and Zhu, W. (2013). BTG1 inhibits
breast cancer cell growth through induction of cell cycle arrest and apoptosis.
Oncol. Rep. 30, 2137–2144.
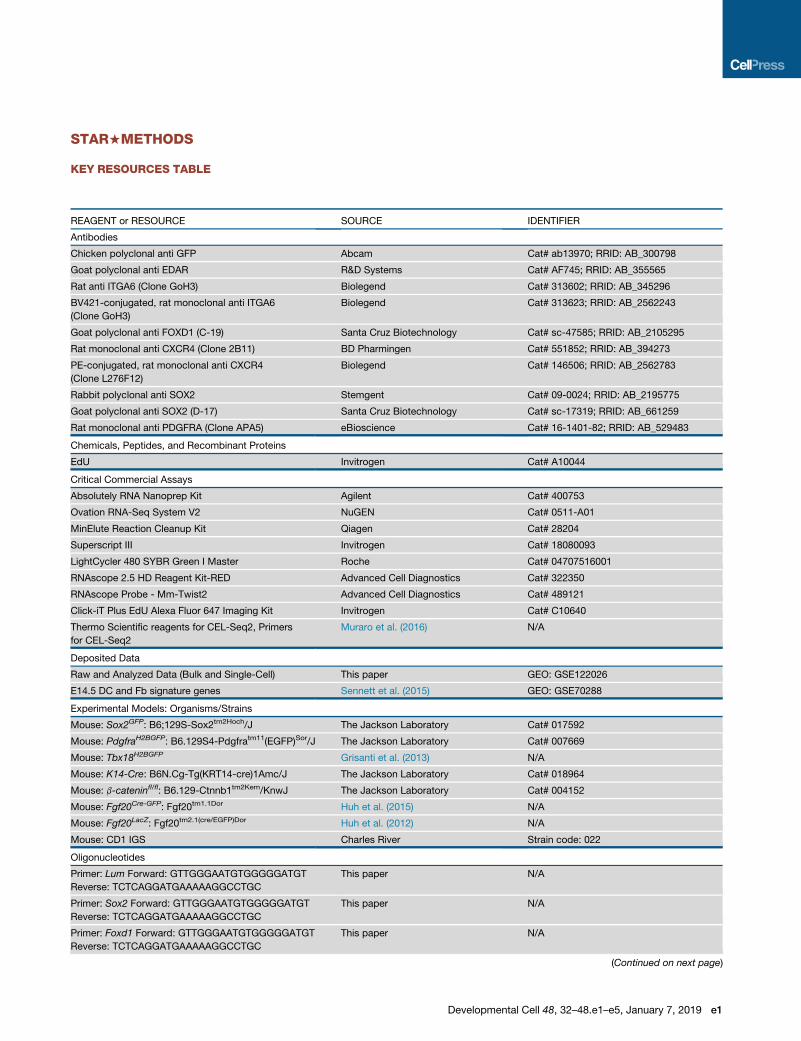
STAR+METHODS
KEY RESOURCES TABLE
REAGENT or RESOURCE SOURCE IDENTIFIER
Antibodies
Chicken polyclonal anti GFP Abcam Cat# ab13970; RRID: AB_300798
Goat polyclonal anti EDAR R&D Systems Cat# AF745; RRID: AB_355565
Rat anti ITGA6 (Clone GoH3) Biolegend Cat# 313602; RRID: AB_345296
BV421-conjugated, rat monoclonal anti ITGA6
(Clone GoH3)
Biolegend Cat# 313623; RRID: AB_2562243
Goat polyclonal anti FOXD1 (C-19) Santa Cruz Biotechnology Cat# sc-47585; RRID: AB_2105295
Rat monoclonal anti CXCR4 (Clone 2B11) BD Pharmingen Cat# 551852; RRID: AB_394273
PE-conjugated, rat monoclonal anti CXCR4
(Clone L276F12)
Biolegend Cat# 146506; RRID: AB_2562783
Rabbit polyclonal anti SOX2 Stemgent Cat# 09-0024; RRID: AB_2195775
Goat polyclonal anti SOX2 (D-17) Santa Cruz Biotechnology Cat# sc-17319; RRID: AB_661259
Rat monoclonal anti PDGFRA (Clone APA5) eBioscience Cat# 16-1401-82; RRID: AB_529483
Chemicals, Peptides, and Recombinant Proteins
EdU Invitrogen Cat# A10044
Critical Commercial Assays
Absolutely RNA Nanoprep Kit Agilent Cat# 400753
Ovation RNA-Seq System V2 NuGEN Cat# 0511-A01
MinElute Reaction Cleanup Kit Qiagen Cat# 28204
Superscript III Invitrogen Cat# 18080093
LightCycler 480 SYBR Green I Master Roche Cat# 04707516001
RNAscope 2.5 HD Reagent Kit-RED Advanced Cell Diagnostics Cat# 322350
RNAscope Probe - Mm-Twist2 Advanced Cell Diagnostics Cat# 489121
Click-iT Plus EdU Alexa Fluor 647 Imaging Kit Invitrogen Cat# C10640
Thermo Scientific reagents for CEL-Seq2, Primers
for CEL-Seq2
Muraro et al. (2016) N/A
Deposited Data
Raw and Analyzed Data (Bulk and Single-Cell) This paper GEO: GSE122026
E14.5 DC and Fb signature genes Sennett et al. (2015) GEO: GSE70288
Experimental Models: Organisms/Strains
Mouse: Sox2GFP: B6;129S-Sox2tm2Hoch/J The Jackson Laboratory Cat# 017592
Mouse: PdgfraH2BGFP: B6.129S4-Pdgfratm11(EGFP)Sor/J The Jackson Laboratory Cat# 007669
Mouse: Tbx18H2BGFP Grisanti et al. (2013) N/A
Mouse: K14-Cre: B6N.Cg-Tg(KRT14-cre)1Amc/J The Jackson Laboratory Cat# 018964
Mouse: b-cateninfl/fl: B6.129-Ctnnb1tm2Kem/KnwJ The Jackson Laboratory Cat# 004152
Mouse: Fgf20Cre-GFP: Fgf20tm1.1Dor Huh et al. (2015) N/A
Mouse: Fgf20LacZ: Fgf20tm2.1(cre/EGFP)Dor Huh et al. (2012) N/A
Mouse: CD1 IGS Charles River Strain code: 022
Oligonucleotides
Primer: Lum Forward: GTTGGGAATGTGGGGGATGT
Reverse: TCTCAGGATGAAAAAGGCCTGC
This paper N/A
Primer: Sox2 Forward: GTTGGGAATGTGGGGGATGT
Reverse: TCTCAGGATGAAAAAGGCCTGC
This paper N/A
Primer: Foxd1 Forward: GTTGGGAATGTGGGGGATGT
Reverse: TCTCAGGATGAAAAAGGCCTGC
This paper N/A
(Continued on next page)
Developmental Cell 48, 32–48.e1–e5, January 7, 2019 e1

Continued
REAGENT or RESOURCE SOURCE IDENTIFIER
Primer: Cxcr4 Forward: GTTGGGAATGTGGGGGATGT
Reverse: TCTCAGGATGAAAAAGGCCTGC
This paper N/A
Primer: Fabp7 Forward: GTTGGGAATGTGGGGGATGT
Reverse: TCTCAGGATGAAAAAGGCCTGC
This paper N/A
Software and Algorithms
Imaris Bitplane Version 9.2.1
ImageJ NIH https://imagej.nih.gov/ij/index.html
FlowJo FlowJo Version 7.6.5
TopHat v2.0.3 Trapnell et al. (2009) Version 2.0.3
Bowtie2 Langmead and Salzberg (2012) Version 2.0.0
Cufflinks v2.1.1 Trapnell et al. (2010) Version 2.1.1
Genepattern Reich et al. (2006) http://software.broadinstitute.org/
cancer/software/genepattern
Morpheus https://software.broadinstitute.org/
morpheus
N/A
RaceID3 and StemID2 algorithm Grun et al. (2016) N/A
R https://www.r-project.org/ Version 3.5.1
Rstudio https://www.rstudio.com/products/
rstudio/download/
Version 1.1.453
BioJupies Torre et al. (2018) https://amp.pharm.mssm.edu/biojupies/
Python https://www.python.org/downloads/ Version 3.6.5
Jupyter http://jupyter.org/ Version 1.0.0
Scanpy Wolf et al. (2018) Version 1.2.2
Other
384-well hard shell plates for sorting and SORT-Seq Biorad HSP3801
Nanodrop II Liquid Handling Platform Innovadyne N/A
FACS Aria II BD Biosciences N/A
CONTACT FOR REAGENT AND RESOURCE SHARING
Further information and requests for resources and reagents should be directed to and will be fulfilled by the Lead Contact, Michael
Rendl ([email protected]).
EXPERIMENTAL MODEL AND SUBJECT DETAILS
MiceMice were housed at the Center for Comparative Medicine and Surgery (CCMS) at Icahn School of Medicine at Mount Sinai (ISMMS)
and all performed animal experiments were reviewed and approved by the Institutional Animal Care and Use Committee (IACUC) at
ISMMS. Timed matings were set up to obtain embryos at the ages indicated in figure legends (embryonic day 14.0 to 15.0), sex not
known. Embryo ages were determined by designating the morning of vaginal plug detection as E0.5. Sox2GFP (Ellis et al., 2004),
Tbx18H2BGFP (Grisanti et al., 2013) and PdgfraH2BGFP (Hamilton et al., 2003) fluorescent reporter mice were generated as previously
described. Fgf20Cre-GFP and Fgf20LacZ mice for Fgf20 knockout were generated as previously described (Huh et al., 2012; Huh et al.,
2015). b-catenin epidermal-specific cKO were generated by mating b-cateninfl/fl (Brault et al., 2001) with K14-Cre (Dassule et al.,
2000) mice.
METHOD DETAILS
EdU IncorporationFor EdU-uptake proliferation assays, pregnant females mated with Sox2GFP males were injected intraperitoneally with a single dose
of EdU/PBS (500 mg/g body weight) 6, 12 or 24 hours prior to sacrifice. EdU detection was performedwith the Click-It EdUAlexaFluor
647 Imaging Kit (Life Technologies) according to manufacturer’s instructions.
e2 Developmental Cell 48, 32–48.e1–e5, January 7, 2019

Immunofluorescence StainingTissue sections were embedded in OCT (Tissue Tek) and cut at a thickness of 10 mmwith a cryostat (Leica). Whole-mounted embryo
skins or sections from E15.0 embryos were fixed in 4%PFA and washed with PBS.Whole-mount samples were additionally permea-
bilized for 2 hr in 0.3% Triton X-100 in PBS. Tissues were blocked in PBS-Triton with BSA/NDS for 2 hour at room temperature. Pri-
mary antibody labelling against EDAR (goat, 1:100, R&D), SOX2 (Goat, 1:100, Stemgent), FOXD1 (Goat, 1:100, Santa Cruz), GFP
(chicken, 1:800, Abcam), and CXCR4 (Rat, 1:100, BD Pharmagen) were carried out overnight at 4�C. After PBS washes, samples
were incubated with Rhodamine Red-X-, AlexaFluor 488-, AlexaFluor 555-, or AlexaFluor 647-conjugated donkey anti-goat, rabbit,
chicken or rat secondary antibodies (Jackson Immunoresearch, Invitrogen). Samples were again PBS washed, counterstained with
4’6’-diamidino-2-phenilindole (DAPI) and mounted onto slides with anti-fade mounting medium.
Image Acquisition and ProcessingWholemount immunofluorescence and stained tissue sections were imaged using Leica SP5 DMI confocal and Leica DM5500 wide-
field microscopes, respectively, both equipped with Leica LASAF software. For 3D whole mount imaging, z-stacks of up to 60 planes
with 1 mm vertical intervals were acquired with Leica 40X, 63X or 100X oil-immersion lenses. 3D stack images from confocal micro-
scopy were processed and analyzed with ImageJ/FIJI (NIH) or Imaris 3/4D image visualization and analysis software (Bitplane).
Single-Molecule mRNA Fluorescence In Situ HybridizationSingle-molecule mRNA fluorescence in situ hybridization (FISH) was performed on whole mount skin from E15.0 embryos using
RNAscope (Advanced Cell Diagnostics) according to the manufacturer’s instructions. Briefly, back skins were fixed in 4% PFA, de-
hydrated through a graded methanol (MeOH) series (50%, 70% and 100% MeOH/H2O), and were stored at -20�C overnight in
100% MeOH. The following day, skins were rehydrated and pretreated with hydrogen peroxide and protease III (2.5 HD Reagent
Kit-RED), and hybridized with the Twist2 probe (ACD #489121) overnight at 40 C. The following day, skins were washed, postfixed
in 4% PFA for 15 minutes at room temperature, followed by signal amplification by provided hybridizing horseradish peroxidase-
labeled probes and fast red signal detection, as described in the manufacturer’s kit instructions. Following the RNAscope protocol,
slides were processed for co-immunofluorescence and imaged as described above. The red chromogenic substrate was visualized
as autofluorescence in the red fluorescent channel.
E15.0 Cell Isolation and SortingTo generate single-cell suspensions from E15.0 Sox2GFP dorsal skins, tissues were collected and processed as previously described
(Sennett et al., 2015). Briefly, back skins were harvested by microdissection and were pooled for FACS for bulk RNA-sequencing
while skin from a single embryo was taken for single cell sorting prior to single-cell RNA-sequencing. Skins were then digested in
a dispase (Invitrogen)/ collagenase (0.03%, Worthington) solution with 20 U/ml of DNase (Roche) at 4�C overnight followed the
next day by 30minutes incubation at 37�C. Cells were then filtered through 40mm-pore nylon cell strainers, followed by centrifugation
at 350xg for 10 minutes. Resuspended cell pellets were stained with primary antibodies against EpCAM (BrV605-conjugated rat Ab,
1:100, Biolegend), CXCR4 (PE-conjugated rat Ab, 1:100, Biolegend), ITAG6 (BrV421-conjugated rat Ab, 1:100, Biolegend), PDGFRA
(biotinylated rat Ab, 1:50, Affymetrix). This was followed by secondary labeling with Streptavidin-APC (1:200, Biolegend). Dead cells
were identified by DAPI uptake. Cells were sorted on a FACSAria II fluorescence cytometry sorter (BD Biosciences) for both bulk and
single cell RNA-sequencing. For single cell RNA-sequencing, live fibroblasts, pre-DC, DC1, and DC2 were index sorted into 384-well
hard shell plates (Biorad) pre-loaded with 5 ml of vapor-lock (QIAGEN) containing a 100-200 nl mix of RT primers, dNTPs, and syn-
thetic mRNA spike-ins. After sorting, plates were immediately quick spun and frozen to -80�C.
Real-Time qRT-PCRTotal RNA from the FACS-sorted cells was purified with the Absolutely RNA Nanoprep Kit (Agilent) and quantified with the NanoDrop
spectrophotometer (Thermo Scientific). Reverse transcription was performed with the SuperScript III First-Strand Synthesis System
using oligo(dT) primers (Invitrogen). Real-time qRT-PCR was performed with a LightCycler 480 (Roche) instrument using LightCycler
DNA Master SYBR Green I reagents (Roche). Fold changes between samples were calculated based on the 2-DDCt method and
normalized to Gapdh.
cDNA Library Preparation for Bulk RNA SequencingTotal RNA from the FACS-sorted cells was purified with the Absolutely RNA Nanoprep Kit (Agilent). RNA concentration and quality
weremeasured by the Agilent Bio-analyzer. Samples with RIN (RNA integrity number) scores of 9.6 or higher were further processed.
5 ml of RNA from each sample was used for reverse transcription, followed by amplification using the RNA Ovation RNA-Seq System
V2 (NuGEN). Using the Ovation Ultralow DR Library System (NuGEN), cDNA libraries were generated from 100 ng amplified cDNA
with a unique barcoded adaptor for each sample. Library concentration and quality were quantified by Qbit (Invitrogen) and the Agi-
lent Bioanalyzer. Samples were then sequenced on the Illumina HiSeq 200 platform using a 50-nt single-read setting.
cDNA Library Preparation for Single-Cell RNA SequencingSingle-cell RNA-sequencing was performed using the SORT-seq protocol (Muraro et al., 2016). Briefly, after sorting cells were
lysed at 65�C for 5minutes. RT and second strandmixes were dispensed by the Nanodrop II liquid handling platform for cDNA library
Developmental Cell 48, 32–48.e1–e5, January 7, 2019 e3
preparation (GC Biotech). The aqueous phase was separated from the oil phase after pooling all cells from one plate into one library,
followed by IVT transcription. For each 384 well plate, 384 primers (1 library of 384 cells) was used for mRNA reverse transcription,
conversion to double-stranded cDNA, and in vitro transcription. Each primer consists of a 24 bp polyT stretch, a 4 bp random mo-
lecular barcode (UMI), a cell-specific 8 bp barcode, the 5’ Illumina TruSeq small RNA kit adapter, and a T7 promoter. Single-cell dou-
ble-stranded cDNAs were pooled and in-vitro transcribed for linear amplification following the CEL-Seq 2 protocol. Illumina
sequencing libraries were prepared using TruSeq small RNA primers (Illumina) and sequenced paired-end at a read length of
75 bp using the Illumina NextSeq.
4D Time-Lapse Live ImagingTbx18H2BGFP E14.0 embryonic dorsal skin was harvested by microdissection in ice-cold PBS, sandwiched between a 8 mm Nucle-
pore filter (Whatman) and the bottom of a 35 mm Lumox culture dish (Greiner) such that the epidermal side of the skin was in contact
with the Lumoxmembrane, i.e. the bottom of the dish. The skin-membrane sandwich was stabilized withMatrigel (Corning). Explants
were cultured in DMEM (phenol red free, Invitrogen) containing 10% fetal bovine serum, 1%HEPES, and 1%penicillin-streptomycin.
After overnight culture, 3D Z-stack images of up to 20 planes with 2 mm vertical intervals were acquired at 10 or 25 minute intervals
during a total of 16-20 hours using a Zeiss LSM880 equipped with a 20X Plan Apo 0.8 NA air objective or a Zeiss Axio Observer Z1
Yokogawa spinning disk equipped with a 20x Plan Apo 0.4 NA air objective. During imaging sessions, explants were maintained in a
live-cell chamber at 37�C with 5% CO2 and humidity control.
QUANTIFICATION AND STATISTICAL ANALYSIS
Quantification of DC Clustering State3D reconstructed images for nearest neighbor measurements of pre-DC, DC1, DC1 and interfollicular dermal fibroblasts were gener-
ated in Imaris. Automated segmentation of each cell was then performed by placing a point sphere at the geometric center of each
nucleus from which each point’s discrete coordinates were used to quantify the absolute distances between nuclei. Multiple
hypothesis testing of the data from the average distance between 5 nearest neighbors among cells from pre-DC, DC1, DC2 and
interfollicular fibroblasts were performed using Anova: single factor.
Quantification of Proliferation by EdU-UptakePercent EdU+ among pre-DC, DC1, DC2 and interfollicular dermal cells was manually counted from acquired 3D confocal scans in
ImageJ/FIJI. Sox2GFP+/ITGA6- cells were considered as DC cells whereas GFP-/ITGA6- cells were counted as interfollicular dermal
cells. For each injection time point skins from 2 embryos were analyzed, fromwhich 3 DCs/regions of eachmorphological stage were
quantified (i.e. 3 follicles x 4 stages per embryo per time point). Statistical analysis was performed using one-tailed Student’s t-test.
Quantification of Proliferation by Cell Division during Time-Lapse Live ImagingTo measure proliferation with time-lapse live imaging, 4D images acquired from explants were processed and analyzed with Imaris.
15,625um2 areas (350x350pixels) containing pre-DC or interfollicular dermis were obtained by cropping from larger 20X fields. Areas
containing pre-DC were identified by locating DCs at the final time point and back tracing in time through the clustering process over
a 6-hour period whereas the areas containing interfollicular dermis were defined as not containing any DC over the entire imaging
session. Total cell numbers and mitotic events were quantified manually. Hypothesis testing was performed using Student’s t-test.
Quantification of Number of DCs per Field of ViewSOX2+ pre-DC were quantified in whole mount stained back skins of b-cateninfl/fl wild type and K14-Cre;b-cateninfl/fl conditional
knockout, as well as in Fgf20Cre-GFP/+ heterozygous and Fgf20Cre-GFP/LacZ knockout. For each genotype 2 embryos were analyzed.
Pre-DC were counted in 4 field of views of 10x widefield live scans (601,267 mm2) in each embryonic skin. Statistical analysis was
performed using one-tailed Student’s t-test.
Bulk RNA Sequencing Data AnalysisAll raw RNA sequencing readsweremapped to themouse genome (mm10) with TopHat v2.0.3 (Trapnell et al., 2009) coupled with the
Bowtie2 (Langmead and Salzberg, 2012) and aligned with default parameters. Transcriptomes were assembled and fragments per
kilobase per million reads (FPKM) for each gene were computed with Cufflinks v2.1.1 (Trapnell et al., 2010) with default parameters.
Differentially expressed genes (DEGs) were identified using Cuffdiff (with default parameters except for the library normalization
method was upper quartile normalization, where FPKMs were scaled via the ratio of the 75 quartile fragment counts to the average
75 quartile value across all libraries) and ANOVA with the Benjamini-Hochberg correction for multiple hypothesis testing with signif-
icance cut off FDR <0.05. The Fisher exact test was used for enrichment analysis with the same multiple hypotheses testing correc-
tion procedure and cut off. Principle component analyses (PCA) were performed for samples using BioJupies (Torre et al., 2018).
Population signature genes were defined by DEGs with a FPKMR1, and a fold enrichmentR2 compared to all other populations.
Signature genes of multiple population overlaps featured in the Venn diagram analysis were defined similarly as individual-population
signature genes by which each overlapping population must individually meet minimal expression level and fold-enrichment
constraints.
e4 Developmental Cell 48, 32–48.e1–e5, January 7, 2019

Selection of genes used in developmental trajectory analyses were obtained by excluding genes with too low expression across all
stages (FPKMany population < 1) and genes with similar expression levels across each developmental stage (FPKMmax < 2*FPKMmin).
The remaining genes were log2 transformed and z-score standardized to obtain 0-mean and unit standard deviation. Gene clustering
was performed with Morpheus (Broad Institute: https://software.broadinstitute.org/morpheus) using Spearman rank correlation with
average linkage. Gene ontology and KEGG pathway enrichment analyses were carried out using Enrichr (Chen et al., 2013). Gene Set
Enrichment Analysis (Subramanian et al., 2005) was performed using GenePattern (Reich et al., 2006). Curated lists were used to
identify transcription factors (Lambert et al., 2018) and signaling molecules (Ramilowski et al., 2015).
Single-Cell RNA Sequencing Data AnalysisAnalysis of single-cell RNA-seq data was performed independently in an R. Environment (R 3.5.1, RStudio 1.1.453) and a Python
environment (Python 3.6.5, Jupyter 1.0.0). Cells with more than 6000 transcripts/cell were included in the analysis. Additionally, mito-
chondrial genes, ERCC spike-ins, and non-expressed genes were excluded from downstream analysis. The remaining 1383 cells
and 18483 genes were analyzed independently using the RaceID3 package (R-based) (Gr€un et al., 2016; Herman et al., 2018) or
the Scanpy package (Python-based) (Wolf et al., 2018).
For RaceID3 analyses, normalization was performed by simple rescaling, which is done by dividing the transcript counts per cell by
the total number of transcripts, and multiplying this by the minimum total number of transcripts across cells. Principal components
with overrepresentation of genes related to GO annotations ‘‘cell proliferation’’ and ‘‘cell cycle’’ were removed using the CCcorrect
function. Evaluation of transcriptome similarities by 1-Pearson’s correlation coefficient followed by k-medoids clustering was used to
cluster cells and t-distributed stochastic neighbor embedding (tSNE) (Van Der Maaten and Hinton, 2008) was used for visualization.
Using the Scanpy module, highly variable genes were extracted, data was log-normalized, and principal components were
computed. Principal components showing significant overrepresentation of genes linked to the GO annotations ‘‘cell proliferation’’
and ‘‘cell cycle’’ in the top or bottom 1% quantile of loadings were removed in a fashion similar to the CCcorrect function in RaceID3.
Cells were clustered using the Louvain algorithm (Blondel et al., 2008), and visualized using UMAP (McInnes and Healy, 2018).
Pseudotime analysis was performed on a subset of cells: clusters 4, 5, 6, 7, and 8 in RaceID3 analysis and clusters 1, 2, 3, and 5 in
Scanpy analysis which comprise dermal condensate cells and fibroblast precursors of the latter. Cell order along pseudotime was
inferred using StemID2 (Gr€un et al., 2016; Herman et al., 2018) or diffusion pseudotime (Haghverdi et al., 2016). Curated lists were
used to identify transcription factors (Lambert et al., 2018) and signaling molecules (Ramilowski et al., 2015).
For easier reproducibility, the complete code is available online (https://github.com/rendllab and https://github.com/kasperlab).
Cumulative percent was calculated as the running sum of FPKM values divided by the total FPKM sum. Cumulative percent plots
for early, mid, and late expressed genes were generated by calculating the mean cumulative percent values for each position (cell) in
the SOM order.
DATA AND SOFTWARE AVAILABILITY
SoftwareRaceID3 and StemID2 were run on RStudio version 1.1.453. Scanpy was run in Python version 3.6.5 in a Jupyter Notebook version
1.0.0. The scripts run are available at https://github.com/rendllab and https://github.com/kasperlab.
Data ResourcesThe accession number for the sequencing data reported in this paper is NCBI GEO:GSE122026 (bulk and single-cell RNA-
sequencing).
Developmental Cell 48, 32–48.e1–e5, January 7, 2019 e5