Embed Size (px)
Citation preview
© Dale R. Geiger 2011 1
Describe Common Pitfalls And Ways To Avoid Them In ABC
Principles of Cost Analysis and Management
© Dale R. Geiger 2011 2
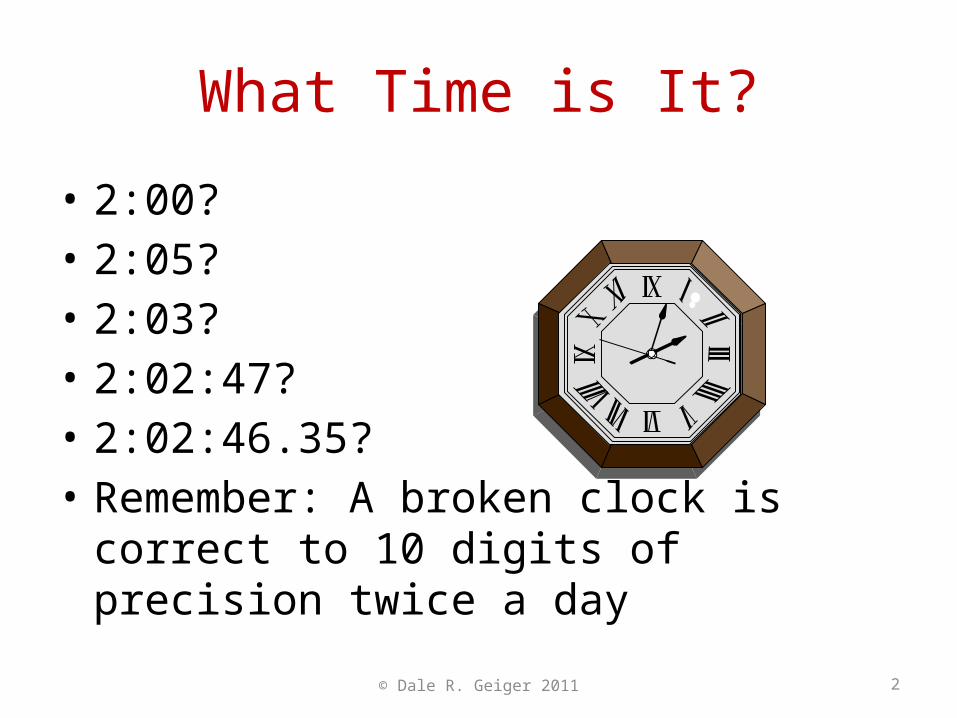
What Time is It?
• 2:00?• 2:05?• 2:03?• 2:02:47?• 2:02:46.35?• Remember: A broken clock is correct to 10
digits of precision twice a day
© Dale R. Geiger 2011 3
Terminal Learning Objective
• Task: Describe Common Pitfalls And Ways To Avoid Them In ABC
• Condition: You are a cost advisor technician with access to the GFEBS training database, PCAM course handouts, readings, and spreadsheet tools and awareness of Operational Environment (OE)/Contemporary Operational Environment (COE) variables and actors.
• Standard: with at least 80% accuracy:• Describe limits to precision• Describe affordability, credibility and relevance constraints
© Dale R. Geiger 2011 4
Choosing Level of Precision
• Goal:• Managerially useful information for cost warrior
decision making• Question:
• How much precision do cost warriors need?
managerially useful information cost object=
© Dale R. Geiger 2011 5
Things to Consider
• User needs• Cost environment• Cost style• Organization
• Measurement issues• Difficulty and cost• Limits to precision • Impact on behavior
© Dale R. Geiger 2011 6
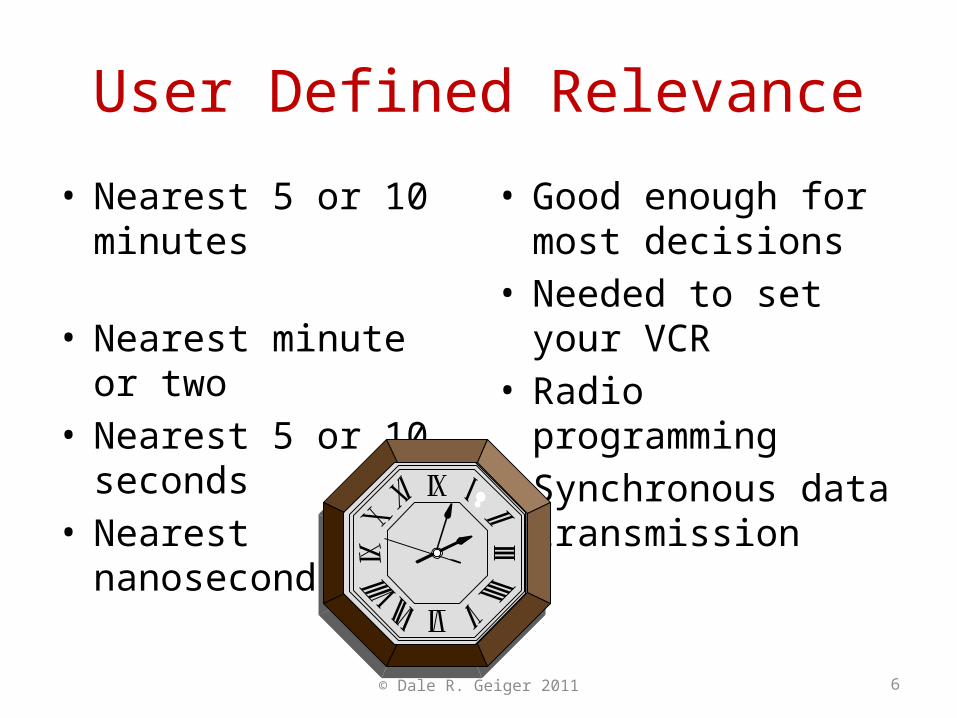
User Defined Relevance
• Nearest 5 or 10 minutes
• Nearest minute or two• Nearest 5 or 10 seconds• Nearest nanosecond
• Good enough for most decisions
• Needed to set your VCR• Radio programming• Synchronous data
transmission
© Dale R. Geiger 2011 7
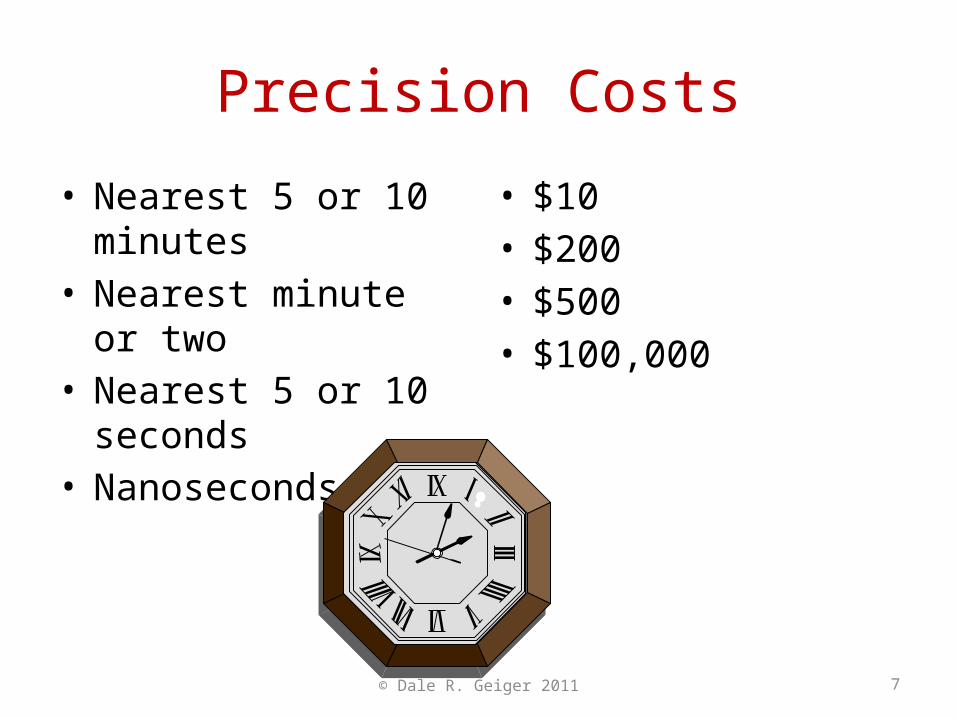
Precision Costs
• Nearest 5 or 10 minutes• Nearest minute or two• Nearest 5 or 10 seconds• Nanoseconds
• $10• $200• $500• $100,000
© Dale R. Geiger 2011 8
Weakest Link Theory
• Cost can only be as precise as least precise component• Consider adding very precise numbers to very
imprecise numbers • How precise can the total be?
© Dale R. Geiger 2011 9
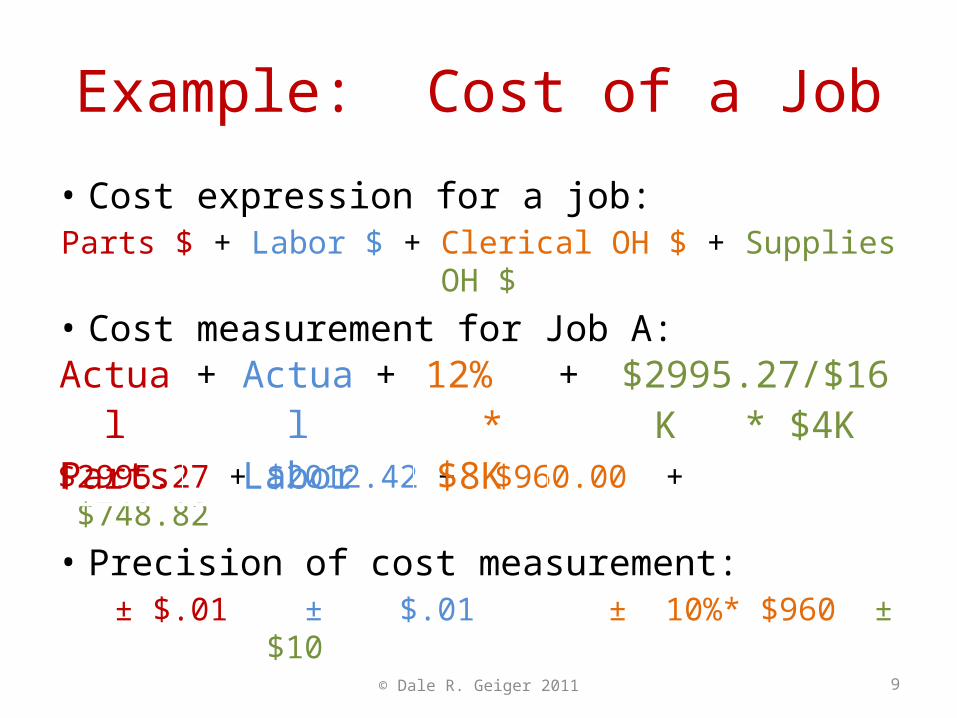
Example: Cost of a Job
• Cost expression for a job:Parts $ + Labor $ + Clerical OH $ + Supplies OH $
• Cost measurement for Job A:
$2995.27 + $2012.42 + $960.00 + $748.82• Precision of cost measurement: ± $.01 ± $.01 ± 10%* $960 ± $10
Actual Parts
+ Actual Labor
+ 12% * $8K
+ $2995.27/$16K * $4K
10
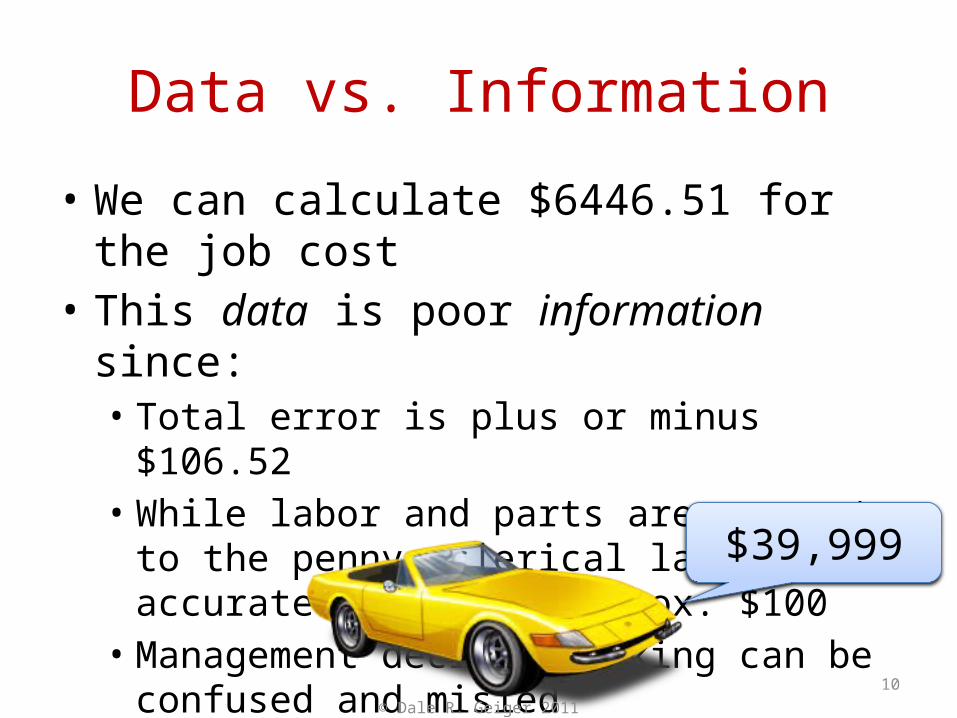
Data vs. Information
• We can calculate $6446.51 for the job cost• This data is poor information since:
• Total error is plus or minus $106.52 • While labor and parts are accurate to the penny,
clerical labor is accurate only to ± approx. $100• Management decision making can be confused
and misled$39,999
© Dale R. Geiger 2011
© Dale R. Geiger 2011 11
Dining Hall Case A
• Management is concerned that lunches are losing money and wants to determine profit
• As part of the study non-food expenditures of $693K must be distributed to cost objects: • Breakfast• Lunch • Dinner
• This should determine whether the Hall suffers from “Free Lunch Syndrome”
© Dale R. Geiger 2011 12
Data for Dining Hall Case
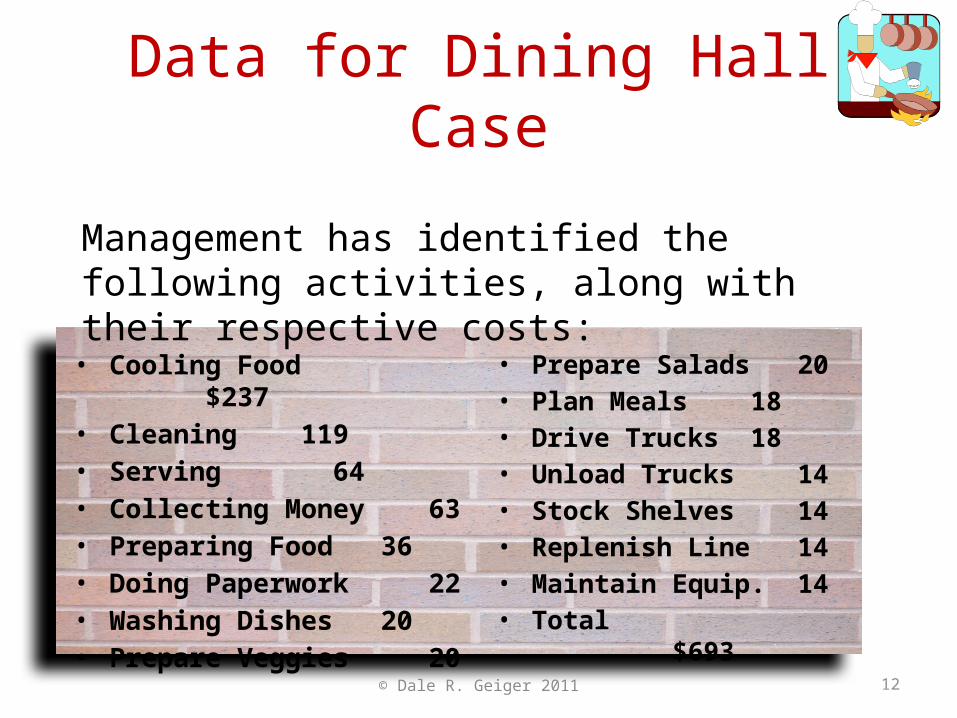
• Cooling Food $237• Cleaning 119• Serving 64• Collecting Money 63• Preparing Food 36• Doing Paperwork 22• Washing Dishes 20• Prepare Veggies 20
• Prepare Salads 20• Plan Meals 18• Drive Trucks 18• Unload Trucks 14• Stock Shelves 14• Replenish Line 14• Maintain Equip. 14• Total $693
Management has identified the following activities, along with their respective costs:
© Dale R. Geiger 2011 13
Dining Hall Case
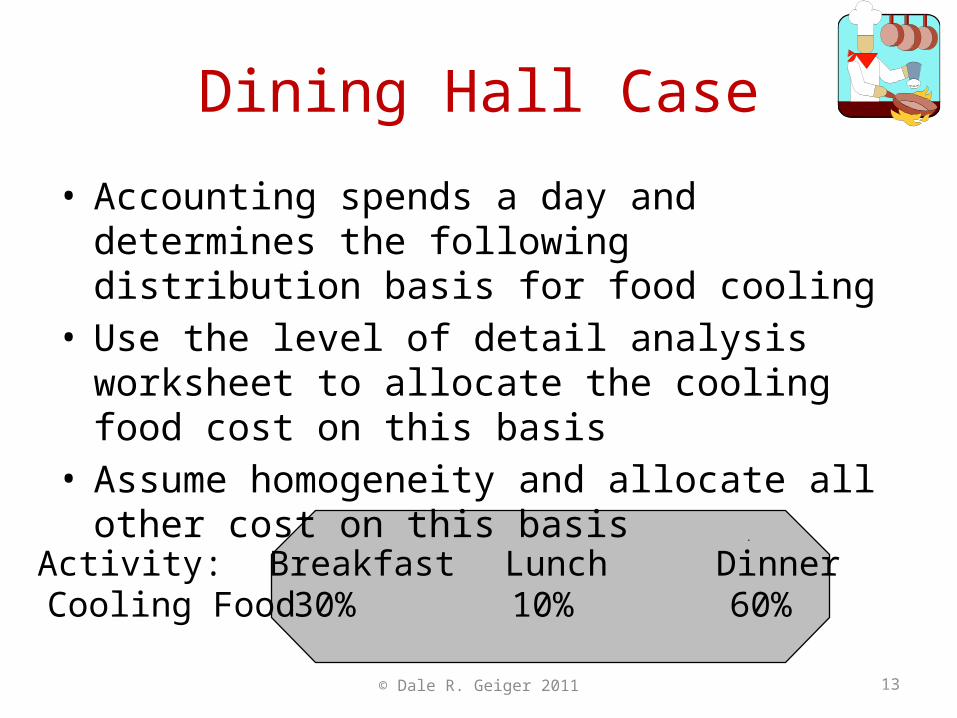
• Accounting spends a day and determines the following distribution basis for food cooling
• Use the level of detail analysis worksheet to allocate the cooling food cost on this basis
• Assume homogeneity and allocate all other cost on this basis
Activity: Breakfast Lunch DinnerCooling Food 30% 10% 60%
14
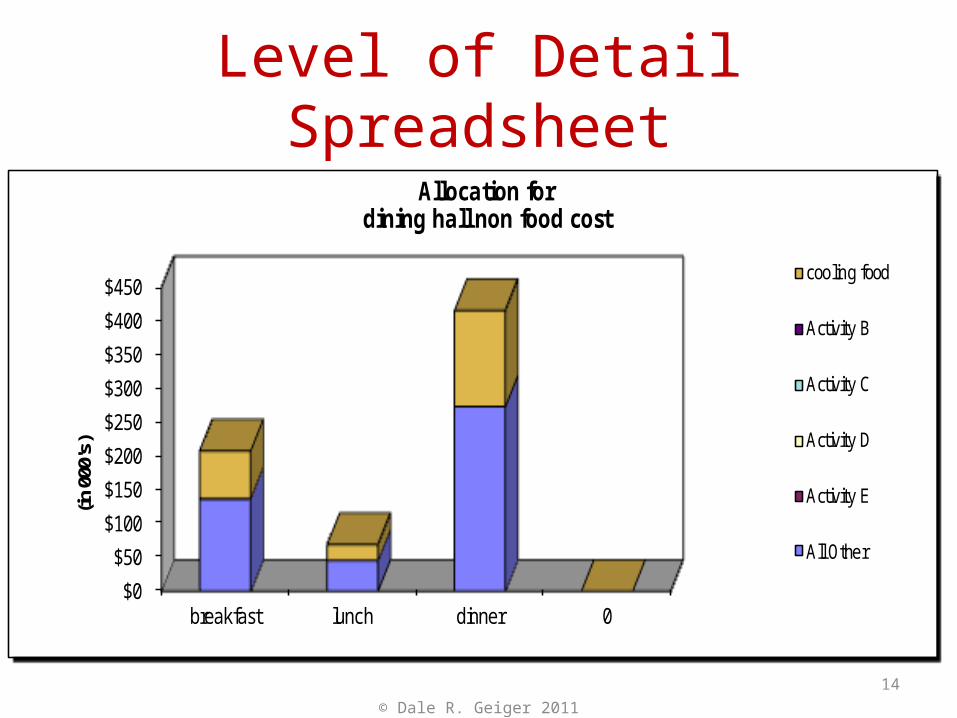
Level of Detail Spreadsheet
$0
$50
$100
$150
$200
$250
$300
$350
$400
$450
breakfast lunch dinner 0
(in 0
00's
)
dining hall non food cost
cooling food
Activity B
Activity C
Activity D
Activity E
All Other
Allocation for
208
69
416
© Dale R. Geiger 2011
© Dale R. Geiger 2011 15
Questions to Consider
• Is this a good allocation method?• Which other activities, if any, should be
analyzed?• What cross subsidizations and incentives
might be created?• Does this give the information management
needs?
© Dale R. Geiger 2011 16
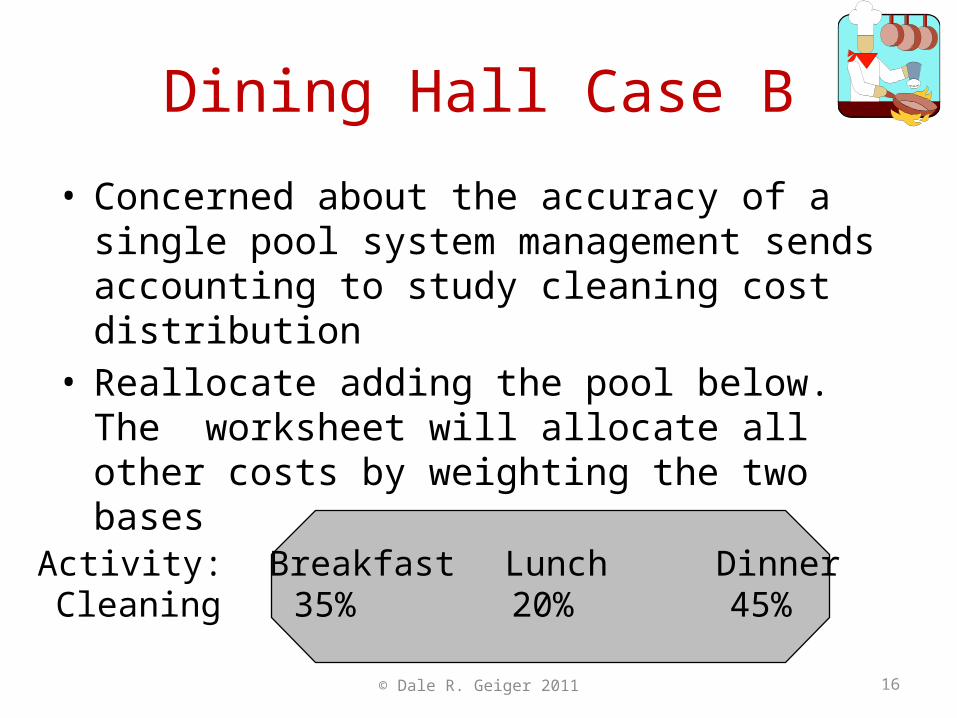
Dining Hall Case B
• Concerned about the accuracy of a single pool system management sends accounting to study cleaning cost distribution
• Reallocate adding the pool below. The worksheet will allocate all other costs by weighting the two bases
Activity: Breakfast Lunch DinnerCleaning 35% 20% 45%
© Dale R. Geiger 2011 17
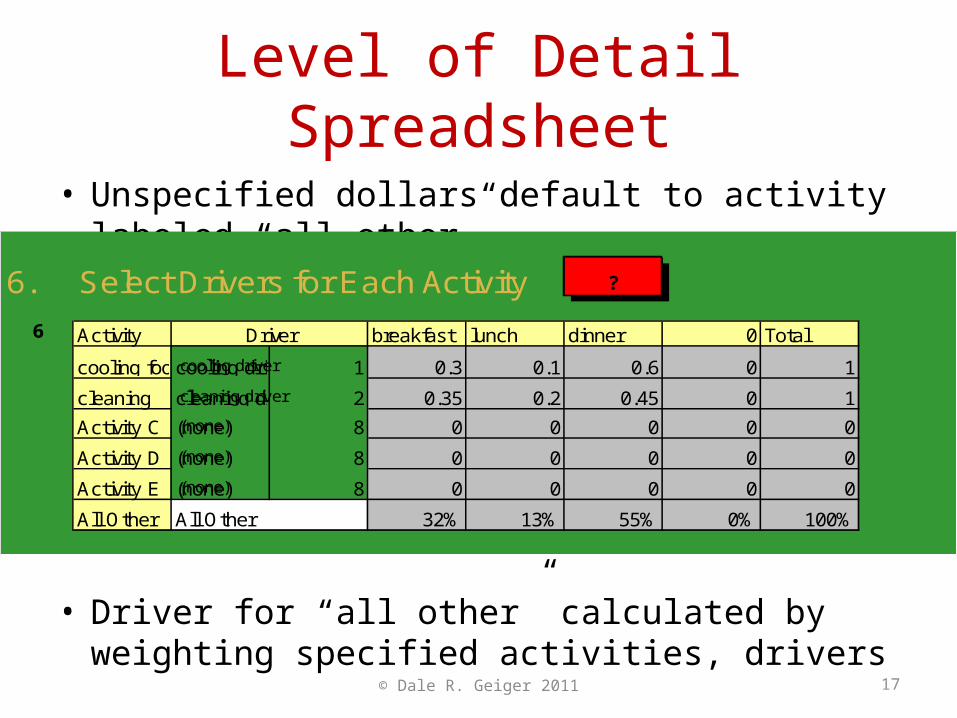
Level of Detail Spreadsheet
• Unspecified dollars default to activity labeled “all other”
• Driver for “all other” calculated by weighting specified activities, drivers
6. Select Drivers for Each Activity ?
Activity breakfast lunch dinner 0 Total
cooling foodcooling driver 1 0.3 0.1 0.6 0 1
cleaning cleaning driver 2 0.35 0.2 0.45 0 1
Activity C (none) 8 0 0 0 0 0
Activity D (none) 8 0 0 0 0 0
Activity E (none) 8 0 0 0 0 0
All Other All Other 32% 13% 55% 0% 100%
Driver
(none)
(none)
(none)
cooling driver
cleaning driver
6
18
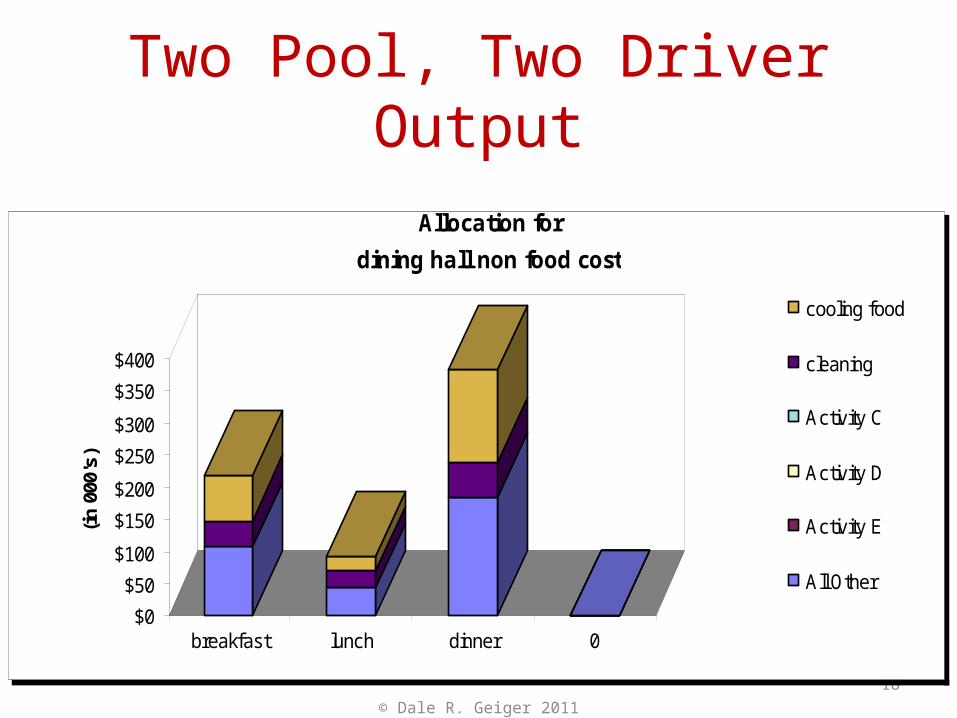
Two Pool, Two Driver Output
$0
$50
$100
$150
$200
$250
$300
$350
$400
(in
000
's)
breakfast lunch dinner 0
dining hall non food cost
cooling food
cleaning
Activity C
Activity D
Activity E
All Other
Allocation for
219
92
381
© Dale R. Geiger 2011
© Dale R. Geiger 2011 19
Questions for Case B
• Is this a good allocation method?• Which other activities, if any, should be
analyzed?• What cross subsidizations and incentives
might be created?• Does this give management the information it
needs?
© Dale R. Geiger 2011 20
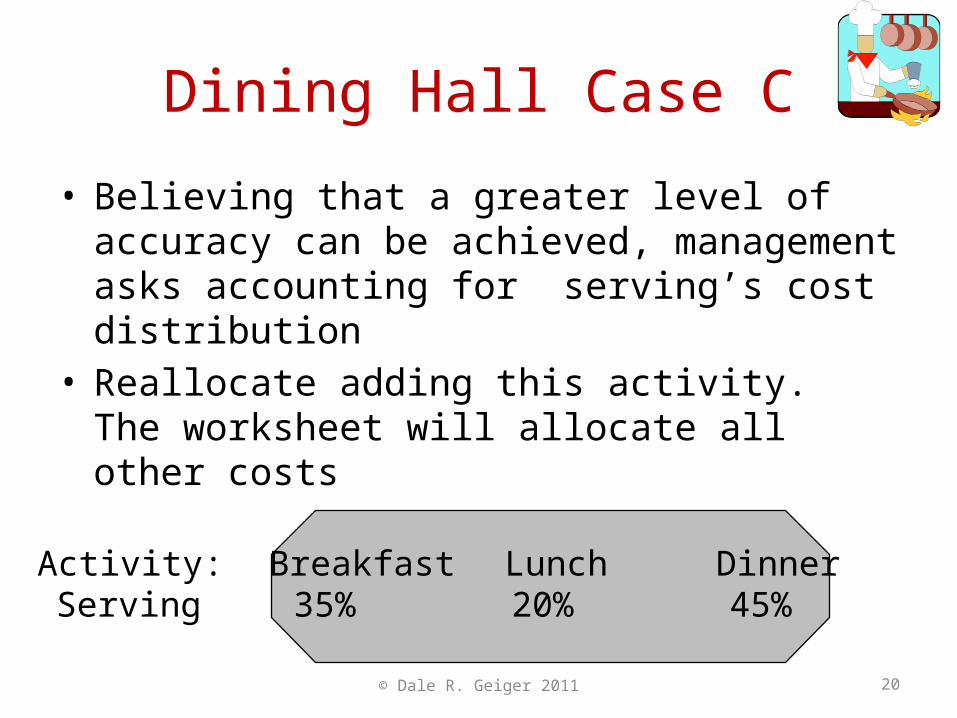
Dining Hall Case C
• Believing that a greater level of accuracy can be achieved, management asks accounting for serving’s cost distribution
• Reallocate adding this activity. The worksheet will allocate all other costs
Activity: Breakfast Lunch DinnerServing 35% 20% 45%
© Dale R. Geiger 2011 21
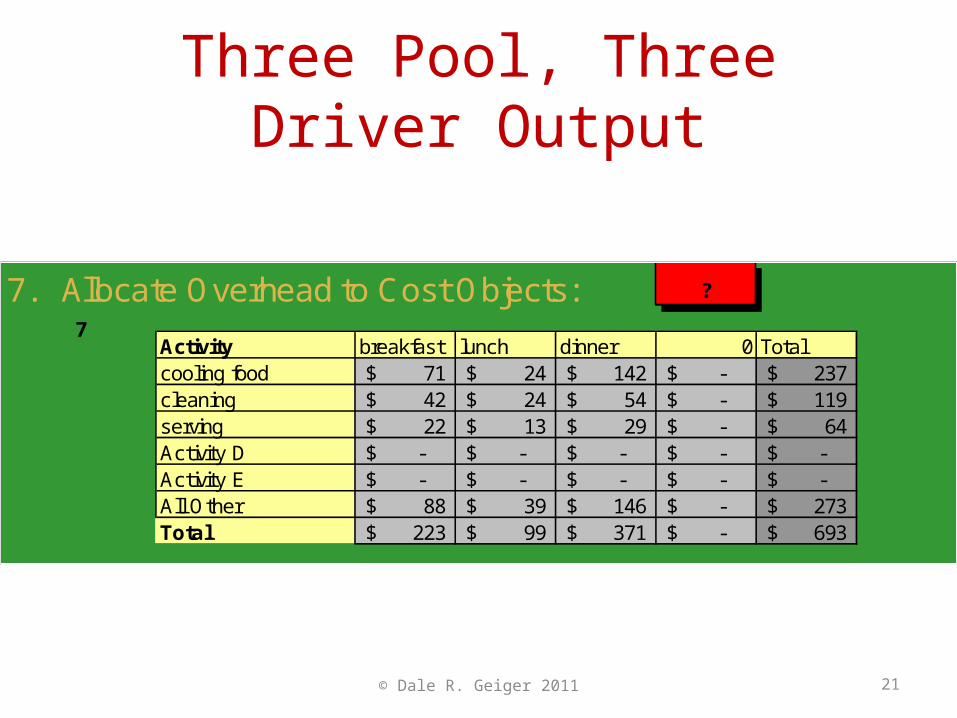
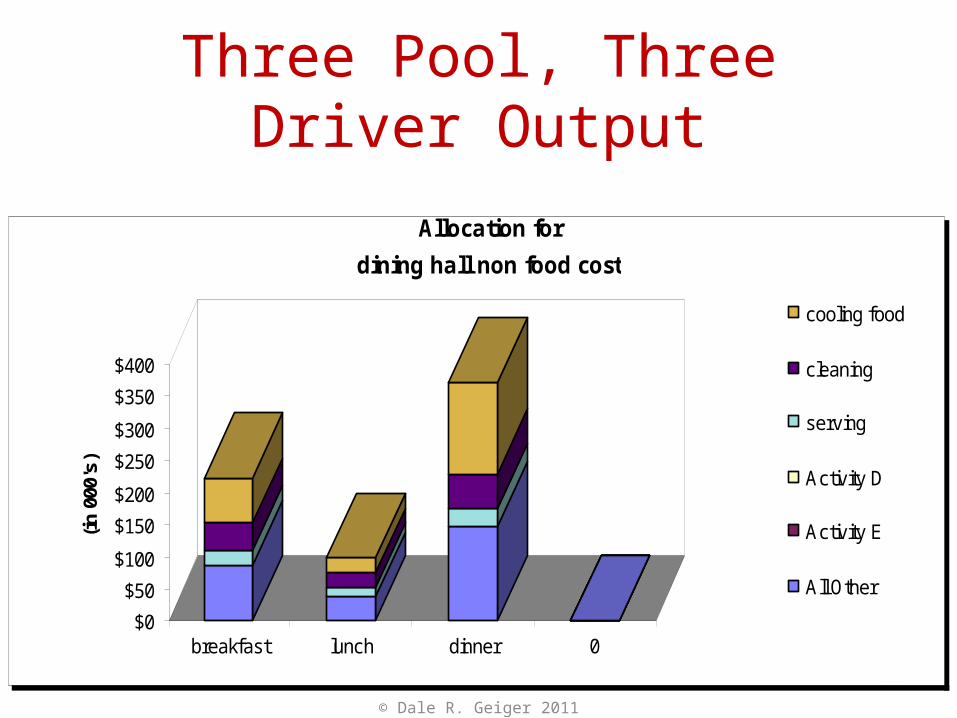
Three Pool, Three Driver Output
7. Allocate Overhead to Cost Objects: ?
Activity breakfast lunch dinner 0 Totalcooling food 71$ 24$ 142$ -$ 237$ cleaning 42$ 24$ 54$ -$ 119$ serving 22$ 13$ 29$ -$ 64$ Activity D -$ -$ -$ -$ -$ Activity E -$ -$ -$ -$ -$ All Other 88$ 39$ 146$ -$ 273$ Total 223$ 99$ 371$ -$ 693$
7
22
Three Pool, Three Driver Output
$0
$50
$100
$150
$200
$250
$300
$350
$400
(in
000
's)
breakfast lunch dinner 0
dining hall non food cost
cooling food
cleaning
serving
Activity D
Activity E
All Other
Allocation for
223
99
371
© Dale R. Geiger 2011
© Dale R. Geiger 2011 23
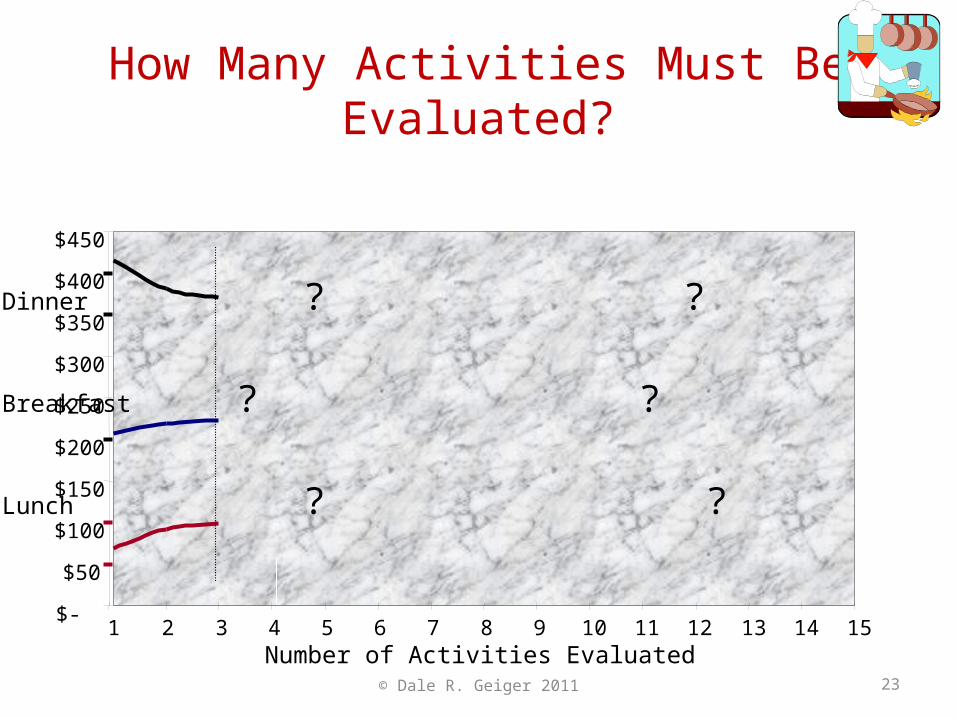
How Many Activities Must Be Evaluated?
$-
$50
$100
$150
$200
$250
$300
$350
$400
$450
1 2 3 4 5 6 7 8 9 10 11 12 13 14 15Number of Activities Evaluated
Dinner ? ? ?
Breakfast ? ? ?
Lunch ? ? ?
© Dale R. Geiger 2011 24
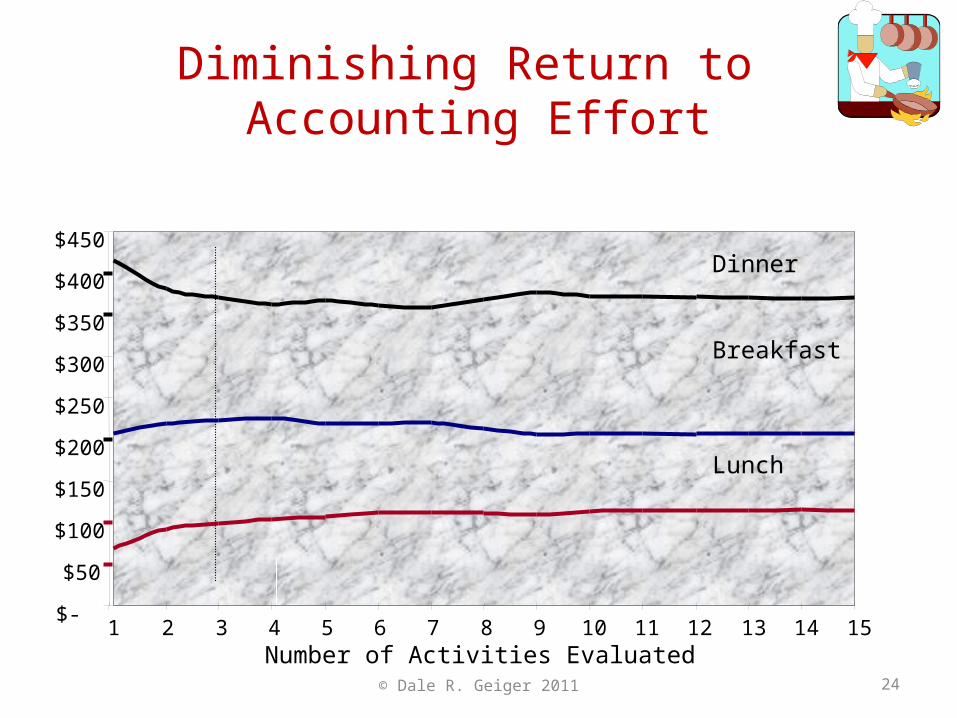
Diminishing Return to Accounting Effort
$-
$50
$100
$150
$200
$250
$300
$350
$400
$450
1 2 3 4 5 6 7 8 9 10 11 12 13 14 15Number of Activities Evaluated
Dinner
Breakfast
Lunch
© Dale R. Geiger 2011 25
Summary on Precision
• Engineering tells us that: • Number of significant digits can be no greater
than the least accurate component• Common sense tell us that:
• No more than two digits make any real difference in management decision making
• Lesson: Don’t spend managerial cost system resources on false precision
© Dale R. Geiger 2011 26
Check on Learning
• How does the “Weakest Link” theory affect the level of precision possible in managerial costing?
• What does “false precision” mean?
© Dale R. Geiger 2011 27
Cost of Detail
• Information is Not Free:• Measuring• Accumulating• Storing• Editing• Manipulating• Reporting• Explaining
© Dale R. Geiger 2011 28
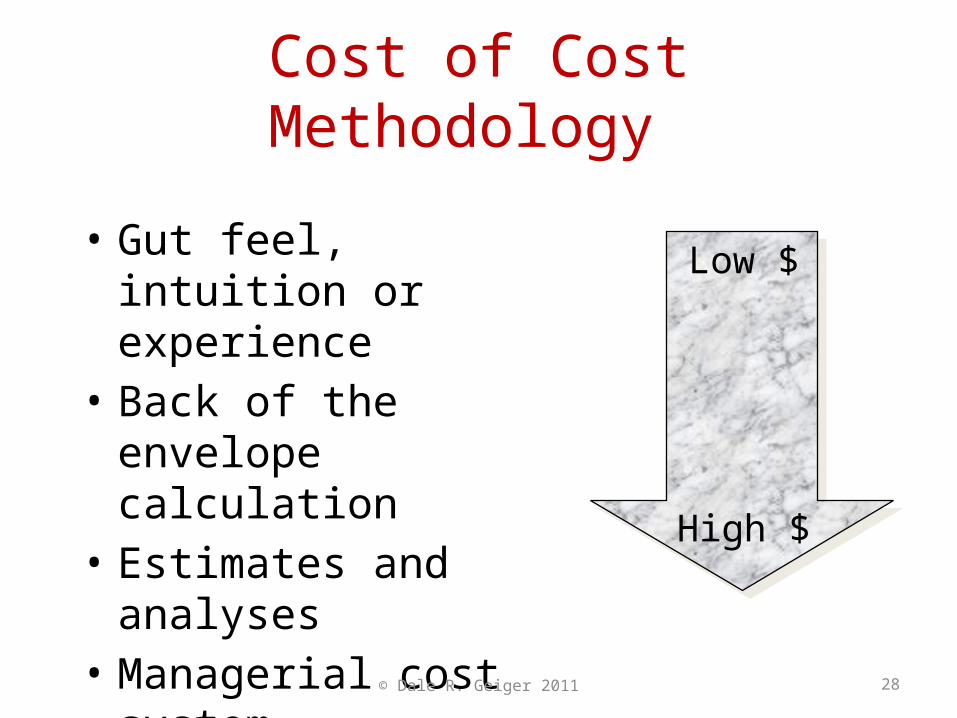
Cost of Cost Methodology
• Gut feel, intuition or experience
• Back of the envelope calculation
• Estimates and analyses• Managerial cost system
Low $
High $
© Dale R. Geiger 2011 29
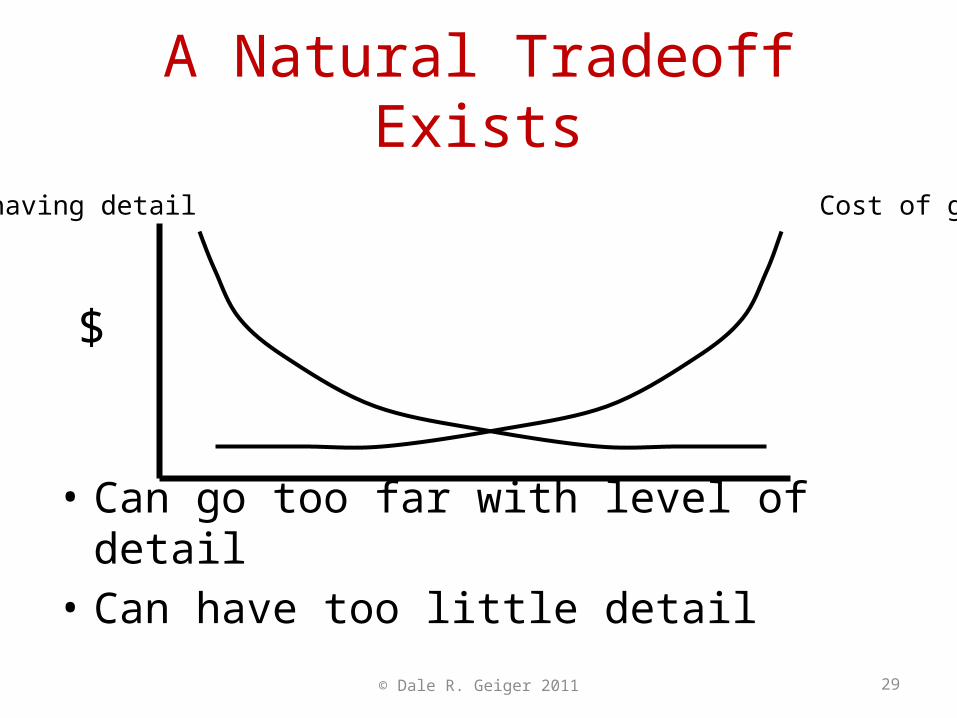
A Natural Tradeoff Exists
• Can go too far with level of detail• Can have too little detail
$
Cost of not having detail Cost of getting detail
© Dale R. Geiger 2011 30
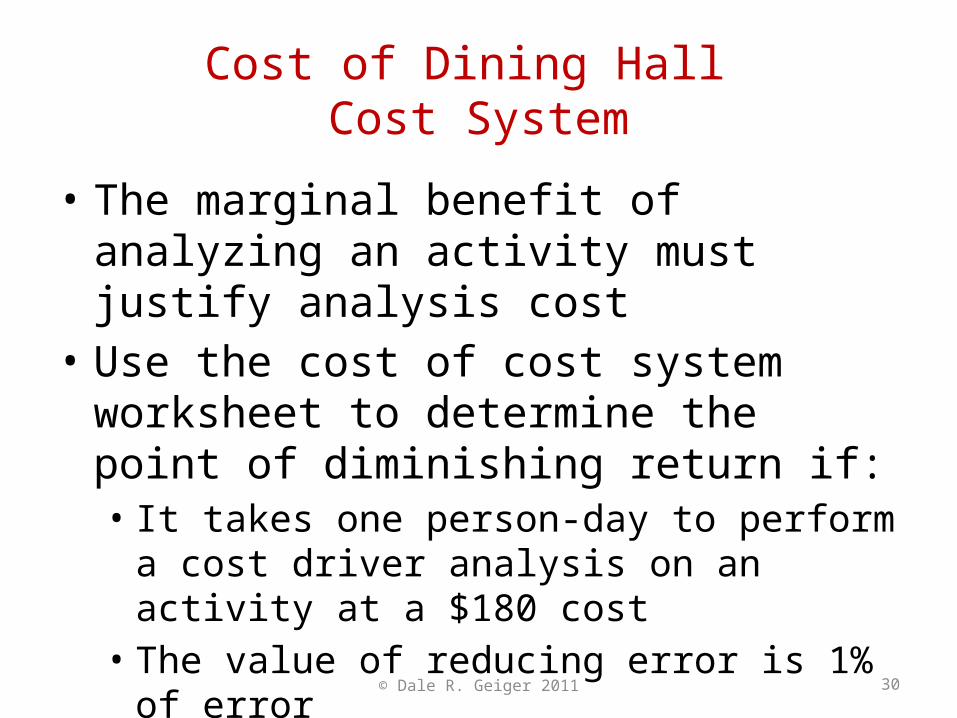
Cost of Dining Hall Cost System
• The marginal benefit of analyzing an activity must justify analysis cost
• Use the cost of cost system worksheet to determine the point of diminishing return if:• It takes one person-day to perform a cost driver
analysis on an activity at a $180 cost• The value of reducing error is 1% of error
31
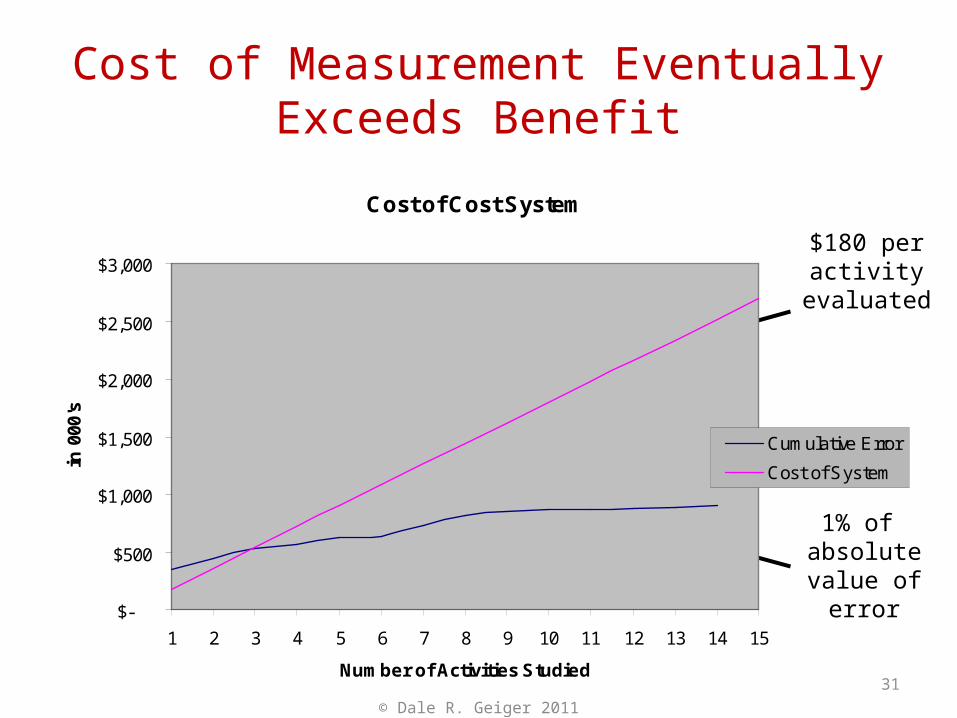
Cost of Measurement Eventually Exceeds Benefit
Cost of Cost System
$-
$500
$1,000
$1,500
$2,000
$2,500
$3,000
1 2 3 4 5 6 7 8 9 10 11 12 13 14 15
Number of Activities Studied
in 0
00's
Cumulative Error
Cost of System
1% of absolutevalue of
error
$180 peractivity
evaluated
© Dale R. Geiger 2011
© Dale R. Geiger 2011 32
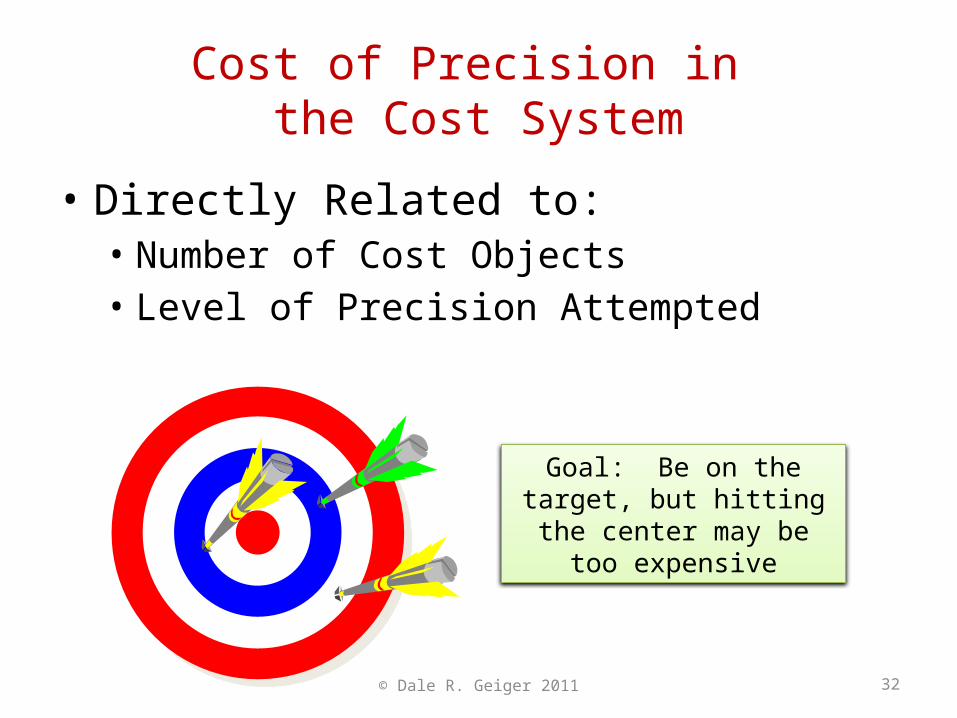
Cost of Precision in the Cost System
• Directly Related to:• Number of Cost Objects• Level of Precision Attempted
Goal: Be on the target, but hitting the center may be too
expensive
© Dale R. Geiger 2011 33
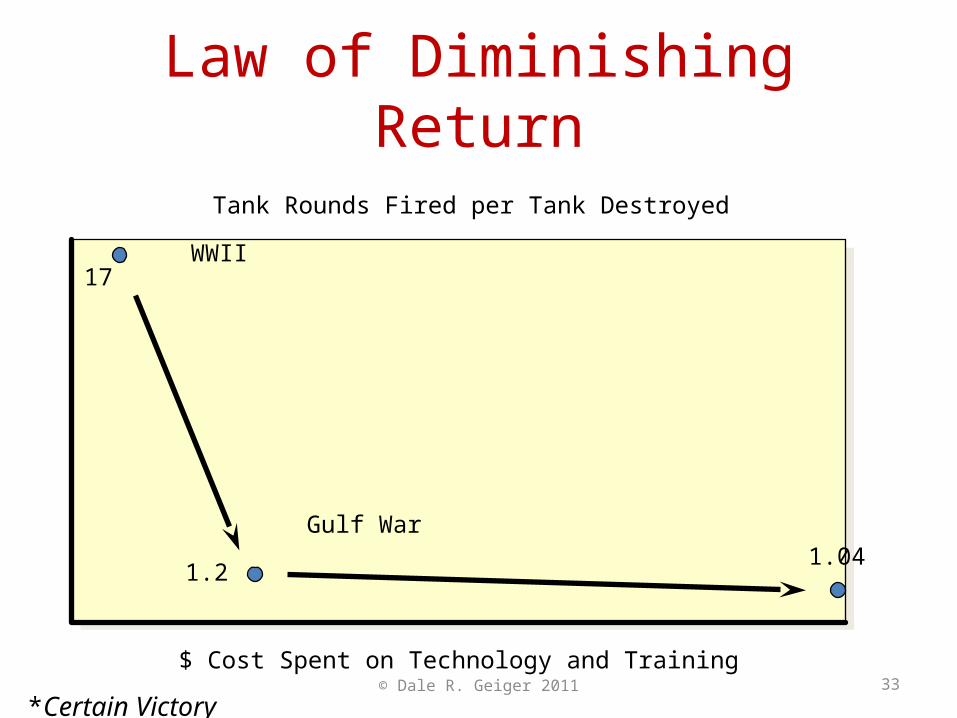
Law of Diminishing Return
17WWII
1.2
Gulf War
Tank Rounds Fired per Tank Destroyed
$ Cost Spent on Technology and Training
1.04
*Certain Victory
© Dale R. Geiger 2011 34
Important Considerations
• Willie Sutton Law of Managerial Costing• Asked why he robbed banks he said:• “Because that’s where the money is”
• Build managerial cost system structure around the big ticket items:• “Because that’s where the money is”
© Dale R. Geiger 2011 35
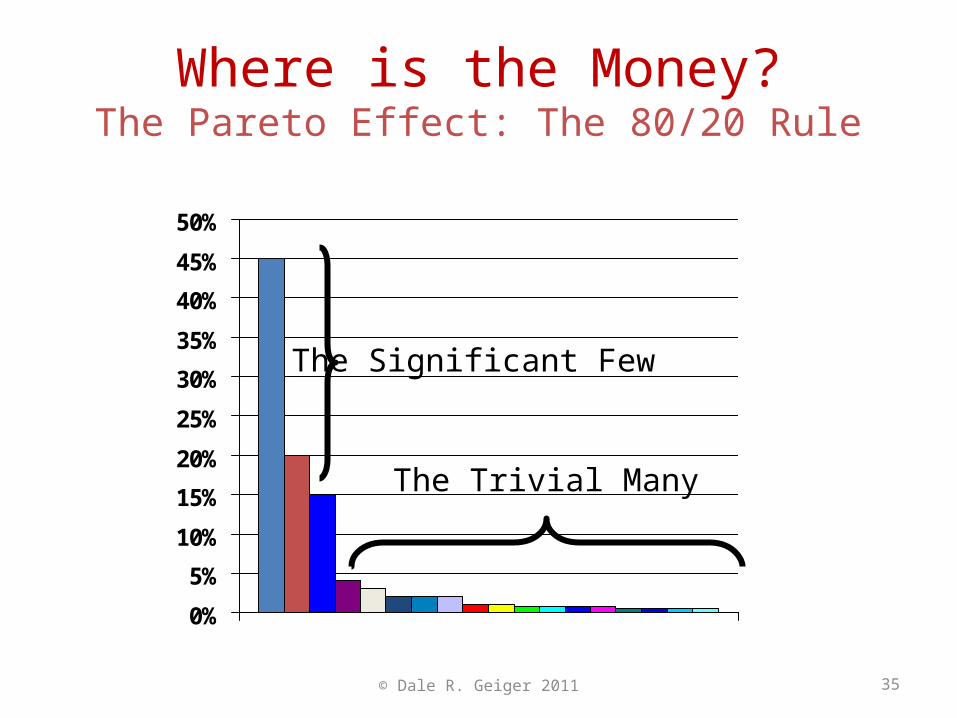
Where is the Money?The Pareto Effect: The 80/20 Rule
0%
5%
10%
15%
20%
25%
30%
35%
40%
45%
50%
The Significant Few
The Trivial Many
36
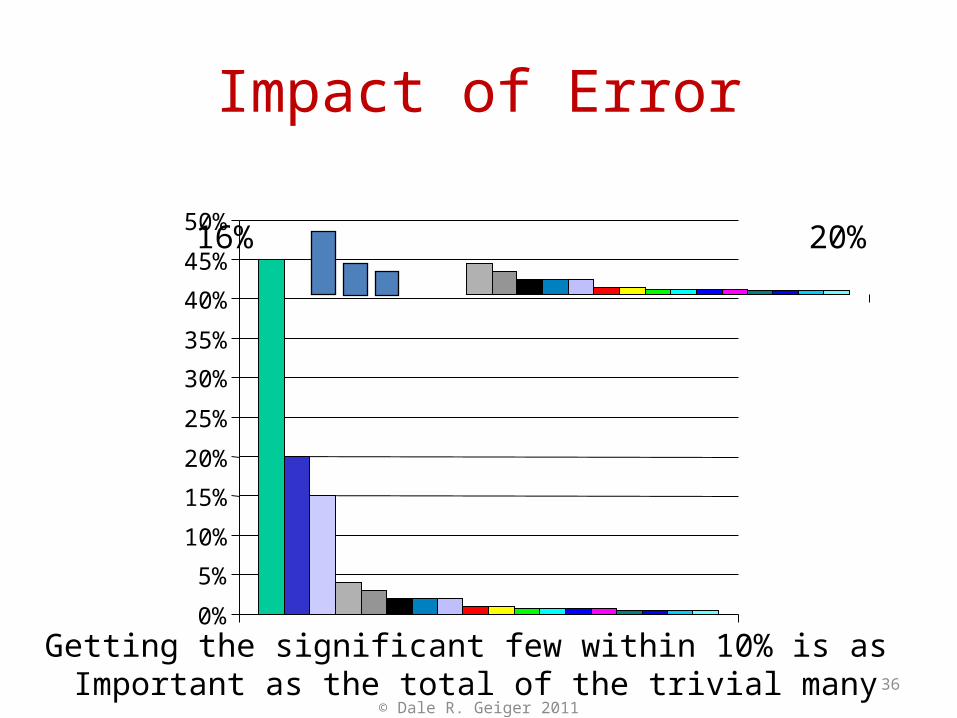
Impact of Error
Getting the significant few within 10% is as Important as the total of the trivial many
0%
5%
10%
15%
20%
25%
30%
35%
40%
45%
50% 16% 20%
© Dale R. Geiger 2011
© Dale R. Geiger 2011 37
Best Value in Measurement
• Measurement error in the significant few has the biggest impact
• Measurement error in the trivial many makes little difference• A diminishing return to effort
• Better strategy: Spend system resources to improve accuracy on significant few!
© Dale R. Geiger 2011 38
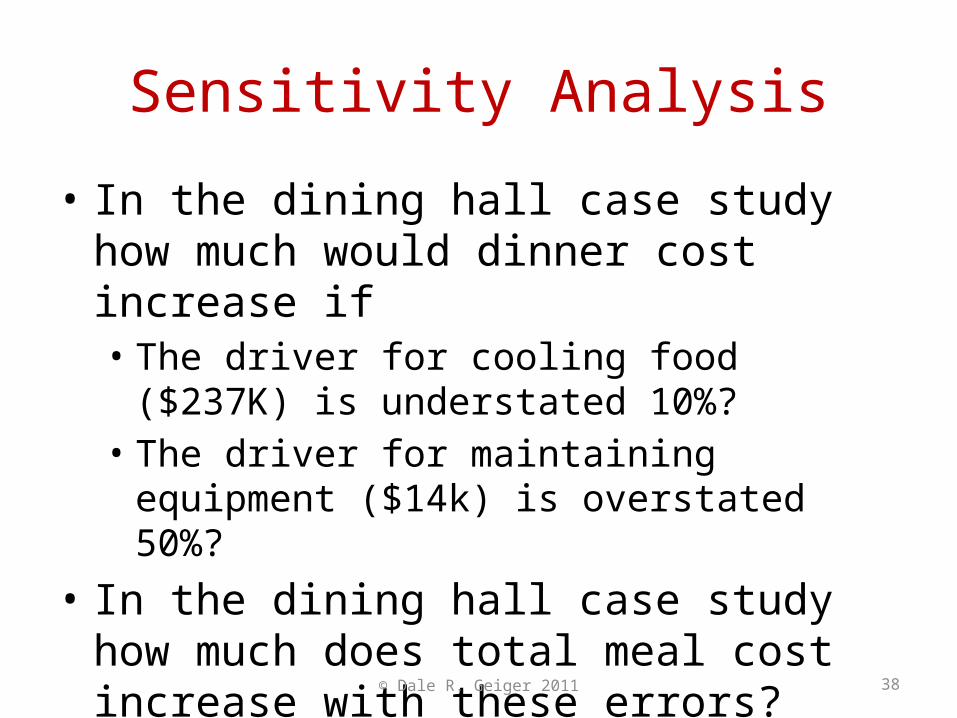
Sensitivity Analysis
• In the dining hall case study how much would dinner cost increase if• The driver for cooling food ($237K) is understated
10%? • The driver for maintaining equipment ($14k) is
overstated 50%?• In the dining hall case study how much does
total meal cost increase with these errors?
© Dale R. Geiger 2011 39
Check on Learning
• What are the costs of not enough detail in cost information?
• What are the costs of more detailed cost information?
• What is the Willie Sutton Law?
© Dale R. Geiger 2011 40
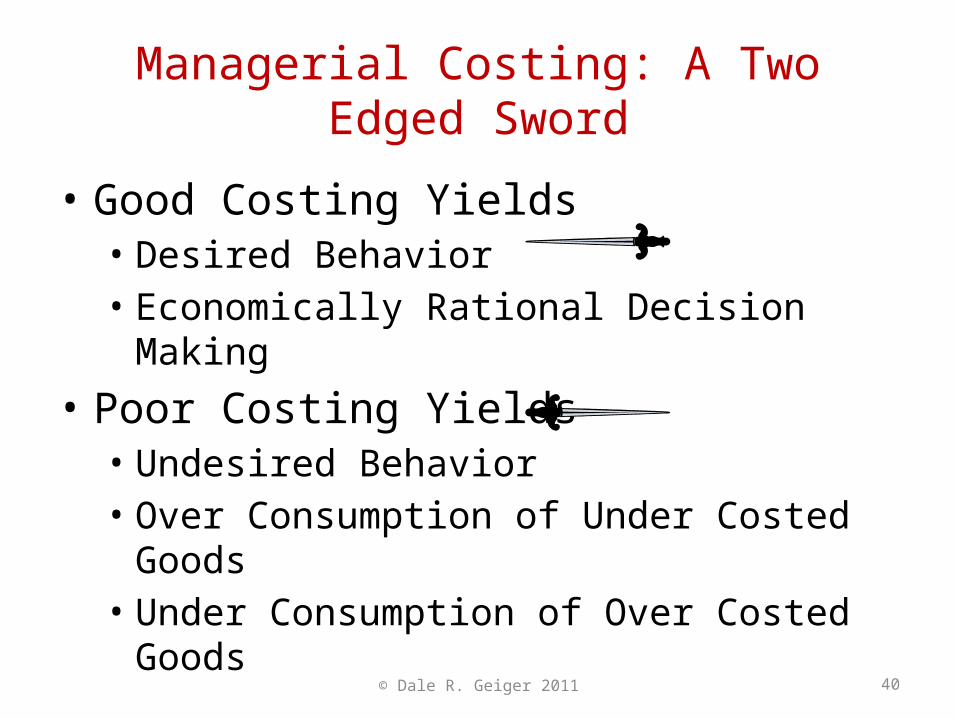
Managerial Costing: A Two Edged Sword
• Good Costing Yields • Desired Behavior• Economically Rational Decision Making
• Poor Costing Yields• Undesired Behavior• Over Consumption of Under Costed Goods• Under Consumption of Over Costed Goods
© Dale R. Geiger 2011 41
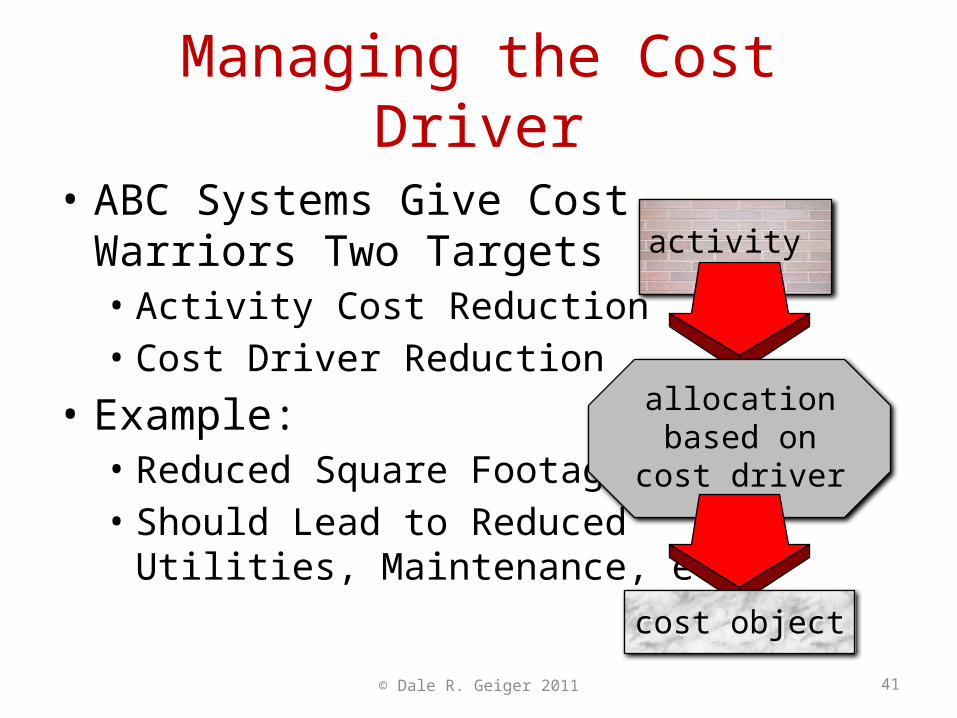
Managing the Cost Driver
• ABC Systems Give CostWarriors Two Targets• Activity Cost Reduction• Cost Driver Reduction
• Example:• Reduced Square Footage• Should Lead to Reduced
Utilities, Maintenance, etc.
activity
allocationbased on
cost driver
cost objectcost object
© Dale R. Geiger 2011 42
Danger: Right Behavior, Wrong Outcome
• Managerial costing systems motivate managers to reduce cost drivers
• A system with the wrong design can• Reduce consumption of the wrong thing• Inadvertently increase consumption of costly
resources that now appear to be free goods
© Dale R. Geiger 2011 43
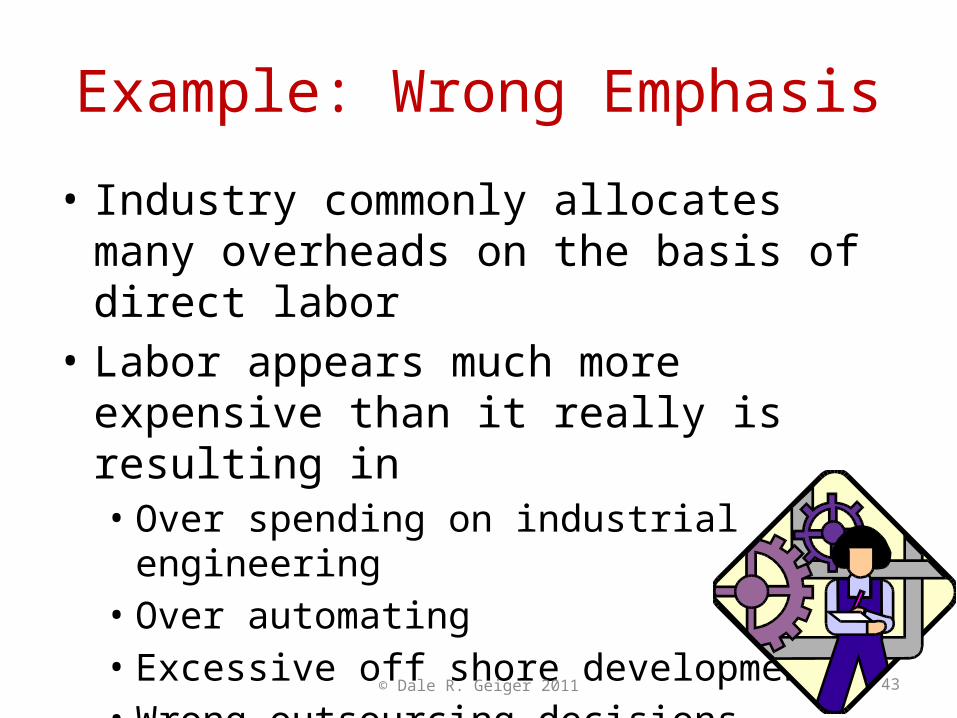
Example: Wrong Emphasis
• Industry commonly allocates many overheads on the basis of direct labor
• Labor appears much more expensive than it really is resulting in • Over spending on industrial engineering• Over automating • Excessive off shore development• Wrong outsourcing decisions
© Dale R. Geiger 2011 44
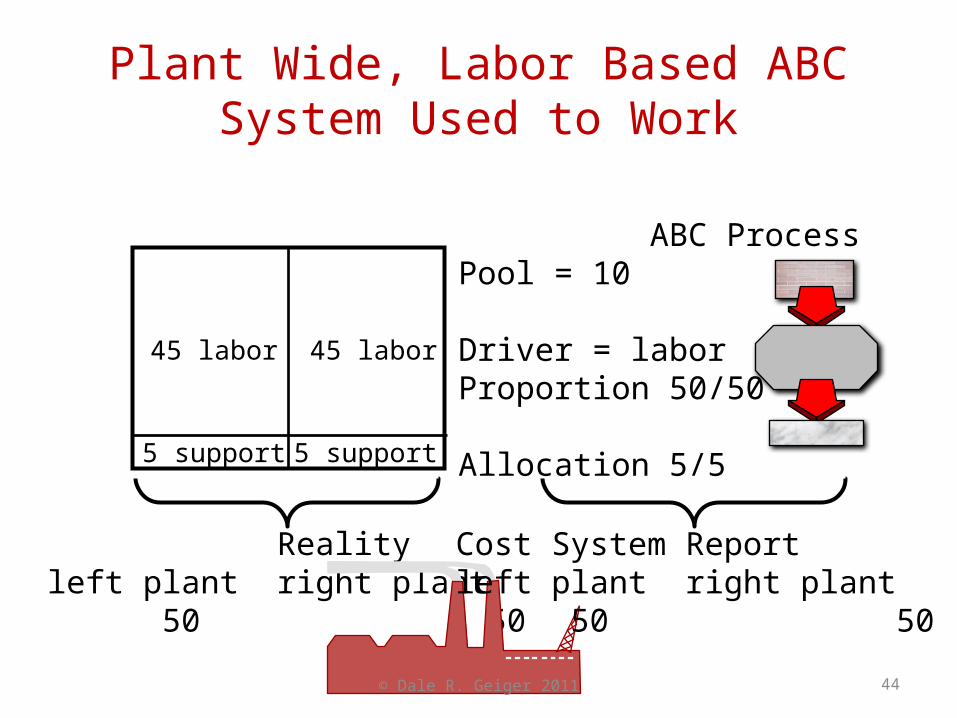
Plant Wide, Labor Based ABC System Used to Work
45 labor 45 labor
5 support 5 support
Realityleft plant right plant 50 50
ABC ProcessPool = 10
Driver = laborProportion 50/50
Allocation 5/5
Cost System Reportleft plant right plant 50 50
© Dale R. Geiger 2011 45
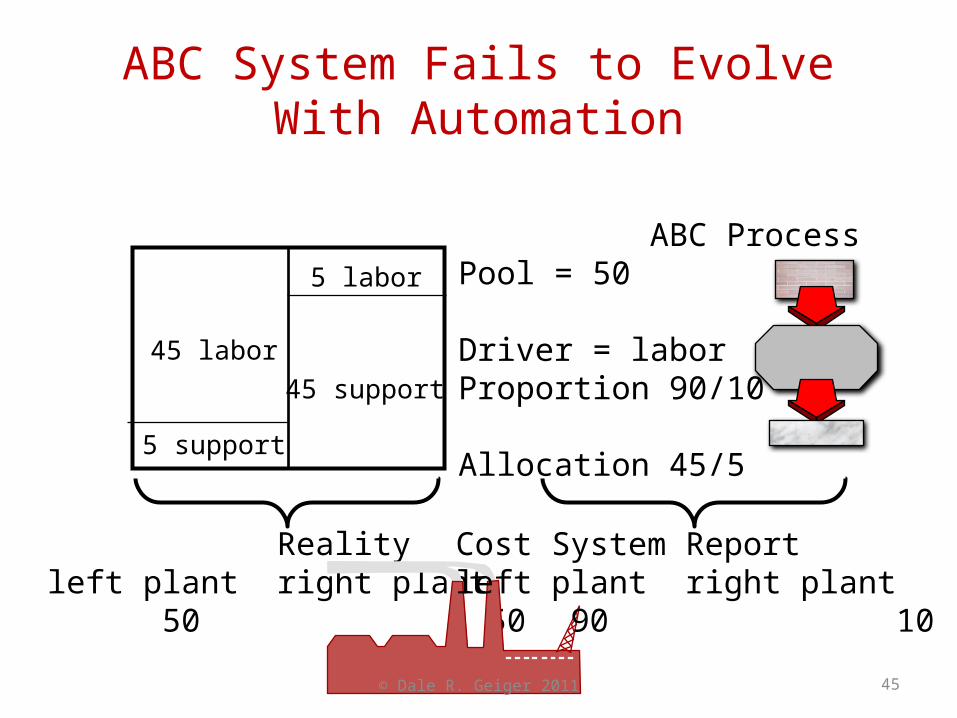
ABC System Fails to Evolve With Automation
45 labor
5 labor
5 support
45 support
Realityleft plant right plant 50 50
ABC ProcessPool = 50
Driver = laborProportion 90/10
Allocation 45/5
Cost System Reportleft plant right plant 90 10
© Dale R. Geiger 2011 46
Outsourcing With Bad Cost Information
• Case facts:• Navy evaluation of ship refurbishment• Nuclear and non-nuclear• Navy shipyards vs. private shipyards• Navy uses single pool based on labor
• Assumptions• Costs are identical in both shipyards • Overhead for nuclear exceeds non-nuclear
© Dale R. Geiger 2011 47
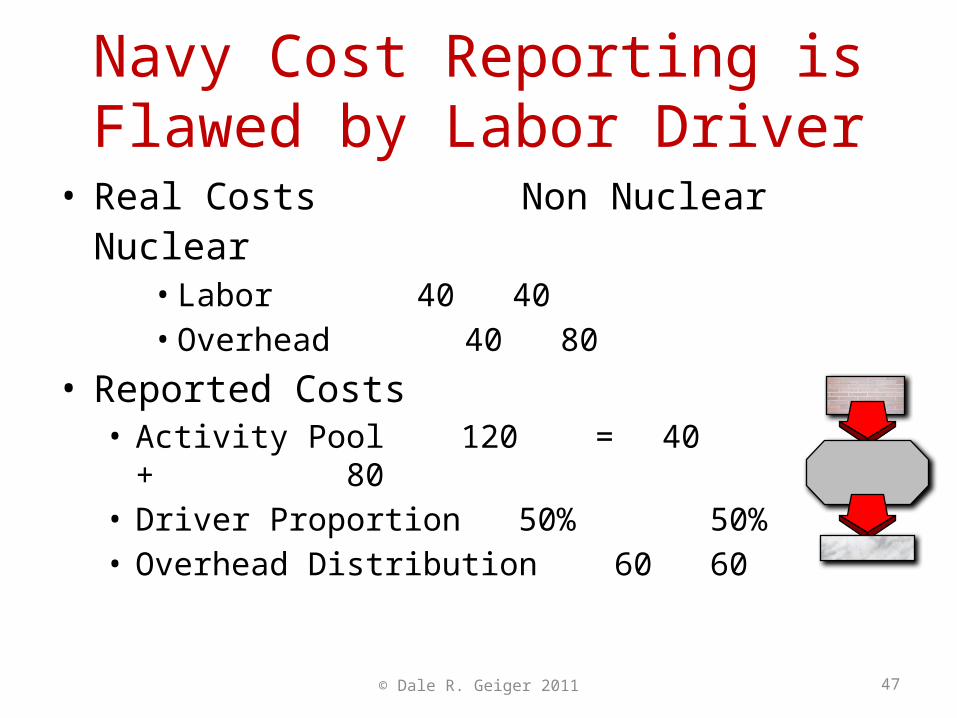
Navy Cost Reporting is Flawed by Labor Driver
• Real Costs Non Nuclear Nuclear• Labor 40 40• Overhead 40 80
• Reported Costs• Activity Pool 120 = 40 + 80• Driver Proportion 50% 50%• Overhead Distribution 60 60
© Dale R. Geiger 2011 48
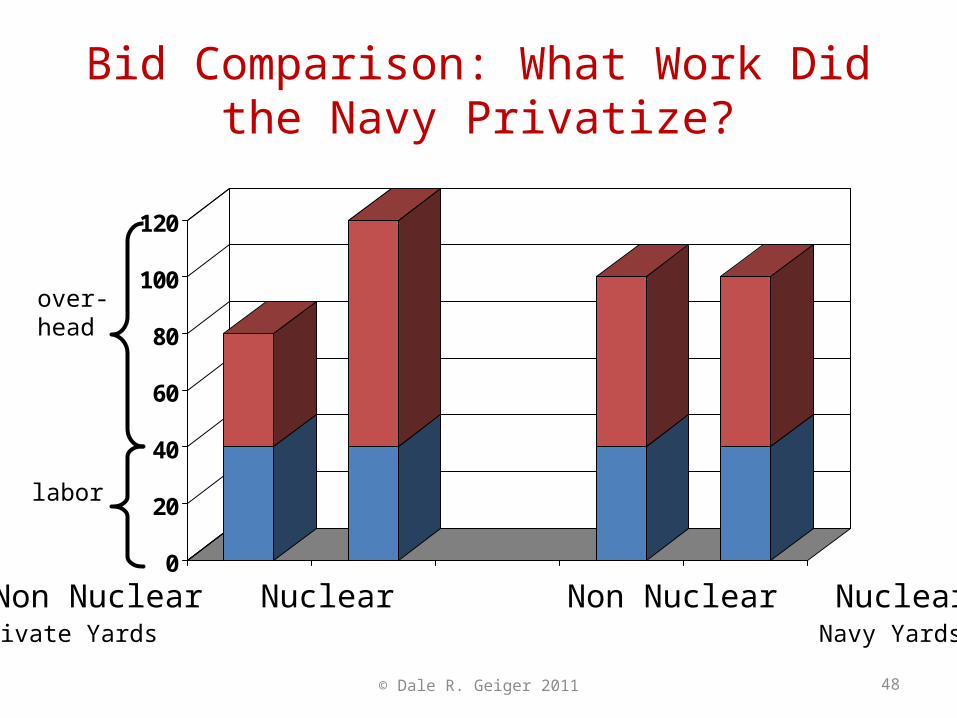
Bid Comparison: What Work Did the Navy Privatize?
0
20
40
60
80
100
120
Non Nuclear Nuclear Non Nuclear NuclearPrivate Yards Navy Yards
labor
over-head
© Dale R. Geiger 2011 49
Follow-up Questions
• How much profit could private shipyard non nuclear bids have added and still won the competition?
• What’s the maximum amount of cost the navy could have saved after closing non nuclear shipyards?
50
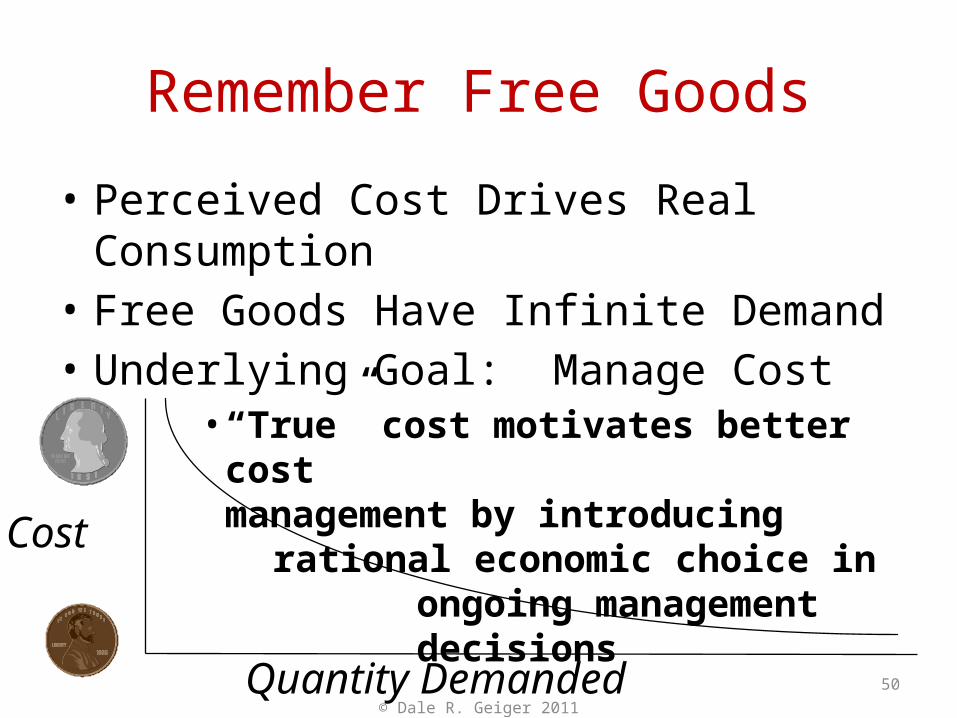
Cost
Quantity Demanded
Remember Free Goods
• Perceived Cost Drives Real Consumption• Free Goods Have Infinite Demand• Underlying Goal: Manage Cost
• “True” cost motivates better cost management by introducing rational economic choice in
ongoing management decisions
© Dale R. Geiger 2011
© Dale R. Geiger 2011 51
Over Consumption Pitfalls:Summary
• Successful managerial cost systems motivate behavior for better or worse
• Flaws in the system can inadvertently motivate behavior in wrong direction
• Having total cost precise and being right “on average” can lead to ruin
• Be reasonably right . . . . . . . . . . . . . . . . . . . . . . . . . . . . . . . . . . .Not precisely wrong
Sometimes Behavior is More Important than Truth
• Typically we want to cut cost by• Determining and allocating true cost• Encouraging cost reduction behavior
• Occasionally we don’t want true cost• If reduction of activity cost is undesired• If reduction of the driver is undesired• When emphasis of some other behavior is
needed
© Dale R. Geiger 2011 52
Consider Some Drivers We May Not Want Reduced
• Imagine the potential for undesirable behavior if the ABC system allocated• Safety program costs based on number of times
safety equipment issued • Patent legal staff based on patents issued• Hazardous materials overhead based on materials
turned in for disposal• Maintenance based on preventative maintenance
costs
© Dale R. Geiger 2011 53
Sometimes We Don’t Want the Activity Cost Reduced
• Sometimes a higher level view recognizes that just cutting cost is not the goal• Perhaps an investment is being made for the
future• It may be desirable in the long run to provide a
capability or encourage a change that would be discouraged by true cost
• Example: True cost may discourage investment in vital technologies that are in the best interests of the organization
© Dale R. Geiger 2011 54
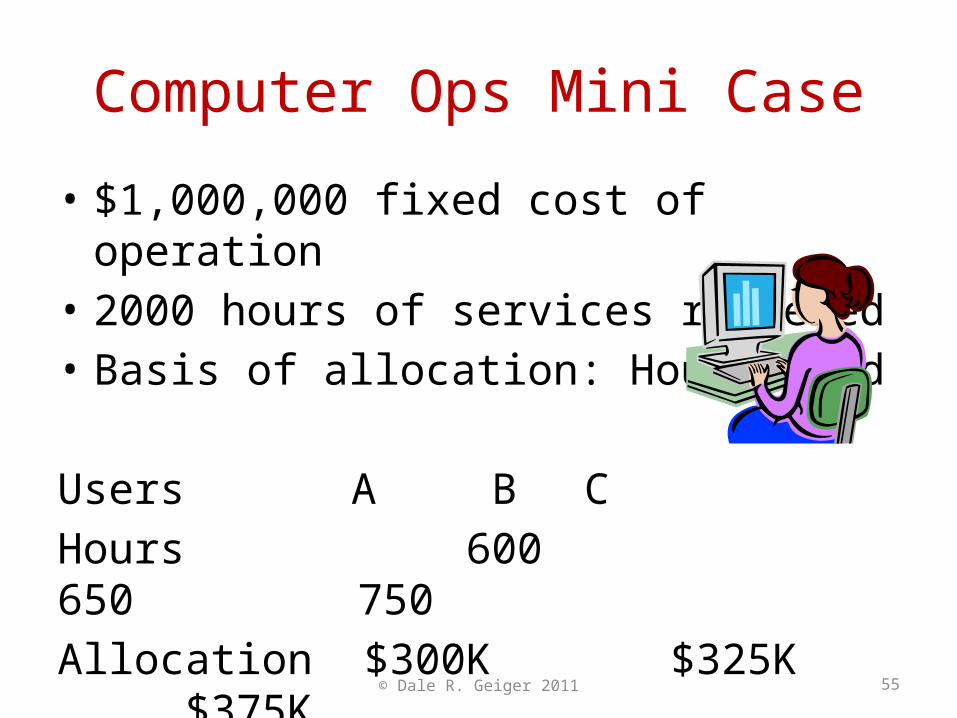
Computer Ops Mini Case
• $1,000,000 fixed cost of operation• 2000 hours of services rendered• Basis of allocation: Hours used
Users A B C Hours 600 650 750 Allocation $300K $325K $375K
© Dale R. Geiger 2011 55
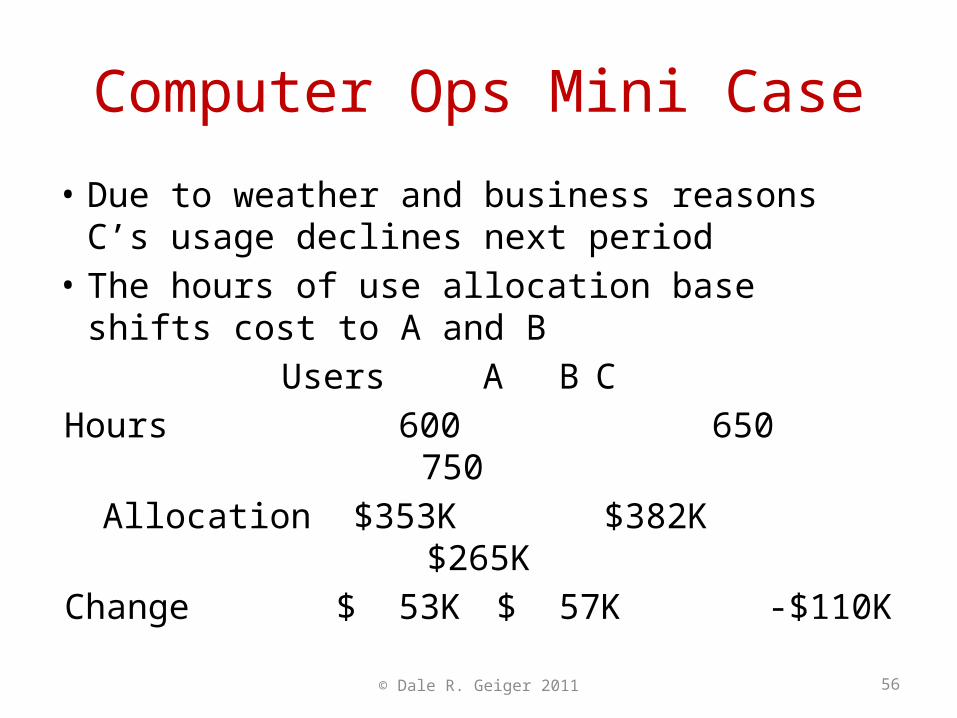
• Due to weather and business reasons C’s usage declines next period
• The hours of use allocation base shifts cost to A and BUsers A B C
Hours 600 650 750 Allocation $353K $382K $265KChange $ 53K $ 57K -$110K
© Dale R. Geiger 2011 56
Computer Ops Mini Case
• A and B see cost increase while their usage did not
• They direct their people to cut usage:• To adjust to higher cost per hour• To guard against future rate increase• To make up for budget hit
© Dale R. Geiger 2011 57
Computer Ops Mini Case
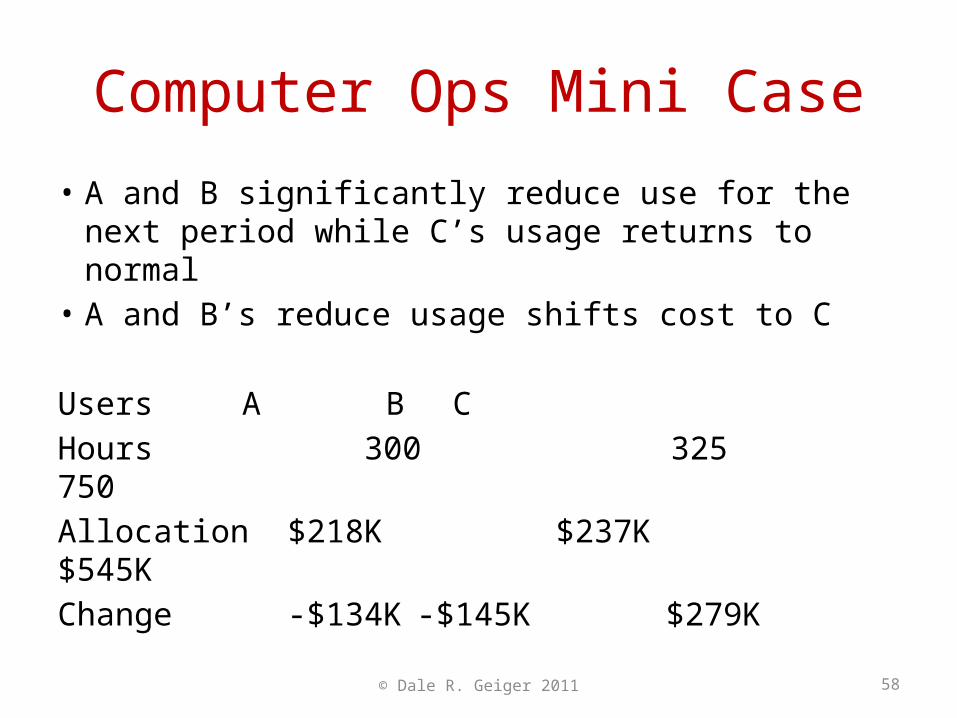
• A and B significantly reduce use for the next period while C’s usage returns to normal
• A and B’s reduce usage shifts cost to C
Users A B C Hours 300 325 750 Allocation $218K $237K $545KChange -$134K -$145K $279K
© Dale R. Geiger 2011 58
Computer Ops Mini Case
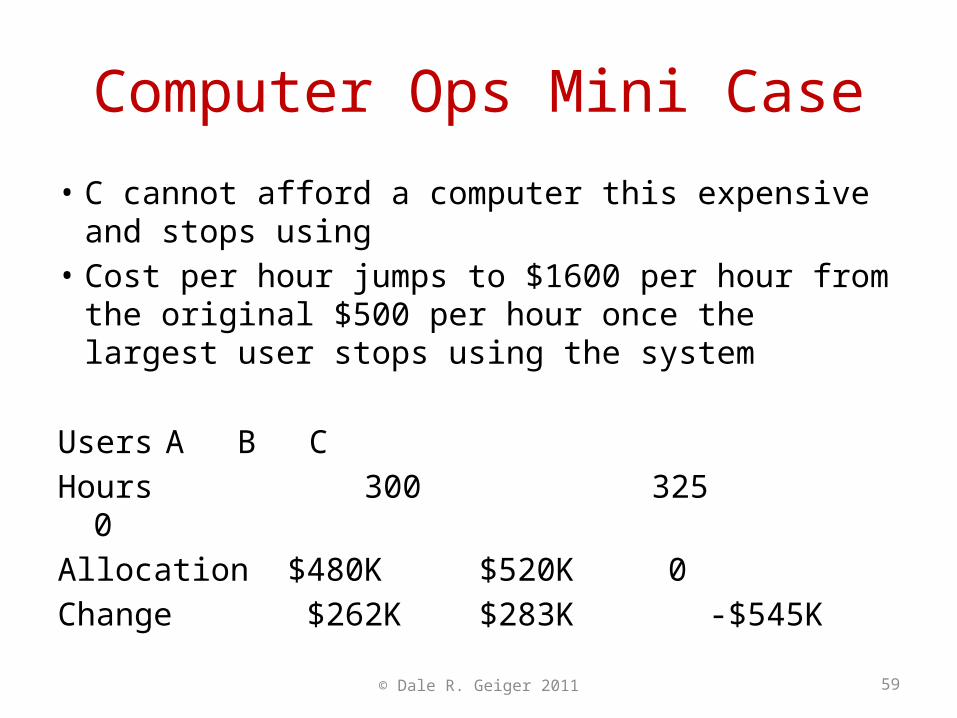
• C cannot afford a computer this expensive and stops using
• Cost per hour jumps to $1600 per hour from the original $500 per hour once the largest user stops using the system
Users A B C Hours 300 325 0 Allocation $480K $520K 0Change $262K $283K -$545K
© Dale R. Geiger 2011 59
Computer Ops Mini Case
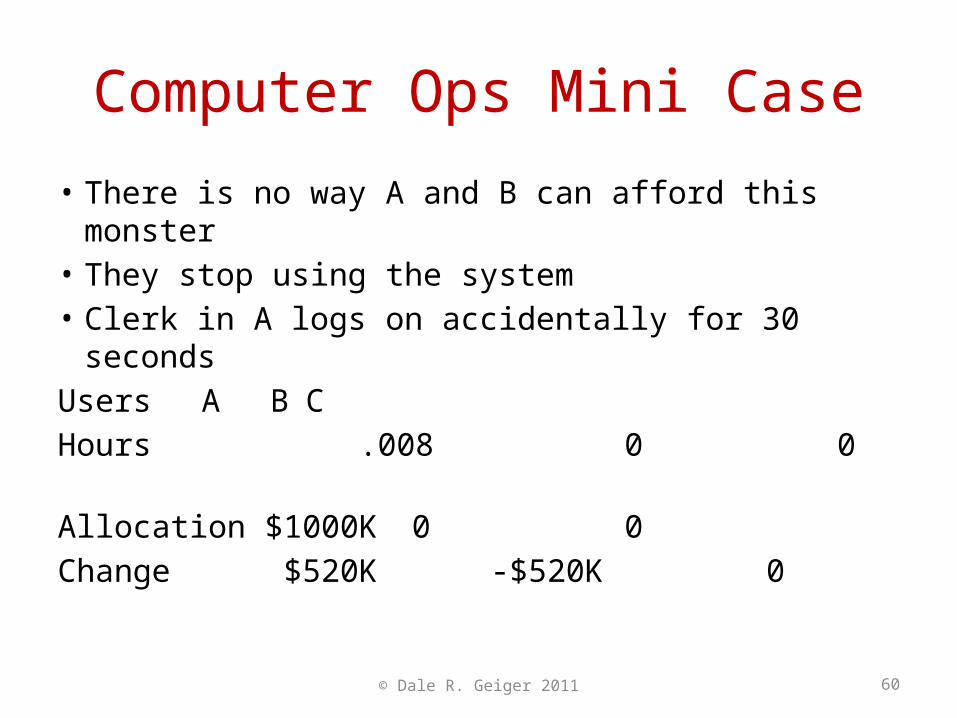
• There is no way A and B can afford this monster• They stop using the system• Clerk in A logs on accidentally for 30 secondsUsers A B C Hours .008 0 0 Allocation $1000K 0 0Change $520K -$520K 0
0
© Dale R. Geiger 2011 60
Computer Ops Mini Case
© Dale R. Geiger 2011 61
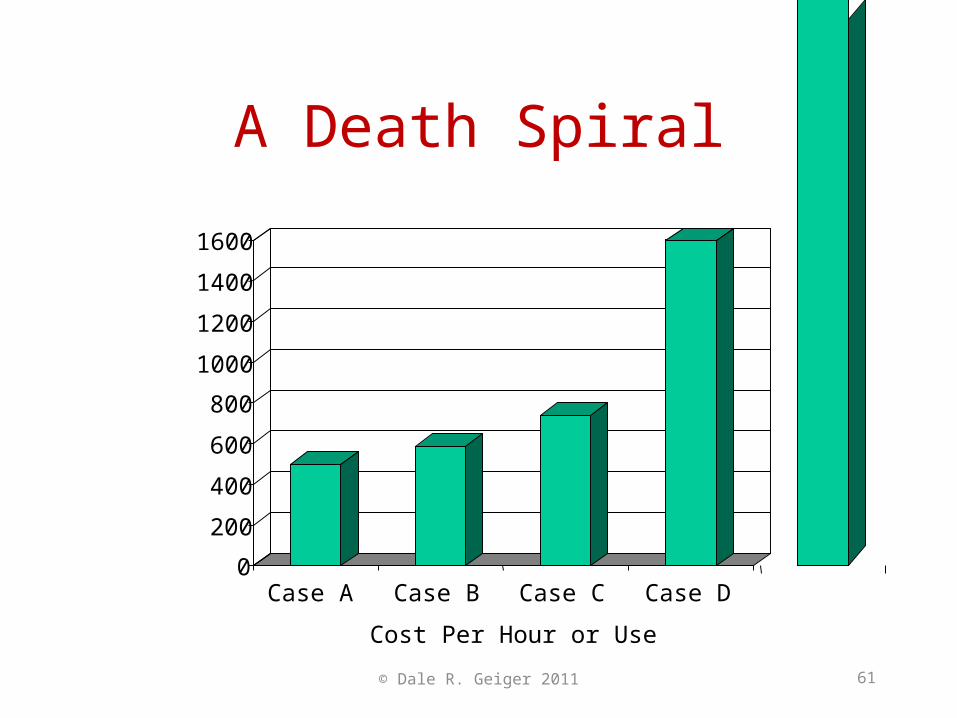
A Death Spiral
0
200
400
600
800
1000
1200
1400
1600
Case A Case B Case C Case D
Cost Per Hour or Use
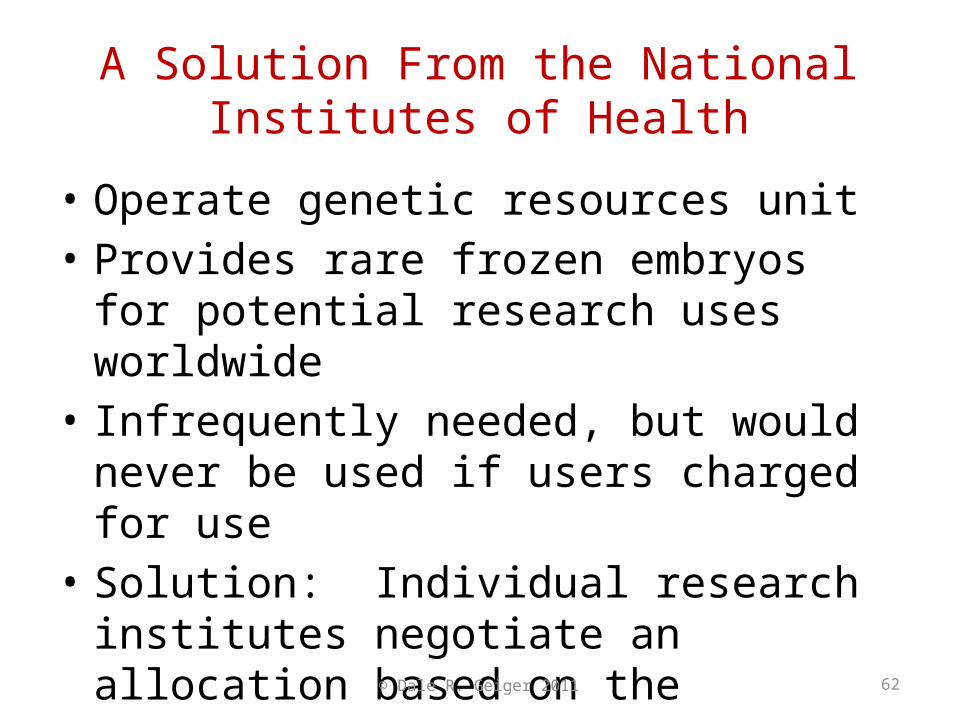
A Solution From the National Institutes of Health
• Operate genetic resources unit • Provides rare frozen embryos for potential
research uses worldwide• Infrequently needed, but would never be used
if users charged for use• Solution: Individual research institutes
negotiate an allocation based on the relative value of availability
© Dale R. Geiger 2011 62
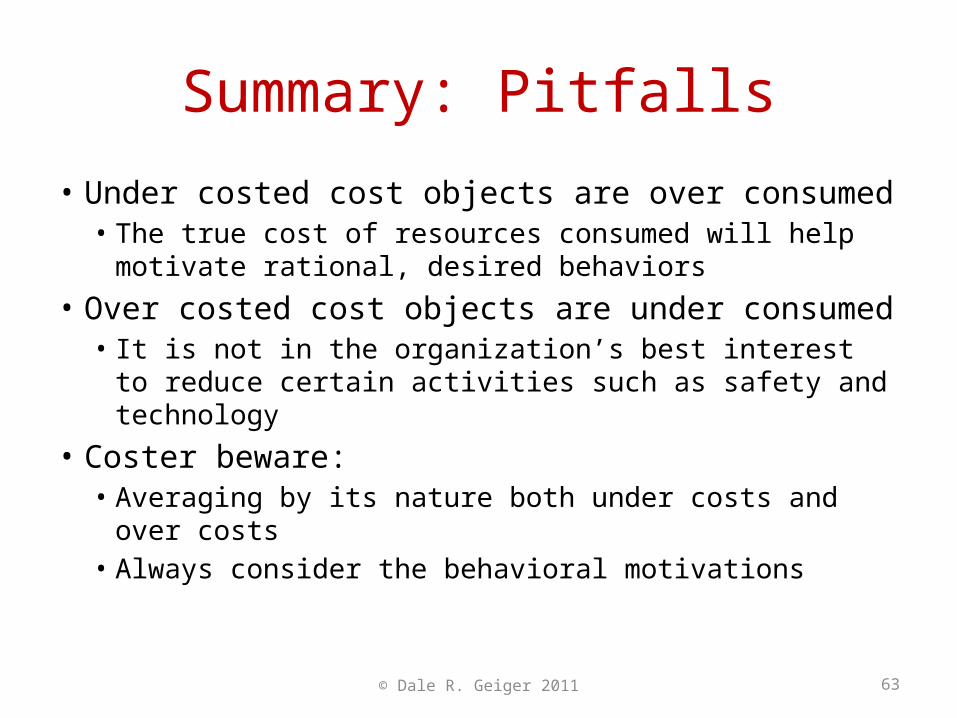
Summary: Pitfalls
• Under costed cost objects are over consumed• The true cost of resources consumed will help
motivate rational, desired behaviors• Over costed cost objects are under consumed
• It is not in the organization’s best interest to reduce certain activities such as safety and technology
• Coster beware:• Averaging by its nature both under costs and over
costs• Always consider the behavioral motivations
© Dale R. Geiger 2011 63
© Dale R. Geiger 2011 64
Check on Learning
• How does incorrect cost information affect outsourcing decisions?
• How might motivating reduced consumption be bad for an organization?
© Dale R. Geiger 2011 65
Practical Exercise