Embed Size (px)
Citation preview

_ii _i_
i i :'::,i'!_
• i
NASA Technical Paper 1905
Description and Calibration of the
Langley Unitary Plan Wind Tunnel
Charlie M. Jackson, Jr., William A. Corlett,
and William J. Monta
Langley Research Center
Hampton, Virginia
National Aeronautics
and Space Administration
Scientific and Technical
Information Branch
1981
REPRODUCED BY
U.S. DEPARTMENT OF COMMERCENATIONAL TECHNICAL
INFORMATION SERVICE"SPRINGFIELD, VA 22161
https://ntrs.nasa.gov/search.jsp?R=19820004162 2018-07-16T15:27:06+00:00Z

,_ ,i_. i_ i_ _ ' i_ ,r

• L ¸¸
CONTENTS
SUMMARY ....................................
INTRODUCTION ..................................
SYMBOLS ..................................
WIND TUNNEL AND EQUIPMENT ...........................
Wind Tunnel .................................
Arrangement ................................
Settling chambers .............................
Nozzles, test sections, and second minimums ................
Diffuser ..................................
Drive section and compressors .......................
Heat exchangers ..............................
Operating modes ..............................
Test Sections ................................
General description ............................
Nozzles and second minimums ........................
Model support struts ............................
Windows and access doors ..........................
Instrumentation ...............................
Wind-tunnel stagnation temperature and pressure measurement ...... . . .
Schlieren system ..............................
Vapor-screen system ............................
Data acquisition ..............................
Air Systems .................................
General description ............................
Makeup air equipment ............................
Seal air system ..............................
Vacuum system ..............................
CALIBRATION AND TUNNEL OPERATING CHARACTERISTICS ................
Calibration .................................
Procedure ................................
Presentation of data ............................
Test-section boundary layer ........................
Tunnel moisture effects ..........................
Tunnel turbulence level ..........................
Tunnel blockage ..............................
Tunnel temperature calibration .......................
Tunnel Operating Characteristics .......................
Operating parameters ............... " .............
Power characteristics ...........................
CONCLUDING REMARKS ...............................
REFERENCES ...................................
TABLES ....................................
FIGURES ..................................
1
3
3
3
3
4
4
4
5
6
6
6
6
7
8
8
8
8
8
8
9
9
9
9
9
9
9
9
l0
ii
ii
ii
ii
12
12
12
12
13
14
15
28
iii
{,-::_.,E_,_[_G PAGE BLANK NOT FILMED

• ._i _i_ !i _I!i •_i _ iI ¸ •

i ¸
SUMMARY
The two test sections of the Langley Unitary Plan Wind Tunnel have been cali-
brated over the operating Mach number range from 1.47 to 4.63, and the results are
presented along with a description of the facility and its operational capability.
The calibrations include Mach number and flow-angularity distributions in both test
sections at selected Mach numbers and tunnel stagnation pressures, as well as measure-
ments of turbulence, test-section boundary-layer characteristics, moisture effects,
blockage, and stagnation-temperature distributions.
The test-section calibrations indicated that the Mach number variation throughout
the test region associated with smaller models is f0.01; whereas at the higher Mach
numbers and for longer models at angle of attack, the variation can reach ±0.04. Both
test sections have a positive or upflow angle generally within 0.5 ° except at the
higher Mach numbers of test section 1 where the upflow angle can reach 1.5 ° .
The facility is described in detail including dimensions and capacities where
appropriate, and examples of special test capabiiities are presented. The operating
parameters are fully defined and the power-consumption characteristics are discussed.
INTRODUCTION
Immediately following World War II the need was recognized for wind-tunnel equip-
ment to develop advanced airplanes and missiles. The military and the National
Advisory Committee for Aeronautics (NACA) developed a plan for a series of facilities
which was approved by the U.S. Congress in the Unitary Wind Tunnel Plan Act of 1949.
This plan included five wind-tunnel facilities, three at NACA laboratories and two
along with an engine test facility at the Arnold Engineering Development Center
(AEDC). These facilities were built to provide experimental aerodynamic support to
the industry, the military services, and other government agencies.
The facility of interest in the present report is the Unitary Plan Wind Tunnel
which is located at the Langley Research Center. It is a closed-circuit pressure
tunnel with two 4- by 4- by 7-ft (1.22- by 1.22- by 2.13-m) test sections which cover
a Mach number range from 1.47 to 4.63 and a nominal Reynolds number range from
0.5 x 10⁶ per ft (1.64 x 10⁶ per m) to 8.0 x 10⁶ per ft (26.23 x 10⁶ per m). Con-
struction of this facility was completed in 1955 and it has been in continuous opera-
tion since that time except for periodic maintenance. In the operational history of
the Langley Unitary Plan Wind Tunnel are developmental tests of virtually every super-
sonic military airplane, missile, and spacecraft to have become operational in the
United States inventory. Most of the many aircraft configurations proposed in the
National Supersonic Transpor t (SST) Program as well as many of their progenitors were
extensively tested in this facility. Considerable experimental investigations in sup-
port of the Space Shuttle Program were conducted; and continuing throughout the opera-
tional life of the facility has been the basic experimental fluid-mechanics research
which has given rise to the development of methods for predicting supersonic aerodg-
namic performance.
Brief descriptions of the Langley Unitary Plan Wind Tunnel are presented in the
facility compilations of references i, 2, and 3. The present paper offers a descrip-
tion of the wind tunnel with revised specifications.

/
i _
The purpose of this report is to present a description of the Langley Unitary
Plan Wind Tunnel (UPWT) and its auxiliary equipment and operational capability. Also
included is a description of the calibration procedures and a summary of the flow-
calibration data obtained over the life of the facility.
SYMBOLS
The units for the physical quantities in this paper are given both in U.S.
Customary Units and in the International System of Units (SI). Measurements and cal-
culations were made in U.S. Customary Units. Factors relating the two systems are
given in reference 4. The authors did not adhere to the NASA policy of expressing
dimensional quantities with the International System of Units (SI) as the primary
system. This requirement has been waived, and U.S. Customary Units are given first
with equivalent SI units in parentheses.
b tunnel nozzle block position
M test-section stream Mach number
weighted average test-section Mach number (taken between
0 _ x ! 48 in. (1.22 m) and -i0 in. (-0.254 m) ! z _ i0 in. (0.254 m))
profile exponent for a turbulent boundary layer
Pp
Pst
Pt
q
probe pitot pressure, psf (Pa)
probe static pressure, psf (Pa)
tunnel total pressure, psf (Pa)
test-section dynamic pressure, psf (Pa)
R unit Reynolds number per ft (per m)
Rx,tr
Tdp,a_n
T t
Tt,CL
t
transition Reynolds number based on boundary-layer laminar run
dew-point temperatures corrected to standard atmospheric pressure, OF (°C)
tunnel stagnation temperature, OF (°C)
tunnel center-line stagnation temperature, OF (°C)
time from initiation of heat pulse, sec
root-mean-square turbulent fluctuation velocity in the x-direction,
ft/sec (m/see)
u/u ratio of local boundary-layer velocity to free-stream velocity
V mean velocity along X-axis, ft/sec (m/see)
X,Y,Z tunnel coordinate system (fig. 12)
2

x,y,z
Xl,Z 1
X2,Z2
0
OH
_V
dimensions in tunnel coordinate system, in. (m)
nozzle contour coordinates for test section i, in. (m)
nozzle contour coordinates for test section 2, in. (m)
angle of attack (fig. 15), deg
angle of sideslip (fig. 15), deg
boundary-layer thickness, in. (cm)
boundary-layer displacement thickness, in. (cm)
boundary-layer momentum thickness, in. (cm)
flow angle measured in the horizontal plane (positive for flow toward the
left facing upstream), deg
flow angle measured in the vertical plane (positive up), deg
WIND TUNNEL AND EQUIPMENT
Wind Tunnel
Arrangement.- The Langley Unitary Plan Wind Tunnel is a closed-circuit pressure
tunnel with two 4- by 4- by 7-ft (1.22- by 1.22- by 2.13-m) test sections. An exte_
rior view of the facility is shown in figure i, a schematic drawing of the arrange-
ment of the major elements is shown in figure 2, and a detailed planform of the tunnel
circuit arrangement is shown in figure 3. The major elements of the facility are the
i00 000-hp (74.6-MW) drive system, a dry air supply and evacuating system, a cooling
system, and the interconnecting ducting to produce the proper airflow through either
of the two test sections. The tunnel overall volume is 163 922 ft 3 (4642 m3), and the
tunnel duct circuit can be circumscribed by a rectangle 263 ft (80.2 m) by 210 ft
(64.0 m). The tunnel circuit is designed to operate at pressures from near-vacuum to
i0 atm (i atm = 101.3 kPa). The axial locations and dimensions of the components of
the high and low Mach number circuits and compressor circuits (as defined in fig. 3)
of the wind tunnel are presented in tables I and II, respectively. The duct juncture
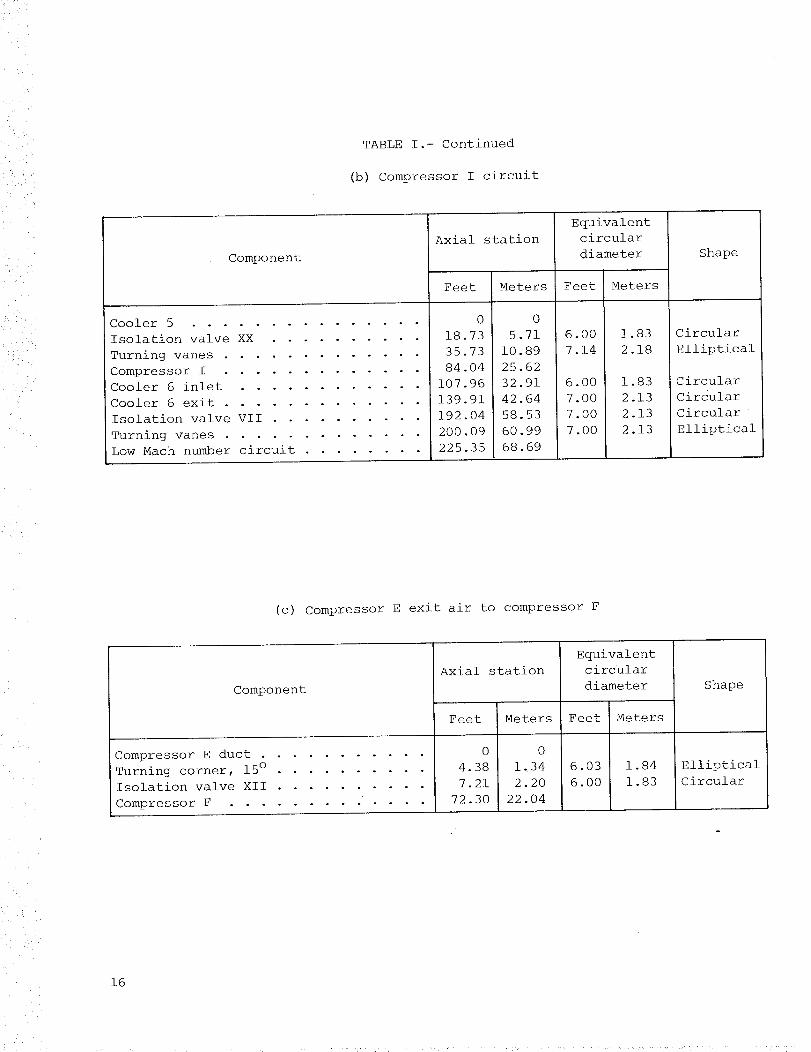
and turning vanes just downstream of configuration valve I are shown in figure 4 to
illustrate typical internal duct configurations. Figure 5 shows a typical tunnel-
duct-configuration valve (number IV, downstream of cooler i) in the open position.
These valves are used to configure the tunnel ducts for different compressor stagingmodes.
Settling chambers.- The settling chambers provide a large volume which results in
low-velocity flow and smooth transition from the circular tunnel duct work to the
rectangular nozzles a_d test section. The settling chamber for the low Mach number-
test section is a cylindrical duct 15 ft (4.B7 m) in diameter and 25 ft (7.62 m) long
followed by a 7-ft-long (2.13-m) transition section from circular to 4- by ll.51-ft
(1.22- by 3.51-m) rectangular. The settling chamber for the high Mach number test
section is a cylindrical duct 12 ft (3.66 m) in diameter and 24.5 ft (7.47 m) long
followed by a 3.5-ft-long (l.07-m) transition section from circular to 4- by 8.75-ft
(1.22- by 2.67-m) rectangular. A photograph of the settling chamber and transition
section of the low Mach number test section is shown in figure 6.
3

Nozzles, test sections, and second minimums.- The low and high Mach number noz-
zles are of the asymmetric sliding-block type such that the nozzle throat-to-test-
section area ratio can be varied to provide continuous variation of Mach number. A
schematic drawing of the low Mach number nozzle is shown in figure 7 which illustrates
the asymmetric nozzle contours and sliding block and drive mechanism. The low and
high Mach number test sections (referred to as test sections 1 and 2, respectively)
are formed by the downstream contours of the nozzle and are nominally 4 by 4 ft
(1.22 by 1.22 m) in cross section by 7 ft (2.13 m) in length. The variable-area
second-minimum sections of the facility are formed downstream of test sections 1
and 2. The second-minimum area is controlled by moving the hinged sidewalls to pro-
vide the proper constriction to stabilize the normal shock downstream of the test sec-
tion at the various operating Mach numbers. These components are described in detail
in a subsequent section of this report.
Diffuser.- The overall diffuser sections for test sections 1 and 2 are circular
in cross section and extend downstream 85.5 ft (26.06 m). Transition sections from
the rectangular second minimums form the entrance into the diffusers. The overall
diffuser cross sections vary from 5.665 ft (1.73 m) in diameter at the entrance to
12 ft (3.66 m) in diameter at the exit. The initial• included conical angle of the
diffusers for both tunnel circuits is 2.93 ° and remains constant for 45.8 ft (13.96 m)
when it changes to 4.77 ° for the low Mach number circuit and to 6.4 ° for the high Mach
number circuit.
Drive section and compressors.- The configuration of the starting and main-drive
motors and compressors is shown in figure 2. The schematic drawing of the tunnel
shows the location of the drive section and compressors within the facility, and the
arrangement of the starting motor, main-drive motor, and six compressors is illustrat6
in the insert of figure 2. The main-drive motor is located in line with three com-
pressors on each end forming a continuous driveline 120 ft (36.58 m) long. The start-
ing motor is located offset from this driveline and transmits power to the driveline
through a speed-increase gear. Figure 8 is a photograph showing the main-drive motor
and six compressors.
The main-drive motor is of the synchronous type and is rated for continuous
operation at 63 333 hp (47.2 MW) at a rotational speed of 3600 rpm with a 76 000-hp
(56.7-MW) overload rating for 1/2 hour. The starting motor is a wound-rotor, liquid
rheostat-controlled machine and is used to bring the driveline up to synchronous
speed. At a synchronous speed of 720 rpm, this machine delivers continuous power to
the driveline at a rating of 20 000 hp (14.9 MW) with a 24 000-hp (17.9-MW) overload
rating for 1/2 hour. A combined overload rating of the drive motors gives a maximum
power rating for the facility of i00 000 hp (74.6 MW). The starting motor is mechani-
cally connected to the compressor driveline through a speed-increase gear of 685:3600
ratio such that the compressor speed is constant at 3600 rpm for all tunnel operating
conditions.
The compression ratio and airflow required to establish stable flow conditions iz
either of the test sections is supplied by six centrifugal compressors. These com-
pressors are designated by the letters C, D, E, F, G, and I and are located.as shown
in figure 2. Compressors C, D, E, F, and I are single-stage machines manufactured by
the Roots-Connerville Blower Company with each having a design compression ratio of
1.95. Compressors C, D, and E have a design inlet volume flow of 298 000 ft3/min
(8438.41 m3/min), and compressors F and I have a design inlet volume flow of
149 000 ft3/min (4219.2 m3/min). Compressor G is a three-stage machine manufactured
by the Clark Compressor Company and has a design inlet volume flow of 60 000 ft3/min
(1699 m3/min) and a design compression ratio of 2.25. These machines are used in fiv

i
i__ '
different combinations or modes as shown in the following table to provide the
required compression ratio and airflow to operate either test section over the indi-
cated Mach number range.
Test
section
i
1
2
2
2
Mode
I-IA
l-II
2-II
2-III
2-IV
Mach number
range
(a)
1.469 to 2.160
2.354 to 2.869
2.287 to 2.973
2.973 to 3.750
3.835 to 4.640
Stage of compression
of compressor -
I C D E F G
1 i i
1 1 1 2
i 1 i 2
1 i 1 2 3
i 1 2 3
aMach number corresponds to R = 3 x l06 per ft
(9.84 x 10⁶ per m).
The tunnel duct configurations for operation, staging, and bypass for each of these
modes as well as start-up and mode-changing procedures will be described in a subse-
quent section.
A detailed presentation and analysis of the measured compressor operating char-
acteristics is presented in reference 5. Reference 5 also includes a study of the
overall operating performance, power characteristics, and efficiency of the tunnel
drive system at each of the operating modes.
Heat exchangers.- The facility is equipped with six crossflow heat exchangers
located within the tunnel duct circuits as shown in figure 3. A photograph of heat
exchangers downstream of compressors I, C, D, and E (coolers 6, i, and 2) is shown
in figure 9. The energy expended by the main-drive system is removed by the water
flowing through these coolers and transmitted to the atmosphere through a cooling
tower located outside the facility. The heat exchangers (coolers 1 to 6) within the
tunnel circuit have the overall design operating characteristics presented in the
following table:
Condition
Design inlet-air
temperature, OF (°C) ....
Design outlet-air
temperature, oF (°C) ....
Design inlet-water
temperature, OF (°C) ....
Airflow, ib/sec (kg/sec) . . .
Coolant pump capacity,
gal/min (m3/min) ......
285
(141)
130
(54)
85
(29)
1895
(86O)
17 000
(64.35)
Cooler
273
(134)
120
(49)
85
(29)
945
(429)
8320
(31.49)
273
(134)
120
(49)
85
(29)
63O
(286)
55OO
(20.82)
242
(117)
120
(49)
85
(29)
470
(213)
3400
(12.87)
400
(204)
220
(104)
85
(29)
1630
(739)
12 200
(46.18)
286
(141)
120
(49)
85
(29)
38O
(172)
3400
(12.87)

Cooler 5 acts as a precooler to compressors C, D, and I and, consequently, has higher
design inlet and design outlet temperatures. These coolers are generally capable of
maintaining the tunnel stagnation temperature at 100°F (37.7°C). However, as a
result of the unique cooler design, the airflow can be rapidly bypassed around the
cooling elements resulting in an airstream stagnation temperature of up to 400°F
(204°C) for heat-transfer tests.
The coolingtower is located outside of the facility as shown in the schematic
drawing of figure 2. The tower is composed of eight cells with each having a 17-ft-
diameter (5.18-m) fan. The capacity of the tower is 20 000 gal/min (75.71 m3/min)
with design inlet-water temperature of l15°F (46.1°C) and design discharge-water
temperature of 85°F (29.44°C). A photograph of the cooling tower is shown in
figure i0.
Operating modes.- In order to cover the entire Mach number range for each test
section, not only must the nozzle blocks be moved to provide the proper expansion
ratio but the tunnel duct configurations must also be altered to provide the proper
compression retio. As previously mentioned, the six compressors are used in five
tunnel configurations or modes to provide the required overall compression ratio.
Figure ii shows the tunnel duct configurations and airflow path for each of the five
modes. It should be noted that the compressors not in use in these modes are not
uncoupled from the driveline and, therefore, operate in a bypass condition. In order
to reduce the power consumption for this condition, the pressure in the bypass ducts
is reduced as much as possible.
Since the tunnel operating modes are available for only one test section at a
time, maximum utilization of the facility is obtained by isolating the unused test
section for installation and model changes. To reduce model transient loads during
tunnel start-up or shutdown, the pressure in the tunnel circuit is reduced below
2 psia (13.79 kPa) until supersonic flow is established in the test section. Once
supersonic flow is established, the tunnel pressure required for the tests is con-
trolled by inbleeding or outbleeding dry air. A description of the makeup air equip-
ment including capacities is provided in a subsequent section of this report.
Test Sections
General description.- The two test sections of the Unitary Plan Wind Tunnel pro-
vide test capability over a Mach number range from 1.46 to 4.63. The low Mach number
test section (test section i) covers the Mach number range from 1.46 to 2.86 and the
high Mach number test section (test section 2) is capable of providing supersonic flow
from a Mach number of 2.30 to 4.63. The test sections are formed by the downstream
portion of the nozzles, nominally 4 by 4 ft (1.22 by 1.22 m) in cross section by 7 ft
(2.13 m) in length. Figure 12 shows the details of the transition sections, nozzles,
and test sections for both tunnel circuits. The superstructure is shown for both
test sections as well as the drive mechanism for the movable lower nozzle blocks. A
typical research model is shown in test section 1 in figure 13.
Nozzles and second minimums.- The nozzle contours for both tunnel circuits are
asymmetric, and the lower walls of both nozzles move longitudinally to provide the
necessary variation in area ratio of throat to test section. Figure 12 shows the
lower walls of the nozzles in the minimum Mach number position (contraction ratio of
12.96 for test section 1 and of 15.41 for test section 2) with the maximum Mach num-
ber position indicated by the dashed line (contraction ratio of 43.07 for test sec-
tion 1 and of 143.59 for test section 2). The movable nozzle blocks are powered by

150-hp (lll.9-kW) motors which produce a drive rate of 2 ft/min (0.6 m/min). Thenozzle sidewalls are parallel and 4 ft (1.22 m) apart. The coordinates of the con-toured upper and lower nozzle walls are presented in table III for test section 1 andin table IV for test section 2. These coordinates are referenced to the coordinatesystems defined in figure 12 for each test section. Contour coordinates are givenfor the lower nozzle block in the most upstream test position. Table V gives thelower nozzle:block position as a function of test-section Machnumberfor test sec-tion 1 and as a function of Machnumberand Reynolds numberfor test section 2.
For determination of the nozzle coordinates in inches at any given Machnumberand Reynolds numberfor the lower block only, x coordinates are defined for testsection 1 by the equation
x = Xl + (i15.5 - i_ ) (1)
and for test section 2 by the equation
( b)x = x 2 + 219.5 100 (2)
The high and low Mach number tunnel circuits have variable cross-sectional area
second-minimum sections downstream of the test section. Elevation and plan-view
drawings of these sections are shown in figure 14. Figure 14 also shows the details
of the superstructure, movable sidewalls, and downstream transition section from rec-
tangular to circular cross section. The second-minimum contraction ratio can be
varied to a maximum of 2.66 for the low Mach number tunnel circuit and to 4 for the
high Mach number tunnel circuit.
Operating second-minimum contraction ratios have been established to provide
maximum supersonic-flow stability over a wide range of test-section blockage condi-
tions. For the low Mach number tunnel circuit, the second minimum operates at a con-
traction ratio of 1.01 over all test conditions. The high Mach number tunnel circuit
requires the variation of the second-minimum contraction ratio with nozzle-block
position as presented in table VI.
Model support struts.- Many methods have been used to support models and probes
depending on the objective of the test. The mounting mechanismmost commonly used in
both test sections to provide force and moment data on airplane and missile models is
shown in figure 15. The basic mechanism is the horizontal wall-mounted strut which
is capable of forward and aft travel of 36.25 in. (0.921 m) in the x-direction. To
this strut is attached a sting support which has traverse (y) and sideslip (_) motion
of ±20 in. (±0.508 m) and ±14 ° , respectively. Forward of the sting support is the
angle-of-attack (_) mechanism which provides pitch motion from -12 ° to 22 ° . Just
upstream of the pitch mechanism is the roll mechanism which provides continuous roll
motion through 310 ° . The model is mounted on the roll mechanism by means of a sting.
A wide assortment of sting sizes and lengths are available to provide specific model
position and load requirements. In addition to several alternate pitch mechanisms,
one of which can provide up to 90 ° angle of attack, there are assorted angular cou-
plings and "dog-leg" and offset stings.

Windows and access doors.- Access to each test section is provided by two doors
which form the sidewalls of the test sections from station 0.625 in. (0.0159 m) to
station 69.375 in. (1.762 m). Each of the test-section doors has nine 5.5-in.
(0.140-m) by 48-in. (1.22-m) windows, separated by 1.25-in. (3.18-cm) webs, which
form a field of view 59.5 in. (1.51 m) long by 48 in. (1.22 m) high through the test
section. The windows are 1.5-in.-thick (0.038-m) glass of optical quality to provide
minimum distortion for schlieren and flow visualization. Details of the test-section
access doors and windows are shown in figure 12. An alternate set of solid-steel
doors is available for sidewall model mounts and heat-transfer tests. In addition,
each test section is provided with an access hatch in the region of the diffuser.
/ , _•i__•
i• _j
Instrumentation
Wind-tunnel stagnation temperature and pressuremeasurement.- The test-section
Mach number is determined by the position of the movable lower nozzle block. The rela-
tion of the physical position of the block to the calibration Mach number is presented
in table V. The tunnel stagnation pressure is measured in the settling chambers by
using a system of sonar manometers up to 5000 psf (239.4 kPa) and pressure trans-
ducers in the higher range up to the maximum duct pressure of i0 atm. The accuracy
of this measurement is 20.5 pS f (223.94 Pa) in the lower range and 221.6 psf
(21.034 kPa) in the higher range. Tunnel stagnation temperature is measured by an
array of thermocouples mounted on the turning vanes upstream of the settling chambers.
Schlieren system.- Each test section is equipped with a schlieren system having
a 49-in.-diameter (1.24-m) field of view. The complete system shown in schematic
form in figure 16 is supported from a beam as a unit and can be positioned along the
longitudinal axis of the test section. The system uses a silvered knife edge at the
focal point to provide simultaneous viewing and recording of the image. The schlie-
ten photographs are taken with an automatic 9- by 9-in. (0.229- by 0.229-m) aerial
camera. A typical schlieren photograph is shown in figure 17.
Vapor-screen system.- A flow-visualization system can be set up in either test
section to provide photographs of vapor-screen images of flow phenomena. Figure 18
shows a schematic drawing of the setup of lights and cameras both inside and outside
of the test section. The appropriate vapor density is established by increasing the
tunnel operating dew point to a value ranging from 20°F (-6.7°C) to 30°F (-l.l°C),
depending upon Mach number. Figure 19 shows typical vapor-screen results obtained
with the cameras located both inside and outside the tunnel.
Data acquisition.- The heart of the on-line data-acquisition system is a 48K
word memory computer which is coupled to a data-acquisition system with i00 analog and
40 digital recording channels. This system provides on-line data reduction and dis-
plays in real time as well as calibration capability for the two test sections.
Force and moment data are measured by strain-gage balances which are temperature
compensated and calibrated to account for first- and second-order interactions such
that the system is generally accurate to within 21/2 percent of the design balance
load. Each point of force data is computed on line from an average of 60 samples
recorded at 30 samples per second. From 1 to 12 plots can be displayed on a'cathode-
ray tube at a time. Pressure data are taken with pressure transducers of appropriate
sizes used with scanning valves. The data-acquisition system can accommodate up to
six 48-port scanning valves. These are automatically calibrated at each data point to
provide accuracy generally within 21.0 psf (247.88 Pa).
8

i:iI i:
}
..!
i
Air Systems
General description.- The equipment required to maintain the tunnel air supply
is located in the general area of the compressor drive section as shown in the sche-
matic drawing of figure 2. The air system consists of the following: a makeup air
compressor, storage spheres, air dryers, a seal air compressor, and evacuation pumps.
Air from the central 5000 psi (34 477 kPa) pumping station is used at reduced pres-
sure as a backup for the facility air systems.
Makeup air equipment.- Air for the tunnel is supplied by three 31-ft (9.4-m)
storage spheres charged with 150 psi (1034 kPa) dry air. A 12 500 ft3/min
(353.9 m3/min) two-stage compressor powered with a 3500-hp (2610-kW) drive motor
supplies air to the spheres. This air is dried with an activated-alumina air dryer
having a capacity of 1140 ib/min (517.10 kg/min) at 150 psi (1034 kPa) with air-
outlet dew point of -90°F (-67.8°C).
Seal air system.- The seal air system consists of a 140 ft3/min (3.96 m3/min)
compressor used to supply 300 psi (2068.42 kPa) air to pressurize the tunnel valve
seals. Air for the labyrinth seals of the main-drive compressors is supplied from
the storage spheres.
Vacuum system.- The tunnel is evacuated for start-up and purge by means of four
vacuum p--_s w-_ a total capacity of 9100 ft3/min (257.68 m3/min). These vacuum
pumps are also used to maintain stagnation pressure below atmospheric conditions.
The vacuum system also has a i000 ft3/min (28.32 m3/min) vacuum pump for maintaining
low pressures in the main-drive bypass circuit and a i000 ft3/min (28.32 m3/min)
vacuum pump to evacuate the volume below the test-section sliding blocks.
CALIBRATION AND TUNNEL OPERATING CHARACTERISTICS
Calibration
Before the construction of the Langley Unitary Plan Wind Tunnel was initiated,
the concept of asymmetric movable nozzle blocks was explored and evaluated for the
Mach number range of the low Mach number circuit and was presented in reference 6.
The results of reference 6 indicated that low values of flow angularity and Mach num-
ber variation through the test section could be obtained with the sliding asymmetric
nozzle concept. The actual flow angularities measured in the full-scale facility
were found to be somewhat higher than expected. An investigation into the source of
the flow angularity was made on a 1/16-scale tunnel model in reference 7. It was
found that the angularity was generally the same in both facilities and was due to
nozzle contour. The limited flow-angle data for the full-scale tunnel which were
presented in reference 7 were part of an extensive flow-angle calibration. This sec-
tion presents the flow-angle calibration obtained in 1957 and a Mach number calibra-
tion obtained in 1966-67 for both test sections for the range of facility operating
parameters of general interest. Periodic check calibrations made since these initial
calibrations indicate no significant change in Mach number or flow angle.
Procedure.- The calibration tests of both test sections of the Unitary Plan Wind
Tunnel have been obtained by presetting the lower nozzle block, stabilizing stagnation
pressure and temperature, and using static or pitot-probe measurements to survey Mach
number. Flow angularity was determined by six two-dimensional balance wedge probes
mounted either vertically or horizontally. The details of the survey rake and the
probes are presented in figure 20. Six static and/or six pitot probes were mounted
.... , ! .....:; [ :7::

. . <, _/
f
on the survey rake as shown and the rake was mounted vertically in the test section.
Mach number calibration data were taken with both probes in test section 1 and with
only the pitot probes in test section 2 at a series of longitudinal and lateral sta-
tions. However, to obtain the best accuracy and most repeatable data, the Mach num-
bers below M = 2 were computed from the static pressures and tunnel stagnation
pressure according to the equation
For Mach numbers greater than 2 the pitot pressure and tunnel stagnation pressure
were used to define Mach number according to the equation
Pt \M 2 + 5] \7M 2 - 1
(4)
The calibration Mach number M was determined for each test condition from
results at the five longitudinal center-line survey stations between x : 0 in.
(0 cm) and 48 in. (122 cm). At each survey station an average Mach number was deter-
mlned from the four vertical probe positions closest to the center line (omitting the
top and bottom) by weighing the two probes closest to the center line in full and the
other two probes (z - ±10.8 in. (±27.4 cm)) by one-half. For test section 2, the
calibration Mach number M weighed all five longitudinal stations equally; whereas,
for test section 1 one-half weight was given to longitudinal stations 0 in. and 48 in.
(0 cm and 122 cm) and full weight was applied to the intermediate stations. The flow-
angle probe configuration consisted of a double-wedge segment mounted on a one-
component strain-gage balance as shown in figure 20. The balance output measured
normal load on the wedge surfaces and was calibrated to measure flow angle.
Presentation of data.- Calibration data on the distribution of Mach number are
presented in figures 21 and 22 for test sections 1 and 2, respectively. Calibration
data on the distribution of flow angularity are presented in figures 23 and 24 for
test sections 1 and 2, respectively. Since the geometry of the test sections and
nozzles of the Unitary Plan Wind Tunnel is asymmetric, the large variations of flow
parameters might be expected to exist in the xz-plane. For this reason the Mach num-
ber calibration data are presented primarily as contour plots in the xz-plane with
additional information to indicate lateral, longitudinal, and Reynolds number sensi-
tivity. The longitudinal variation of Mach number can be used to correct test
results for buoyancy effects. The variation of nominal test-section Mach number with
Reynolds number is accounted for in test section 2 by adjusting the nozzle block
position according to table V(b). The calibration data of figures 21 and 22 indicate
generally a variation in Mach number of ±0.01 in the region of the test sections most
used when testing smaller models (i0 in. < x < 30 in. (0.254 m < x < 0.762 m) with
z = ±i0 in. (±0.254 m)). At the higher Mach numbers and for longer models at angles
of attack, the variation of test-section Mach number from the nominal can be as
much as ±0.04 over the test section. The flow-angle calibrations are presented pri-
marily as contour plots of vertical angles in the xz-plane. Vertical and horizontal
flow-angle variations are also presented for center line and lateral positions.
Figures 23 and 24 indicate that the flow in both test sections has an up±low angle
generally Within 0.5 ° • At the higher Mach numbers in test section 1 the up±low angle
can be as large as 1.5 ° within the test region occupied by typical models. The
i0

accuracy of the calibration data is estimated to be within ±0.01 for Machnumber intest section i, ±0.004 for Machnumber in test section 2, and flow angularity towithin ±0.i °. These estimates are based on individual accuracies of static, pitot,and total-pressure measurementsas well as on wedgeprobe-balance and opticalangular-measurementaccuracies.
Test-section boundary layer.- Boundary-layer profiles have been measured on the
tunnel test-section sidewalls over the range of test conditions. The measurements
were obtained by using a rake with 22 tubes (0.050-in. (0.00127-m) outside diameter)
spanning a distance of 6.5 in. (0.1651 m) perpendicular to the sidewall. The loca-
tion of the tubes is indicated in figure 25 which shows typical velocity profiles for
each test section at common conditions. The different lengths and pressure gradients
of the nozzles are reflected in the shape of the sidewall profiles. In figure 26 a
summary of the boundary-layer profile characteristics, including profile exponent
for a turbulent boundary layer N, thickness 6, displacement thickness 6*, and
momentum thickness 0, is presented for several Reynolds numbers and Mach numbers.
The velocities were calculated by assuming the static pressure across the boundary
layer to be constant and equal to free-stream static pressure. The boundary-layer
thickness corresponds to the value of u/u_ of 0.996; and 6*, @, and N were
calculated from equations (6) and (21) of reference 8.
Tunnel moisture effects.- Although the Unitary Plan Wind Tunnel is a closed-
clrcuit pressure tunnel with sufficient makeup air capacity to provide dry air as the
test medium, efficient utilization of the facility requires that the effects of mois-
ture on test conditions be evaluated. A measurement of the static pressure was made
at x : 48.12 in. (122.22 cm) in test section 1 and at x - 44.12 in. (112.06 cm)
in test section 2, with y : 0 in. (0 cm) and z = -i.ii in. (-2.82 cm), for several
Mach numbers and Reynolds numbers over a range of tunnel dew-point values. These
results are presented in figure 27 in terms of the ratio of static pressure to total
pressure or Mach number as computed by equation (3). These results indicate that, in
general, tunnel moisture effects become significant above values of tunnel dew point
(corrected to standard atmospheric pressure) ranging from -20°F (-28.9°C) at the
lower Mach numbers to 20°F (-6.7°C) at the higher Mach numbers.
'H _ j
i}_
Tunnel turbulence level.- Measurements have been made to indicate the turbulence
level of the Unitary Plan Wind Tunnel by using a hot-wire anemometer to determine the
velocity fluctuation in the settling chambers and by measuring the transition
Reynolds number on a smooth i0 ° cone in both test sections. The level of settling-
chamber velocities and fluctuation velocities is shown in figure 28 for different
values of unit Reynolds number and Mach number. These measurements were obtained at
tunnel station 561.33 ft (171.09 m) for test section 1 and at tunnel station
774.65 ft (236.11 m) for test section 2 on the tunnel center line. These turbulence
measurements shown in figure 28 provide some insight into the high-frequency turbu-
lence which would be carried downstream into the test sections. Another indication
of test-section turbulence is obtained by examining the transition Reynolds number
measured on a smooth i0 ° cone. The cone and measurement system used is that of ref-
erence 9 and a photograph of the system is shown in figure 29. The measured transi-
tion Reynolds numbers are presented for both test sections in figure 30 and are co_-
pared with other facilities in figure 31.
Tunnel blockage.- Since the operation of a supersonic duct is dependent on the
overall area ratio, the cross section of the model is critical for a fixed-size test-
section cross-sectional area. Figure 32 gives the theoretical maximum model cross-
sectional area determined from a one-dimensional flow analysis as a function of Mach
number for the Unitary Plan Wind Tunnel. In reality, the theoretical maximum model
ii

- f -:,
i
_ " i¸
, (
" _ . / i/
cross-sectional area indicates successful tunnel operation at a much larger model
size than is possible. The size of some of the larger models tested at the UPWT is
shown as experimental maximum model cross-sectional area over the Mach number range.
The large width of the band of experimental maximum model sizes indicates the uncer-
tainty of model shape, mounting, and attitude effects on blockage.
Tunnel temperature calibration.- The facility can be operated in such a way as
to provide a heat pulse for heat-transfer tests. This mode of operation is described
in detail in a subsequent section. A calibration of the total temperature variation
across test section 2 at station x : 30 in. (0.762 m) is presented in figure 33 as
a function of time from initiation of the heat pulse for several Mach nttmbers. The
total-temperature measurements were obtained by using double-shielded probes contain-
ing a 30-gage iron-constantan thermocouple. The probes were 2 in. (0.0508 m) in
length, and the diameter of the outside shield was 0.4 in. (0.0102 m). The calcu-
lated response time of the probes for a step increase in stagnation temperature at
nominal test conditions is less than 1 sec. The results of figure 33 indicate that
the time required for temperature stabilization after the heat pulse increases with
Mach number to a maximum of approximately 15 sec at a Mach number of 4.44.
Tunnel Operating Characteristics
Operating parameters.- The operating range of test Mach number and Reynolds num-
ber for each of the test sections is presented in figure 34. For any specific Mach
number the upper limit of Reynolds number is established by drive power and
stagnation-pressure limits. The operating range is separated into five areas which
correspond to the five compressor configurations or modes described earlier in this
report. The upper limit of operational Reynolds numbers is established by the over-
load capability of the main-drive system, and the lower limit is an indication of the
supersonic-flow stability characteristics at reduced pressure over the Mach number
range. It should be noted that between compressor modes I-IA and l-II (M _ 2.16
to 2.36) and between modes 2-II and 2-IV (M z 3.75 to 3.83) the compressor configura-
tions are not capable of producing the required tunnel pressure ratio to assure
stable supersonic test conditions in the test section. The tunnel operating regions
shown in figure 34 represent constant temperature operations at 150°F (65.5 °c) in all
compressor modes except mode 2-IV which is for 175°F (79.44°C).
Although most of the tests made in the Langley Unitary Plan Wind Tunnel require
constant temperature operation, the facility has a unique heat-transfer capability.
Because of the tunnel duct configurations and the bypass feature of the heat
exchangers, the facility can be operated in such a way as to provide a heat pulse or
total temperature rise during a finite time interval. The magnitude of the available
total temperature rise and time to stabilize is shown in figure 35 as a function of
Mach number for test section 2. This capability is essentially independent of tunnel
total pressure.
Power characteristics.- Total operating power requirements are presented in fig-
ure 36 for nominal operating temperatures and test Reynolds numbers of 2 x IU 6 per ft
(6.56 x 10⁶ per m) and 4 x 10⁶ per ft (13.12 x 10⁶ per m). The power values of fig-
ure 36 are average measurements for the conditions shown and include the main drive
and auxiliary equipment. In general, the power range required for the auxiliary
equipment ranges from 3 to 5 MW throughout the test range available. Because of the
flexibility of the operational procedures of the facility, the power requirements can
vary from these average numbers. For example, a total temperature reduction of 25°F
(13.89°C) over the nominal test conditions at R = 2 x 10⁶ per ft (6.56 x 10⁶ per m)
12

?,
<
results in a 6-percent reduction in power required. Further power-reduction operating
techniques are discussed in detail in reference 5 along with an analysis of power
requirements of individual compressors at various operating conditions.
CONCLUDING REMARKS
The Langley Unitary Plan Wind Tunnel is a closed-circuit pressure tunnel with
two 4- by 4- by 7-ft (1.22- by 1.22- by 2.13-m) test sections which cover a Mach num-
ber range M from 1.47 to 4.63 and a nominal Reynolds number range from
0.5 x 10⁶ per ft (1.64 x 10⁶ per m) to 8.0 x 10⁶ per ft (26.25 x 10⁶ per m). The
facility has the flexibility to provide continuous variation of Mach number and
tunnel stagnation pressure and temperatures. The Mach number variation is controlled
by asymmetric sliding nozzle blocks and a combination of compressor staging modes.
There exists two regions in the total Mach number range (2.16 < M < 2.36 and
3.75 < M < 3.83) for which stable test conditions cannot be assured. The tunnel
stagnation temperature and pressure are controlled by heat exchangers and auxiliary
pumps and air dryers. The heat-exchanger capability to bypass tunnel air can provide
a stagnation-temperature pulse at constant Mach number and stagnation pressure which
results in a unique heat-transfer test capability for the facility.
The calibration of the test-section flow parameters over the operating range of
the facility indicated that a variation in Mach number of ±0.01 occurred in the area
of the test sections most used when testing smaller models. At the higher Mach num-
bers and for longer models at angle of attack, the variation of test-section Mach
number from the nominal can be as much as ±0.04 over the test region. Both test
sections have a positive or up±low angle generally within ±0.5 °. At the higher Mach
numbers for test section 1 the up±low angle can be as large as 1.5 ° within the test
region occupied by typical models. Tunnel moisture effects become significant above
values of tunnel dew point (corrected to standard atmospheric pressure) ranging from
-20°F (-28.9°C) at the lower test Mach numbers to 20°F (-6.7°C) at the higher Mach
numbers.
Langley Research Center
National Aeronautics and Space Administration
Hampton, VA 23665
August 17, 1981
13

i ¸
REFERENCES
i. Schaefer, William T., Jr.: Characteristics of Major Active Wind Tunnels at the
Langley Research Center. NASA TM X-f130, 1965.
2. National Wind-Tunnel Summary. NASA and Dept. Defense, July 1961.
from Clearinghouse, U.S. Dept. Com.)
(Available
3. Manual for Users of the Unitary Plan Wind Tunnel Facilities of the National
Advisory Committee for Aeronautics. NACA, 1956.
4. Mechtly, E. A.: The International System of Units - Physical Constants and Con-
version Factors. NASA SP-7012, 1964.
5. Hasel, Lowell E.; and Stallings, Robert L., Jr.: Analysis of the Performance of
the Drive System and Diffuser of the Langley Unitary Plan Wind Tunnel. NASA
TM-83168, 1981.
6. Burbank, Paige B.; and Byrne, Robert W.: The Aerodynamic Design and Calibration
of an Asymmetric Variable Mach Number Nozzle With a Sliding Block for the Mach
Number Range 1.27 to 2.75. NACA TN 2921, 1953. (Supersedes NACA RM L50LI5.)
7. Matthews, George B.; and Shirley, John A.: A Comparison of Flow Inclination in
the U. Va. Supersonic Wind Tunnel and the NASA Unitary Plan Wind Tunnel, Test
Section No. i. Rep. No. AST-4026-101-65U (Contract No. NASI-4326), Res. Lab.
Eng. Sci., Univ. of Virginia, June 1965.
8. Allen, Jerry M.: A Simple Method of Calculating Power-Law Velocity Profile
Exponents From Experimental Data. NASA TM X-72000, 1974.
9. Dougherty, N. S., Jr.: Prepared Comment on the Cone Transition Reynolds Number
Data Correlation Study. Flight/Ground Testing Facilities Correlation,
AGARD-CP-187, 1976, pp. 3A-I - 3A-7.
14
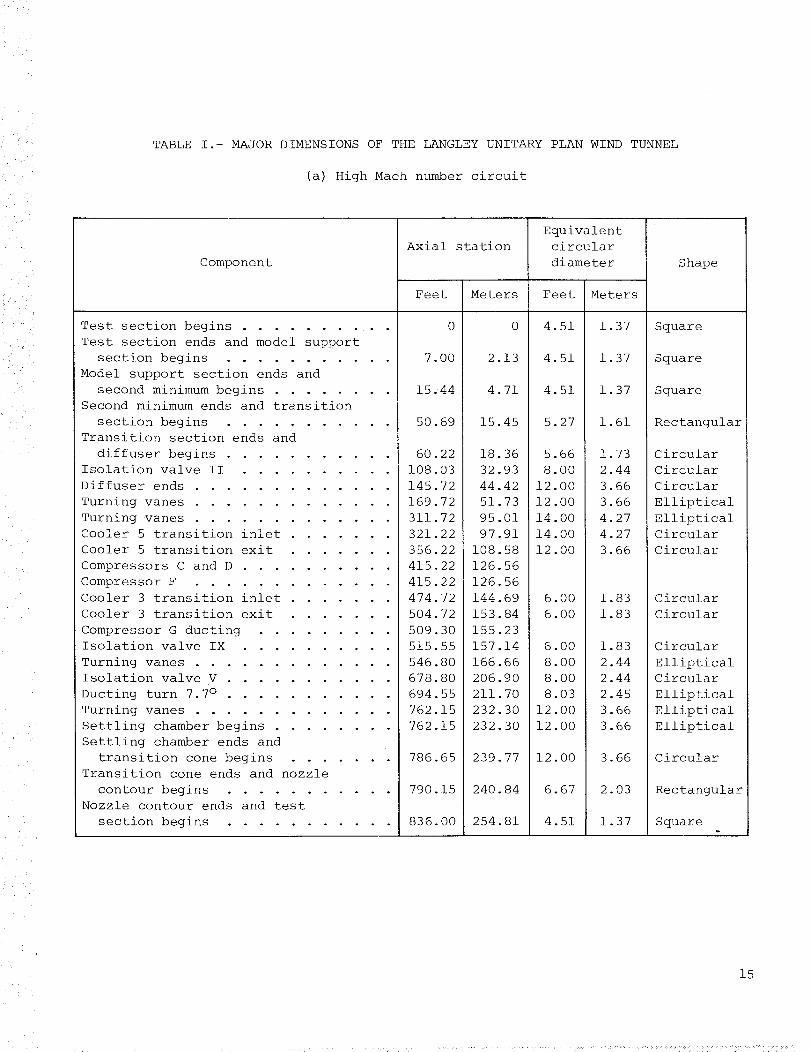
TABLEI.- MAJORDIMENSIONSOFTHELANGLEYUNITARYPLANWINDTUNNEL
(a) High Machnumbercircuit
: ]
ii
_i ? _ C
Component
Test section begins ...........
Test section ends and model support
section begins ...........
Model support section ends and
second minimum begins ........
Second minimum ends and transition
section begins ...........
Transition section ends and
diffuser begins ...........
Isolation valve II ..........
Diffuser ends .............
Turning vanes .............
Turning vanes .............
Cooler 5 transition inlet .......
Cooler 5 transition exit .......
Compressors C and D ..........
Compressor F .............
Cooler 3 transition inlet .......
Cooler 3 transition exit .......
Compressor G ducting .........
Isolation valve IX ..........
Turning vanes .............
Isolation valve V ...........
Ducting turn 7.7 ° ...........
Turning vanes .............
Settling chamber begins ........
Settling chamber ends and
transition cone begins .......
Transition cone ends and nozzle
contour begins ...........
Nozzle contour ends and test
section begins ...........
Axial station
Feet Meters
0 0
7.00 2.13
15.44 4.71
50.69 15.45
60.22 18.36
108.03 32.93
145.72 44.42
169.72 51.73
311.72 95.01
321.22 97.91
356.22 108.58
415.22 126.56
415.22 126.56
474.72 144.69
504.72 153.84
509.30 155.23
515.55 157.14
546.80 166.66
678.80 206.90
694.55 211.70
762.15 232.30
762.15 232.30
786.65 239.77
790.15 240.84
836.00 254.81
Equivalent
circular
diameter
Feet
4.51
4.51
4.51
5.27
5.66
8.00
12.00
12.00
14.00
14.00
12.00
6.00
6.00
6.00
8.00
8.00
8.03
12.00
12.00
12.00
6.67
4.51
Meters
1.37
1.37
1.37
1.61
1.73
2.44
3.66
3.66
4.27
4.27
3.66
1.83
1.83
1.83
2.44
2.44
2.45
3.66
3.66
3.66
2.03
1.37
Shape
Square
Square
Square
Rectangular
Circular
Circular
Circular
Elliptical
Elliptical
Circular
Circular
Circular
Circular
Circular
Elliptical
Circular
Elliptical
Elliptical
Elliptical
Circular
Rectangular
Square
15
TABLEI.- Continued
(b) Compressor I circuit
ii/
Component
Cooler 5 .............
Isolation valve XX ..........
Turning vanes .............
Compressor I ............
Cooler 6 inlet ...........
Cooler 6 exit ...........
Isolation valve VII ..........
Turning vanes ...........
Low Mach number circuit ........
Axial station
Feet Meters
0 0
18.73 5.71
35.73 10.89
84.04 25.62
107.96 32.91
139.91 42.64
192.04 58.53
200.09 60.99
225.35 68.69
Equivalent
circular
diameter
Feet
6.00
7.14
6.00
7.00
7.00
7.00
Meters
1.83
2.18
1.83
2.13
2.13
2.13
Shape
Circular
Elliptical
Circular
circular
Circular
Elliptical
(c) Compressor E exit air to compressor F
Component
Compressor E duct ...........
Turning corner, 15 ° ..........
Isolation valve XII ..........
Compressor F ..............
Axial station
Feet Meters
0 0
4.38 1.34
7.21 2.20
72.30 22.04
Equivalent
circular
diameter
Feet
6.03
6.00
Meters
1.84
1.83
Shape
Elliptical
Circular
16

i/
•; i % %:/.
TABLE I.- Concluded
(d) Compressor E circuit
Component
Low Mach number circuit .........
Turning corner, 32.9 ° .........
Isolation valve XIII .........
Compressor E .............
Turning corner center line, 9.8 °
Cooler 2 inlet ............
Cooler 2 exit .............
Turning corner, 9.8 ° .........
Isolation valve XIV ..........
High Mach number exit duct and
isolation valve VIII ........
Turning vanes .............
Low Mach number circuit ........
Axial station
Feet Meters
0 0
17.75 5.41
57.02 17.38
99.02 30.18
124.57 37.97
126.45 38.54
162.57 49.55
162.90 49.65
191.15 58.26
205.32 62.58
215.57 65.71
253.24 77.19
Equivalent
circular
diameter
Feet Meters
7.64 2.33
7.00 2.13
6.82 2.08
7.00 2.13
7.00 2.13
7.05 2.15
7.00 2.13
7.00 2.13
7.00 2.13
Shape
Elliptical
Circular
Elliptical
Circular
Circular
Elliptical
Circular
Circular
Elliptical
(e) Compressor G circuit
Component
Compressor G exit duct ........
Cooler 4 inlet ............
Cooler 4 exit .............
Isolation valve X ...........
Turning corner, 46 ° ..........
High Mach number circuit .......i
Axial station
Feet Meters
0 0
28.25 8.61
58.25 17.75
75.00 22.86
105.63 32.20
127.97 39.01
Equivalent
circular
diameter
Feet
5.00
4.00
4.00
4.17
Meters
1.52
1.22
1.22
1.27
Shape
Circular
Circular
Circular
Elliptical
(f) Compressor F exit air to compressor G
Component
Compressor F duct ...........
Isolation valve XI ..........
Turning corner, 30 ° ..........
Compressor G .............
Axial station
Feet Meters
0 0
14.75 4.50
70.96 21.63
98.43 30.00
Equivalent
circular
diameter
Feet Meters
4.00 1.22
4.07 1.24
Shape
Circular
Elliptical
17

ii/ i_
>
<
i < i¸•<¸
TABLE II.- MAJOR DIMENSIONS OF THE LOW MACH NUMBER CIRCUIT OF THE
LANGLEY UNITARY PLAN WIND TUNNEL
Component
Test section begins ...........
Test section ends and model
support section begins .......
Model support section ends and
second minimum begins ........
Second minimum ends and
transition section begins ......
Transition section ends and
diffuser begins ...........
Diffuser ends .............
Isolation valve I ...........
Turning vanes .............
Main tunnel intersection .......
Turning vanes .............
Cooler 5 transition inlet .......
Cooler 5 transition exit .......
Compressors C and D ..........
Cooler 1 transition inlet .......
Cooler 1 transition exit .......
Compressor E inlet ducting ......
Isolation valve IV ..........
Compressor E outlet ducting ......
Turning vanes .............
Turning vanes .............
Axial station
0
Feet
7.00
15.45
50.70
59.45
144.95
147.33
155.95
174.33
236.33
245.83
280.83
339.83
346.65
408.08
425.83
434.21
455.83
473.33
548.33
.33
573.33
580.33
616.38
Settling chamber begins ......... 548
Settling chamber ends and
transition cone begins .......
Transition cone ends and
nozzle contour begins ........
Nozzle contour ends and
test section begins .........
Meters
2.13
4.71
15.45
18.12
44.18
44.91
47.53
53.14
72.03
74.93
85.60
103.58
105.66
124.38
129.79
132.35
138.94
144.27
167.13
167.13
174.75
176.88
187.87
Equivalent
circular
diameter
Feet Meters
4.51 1.37
4.51 1.37
4.70 1.43
5.27 1.61
5.66 1.73
12.00 3'.66
12.00 3.66
12.00 3.66
12.00 3.66
14.00 4.27
14.00 4.27
12.00 3.66
4.00 1.22
i0.00 3.05
i0.00 3.05
I0.00 3.05
11.67 3.56
12.50 3.81
15.00 4.57
15.00 4.57
15.00 4.57
4.51 1.37
4.51 1.37
Shape
Rectangular
Rectangular
Rectangular
Rectangular
Circular
Circular
Circular
Elliptical
Elliptical
Circular
Circular
Circular
Circular
Circular
Circular
Circular
Circular
Elliptical
Elliptical
Elliptical
Circular
Rectangular
Rectangular
• 18

L
<
....•<i <ii<i•• ••ii!i • if••</iiii!il•¸>•• _ • _ • _ i •<
_D
TABLE III.- CONTOURED-NOZZLE
x I, in. z I, in. x I, cm z I, cm
-375.415 -142,500 -953,554 -361,950
-317.580 -78,789 -806.653 -200,12%
-316.915 -78.081 -804.964 -198.326
-312.915 -74.321 -794.804 -188.775
-308.915 -71.148 -784°644 -180.716
-304.915 -68.356 -774.484 -173.624
-300.915 -65.852 -764.324 -167.264
-296.915 -63.568 -754.164 -161.463
-292.915 -61.476 -744.004 -156.149
-288.915 -59.556 -733.844 -151.272
-284.915 -57°796 -723.684 -146.802
-280.915 -56.177 -713.524 -142.690
-276.q15 -54.673 -703.364 -138.869
-272,915 -93,262 -693,204 -135,285
-268.915 -51.915 -683.044 -131.864
-264.915 -50.583 -672.884 -128.481
-260.915 -49.268 -662.724 -125.141
-256.915 -47.944 -692.564 -121.778
-256.186 -47.705 -650.712 -121.171
-241.160 -42.770 -612.546 -108.636
-240.160 -42.442 -610.006 -I07.803
-239.160 -42.115 -607.466 -i06.972
-238.160 -41.789 -604.926 -i06.144
-237.]60 -41.464 -602.386 -105.319
-231.447 -39.608 -587.875 -100.604
-229.8gi -39.1C5 -583.923 -99.327
-227.891 -38.463 -578.843 -97.696
-225.891 -37.834 -573.763 -96.098
-223.891 -37.216 -568.683 -94.529
-221.8gi -36.612 -563.603 -92.994
-219.891 -36.024 -558.523 -91.501
-217,891 -35,454 -553,443 -90,053
-215.891 -34.906 -548.363 -88.661
-213,891 -3_,379 -543,283 -87,323
-211.891 -33.877 -538.203 -86.048
-209.891 -33.401 -533.123 -84.839
-207.891 -32.949 -528.043 -83.690
-205.891 -32.520 -522.963 -82.601
-203.891 -32.112 -517.883 -81.564
-201.891 -31.724 -512.803 -80.579
-199.891 -31.350 -507.723 -79.629
-197.891 -30.991 -502.643 -78.717
-195.891 -30.64_ -497.563 -77.836
-193.891' -30°307 -%92.483 -76.980
-191.891 -29.982 -487.403 -76.15%
WALL COORDINATES
(a) Lower block
FOR TEST SECTION i
x I, in. z I, in. Xl, cm Zl, cm
-189,891 -29,667 -%82.323 -75.354
-187.891 -29,363 -477.243 -74°582
-185.891 -29.070 -472.163 -73.838
-183.891 -28.787 -467.083 -73.119
-181.891 -28.514 -462.003 -72.426
-179.891 -28.251 -456.923 -71.758
-177.891 -27°996 -451,843 -71.110
-175.891 -27.750 -446.763 -70.485
-173.891 -27.514 -441.683 -69.886
-171.891 -27.288 -436.603 -69.312
-169.891 -27.071 -%31.523 -68.760
-167.891 -26.863 -426.443 -68.232
-165.891 -26.665 -421.363 -67.729
-163.891 -26.474 -416.283 -67.24%
-161.891 -26.292 -411.203 -66.782
-159.891 -26,118 -406.123 -66.340
-157.891 -25.952 -401.0%3 -65.918
-155.891 -25,794 -395,963 -65,517
-153.891 -25.643 -390.883 -65.133
-151.891 -25.500 -385.803 -64.770
-149.891 -25.364 -380.723 -64.425
-147.891 -25.235 -375.6%3 -64.097
-145.891 -25.113 -370.563 -63.787
-143.891 -25.000 -365.483 -63.500
-1%1.891 -24.894 -360.403 -63.231
-139.891 -24.795 -355.323 -62,979
-137.891 -24.702 -350.243 -62.743
-135.891 -24.614 -345.163 -62.520
-133,891 -24,533 -3%0,083 -62,314
-131,891 -24,456 -335,003 -62,118
-129.891 -24.387 -329.923 -61.943
-127.891 -24.325 -324.843 -61.785
-125.891 -24.271 -319.763 -61.648
-123.891 -24,223 -314.683 -61,526
-121.891 -24.180 -309.603 -61.417
-119.891 -24.142 -304,523 -61.321
-117.891 -24.109 -299.443 -61.237
-i15.891 -24.079 -294.363 -61.161
-113.891 -24.054 -289.283 -61.097
-111.891 -24,034 -284.203 -61,046
-i09.891 -24.019 -279.123 -61.008
-107.891 -24.009 -274.043 -60.983
-105.891 -24.003 -268.963 -60.968
-103.891 -24.000 -263.883 -60,960
229.085 -24.000 581.876 -60.960

Li_
• L
0
TABLE III.- Continued
(b) Upper block
Xl, in.
-432,625
-334,375
-331,625-327,625
-323.625
-319,625-315,625
-311,625-3C7.625
-303,625
-299,625
-295.625-291,625-289,625
-287,625-285,625--283,625
-281,625
-279,625
-277,625-275,625
-273,625
-271.625
-269.625-267,625
-265,625-263,625-261,625-259,625-257.625-255,625-253.625-251.625-249,625-249,125,
Zl, in. Xl, cm Zl, cm Xl, in.
-4,375 -I098,868 -11,113 -247,625
-39,240 -849,313 -99,670 -180,625
-40,206 -842,328 -102,123 -173,625
-41.530 -832,168 --105,486 --171,625-42,5C4 -822,007 -107.960 -169,625
-43,100 -811,848 -109,474 -167,625-43,398 -801,688 -ii0,231 -165,625
-43,546 -791,528 -ii0,607 -163,625
-43,614 -781,368 -110,780 -161,625-43,622 -771,208 -II0,800 -159,625
-43,568 -761,048 -110,663 -157,625
-43,432 -750,888 -II0.317 -155,625
-43,178 -740,728 -109,672 -153,625-42.980 -735,648 -109,169 -151,625
-42,743 -730,568 -i08,567 -149,625-42.466 -725,488 -i07,864 -147,625-42,149 -720,408 -107,058 -145,625
-41,794 -715,328 -i06,157 -143,625
-41o400 -710,248 -105,156 -141,625
-40,966 -705,168 -104,054 -139,625-40.492 -700,088 -102,850 -137,625
-39,979 -695,008 -101,547 -135,625
-39,428 -689,928 -100,147 -133,625
-38,848 -684,848 -98,674 -131,625
-38.251 -679,768 -97,158 -129,625-37,642 -674,688 -95.611 -127,625-37,024 -669,608 -94,041 -125,625
-36.398 -664.528 -92,451 -123.625-35,766 -659,448 -90,846 -121,625
-35,129 -654,368 -89,228 -119,625
-34,488 -649,288 -87,600 -117.625
-33.844 -644,208 -85,964 -115,625
-33,198 -639,128 -84,323 -113,625-32,550 -634,048 -82,677 -IIi,625
-32.387 -632.778 -82,263 -109,625
Zl, in.
-31,900-10,130
-7,856-7,206-6,556-5,906-5,257-4,608-3,961
-3,315
-2,670
-2.026-1,384
-,745
-,i09,522
1,148
1,766
2,3772,978
3.5684,147
4,7145,272
5,8186.3526,8757,3887.889
8,380
8,8599,328
9,786
10,234
i0,672
Xl, cm
-628,968-458,788
-441,008
-435,928-430,848
-425,768-420,688-415,608
-410,528
-405,448
-400,368-395,288
-390,208
-385,128
-380,048-374,968
-369,888-364,808-359,728
-354,648
-349,568-344,488
-339,408-334,328
-329,248-324.168-319,088-314,008
-308,928
-303,848-298,768
-293,688-288,608-283,528-278,448
Zl, cm
-81,026
-25,730
-19.954-18,303
-16,652
-15,001-13,353
-11.704
-I0,061-8,420-6,782
-5,146-3.515-1.892
-,2771,3262,9164,4866,038
7.5649,063
I0,533
ii,974
13o391
14.778
16,13417,463
18,76620,03821,28522,50223,69324.85625,994
27,107

/
< i >" •• v _: i
bO
TABLE III.- Concluded
x l, in. z l, in. x I, cm z l, cm
-i07,625 11,100 -273,368 28,194
-105,625 11,517 -268,288 29,253
-103,625 11,925 -263,208 30,290
-101,625 12,322 -258,128 31,298
-99,625 12,710 -253,048 32,283
-97,625 13,088 -2%7.968 33,244
-95,625 13,456 -242,888 34,178
-93,625 13,816 -237,808 35,093
-91,625 14,168 -232,728 35,987
-89,625 14,512 -227,6%8 36,860
-87,625 14,848 -222,568 37.714
-85,625 15,175 -217,488 38,545
-83,625 15,496 -212,%08 39,360
-81,625 15,811 -207,328 40,160
-79,625 16,119 -202,248 %0,942
-77,625 16,421 -197,168 41,709
-75,625 16,714 -192,088 42,454
-73,625 17,001 -187,008 43,183
-71,625 17,280 -181,928 43,891
-69,625 17,553 -176,848 %4.585
-67,625 17,819 -171,768 45,260
-65,625 18,078 -166,688 45,918
-63,625 18.331 -161,608 46,561
-61,625 18,577 -156,528 47,186
-59,625 18,817 -151,448 47,795
-57,625 19,051 -146,368 48,390
-55,625 19,278 -141,288 48,966
-53,625 19,500 -136,208 49,530
-51,625 19,716 -131,128 50,079
-49,625 19,926 -126,048 50.612
-47,625 20,130 -120,968 51,130
-45.625 20.328 -115.888 51,633
-%3,625 20,520 -Ii0,808 52.121
-41.625 20.706 -105.728 52.593
-39.625 20,887 -i00,648 53.053
-37,625 21,061 -95,568 53,495
-35,625 21,230 -90,488 53.924
-33,625 21,394 -85,408 5%,341
T
(b) Concluded
Xl, in. Zl, in. Xl, cm Zl, cm
-31.625 21.553 -80,328
-29.625 21.707 -75.248
-27,625 21.855 -70,168
-25,625 21,998 -65,088
-23,625 22,135 -60,008
-21.625 22,267 -54.928
-19.625 22. 394 -49,848
-17.625 22,516 -44,768
-15,625 22,632 -3 9.688
-13,625 22.744 -34.608
-11.625 22.851 -29,528
-9,625 22.953 -24.%48
-7,625 23,049 -19,368
-5,625 23.141 -14,288
-3,625 23,227 -9,208
-1,625 23.310 -4,128
,375 23.388 ,953
2.375 23,461 6.033
4,375 23.530 II,i13
6,375 23,594 16,193
8.375 23,653 21.273
10,375 23,707 26,353
12.375 23.756 31,433
14,375 23,800 36,513
16,375 23,841 41,593
18.375 23,878 46.673
20.375 23,909 51.753
22,375 23,936 56,833
24.375 23,958 61,913
26.375 23.975 66.993
28,375 23.987 72,073
30,375 23,996 77,153
32,375 23,998 82,233
34,375 23.999 87,313
35,375 24.000 89.853
73,375 2%,000 186,373
98,b56 28,000 250,586
185,375 28.000 470,853
54.745
55.136
55.512
55.875
56.223
56,558
56,881
57,191
57,485
57,770
58.042
58.301
58,544
58.778
58,997
59,207
59.k06
59,591
59,766
59.929
60,079
60,216
60.340
60.452
60,556
60,650
60,729
60,797
60,853
60.897
60.927
60.950
60.955
60,957
60.960
60,960
71.120
71.120

Do
TABLE IV.- CONTOURED-NOZZLE WALL COORDINATES FOR TEST SECTION 2
(a) Lower block
x2,in.
-541.545-502,489
-501.545
-499.545-497.545
-495,545
-493.545
-491.545-489.545
-487.545
-485.545-483,545
-481.545
-479,545
-477.265
-460,145-454,917
-449,688
-444,460
-639.232
z2,in.
-102.000-44,914-43,645-41.531-3q.931-38.613-37,505-36.560-35,744
-35.036
-34. 408
-33,854-33,357
-32,901
-32,409
-28,849-27,, 814
-26.951
-26,260-25.721
x2,cm z2,cm x2,in, z2,in.
-1375.524 -259,080 -434.004 -25,298-1276.322 -114.082 -428.775 -24.971
-1273.924 -ii0,858 -423,547 -24,710
-1268.844 -I05.489 -418.319 -24,505
-1263,764 -101,425 -413,091 -24,353-1258,684 -98.077 -407.862 -24.245
-1253,604 -95,263 -402,63% -2%,178
-1248,524 -92,862 -397.406 -24,151-I 243,444 -90. 790 -3 92. 177 -24,1 50
-1238,36% -88,986 -386,949 -2% ,162
-i 233,284 -87. 396 -3 81.72 1 -24. 178
-1228,204 -85.989 -376,%93 -2 4,194-1223,124 -84,727 -371,264 -24,2 II
-1218,044 -83,569 -366.036 -24.229
-1212.253 -82,319 -360,808 -24,248
-I168,768 -73.276 -355.580 -24.268-1155,489 -70,648 -324,210 -24,391
-I142,208 -68,456 -308,525 -24,459
-1128.928 -66,700 95,980 -26,251-1115.649 -65,331
x2,c_
-1102.370
-1089,089
-1075.809-1062.530
-1049.251-1035,9169
-1022.690
-1009,411
-996.130-982,850
-969,571
-956,292
-943,011
-929.731-916,452
-903.173
-823,493-783,654
243.789
z2,cm
-64,257-63.426-62,763-62.243-61.857
-61,582
-61,412-61,344
-61,341
-61,371
-61,412-61.453
-61,496-61,542--61,590--61,661
--61,953
-62,126-66,678

x2,in.
-550,125-502,895-502,125-500,125-498,125-_96,125-494,125-492,125-490,125
-489,413
-488,125-486,125
-484.125
-482,125-480,125-478.125
-476.125-473,865
-462,125
-456,897
-451,668-446,440
-441,212
-435,984
-430,755-425.527
-420.299
-415.071-409,842
z2,in
3,000-28.109
-28.587
-29.587-30,299
-30,799
-31,129-31,325
-31.409-31.417
-31 ,395
-31.298
-31.124
-30,880-30,578
-30,230-29.843
-29,377-26,862-25,742-24,623-23.503-22,383-21,262-20,142-19,020-17,899-16,777-15.654
x2,cm
-1397,318
-1277,353-1275,398
-1270,318
-1265,238
-1260,158-1255,078-1249,998
-1244,918-1243,109
-1239,838
-1234.758-1229,678
-1224,598-1219,518-1214.438
-1209,358-1203,617-1173,798-1160,518-1147,237-1133,958-1120,678-1107,399-1094,118-I080,839
-I067,559
-1054,280-I040.999
TABLE IV.- Concluded
(b) Upper block
z2,cm
7,620-71,397
-72,611
-75,151
-76.959-78,229
-79,068-79.566
-79,779
-79,799
-79,743-79,497
-79,055
-78,435-77,668
-76,784
-75,80 1-74,618
-68,229-65,385-62,542-59,698
-56,853
-54,005
-51,161-48,311
-45,463-42,614-39,761
x2,in
-604,614
-399,386
-394,157-388,929
-383,701
-378,4731373,244-368,016-362,788-357,560-326,190-296,820-279,136
-247,766-232,081
-200,711-169,362
-137,972
-122,287-g0,918
-75,233-63,863-12,494
18,87634,56150,24683.250
185,250
z2,in
-14,531-13,407
-12.283
-11.158
-i0,033-8.908
-7,782
-6.655-5.530
-4.4201,5836,5968,816
12,56714,21317,16619,65621,615
22,39423,69424,22525,06325,62425,90125.96226,01526,12128.000
x2,cm
-i027.720-I014,640
-I001,159
-987,880
-974,601-961,321
-948,040
-934,761-921,482-908. 202-828,523-748,843
-709,005
-629,326-589,486-509,806-430,129-350,449
-310,609
-230,932-191,092-111.412
-31.735
47,945
87,785127,625211,455470,535
z2,cm
-36.909-34,054-31,199-28,341-25,484-22.626-19,766-16,904-14,046
-11,2274,021
16,754
22.39331.92036,101
43,60249,92154,90256,88160.18361,53263,66065,08565,78965,943
66,078
66.34771,120
bo
(.o

TABLE V.- VARIATION OF MACH NUMBER WITH
POSITION OF LOWER NOZZLE BLOCK
(a) Test section 1
Mach
number
1.469
1.50
1.55
1.60
1.65
1.70
1.75
1.769
1.80
1.85
1.90
1.95
2.00
2.05
2.10
2.15
2.160
2.20
2.
2.
2.
2.
2.
2.
25
30
35
354
40
45
2.50
2.540
2.55
2.60
2.65
2.70
2.75
2.80
2.85
2.869
BlOck
position
230
253
292
333
372
414
456
472
498
539
58O
620
660
698
735
771
777
806
840
872
903
907
933
962
990
I011
1016
i041
1064
1087
1108
1128
1148
1155

_!ii<i_
i ¸ _r
M
2.25
2.30
2.35
2.40
2.45
2.50
2.55
2.60
2.65
2.70
2.75
2.80
2.85
2.90
2.95
3.00
3.05
3.10
3.15
3.20
3.25
3.30
3.35
3.40
3.45
3.50
3.55
3.60
3.65
3.70
3.75
3.80
3.85
3.90
3.95
TABLE V.- Continued
(b) Test section 2
Block position for R x 10 -6 per ft (per m) of -
0.5
(1.64)
12 349
12 845
13 324
13 785
14 228
14 654
15 062
15 451
15 817
16 168
16 503
16 823
17 129
17 420
17 697
17 955
18 201
18 435
18 658
18 871
19 073
19 266
19 449
19 623
19 789
19 947
20 096
20 238
20 373
20 502
20 624
20 740
20 851
20 956
21 055
1.0
(3.28)
12 272
12 765
13 241
13 700
14 141
14 564
14 971
15 360
15 729
16 082
16 419
16 741
17 049
17 347
17 622
17 880
18 125
18 358
18 580
18 791
18 995
19 190
19 375
19 551
19 718
19 877
20 029
20 173
20 310
20 441
20 565
20 683
20 795
20 902
21 003
2.0
(6.56)
12 172
12 658
13 146
13 607
14 050
14 476
14 885
15 277
15 648
16 002
16 341
16 665
16 975
17 270
17 551
17 813
18 058
18 292
18 514
18 726
18 932
19 129
19 318
19 497
19 668
19 830
19 984
20 129
20 266
20 397
20 521
20 639
20 751
20 858
20 960
3.0
(9.84)
12 130
12 629
13 ll0
13 574
14 020
14 448
14 859
15 253
15 624
15 978
16 317
16 640
16 949
17 244
17 525
17 787
18 031
18 264
18 486
18 698
18 903
19 102
19 291
19 471
19 642
19 805
19 960
20 107
20 245
20 376
20 501
20 620
20 734
20 841
20 944
4.0
(13.12)
12 ll3
12 609
13 089
13 550
13 994
14 421
14 831
15 223
15 596
15 952
16 293
16 618
16 929
17 225
17 508
5.0
(16.41)
12 082
12 580
13 060
13 523
13 968
14 396
14 807
15 200
15 574
15 931
16 273
16 599
16 911
17 208
17 491
17 772
18 017
18 251
18 473
18 685"
18 890
19 089
19 279
19 459
19 630
19 793
19 948
20 095
20 233
20 364
20 489
20 607
20 720
20 828
20 930
17 756
18 000
18 233
18 455
18 666
18 870
19 069
19 259
19 440
19 612
19 775
19 931
20 078
20 217
20 349
20 474
20 593
20 707
20 815
20 918
6.0
(19.69)
12 063
12 561
13 040
13 503
13 947
14 374
14 784
15 177
15 552
15 910
16 253
16 580
16 892
17 190
17 475
17 741
17 987
18 221
18 445
18 657
18 861
19 059
19 248
19 427
19 598
19 760
19 914
20 061
20 201
20 334
20 460
20 581
20 695
20 804
20 908
25

• i
TABLE V.- Concluded
(b) Concluded
_ i•Block position for R x 10 -6 per ft (per m) of -
M0.5 1.0 2.0 3.0 4.0 5.0 6.0
(1.64) (3.28) (6.56) (9.84) (13.12) (16.41) (19.69)
4.00
4.05
4.10
4.15
4.20
4.25
4.30
4.35
4.40
4.45
4.50
4.55
4.60
21 149
21 239
21 325
21 403
21 474
21 542
21 606
21 668
21 099
21 190
21 277
21 360
21 437
21 511
21 581
21 648
21 057
21 150
21 238
21 323
21 402
21 478
21 550
21 618
21 041
21 134
21 223
21 307
21 387
21 463
21 535
21 605
21 027
21 120
21 208
21 293
21 373
21 450
21 524
21 594
21 016
21 109
21 197
21 281
21 362
21 439
21513
21 584
21 731
21 796
21 858
21 917
21 973
21 712
21 775
21 834
21 891
21 945
21 683
21 747
21 807
21 865
21 921
21 670
21 734
21 794
21 852
21 907
21 661
21 725
21 785
21 842
21 897
21 651
21 714
21 774
21 832
21 886
21 006
21 099
21 188
21 273
21 354
21 431
21 505
21 575
21 642
21 706
21 766
21 824
21 879
_ i_
i •
26

k Hk' A
7 %
TABLE VI .- VARIATION OF SECOND-MINIMUM CONTRACTION RATIO
WITH NOZZLE BLOCK POSITION FOR TEST SECTION 2
: (
• <iiiiii<iiiiiilliiii__
Nozzle block position
12 60o14 350
16 500
17 I00
17 650
18 i00
18 6O0
18 95O
19 300
19 700
2O O5O
20 400
20 500
20 750
20 950
21 370
21 700
21 950
Contraction ratio
1.186
1.214
1.248
1.255
1.261
1.292
1.306
1.311
1.321
1.325
1.332
1.339
1.346
1.423
1.431
1.439
1.449
1.582
• L/f
b
27

_O00
©©
Figure i.- Photograph of the Langley Unitary Plan Wind Tunnel.
L-72-607

Cooling tower
Dry-air storage spheres
3tarting motor-
Makeup air
equipment
F Compressor
lineup
m Main-drive motorHigh Mach number test section
-- Low Mach number test section
50
<O
Figure 2.- Schematic drawing of the Langley Unitary Plan Wind Tunnel.

L,,J
0
Valve
Vo Ive
Valve
valve I2"
Cooler 4
G
F
E
D Compressor E circuit (Table I(d))I_ Compressor G circuit (Table [(e))I_ Compressor F to G circuit (Table I(f))
D
Cooler 5
Cooler IC
I
Valve ZZ:
Airflow
Test section 2 Valve TT
1Sta. 0
(a) High Mach number circuit. See table I(a).
Figure 3.- Arrangement of the Langley Unitary Plan Wind Tunnel.
Ii
I
i

volve _-
[] Compressor I circuit (Table I(b))
Volve
Valve @llZ'vm valve _ Cooler2
vo Ive
Cooler 6
/alve
Test seclion !
ISto. 0
Airflow
(b) Low Mach number circuit. See table II.
Figure 3.- Concluded.

5o
OO
O
L-78-3565
Figure 4.- Photograph of tunnel duct juncture and turning vanes downstream of valve I.
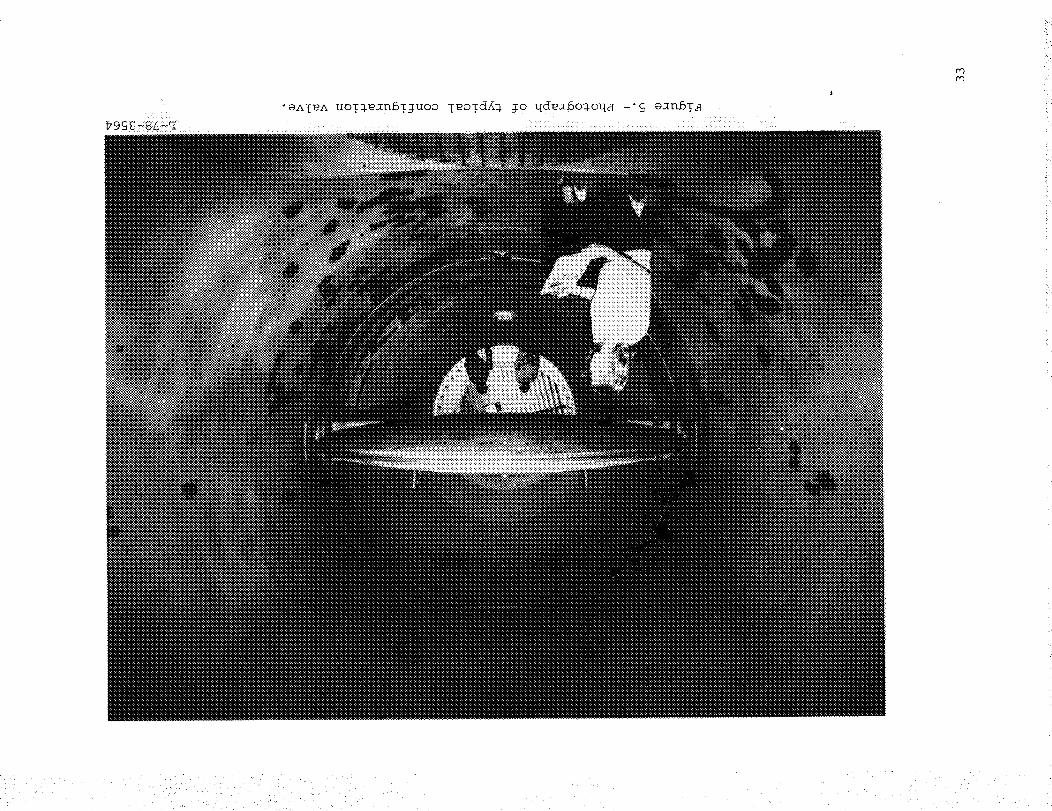
iiiiii
! !
eQ
:_ : i! • '

L•_,
tm
Figure 6.- Photograph of settling chamber and transition to nozzle
looking downstream in test section i.
L-78-3562

-oxn%ana_sxodnspue 'sZaoIq oIZZOU 'I uoT_aos %so_ 9o Mo_n. poPoidxz -'L oxn6_£, m

0_
+:+:+:+x+ _+_Lx+ _L_L_L_+:+_L:+:+X+:+X':+_L_L_L:_:+:+:+_+XLX+ _L_L_L_L_+X+X+ __L_L_L_L:L_+_L_L_L_L_L__L_L_ZL__L_L_L_L_L_L_L_+_L_L_L_L__L_L_+_+_L_L_ZL__L__L____ZZ__L_L_L_L_L___LZ_ZZZZL__L__L_L__L_L_L_L_•_ZL_______•___L__L_L__ZLZ__LZL_L_ZL_•ZZ___L_L___L:L_L_L_L_L_L_L_L_L_L_L_LZZ_L_L_L_L_L_L____L_L_L___Z_L_Z_Z__•__•_•_•_•_•__•_•_•_•_•_•_•_•_•_•_•_•_•_•__•_•_•__•Z•_______•__•_•_•__<<<<<<<<< _<<<<<<<<<<< __<_ _ ___ _ ____<_<<<<<
iiiiiiiiiiiiiiiiiiiiiiiiiiiiiiiiiiiiiiiiiiiiiiiiiiii_iiiiiiiiiiiiiiiiiiii__iiiii!ii__i_i_i_i_iiiiiiiiiiiiiiiiiiiiiiiiiiiiiiiiiiiiiiiiiiiiiiiiiiiiiiiiiiiiiiiiiiiiiiiiiiiiiiiiiiiiiiiiiiiiiiiiiii_iiiiiiiiiiiiiiiiiii_iiiiiiiiiiiiiiiiiiiiiiiiiiiiiiiiiii_iii_iiiiiii_iiiiiiiiiiiiiiiiiiiiiiiiiiiiiiiiiiiiiiiiiiiiiiiiii iiiiiiiiiiiiiiiiiiiiiiiiiii iiiiiiiiiiiiiiiiiiiiiiiiiiiiiiiiiii!iii!iiiiiiiiiiiiiiiiiiiiiiiiiiii iiiiiiiiiiiiiiiiiiiiiiiiiiiiiiiiiiiiiiiiiiiii!iiiiiiiii iiiiii iii iiiiiiiiiiiiiiiiiiiii iiiiiiiiiiiiiiiiiiiiiiiiiiii iiiiiiiiiiiiiiiiiiiiiiiiiiiiiiiii iiiiiiiiiiiiiii iii i iiiiiiiiiiiiiiiiiiiiiiiiii_iii_!!!_i_i_!i_!_ii_iiiii_iii_i_iiiiii_iiii_i_i_i_iiiiiiiii_iiii!i_iiii_iiiii_iiiiiiiiiiiiii_ii_i_i_i_ii_iii_iiiiiiiiiiiiiii_iiiiiii!!!_iiiiiiiiiiiiii!_!!_!i!_i_!i!iiiiiiiiiiiii_!_iiiiiiiiii_i_iiiiiiiiiiiii_i_!!i!!!!_!i_iiiiiiiiiiiiiiiiiii_iii_i_iii_iiiiiiiiii_iiii_iiiiiiiiiiiiiiiiiiiiiii_iiiiiiiii_ii_iiiiiiiii_iiiiiiiiiiiiiiiiiiiiiiii_iiiiiiiiiiiiiiiii!i_i_iiiiiiiii_iii_iiiiiiiiiiiiiiiiiii_i_!i!i!_!i_i_i_ii_iiii!iii_i_iiiiiiiiiiiiiiiiiiiiiiiiiiiiiiiiiiiiiiiiiiii
i ! !! !i!i!i iiiiiii iiiiiiiiiiii ii iiii i! i!iiiii!!i i i i ! ii iiiiiiiii!iii i iiiiiiiiiii iiiiii!!i!i i!i!i!i!!!i!!ii!! !!! !ii !i! i!ii i ii i i iii! i!i! ii iiiii ii! iiiiiiiiiiii!i iii i i !ii iiii iiiiiii!i iiiiii ii i ii!i iii iiiiiiiiiiiiii!iiiiiii i ii ii i iii iiiiiii!!iiii !i!i! ! ! ! ! ii!i! ! i ! !!!! iiiiii!! iiii ii iii iiiiiii iiiiiiii ! iiiiiiiiiiiiiiiiiiii i i i iiiiiiiiiiiiiii iiiii ! iiii! ii!iiiii!i!iiiii ii i!i!i iiiii i i i i iiiiiiiiiiiiiiiiiiiiiiiiiiiiiiiiiiiiiiiiiiiiiiiiiiiii iiiiiiiiiiii!iiiiii!ii!i
_______________________________________________________________________________________________________________________________________________________________________________________________________________________________________________________________________________________________________________________________________________________________________________________________________________________________________________________________________________iii_iii_i_ii__ _ •_ • • _
!i_iiiiiiii_i_iiiiiiii_i_iiiii!_ii!i!_ii_iiiiiiiiiiiiiiiiiiiiiii_iiiiiiiiiiii_iiiiiiiiiiiiiiii!iii_iii_i_iii!iii!iiiiii_iiiiiiiiiii_!iiiiiiiiiii_i_i_iii_iiii_i.i_i.i_ii_ii_iiiii.ii.iii_iii_iii_!_i_i_i_i_i_i_i_i_i_i........................._i_i_i_i_!_,_i_ ..............__._ _.................................................................L-73-9050
' Figure 8.- Photograph of main-drive motor and six compressors.
%?i_i_,__i___ii_i__<i_ " • • "' •k
O©,
m
7-
LAL 90630
Figure 9.- Photograph of heat exchangers and tunnel ducts downstream of compressors.
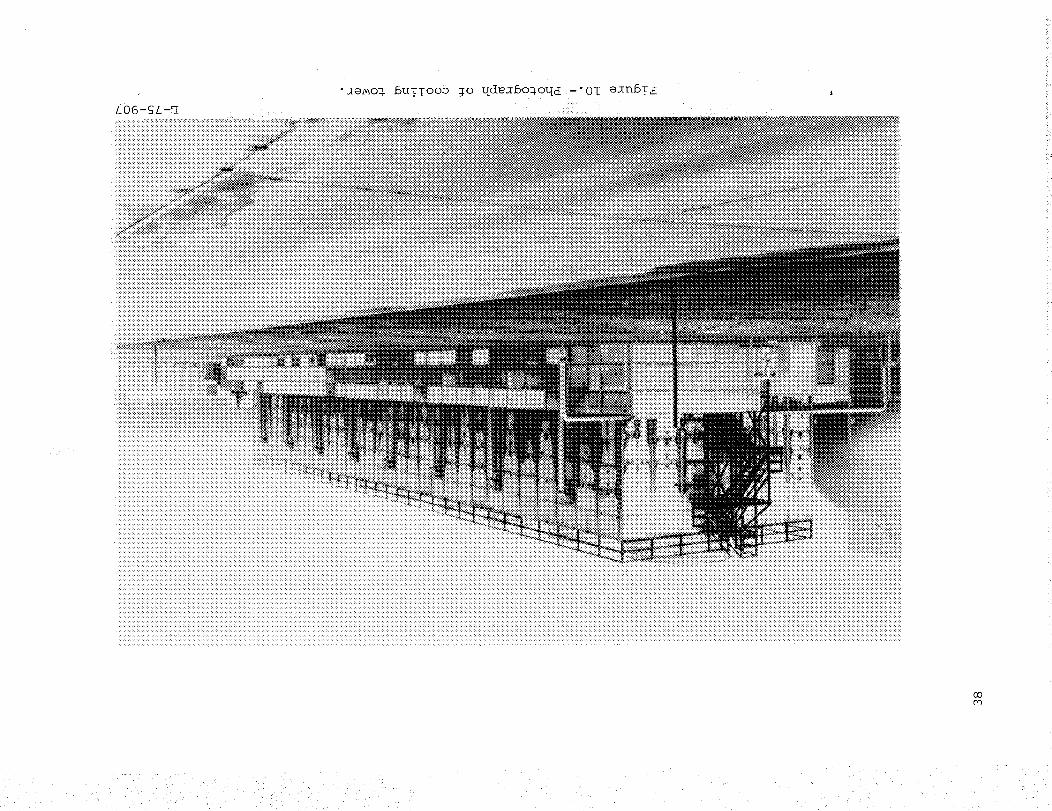
................................... •................................. •................ •.................. ,,,,,,,,,,,,,,, ........... ,,,, ,, ,, ,,,,,.,,, ,.. ,....,.,,,. ,. ,.,, ,,,, ....,,, ,,,, .,,..,...,. ,,,,,,.,. ,...,,.,,,..,,....,, .., ,.,,.......,.,....., ...., ...., ..,., ..,..., .., ... • ...., • • ................................................ •............. •.............................. ,,,,,, ............................ ,, ,,,,,,,,,,,,,, ............ ,,.,,,, ........ , ,,,,,,,,, ,,, ,,,.,,,.,,,,,,, ,...,,,,, ..,, ,,..,,, ,,,,,,,.,..,.,.,,....,............,,....,, ..,......................, ,..............,.,.............., ..........• • • : :, : :, ::, :,, : :< : :,, : : : : : : : : :<< : :, : : : :, : :,,,, : : • :, :, :, ,,: :,, : : :< :< :, : : : : :< : • :, ,, : :, : : : :, : :, :, :: : : :,, : :, :, :: : : : :<+: : :<< :< : : : :, : : : :< :<+:< : : : : :<<+: :+: :+:< :<+: :<<<+:< :<+:+: ::<+:<<<<+:< :<+: :<<<+:<+:+:<<+:<+:< :+: :<< :< <<+:+:.:+:+:+:< +:+:+:< +:+:+:< +:< <+:+:+:+:< +:+:+:+:.:.:.:.:.:.:.:.:.:.:.:.:+:.:+:.:.:.:<
:k:,: : :: :::,:,: : :,:<:::: :,:': : :':,:::::::::': :9:,: :,: :%::: : :%: :': :,:%::: : : : _ _ >:': _ : : _ :':<': : :':,::: :::::':,:+:'::::: :::':,:,:::::': :':::::::::::': :::::_:_:::::::::::::::::::::::::::::_:::::::::::::_:::::::::::::::::::::::::::::::_:::::::_:::::_::::::::::::::::::::::::::::::::::::::::::::::::::::::::::::::::::::::::::::::::::::::::::::::::::::::::::::::::::::::::::::::::::::::::::::::::::::::::::::::::::::::::::::::::::::::::::::::::::::::::::::::::::::::::::::::::::::::::::::::::::::::::::::::::::::::::::::::::::::::::::::::::::::::::::::::::::::::::::::::
CO

L_LQ
Valve _-
1I
E!
I
Valve z Cooler 4
-@----- %
I ! LValve _: Valve_"rr v- .2_ _ _ Cooler 5
vo, e c ,Airflow Valve I _........ _i_i_i_i!i_i!ii:i:i:i:_i:i:_:i:_:_??!?!.??:::__i!?i-!._.::::!_'_._-i:?:_:_!i'_!_.?!.i._::__'_!:........... ?!i.?!:i._:::,__ ............................._.......::::::::::::::::::::::::::::::::::::=======================================: -: :ii::_:i......................._-:i.!.::. ,,.._i!_.: :.!:i_iii:.:.:.:.:::.:.!:_:!i!_!i.i:.::_::.!=_!i__i!_!:i: :::i:_i_.!:!:i::!__i i. ...... _!i_!"_-""'
Test section !
Test section 2Valve ]I
1
(a) Mode 1-IA. 1.46 < M < 2.16.
Figure ii.- Tunnel-operating circuit configurations.

<• • _i::' _:• • __i_ _!.....• ••i
4_0
valve _z-
N _
[_tva,ve_ va,ve= __ coole_sI_i_ Valve _ _ ................... D /__
:i:!:!:!: ::::::::::::::::::::::::::::::"' .::::: =====================================:::::::::::::::::::::::: ........ .i, ' , -- _i!JJ_ii__i!::!ii::i::i::ili_-:'x':":'-":'>''''_'_'_:::::::::::::: , ..:_::::_:_::_:_::
::i_i::::i:: _ ......................
i!_::_i_i__:_:_:_:;iiill -1 _;_i_::_::_::_i_::?:_::?:_!i:i:_:_:iI ............................................................_ C ...._::_::!i_._. ".............. ::::::::::::::::::::::::::Iiiiii!iiiii_ii_ilil_ - _::::::::_<ii::iii::i!::::iiii!ili_iii_::i::i_:-_:_.............._:___ .......iiiiiiiillIi::::i:: valve _ _ I ...........i:i:i:i:i:bi:]:{;i
iiiiiiiii_:::i!i::iill
_i_!_i_ii::ii!i!i A i r f 10w Valve I _.
ilii]i ::_!::::_::::i_:.::_::_::_::_::_::_i_::_i_::_i_::_::_i_::_:_?S_]_]_:_:._:._:._:._:._:.?._:._:::_:._:._:._:.i_:._..............::::::::::::::::::::::::::::::::::::::::::::::::...................................._:_i_::_i_::_::_::_::_i_::_i_i_i::::_::_i_/............._ Sfa. 0 I
Test section !
'...//
Test section 2Valve rr
i I
tI
(b) Mode l-II. 2.36 < M < 2.87.
Figure ii.- Continued.

valve IZ
Valve Z Cooler 4
Valve - _ -
[Cooler 3
ve EZEValve 3Z_ Valve _nt
Valve 1_
G
F
E
cooler 5
Cooler IC
cooler 6
_/alve
Valve I
Test section I
(c) Mode 2-II.
Airflow
Test section 2
I
i
Sta.0
2.30 < M < 2.98.
valveE
Figure ii.- Continued.

L
[XO
valve
Valve x cooler 4
)Valve
Valve _ valve
valve I_ZValve
cooler 5
II
Valve _I
Cooler 1
Cooler 6
C
Test section !
Airflow
Test section 2valve ]I
(d) Mode 2-III. 2.98 < M < 3.75.
Figure ll.- Continued.
:.:.:::,
?-_
:-'4<'::...<.,.
_:_
".:(<.:
.:.:-_:::_:..':s
>::.:.:
:.--_::
::.<-.:-:

• i:-_/_'_:i;:i_•!!_,_•_ : i•: ...... •
L,J
Valve X Cooler 4
I
ValveValve 2_ Valve 'x'rr
Valve ]3ZValve
G
F
E
cooler 5
Valve
Cooler I
Cooler 6
C
!
valve _,
Test section I
Airflow
Test section 2_valve _T
(e) Mode 2-IV.
SIJo. 0
3.84 < M < 4.63.
Figure ll.- Concluded.
i!i_ill

-UOT_TUTFOp _o_sXs-o_UTp_OOO oZzzou pu_ SZT_O p UOT_OOs-_so_ -'ZZ o_n6T_
"Z UOT_ oas _sa_ _o_ _TnO_TO _qtunu _o_W Moff (_)
/ II II II _l II II I: II :I :: II _I I: II :l :,, ,, .y
_ J I L UI!:=, L= kl l q ",7 // I| / I; _--;; ' ', ,,,J zt_N.xo_l
'_ H u iI rl I tl I I i II I i I i - ] i L [I _l'll I'll
Il II LL II II iI r, !1 II II [r p.i i[ ii ii iI )1 ii rl tl il | [--_- (- H-,_--7.7 _IIAI *UIIAI_ I.............................. _ T" ---_\\ ./ _,Y _'-_"_,lfl --:lfll i
I I l II I I.L.=--- _ "::, t,:_ t, ','/,:',_;_ / .....
....... ...._il_lH/,ll,, ¢-7" "' i_ i'.--'._._'b_I /
[= ffr-n-_ -n-_ _]7 _F-l-r -_ -_P _r = _I_ =l-r---_l = =]_ -qT_q-r --_r --_ -Td _-_ _T-=_,... ,.h ,I I IUJ eg';_ I (L,U 66"01)
UO!¢OOS Jot OOZ JnoJ, uoo elZZON ,t_ OOZ;Joddns lapolAI uo!)oas lSel uo!HsuoJJ.
(uJ £I'_)
,4_ uoozuo!,_oas_sa±
X
A / (LUO Z"Ul
UO! ¢30S -¢Sal
T

_ !i:!_(ill _ • _L_ • i < iI i :;i!_ _ !:/<< <:__<;i<>7:71<i<<i!!/!_:_
Z
fTest-section _---i/"
/_ 0.625 in.1.588 cm) y
_--'1"[_-..... /. _//_Test-section door
'? i
Test section @7.00 ft
(2.15 m)
Testsection
Transition ! 70Oft j Model supportI i(2.I5 m) l section I
8.50 ft ] |8 44 ft I(2.59 m) Nozzle contour _-- -._., -4
t I
I II ; _ _ _l i I '11 Ii N _ I
I , II I tl II }! I I I 1 _ . III [I II II _ II I LL II _ II _L.- -- -- If_ - - _II..___ '
Lk_-._ii_,..... :- _ 1 # -+'__ Irflltlllltllll ! - !I', ,, ,_._-__ iliHIttltllllll I -- t
I _ !! _'_ iuuuuuuuuu ' _ i _,I __',,C,; ";I _ .......... _ ............... I_T ...... ii
# • I I _ II I h Ii _ i
#_-(M(:lx. M ) ____,___± k__ l__"- ..... jl___ 7 lI / Z_-_ t__'"t'_'_ "" "" , .1i ,i
_ I I I I ' ' __J
U'I
(b) High Mach number circuit for test section 2.
Figure 12.- Concluded.

Oh
O©
0
Figure 13.- Photograph of airplane model mounted in test section i.
L-76-818

I il II I[ I n I' II I I II II s_li II '1 /'_ II II II [I II II I1 II H # II H II
II ____ _ __II ..O_ __U._ __LL___LL _ II __ ___L[ U .LL_ _ LI._ _ .LL -- -- _ .U.....
" '' / L_ ......I II II / t il II II II II II II II / L-,.L / I! ,, II II II II 1
_i LL 21 ' / _'1"" _(_,_7 I_ it , Pr ii
___ji ...._i....IL_______ __....... -_'...................'--........._ -_ .--------.--'--
__----_____________mmaxi____mumcontraction
__ -----------------_____________® ------ir-------iT----qT--_____FF _ _ ..... ----_____ •
, "-:]F- ...... IT ....... F" - ---":":_'_--- ..........._--_-----_-----_'_"r_---L----__ I , -1 T, _r --_-J' I I I In f, ,, ,, il,i\ _\ ,, ,, ,, ,, ,,//I]!
li ,,---,--'-,---,---,---,--,---,--, T_ F,---_---_---_---c ....!, l,,......_J , _, _i ,, ,l il II ,r Ir II II /
_'_Jl pi_ _"
Plan vlew
H_HIk_
Second minimum35.25 ft (10.74 m)
i_ Ii i;I i, I I II I{
II li II Ii _i I I i) I_
,___ ____LL ....... ' _ ------- J--- -- JJ
I I li ;i ;I li II II Iil it i_ I[ it II_____] _____ r _L .t_ I_ ]..___L__ II__
Transition8.75 ft (2.67m)
__L_JL_LJ-JJ--
F.- -- -- _]- _ rr -- -- --q-
tl II I 'I _'
] _ m TT_i Ll
_I II " il
Side view....,,-F -F F----T----- I
II II Ii_ il II
II II II . I1 ;I !1 i
(a) Low Mach number circuit.
14.- Second-minimum details.Figure

"popnIoUOD-'NI o]nbT£
_-=_--L.L.L.L_ jk ,_i__i _ __/]
MSIA apls i, _ ,i _,ii I_ P d II
Ii I_ ii iI ii
'J I' 11 H _[ [I il I] I1 It ii iI lii
II II II II H H II II II I I II .... IL IILL __ -J I__ __ Ii -- __ _ __I -- -- ___ -.U -- -- _ -- JJ- -- -- _ .... II ...... -u__ __
-- [i-- [i --[i --ii ii II
I (LU06"Z) Ie-_ _ £g'6 ,i _
iT __III II li el
H
-- m-- -TF--_- -TT- -r--- 7- -7-- -iT..... TI----F-- -T--T ...... _---iI
iI II I_ Ii ii li II iI 11 ii IIII II II IL iI IL ii II II iI LI i II
_ 1./(w _Z'Ol)
_ g_'g£LUnWlUlW puooas' uo!;!suoJ.L
__]_L_J__
MelA UDI(:I t
. , ,, i, ,, , ,, , ,, ', ,, , , , ,,_"_ ,_.,,.____,' ii , ,I , ,i ,i ii , ,i ,, ,I II _' ,' !! i' ',!\
............ _- ....................... L .... JJ.... 1___:::_1 _ I/ II 1.... I _----=_-_! _ IFI
I / I II l II 'II [_ H _ ii i _II_" ] ,I II II II I i I _}-_L. _ II I _I
-#ILl I" !I " I If II I! _ I
..... LL ...... IL ..... JJ-=--= - J.J--- _ /I ..... II,- _ I
===-=-:- :=:-=:_ :_.e..=._;_---.--._.._..__._
uo_mo_uoo_umu,xow _o;_ i
I
,'T, -- - Ti
I II II
II II
uo!Msod I IDM_--_
]r -iT ....... 7] -7-_ [T rl
I i ,</I II r I
h iI !1II II .
.... .....I} II II I L.,=I II II /
ii ,i il tl II _u a.l,/
II II--rr ........... ]I ....... m........
II I II II II
II fl II II rl II II
O0
i- ., ." k
L

........ /,,, _-!i__, _ :: ........ :, _: _ . _- [
LO
0.625 in._(t.588 cm)
Z
8.0OO i n.-'[J(20.32® cm)
Figure 15.- Test section and model support system.
Test section + Model support system
7.0O ft (2. t3 m) / 8.50 ft (2.59 m)
I tDoor "q I |
t" .*'l // // // // /z /.," z.*" /z z/ // // // zZ:_:: _:1
II II 11 II li It I1 ,41 II I'-%',_ .--',',(' _ . 36.25 in. \
Z j fZ ;e. ,n (.o crn,'-s,,n0su o.
Test sections 1 and 2 are similar.

• - < •
Ln
0
Comer(
65.0 ft(I 9.2 m)
--q
mage screen
Airflow
,.._1v I
!= 22.5 ft1 (6.8 m)
ilver,knife edge
splits image
Spherical mirror49.00-in. diam.
(I 24.46-cm)
\J
Light sourceSpherical mirror49.00-i n. diam.
(I 24.46-cm)
Figure 16.- Schematic drawing of schlieren system and test section.

.....iiiiiiiii!ii
9<x::::::::::9:::9:
L-81-229
Figure 17.- Typical schlieren photograph of airplane model at M = 1.6r
51

/ f
F
!., i
oJawoo ap!su i J
OJaLUDO
_Pj'o:'j,n_O_\/
\
7 _eoJnos _qO!7
\\
\ \\. _ .....
\euold _qS!l
__ ueeJOS-JodOA
1,I-,.-- _7---/-7_
MOI_J!V
_ f f
I
,o
I
I
K
/ /
. . _ B N I
.- -. sMopu!M j
. . uo!_oes-_sal lauunlj
; L
I
V
. . _
Cxl

_ ,<r •'•< _•'__•iti_ii_iiii•_!•7 ¸• ,
L,n
L_J
Oufside cemere Inside comero
L-81-230
Figure 19.- Vapor-screen photographs of missile model in
test section 2 at M = 2.36.
o©
-4--

/: _:?_:_:!!t¸I::7_i: :: • :: _ • !!< <i !< •
U'I
0.250 diam(0.635)
1t-
0.125 diaml(0.318)
9;00(22.86)
Pitot probe
I
4!5o(II.43)
+_,_b_-_-_ 2.25 (5:72)
_ti ."21_ - _
12.00
0.25o diam10.4 ° (0.635)
14.00
0.16)
/[,_,4-0.030 orifices (0.076)
spaced 90 ° _ 7.20
1.00(2.54) 12.69. ""(.32.23) 7 Probe mount
Static probe face
19.00
3.60 (9.14)J.__
T3.00
(7.62
J _____r
20 ° I0 ° _ --_---._-_--
__2.81___ ;_ 1(7.14) ( 9.66
(24.54)
Flow'ongle probe .Calibration survey rake
Figure 20.- Details of calibration survey rake and probes. All dimensions
are in inches (centimeters) except as noted.

R=3.92x1061ft (12•86x1061m) y=-2.25in.(-5.72cm)in.
20cm
,,, 40 -10
_ 201
i
i:- o-40 -
-2O
,43/ / /
1.44 1.45" / _
/ )
1.48 __Airflow
I I I I I I I
10 20 30 40 50 60 70 80 in.
2i0 i i I I I I i I I40 60 80 100 120 140 160 _80 200 cm
Longitudinal distance, x
1.52
M 1.48
I. 44
1.52
M 1.48
1.44
: i :<,
i:,;_,i_' :!,
_Y ,i ,
1 _2 *':i !!!!!!!_!i!_!• lii_,l_,_,_
l_iilI_ffl!i!,iTii.ql_i
0 iI I
0 4
/=-2.25in. (-5.72cmb
!_!!!!!_t+q!_i!!tH'di_!h'!!!_t !'_'Ht!tf!
2 3 4I I
8 12Unit Reynolds number, R
5
I16
#tlHtl#_ttHll
6xtO6per ft
I 620x10 per m
(a) M = 1.469.
Figure 21.- Mach number calibration for test section i.
55
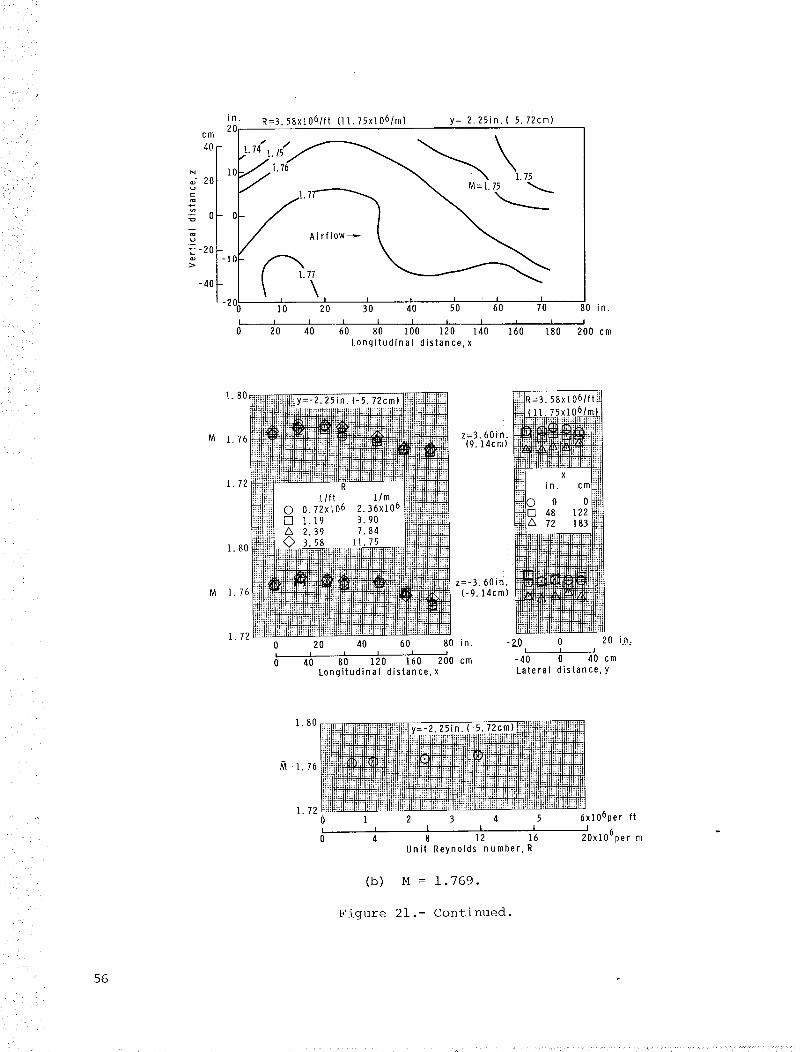
'/ 7/in. R=3.58x10⁶/ft (11.75x10⁶/m) y=-2.25in. (.5.72cm)
cm 2011 _" L \4o \N 10 [ /1.76 _ _ \
20 r/- ,,' _ \ 1.75r/ "-
_ o-o 1.7 _irflow
_2° I> 10
-40
I I I t I
-2_ 10 20 30 40 50 60 70
I I I I I [ I I I I
0 20 40 60 80 100 120 140 160 180
Longitudinal distance, x
80 in.
i200 cm
1.80 =-2.25in. (-5.72cm)
HH
iii4 z=3.60in.M 1.76 !!i (9.14cm)
i!I1.72 R
lift l/mO 0.72x10⁶ 2.36x10⁶
[] 1.19 3.90A 2.39 7.84
11.75
_sV
0 20 40 60 80 in.I40 8; '12o 1;o 2_Ocm
Longitudinal distance,x
1.80
M 1.76
1.72
z=-3.60ini(-9.14cm)
-20 0 20 in:I4o ; 4; cm
Lateral distance,y
/ ,
/
56
1.8o li':ii_ }_ffii_tii!_tii_it!H!ly=-2.25in.(-5.72cm)_]_i
0 1 2 3 4i I I
0 4 8 12
L_liiiihti_t,]Idi!i!_i_!li!i,li!!!l
" l H
6xl06per ft
616 20x10 per m
Unit Reynolds number, R
(b) M = 1.769.
Figure 21.- Continued.

R=3.03xl06/ft (9.94x10⁶/m) y=2.25in.(5.72cm)Jn.
2O
40- 2.
10-N._ 20-
m
'_ 0- C
_ -20 -
-40 -
-2C I I
10 20
I I
20 40
Airflow-----
2.17 218/
I I I I I
30 40 50 60 70
I I I I I I I
60 80 100 120 140 160 180
Longitudinal distance,x
80 in.
i200 cm
2.20
M 2.16
2.12
2.20
M 2.16
y=2.25in. (5.72cm)
R....... lift l/m
O 0.61x10⁶ 2.00x10⁶
!;t!_!T_ i !::,=_:_iii::i: i!!:!!!! _t_'Cll_Itl_l !!_:
_t!-,ttH!!_!!Hm
2.12 ...................... : .........0 20 40
!!!_! [] 1.01 3.31z_ 2.02 6.63
:!!! _.0_ 9._4!ii111
Ii_+
60
4_) 8_) t t120 160 2,,0 cmLongitudinal distance, x
::::ii:'.iiiii
:IZ!: !'!i! :!!_:_!!!!!!
t _ z=3.60in.
_ (9. llem)fh_lH_
:::. ,:::
:::: .:::::::;:: ::
_H!++!!!H! _
_t_
_ z=-3.6oin. _i:: ::::!::iii (-9.14cml i_i2,*_H'!HH II_
::::::::::::: ,,
] hi,if,; tr_
£iiiiA:ii*ii iI
80 in. -20
_R=3.03xl06/tt
(g.ilii
tt
×
in. cm
0 0
z_x 48 12272 183
ilillllll!!l!II!illl
0 20 i_n.I
Lateral distance, y
2.20 ..............................
I
|!,'i_H!_fii;i|IH
2.12Iiliiliiliii _: _"i!0 1
I I
0 4
............. t I ÷_ !_i_!_ '_t'
........ .,hl,,I!,!I::I,,l,.=l;Rt;It_ittttlf',;_:_t::;::;t.,I;t::,,t,_t_:A&t,;,Ji_fttttI._]!':i!t i::tll ':iliil!iit_!tilt!tt}_iI_i_"t_
y=2 25 n. 5 72cm) ;,!IIht!!!iittt!"#_
3 4 5 6xlO6per ftI I I I
16 20xlO6per m8 12
Unit Reynolds number, R
(c) M = 2. 160.
Figure 21.- Continued.
57
.... : : : , : :: :': :: ,:::: T::;: : :: :: ::'':

/ii_!<:i!:<<::
:_> _ i _
>:
i
58
in.
2Ccm
,,+40-11 _
20c
0- (]
E -2o'_ -10
-40 -
-2O
2.40
M 2.36
2.32
2.40
M 2.36
2.32
R=2.75x1061ft (9.02xlO61m} y=2.25in. (5.72cm)
2.36
,*_ > _ z.j.,4 / "/
2.34 2.3, \ / 2.3+i I /I I I t I I I
10 20 30 40 50 60 70 80 in.
I I I I l I I I I I
20 40 60 80 100 120 140 160 180 200 cm
Longitudinal distance,x
,=2.25in. (5.72cm)
1.80x!O 6
z=3.60in.(9.14cm)
z=-3.6Oin.(-9.14cm)
(9.02x1061m)
0 20 40 -20 0 20 in:I I I
40 80 -40 0 40 cm120Longitudinal distance,x Lateral distance, y
(d) M = 2. 354.
Figure 21.- Continued.

i•
in. R=2.46xlO6/ft (8.07x10⁶/m) y=2.25]n.(5.72cm)
cm 20[2.52 2.53/ ,,,
E -20 2.5'_ -10
-401i
! -20 I
/ Airflow_
I I I I I I I
10 20 30 40 50 60 70
I I I I I I I I t
20 40 60 80 I00 120 140 160 180
Longitudinal distance,x
80 in.
i200 cm
2.56
M 2.52
2.48
2.56
M 2.52
2.48
!=2.25in.(5.72cm)
z=3.6Oin.(9.14cm)
z=-3.60in.
(-9.14cm)
20 40 60 80 in.
4; 8; '12o 1;o 2;0cmLongitudinal distance, x
R=2.46x10⁶/ft
(8.07xlO6/m)
-20 0 20 in.I / I
-40 0 40 cm
Lateral distance, y
'-;!_]!! _i!iii_iili!C!ii_;_
;_i.;))iif!! )U, ,__J ;'-+' ms " ....
0 1 2I
y=2.25in. (5. 72cm) _!_!i_!!li_
()):i)()!i)il!))lli)))))i))!!i)6)':)))))))H)I)#
3 4 5I I I
8 12 16Unit Reynolds number, R
(e) M = 2. 540.
Figure 21.- Continued.
6xlO6per ft
620x10 per m
<59
" .... ¸./,7;:< H • , :;• . _.7n

r
5 . # '_ '
!!)i....
)
z
<i " •
in.
20cm
40-
" 0 10
_" 20
Em
.._ ,- 0
-20 -® -10
-40 -
-20
R=2.0gx106/ft (6.86x10⁶[m) y=2.25in. (5.72cm)
.,.2.79j2.801- _2.82 _ I -- _ _2.91
)289 / / / / 3.84 _ _
/ / / / _2.84_I I I I I I I
10 20 30 40 50 60 70
I 410 I I I I I I I20 60 80 100 120 140 160 180Longitudinal distance,x
2.92_=2.25in. (5.72cm)
2.88
2.84
z=3.60i(g.
80 in.
200 cm
2.80
2.92
2.88
M
2.84
z=-3.60in.(-g. 14cm)
6O
2.8020 40 60 80 in.
40 80 I n120 160 200 cm
Longitudinal distance,x
-20 0 20 in.
-40 0 41 cm
Lateral distance,y
2.88
2.84
2.80
illlli!ilillIlll!lliiiliIlll_,iil:._lliiiil_iilc;_!llllIIiIIilI II!t I_i I ff i _llllllilIlllllllllilllql i_Iill I IiI111_IIIIiIIIiI l_lll Iii_liIIIIll_IIIIiIIII!!Iiiiiii£!iii11t_tllt I tt htttth.tI!t:_,t.tttttlt,f..lt.l
t ttil y 2 251n (5 72cm)_l_,ll,i,lliI Illil = "1 2 3
I I I
4 8 12
ttttltttlttlt tiIttttttttt ttlltlt_ttl_ttttttflttttt_tttttltttttttttttttttt_iiiiittttftt!t!,_Ittltt11tt_.ttt]ttttIilttttit!tt_ttkttttttt11ittt! tttttt_fttftttilli!!lllllilllllllIlllll
5 6xlO6per ft
I I 6
16 20x10 per m
Unit Reynolds number,R
(f) M = 2.869.
Figure 21.- Concluded.

<
in.
2(cm
40-
N 10
20-o
O- 0
E-2o-_ -1o
-40 --20
-20
I
-40
R=3.0OxlO6/ft (9.84x10⁶/m) y=O. Oin. (0. Ocm)
2.2g_
2 3O-----.--___.
.--_p 31I i-' I I
-10 0 lO 210 310 4JO 50 60 in.
I I I I I I I I I I
-20 O 20 40 60 80 I00 120 140 160 cm
Longitudinal distance, x
2.32
M 2.28
2.24
y=O. Oin. (0. Ocm)
0 20 40 60 in. -20 0 20 in., , , , , , , ,0 40 80 120 160 cm -40 0 40 cm
Longitudinal distance,x Lateral distance,y
2.24_Y=O-Oin.(O. Ocm)_ i ,- :-I _ i,_
0 I 2 3 4 5 6xlO6per ft
I I I I (5u . 8 12 15 20xlO per m
Unit Reynolds number, R
(a) M = 2. 297.
Figure 22.- Mach number calibration for test section 2.
61

C / ;
_:> .
_j
-<
/.
in.
20cm
40-
N 11
20-oc
0- 01
E-2o-10
2.64
M 2.60
R=3.00x1061ft (9.84x1061m) y=0.0in.(0.0cm)
#
---- _2.59C)
2. 59
Airflow_
_2 62
-.--_
I ' I M=2.63_,, _ i I
-I0 0 10 20 30 40 50
[ I I I I I I I I I
-40 -20 0 20 40 60 80 100 120 140
Longitudinal distance,x
y=0. Oin. (0.0cm)
60 in.
J
160 cm
2.56
2.64
M 2.60
,/
/
62
2.510 20 40 60 in. -20 0 20 in.
Is I 0 40 cm
[ I _ I I-40 0 4 80 120 160 cm -40
Longitudinal distance,x Lateral distance, y
2.64
2.60
2.561 2 3 4 5 6xl06per ft
I I I I 68 12 16 20x10 per m
Unit Reynolds number, R
(b) M : 2. 606.
Figure 22.- Continued.
• • :: ,•v< , v¸¸, < _ • <:_•-•_ • !H •H .....

t
CB
40-
in.
2O
,-, 10
& 20-
_ 0- 0
:_ -20 -
-10
-40 -
3.00
M 2.96
2.92
3.00
M 2.96
R=3.0OxlO6/ft (9.84xlO6/m) y=O. Oin.(O. Ocm)
/2.95/ _ 2.96_
2.96
_2.97_
-10 0 10 20 30 40 50 60 in.
I I I I I I I I I I I
-40 -20 0 20 40 60 80 100 120 140 160 cm
Longitudinal distance, x
y=O. Oin. (0. Ocm)
9.84xlO6/m)
2.92
-20 0 20 40 60 in. -20 0 20 in.
, i / , I I I / i
-40 0 40 80 120 160 cm -40 0 40 cm
Longitudinal distance,x Lateral distance,y
/
. i•- ¸
2.921__':_Iy=0.0 n. O. Ocm Ill '_ _::_ii:l:L_I:lll:iil::lii
o I 2 3 4 5 6;(106De r ft
! I I I 6u 4 8 12 16 20x10 per m
Unit Reynolds number, R
(c) M = 2.973.
Figure 22.- Continued.
63
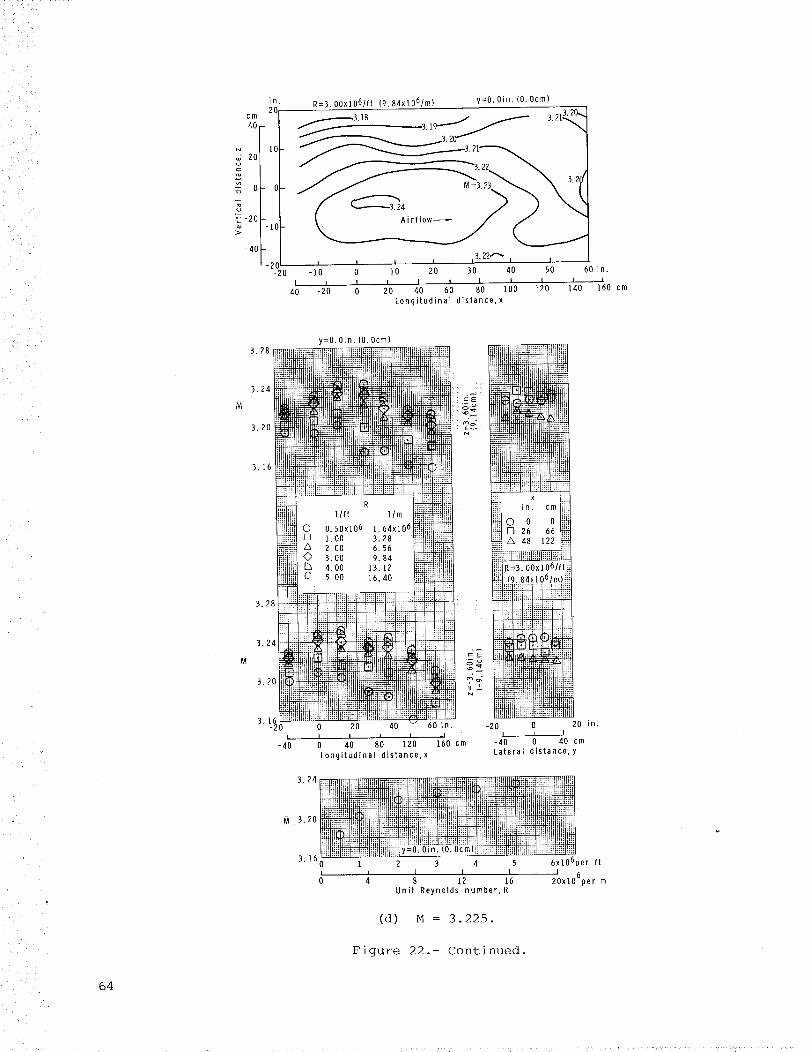
7 iI_ "
• )i
i !:ill :
• /
64
in.
2Ocm
40-
2O
O- 0_!_-2o '-1o
-40 -
-20 _
-20
3.28
3.24
M
3.20
3.16
3.28
R=3.0OxlO6/ft (g.84x!O6Im) y=O. Oin.(O. Ocm)
318 3213.2
I
-llO 0
I I I
-40 -20 0
13"22_ I I
10 20 30 40 50 60in.
I I I I I _ I I20 40 60 80 100 l 0 140 160 cm
Longitudinal distance, x
y=O. Oin. (0. Ocm)
ii{_ l'.ff,, :.1_
:itt! ti: i 'R
lift lira
0 0.50x10⁶ 1.64x10⁶
[] i. O0 3.28
A 2, O0 6, 56
3.00 9.84
[3 4. O0 13.12
5. O0 16.40
0 20 40 60 in.
I / I I I
0 40 80 120 160 cm
Longitudinal distance,x
0 o[] 26
z_ 48
-20 0 20 in.
I / 1-40 0 40 cm
Lateral distance,y
3.24
3.20
3.!6
::: IH$
lill
Htii!..... 1
il 1l_ i!!I II _ H Uiili!!!ll!!iliiHl
.... i : : :_::::: : il _ _ :_ "I _Ei:l:i;. : _ , _ _ q ' 1 +:
1 2 3 4 5 6xlO6per ft
I l I I 68 12 16 20x10 per m
Unit Reynolds number, R
(d) M = 3. 225.
Figure 22.- Continued.

in.
2_cm
40-
2O
O- C
u
-2o--lot
-40 -
-20-20
-40
R=3.0OxlOG/ft (9.84xlO6/m) y=O. Oin.(O. Ocm)
Airflow_t I_
_3'62t t t !-ltO 0 10 20 30 40 50 60 in.
I | t I I l l ! l I I
-20 0 20 40 60 80 tO0 120 140 160 cm
Longitudinal distance, x
3.70
M 3.60
3.50
3.70
M 3.60
3.50-20
-4'0
y=O. Oin. (0. Ocm)
in.
0 0 0[] 26 66A 48 122
0 20 40 60 in. -20 0 20 in.
' _ ' , , , _ '0 4 80 120 ]60 cm -40 40 cmLongitudinal distance.x Lateral distance, y
7 ,, : "i
3.50 "_.......... "0 1 2 3 4 5 6xlO6per ft
I I I I 64 8 12 16 20X10 per m
Unit Reynolds number, R
(e) M = 3.580.
Figure 22.- Continued.
65

i:i): i: i<:
' ( i
/
: _ i/¸ ,
in.
20
cm
40 -
N I0
o200
- 0
-20 -® -10
>
-40 -
-20'
-20
I
-40
4. O0
M 3.90
3.80
4.0(
R=3.0OxlO61ft (9.84xlO61m) y=O. Oin.(O. Ocm)
/3.93 J .... 3"8_v _.,,"'-"_'_ 3"893"_
_M=3.98_
-I0 0 tO 20 30 40 50 60 in.
I I I I I I I l I J
-20 0 20 40 60 80 100 120 140 160 cm
Longitudinal distance,x
y=O. Oin. {0. Ocm)
0 20 40 60 in.
I / i i I
0 40 80 120 160 cm
Longitudinal distance, x
_illm_imiill
;+!lRi+t_i+iI;
x iii_
in. cm
0 0 0
[] 26 66
48 122
R--3. OOxlO6/ft_
(9.84xlO6/m)_
_E, E!! :::i i!i. E::
!h i!:! h', !:: !!h ;
,, , liq :u! I'ti :m :
-20 0 20 in.
I / I
-40 0 40 cm
Lateral distance, y
. • +
+
,. • <
5
66
4.00_
f_ 3.90
3.80
it!iitititiilittttt[ttt,t+_i,t{+_ll,i_{._+_.._!.,+t_++_t!tl,fiiili}Itttttttttttttltt_{!!$1i!lii++liiiil!{!ii!iiili_y=o.o n.o.ocm_ill!i_i!iilil@Iiill!l_l_lllliliI
1 2 3 4 5 6xlO6per ft
I I I I 6
8 12 16 20xlO per in
Unit Reynolds number. R
(f) M : 3.953.
Figure 22.- Continued.
. • ..... ..... < •• • - .... +/: ........ .... ;, ...... }::-=•< 7-
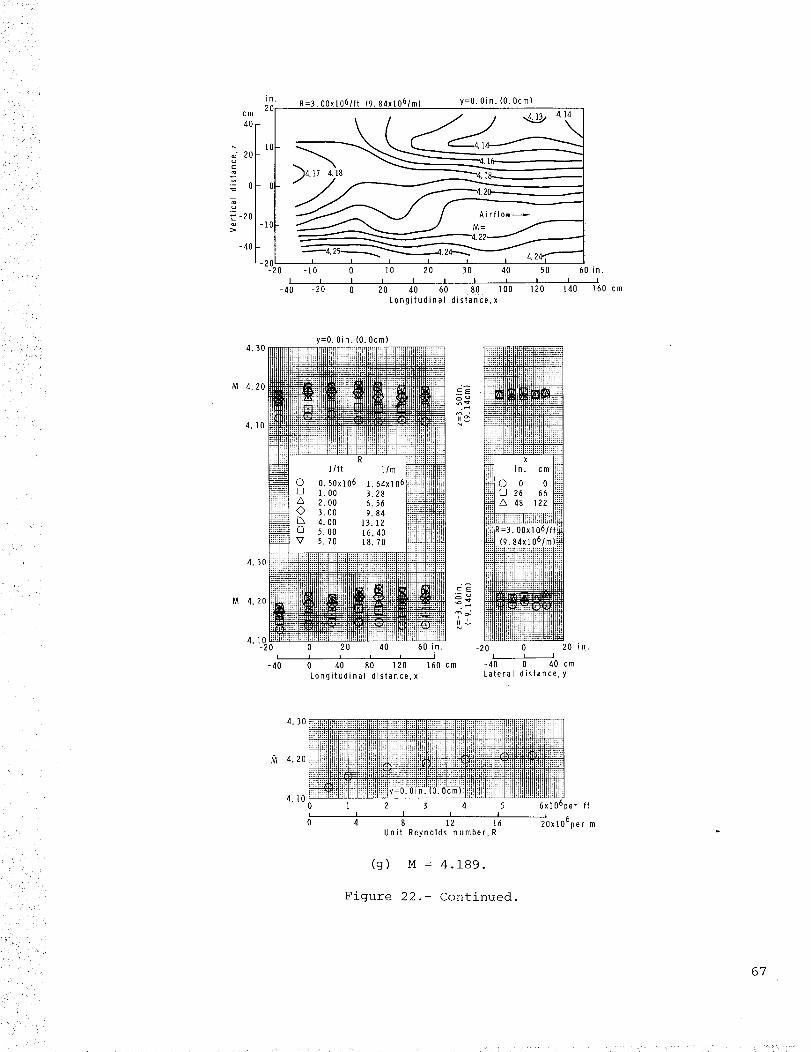
• ,_y /
_ ', L i
in.
2Ccm
40-
10
_" 20-
2
._ O- 0
-2oi® 1-10
> -40 --20
-20
I
-40
4"30 i
M 4.20
4.10
4.30
R=3.0OxlO61ft (9.84xlO61m) y=O. Oin.(O. Ocm)
, . 17 / 4.14
"---..,>;7 --
,-10 0 10 20 30 40 50
I I I I I I I I I
-20 0 20 40 60 80 100 120 140
Longitudinal distance, x
y=O. Oin. (0. Ocm)
m; ._ E
iliio,,
_d
_Hi!i!
i!ii
iiii
R_
0 20 40 60 in.
I 1 I I I
0 40 80 120 160
Longitudinal distance, x
.= E
iIIN
cm
×
in. cm
© 0 0
[] 26 66
48 122
R=3. OOxlO6/ft
(9.84xlO6/ml_
i:/.! i:)/. !!:.i =.:/i2.:. Y.i! iY.
i; iii ;:i_ }iiii:i=,l_;iilt,l_l,_;_ll_t;;l,4,*iIH
-20 0 20 in.
I / I
-40 0 40 cm
Lateral distance, y
60 in.
I
160 cm
L
51 • /•i
?i+ :
I.,J,.,.t,,.L.J,,J,,J,_,I_J_._L:..f....t,:_t,:._!ii_!i_iitiiiitii_llii
4.20
_ _y:O. Oin. (0. Ocm)4.10 :,F,,,_,-,F,.,_,,,F.,._,_.i+..._......... 'T'_r
0 1 2 3 4
I I
Unit Reynolds number, R
5 6x10⁶Der ft
I I 616 20x10 per m
(g) M : 4.189.
Figure 22.- Continued.
k _i• _ ,'
67

• ' ? .
/i :_ _i
:i
• !
/
cm
40
N
o" 20_a
_-2o>
-40
in,
2G
1[
- (
-1(
R=3.0OxlO6/ft (9.84xlO6/m) y=O.Oin.(O. Ocm)
. , •
Airflow_
I I
I ['O 2'O 310 40 50 60 in.-2/20 -1'O 0
• I I I I I I I _ I J
-40 -20 0 20 40 60 80 tO0 I 0 140 160 cm
Longitudinal distance,x
M 4.40
4.30
4.50
4.30-20
-4'o
y=0.0in. (0.0cm)
0 20 40 60 in. -20 0 20 in.
I I I ,J I _ I
0 4'O 80 120 160 cm -40 40 cm
Longitudinal distance,x Lateral distance,y
...... I .... h_,.i I ........ t,,
.h ,, , " , " ";t ..... ,440 i" :, i L :
"_.I t 't+I; ...... i I ......... r ; _] t ¢_ it Sh _t_i ",,t !I:_ilii ,,4 ,ili]lil;;t ;I ;:!t'.:,,ti i/i___, '.;_;l;_ll::iilm : _ _ i : ..... . cm) .......... "
l!Jlil I':iI!iiil!i!_]!i::/!liii[Y=°°'n" (o.o)_,_iIII_',m_.ilt4.30 _'" 1 .... 2 3 4 5 6xtO6per ft
I I I I 64 8 12 16 20xlO per m
Unit Reynolds number, R
(h) M = 4. 423.
Figure 22.- Continued.
68
•.... :• • .-.,• ..... :. ; _• < ..... 9_, • -x -! ;:•:;:•-+;y:;-,:,•<_v _!v/<?i,i+!•i-_

'/
in. R=3.00x10⁶/ft (9.84x10⁶/m) y=O. Oin.(O. Ocm)20
cm 4.69 _40 - _ 4.6_ 4.68_....._ _" 4.65
= lO ,,,_
'£ 0 - 0 NI .64
-40 - irflo
-26 i I i I I I I0 -10 0 10 20 30 40 50 60 in.
I I I I I I I I I I, I
-40 -20 0 20 40 60 80 100 120 140 160 cm
Longitudinal distance,x
)
4.70
4.50
y=O. Oin. (0. Ocm)
0 20 40 60 in.
I I / I I I
-40 0 40 80 120 160 cm
Longitudinal distance,x
4.7 o l!illlllllillli__llilli!lii!lll_i! t!! I?!illi I _ IIIIIIIIIIIIIIIIIIII:UI_ II
IIINIIIIIII,I_IIIII,III,I,,IIIIIII_I II__IIII llillli!lllillllI,_llll
llilllIllIlllllllillllll£11111111_i_IIII II_itlttt!ttttU_titit!!ti!!t!tt'_m':"-t_m!tl_tt IllI)li)l_lil IIII y= 0 0 in.(0.0cm);l!lllII
4•5 0
0 I 2 3 4I i I
Unit Reynolds number, R
(i) M = 4.640.
Figure 22.- Concluded.
_I)IlllII
)Illlllll_
5 6x10⁶per ftI
20xlO6per m
69

cm
40 -
in.2O
1(]N,_ 20"
"-- 0- 0:
_Z-2o-,_ -10
-20
-40 -
y=0.0in. (0.0cm)
_\'-J -o,'2\
°"8-11 0.5 I )
i i i i i I i10 20 30 40 50 60 70 80 in.
i i I I I I i I i2_0 40 60 80 100 120 140 160 t80 200 cm
Longitudinal distance, x
e v, deg 0
z=L 60in. (9.14cm)
ftt_P_!ii_ttt!_i_it!t41tiiiil
-I-20 0 20 in.
| t J-40 0 40 cmLateral distance,y
z=-3.60in. (-9.14cm)
-20 0 20 in.I i I
-40 0 40 cm
Lateral distance, y
OH,deg 0
OH,deg 0
y=0.0in. (0.0cm)
z=3.60in.(9.14cm)
z=-3.60in.(-9.14cm)
xin. cm
0 2.5 6.4
[] 50.0 127.0
A 73.5 186.7
I_I_ ....-20 020 40 60 80 in. 20 i_.
,40 80 i i i120 160 200 cm -40 cm
Longitudinal distance,x Lateral distance, y
(a) M = 1.57; R = 1.62 x 10⁶ per ft (5.31 x l06 per m).
Figure 23.- Flow-angle calibration for test section i.
7O

!i!/<ii_
i'<
_i<
in. y=0.0in. (0.0cm)20
cm
40-
N 101-i"=" 20-- "
E
G 0-I
_-20 -i0 , X
-40 - O_ = i i i i i i-2 10 20 30 40 50 60 70
2_0 i i I i i i i I
0 40 60 80 100 120 140 160 180
Longitudinal distance, x
80 in.
I200 cm
z=3.60in. (9.14cm)
e V. deg 0
-20 0 20 in.I I I
-40 0 40 cm
Lateral distance, y
z=-3! 60in. (-0. ]4cm)
IAa_ NN
-20 0 20 in.I i I
-40 0 40 cm
Lateral distance, y
y=O. Oin. (0. Ocm)
o H, deg 0
I
ell,deg 0
-10 20 40 60 80 in.
I I40 8; 120 160 2u0 cm
Longitudinal distance, x
z=3.6Oin(9.14cm
z=-3_6Oir
(-9.14cm)
Tz;.
X
in.
© 2.5[] 50.0A 73.5
-20L__
-40
Lateral
cm
6.4127.0
186.7
20 i.n.
4}) cm
dJstance, y
(b) M = 1.77; R = 1.51 x 10⁶ per ft (4.95 x 10⁶ per m).
Figure 23.- Continued.
71
• • • • •< 7 • k ;/¸ < i 17 :<

) i¸ i :<
_i:Uii_il__
(
72
in y=0.0in. (0.0cm)20" o., deg
N -0
; _ , O-o
_-2o-]o , - _
I
/-2 10 20 30
I I 4t0 i I I I I t I0 20 60 80 100 120 140 160 180
Longitudinal distance,x
_0 in.
I200 cm
e v. deg
z=3.60in. (9.
::: :::
:u:::::; ;
-1-20 0
I f-40 0
14cm) z=-3.60in. (-9.
20 in. -20 0I I I
40 cm -40 0
Lateral distance, y
14cm)
i_itit
tt!it!!tMt
lliil20 in.
I40 crn
Lateral distance,y
OH,dOg 0
-1
eH,deg 0
-1
y=0.0in. (0.0cm)
IiIIiII _._,_iii
3Tq:F_:FF_;3}__tt t t 4tIt t_H4H,_!(_t!t !t_tt; ,.t!!!ttt!t!t! t
............................. ili
[H:H H'.::[II "._:I .......... l+-lll
_':!!!!!!! ! ! ,i:: iii _ii _ ii!t!!!!_£_!!i_,']! iii iiii_iii:i',iiil;ii_i iiiiiiiii
_!!!i!!!Ii!i!!! iill"llli"!!I!!!I!'_'il=_"llIII,II!I
III! l..l!Iil!! lil! IIii!iiiiii!!;!i:!!A!!i;iiii; !_I!!Ii
20 40 60I I I
180120
Longitudinal distance,x
z=3.60in.(9.14cm)
!I
_t
HI
It
_÷
ft
1_ z=-3.60in.
_ (-9.14em)N
;il;
80 in. -20I
200 cm
="I*N_A
!II l*_iii lillII !iiii IIIil
X
in. cm
O 2.5 6.4[] 50.0 127.0
73.5 186.7
T_ rfTf ff,II _rmt_m_tt_ttl_
! ! I !!!]!jt_lt_ _++H .. II:EIIH
illi!iii!iiii_lll_ fHil ttt tItttt!+!t
0 20 in.I-4o ; 41em
Lateral distance, y
(c) M = 1.97; R = 1.63 x 10⁶ per ft (5.35 x 10⁶ per m).
Figure 23.- Continued.

• ,i_i"
7 <
.i
L
y=O. Oin. (0. Ocm)
_,._-0. 5
,_ ,,,',-0.4,,,_, _-u._
-o.o410 510 OlO 7i0 _0 in.
i I I I I I
I00 120 140 160 180 200 cmLongitudinal distance, x
o v. deg
z=3.60in. (g. 14cm)
i i_! 'i_::ii! ill ii!i !'i.. N:
0 20 in.I I I
-40 0 40 cmLateral distance, y
z=-3.60in. (-9.14cm)
,. i]_ ii!i
"i ,'_m ,,,1,t_lli
mi!ii i_i
i_il+i'_ illi iii_ _'.h_-20 0 20 in.
I I I
-40 0 40 cmLateraldistance,y
ell, deg 0
OH, deg
_iil!!i
_ z=3.60in.
:i;H+_
+,_; C;i
!iii_ji z=-3.6oin._ (-9.14cm)
, _!
80 in.
21]0cm
Longitudinal distance, x
!!!_!tI_ filt_l
X
in. cm
0 2._ 6.4[] 50.0 127.0A 73.5 186.7
, r_iN!!ItH t{! im.: _,,]t....
I!'_it+_TilIti4 "....-20 0 20 in.
I
-40 ; 4_) cmLateral distance, y
(d) M = 2.17; R = 1.49 x 10⁶ per ft (4.89 x i06 per m).
Figure 23.- Continued.
73

i i_ ','
74
in. y=O. Qin. (0. Ocm)
20 ( _2 °V'
2o-1
oT4
m
_Oo __--___,/,,',.>._
-40 _-2 0.3I0 20 3
i i I i I I II
0 /0 40 60 80 100 120 140 160 lBO
Longitudinal distance,x
80 in.
200 cm
z=3.60in. (9.14cm) z=-3.60in. (-9.14cm)
_:'_"__I:'___I I_ 'I_T_'_"_"___1_'_:!i:_ ':;:,ri_ ...... ]':T:lIIT,'._l_ i
' I i :' lit!i±
i]i' •)Ili i_lii!i
-"i)l_);_I{_U+I u.Uil_::_+l_UU,Lh_]l)U!l!.i,.,_li-020 O 20 in. -20 0 20 in.
I I I | I ]
-40 0 40 cm -40 0 40 cm
Lateral distance, y Lateral distance, y
o H, deg 0
-I
eH,deg 0
-I0 20
I
Longitudinal distance, x
y=O. Oin. (0. Ocm)
tH
_U
U_40 60
80 _ i120 160
tH!
++,J._
:[!
H-
iii
:HT
HH
Uii80 in.
2(_0 cm
z=3.60in. _
(9.14cm) _I)__I}_I}I
,- q ,')iL _ :H :liliUIU]ll_UT_,l_,IL+lIllX
in. cm
0 2.5 6.4[] 50.0 127.0/k 73.5 186.7
z=-3.60in.(-9.14cm)
-20 0 20 in,I
-40 (_ 4_) cm
Lateral distance, y
(e) M : 2.36; R = 1.46 x 10⁶ per ft (4.79 x 10⁶ per m).
Figure 23.- Continued.

T;?/ <
j • ,
, , <
: i • , ,
L
? •
<:i • ,
/
?
in.
20y=0.0in. (0.0cm)
cm
iiN 10
E
•- 0- 0
-2o -_, -10
>
-40 -
-2%
I
160
'0.6
!
70 80 in.
I I
180 200 cm
o v. deg 1
z=3.60in. (9.14cm)2
i!liii,liiil
_;:ii{
-20 0I I
-40 0
H;]
N:!H!.H
20 in.
40 cm
Lateral distance, y
z=-3.60in, (-9.14cm)
d±7 _ :i i' m?:_;!H
l,,_lhm,m<,L. ,itLit
-20 0 20 in.I I I
-40 0 40 cmLateral distance, y
OH,deg 0
-1
eH,deg 0
-1
iii ill!
_ z:3.60in.
_! !iii (9.14cm)
I:I!
iiii_
!!!iif! z=-3.6oin._,_,, 1-9.14cm)
:+!-!;;!
llil
60 80 in.
1;0 2;0 cm
X
in. cm
0 2._ 6.4[] 50.0 127.0
Z_ 73.5 186.7
!.....
)q ;i_
-20 0 20 in:I
-40 ; 4_) cm
Lateral distance, y
f) M = 2.54; R = 1.66 x 10⁶ per ft (5.45 x 10⁶ per m).
Figure 23.- Continued.
75

i iik_i
• • 5,, _ _/_/
in
cm 201
,-,40 -I0
2°/
"4:_ O- (]
_-20 --I0>
-40I_20
y=O. Oin. (0. Ocm)
"o,
- ,,0 01 _ -
/( °C1'o 2'0 7o _o _'o 6o ,o
I I I I I I I I
210 40 60 80 i00 120 140 160 180
Longitudinal distance, x
-0.6
-0.4
80 in.
I
200 cm
o V' deg
z=3.60in. (9.14cm)
l Iiimi_<I:t_l,,,,:-,.,,i__
oN-1
-20 0 20 in.• I I
-40 0 40 cm
Lateral distance, y
z=-3.60in. (-9.14cm)
-20 0 20 in.I I J
-40 0 40 cmLateral distance, y
i - - .
76
OH, deg
OH,deg 0
y=O. Oin. (0. Ocm)
0 20 40 60 80 in.
4_ 8_ ' ....120 160 200 cm
Longitudinal distance, x
z=3.60in.(9.14cm)
z=-3.6Oin.(-9.14cm)
cm
6.4127.0
186.7
+t i
i ll'
20 in,
(g) M = 2.87; R = 1.82 x 10⁶ per ft (5.97 x i06 per m).
Figure 23.- Concluded.

_ :_ __ i__
< •
< •
in.
20cm
40-
,-, 10& 20-
t_
Lf_•- O- 0
to
-2o-,_ -I0
>
-40 -
I0
y=O. Oin. (0.Ocm)
I I I I I i I
i0 20 30 40 50 60 70
I I i I I I I I I
20 40 60 80 100 120 140 160 180
Longitudinal distance, x
80 in.
J200 cm
lZ=3' 60i n. (g.14cm) z=-3.60in. (-9.14cm)
V' deg 0
-20 0 20 in. -20 0 20 in.I I I I / I
-40 0 40 cm -40 0 40 cm
Lateral distance,y Lateral distance, y
• L
• '47 .
?
OH, deg 0
o H, deg 0
y=0.0in. (0.0cm)
20 40 60
I I I I
40 80 120 160
Longitudinal distance,x
80
2130 cm
z=3.6Ojn._
(9.14cm)
X
in. cm
© 1.5 3.8[] 51.0 129.5
A 73.5 186.7
z:-3.60in.
I'g.14cml
In. -20 0 20 in.I ! I
-40 0 40 cm
Lateral distance, y
(a) M = 2.294; R = 1.51 x l06 per ft (4.95 × 10⁶ per m).
Figure 24.- Flow-angle calibration for test section 2.
77

in y=O. Oin. (0. Ocm)2(3
cm
ii,-, 10:Q)
(:= ,
•-_ O- 0
l.)
-2o -® -10>
-40 -
-20
[0
i
0.3uO. 2_
I I I
i0 20 30
I I I I
20 40 60 80
Airflow----,--
'I I I I
40 50 60 10 80 in.
I I I I L i
I00 120 140 160 180 200 cm
Longitudinal distance, x
z=3.60in. (9.14cm)
il_1_li__i_II
OV, deg O_I_i[
- l _tt_tfN-20 0 20 in.
I I I
-40 0 40 cm
Lateral distance, y
z=-3. OOin.(-9.14cm)
-20 0 20 in.I I I
-40 0 40 cm
Lateral distance, y
78
°H,deg 0
-I
ell,deg 0
y=O. Oin. (0.Ocm)
-I0 20 40 60 80 in.I I I I
6 40 80 120 160 200 cm
Longitudinal distance,x
z=3.60in.(9.14cm)
z=-3.6Oin.
(-g.14cm)
X
in, cm
© 1.5 3.8
[] 51.0 129.5
/X 73.5 186:7
-20 0 20 in.I / I
-40 0 40 cm
Lateral distance,y
(b) M : 2.489; R = 1.54 x 10⁶ per ft (5.05 x 10⁶ per m).
Figure 24.- Continued.

in. y=0.0in.(0.0cm)20
• <
cm
40-
10N
® 20-
•_ 0- 0
_J
:_-20 -i...-I0
-40 -
-20
° v'l__ \ _ \ _o 3Jdeg_ I _\- 0.3 _ {, _0"2 _
,(Airflow----- <L_._ ) t_..-_.
I I I I I I I
l0 20 30 40 50 60 70
I I ! I I I I I I
20 40 60 80 i00 120 140 160 180
Longitudinal distance, x
z=-3.00in. (-9.14cm)i I___l_
e V, deg 0
-1 ___H-20 0 20 in. -20 0 20 in.
I I ] I I I-40 0 40 cm -40 0 40 cm
Lateral distance, y Lateral distance, y
80 in.
i200 cm
ell,deg 0
-I
ell, deg 0
-1
y=O. Oin. (0. Ocm)
0 20 40 60 80 in.I I I I
40 80 120 160 200 cm
Longitudinal distance,x
z=3.60in.(9.14cm)
z=-3. O0in.(-9.14cm)
_!, ,_, ,_
X
in. cm
0 1.5 3.8
[] 51.0 129.5
A 73.5 186.7
-20 0 20 in.I / I
-40 0 40 cm
Lateral distance, y
(c) M = 2.750; R : 1.64 x 10⁶ per ft (5.38 x 10⁶ per m).
Figure 24.- Continued.
79

{i< ¸ <i!¸¸
x ,
+,
8O
cm
40-
10N
20-c
•_- o- 0
:_-20 -L..-10
>
-40 -
i -2_
in.
2Oy=0.0in. (0.0cm) e V'
/ / •
I I I I I I I
10 20 30 40 50 60 : 70 80 in.
I I I I I I I I I I
20 40 60 80 i00 120 140 160 180 200 cm
Longitudinal distance,x
z=3.60in. (9.14cm) z=-3.60in. (-9.14cm)
deg 0 _mtt_rrm_a._,.,,_v'
-20 o 20 in. -20 o 20 in.I I I I i I
-40 0 40 cm -40 0 40 cmLateral distance,y Lateral distance,y
ell, deg 0
-1
ell, deg 0
y=0.0in. (0.0cm)
z=3.60i n.(9.14cm)
z=-3.60in.(-9.14cm)
X
in. cm
0 i.5 3.8[]51.0 129.5A73.5 186.7
-20 0I I
20 40 60 80 in. 20 in_
, , , , _40 80 120 160 2 0 cm -40 40 cm
Longitudinal distance,x Lateral distance,y
(d) M = 3.218; R = 1.96 x 10⁶ per ft (6.43 x 10⁶ per m).
Figure 24.- Continued.

/> _i_ <
-/,J
in
2Gcm
40-
N lOIG 20-
t'o
._ O- 0
m
_-zo -lOl
-40 -
-2o(
y=O. Oin. (0. Ocm)
I I I I I I I
10 20 30 40 50 60 70
I I I I i I I I I
20 40 160 18060 80 100 120 140
Longitudinal distance,x
80 in.
I
200 cm
z=3.60in. (g.14cm) z=-3.60in. (-0.14cm)
e V, deg O_
- 1 __-20 0 20 in. -20 0 20 in.
I i I I I I-40 0 40 cm -40 0 40 cm
Lateral distance, y Lateral distance,y
e H, deg 0
y=O. Oin. (0. Ocm)
z=3.60in.(9.14cm)
z=-3.60in.eH, deg 0 (-9.14cm)
-i0 20 40 60 80 in.
I
40
X
in. cm
O 1.5 3.8
[] 51.0 129.5z_ 73.5 186.7
! i
- 20 0 20 in.I I I / I I I
80 120 160 200 cm -40 0 40 cm
Longitudinal distance, x Lateral distance,y
(e) M = 3.703; R = 2.25 x 10⁶ per ft (7.38 x 10⁶ per m).
Figure 24.- Continued.
81

7,,' ' '
. ,_ i'_
Y: •i_
il: i:;_<_
• < •
k/ 82
in.
20
y=0.0in. (0.0cm)
cm
40-
10N
o" 20-ca
•_ O- 0
ca
E -2o-o_ -10
>
-40 -
i -20! I l I l l I I
10 20 30 40 50 60 70 80 in.
I I I I l I I I I I
20 40 60 80 100 120 140 160 180 200 cm
Longitudinal distance,x
o V, deg
2 z=3.60in. (9.14cm) z=-3.60in. (-9.14cm)
-20 0 20 in. -20 0 20 in.I I I I I I
-40 0 40 cm -40 0 40 cm
Lateral distance, y Lateral distance, y
ell, deg 0
OH, deg 0
y=0.0in. (0.0cm)
z=3.60in.(9.14cm)
X
in. cm
© 1.5 3.8
[] 51.0 129.5A 73.5 186.7
z = - 3.60 i n. _,_itN__
(-9.14cm) _
20 40 60 80 in. -20 0 20 in:, • , , , , . ,40 80 120 160 200 cm -40 0 40 cm
Longitudinal distance x Lateral distance,y
(f) M = 4.185; R : 2.61 x 10⁶ per ft (8.56 x 10⁶ per m).
Figure 24.- Continued.

in. y=0.0in. (0.0cm)2O
• ) i
/! _i)_i:_
:/i•i !(.
<
• (<
cm
40-
10N
20-
E
•- O- 0
_Z-2o-,_ -10-
-40 - 1
-20i
I
0.3 0
I I I ! I I _0. 3
i0 20 30 40 50 60 70
I I I I I I I I I
20 40 60 80 i00 120 140 160 180
Longitudinal distance,x
V' deg
2z=3.60in. (g. 14cm) z=-3, 60in, (-9.14cm)
-20 0 20 in. -20 0 20 in.I I I I I I
-40 0 40 cm -40 0 40 cm
Lateral distance,y Lateral distance, y
80 in.
t200 cm
• /,[ ,
' [, •• ;
OH, deg 0
-1
OH, deg 0
-i
y=O. Oin. (0.0cm)
z=3.60in.(9.14cm)
z=-3.60in.
(-9.14cm)
I__
X
in. cm
0 _.5 3.8[] 51.0 129.5
z_ 73.5 186.7
0 20 40 60 80 in. -20 0 20 in.I I I I I I40 8; 120 160 -40 0 40 cm
Longitudinal distance,x Lateral distance,y
(g) M = 4.423; R = 2.86 x 10⁶ per ft
Figure 24.- Continued.
(9.38 × 10⁶ per m).
83

/
, <-< • .
••'c•i, /:¸"5
% _::/
.....if-:<
,i_i_I .!/_•
• _i' )i
• • ,:i:_.._
• / :i •' •
,, _ •i:;
84
n.
20cm
.= O- 0
ca
L=-20 -o_ -10>
-40 -
[-2(]
eH,deg 0
y=O. Oin. (0. Ocm)
I I
I0 20
I D
0 20 40
_. 2'"----
| I I
30 40 50I I I I I
60 80 I00 120 140
Longitudinal distance,x
2 z=3.60in. (9.14cm)
e v, deg 1
-20 0 20 in.I I I
-40 0 40 cmLateral distance, y
OH,deg 0
I I
60 70
I I
160 180
80 in.
200 cm
=-3.60in. (-9.14cm)
-20 0 20 in.I I I
-40 0 40 cmLateral distance,y
y=O. Oin. (0. Ocm)
0 20 40 60l l l I
40 80 120 160
Longitudinal distance,x
(h) M = 4.640; R = 2.99 x 10⁶ per ft (9.81 x 10⁶ per m).
Figure 24.- Concluded.

C i< t
<
<
m
om
EO
L.
Om
cm
14
12-
I0-
8 _
6-
4-
2-
0 e
_
4-
3-
2-
I-
Testo I
[] 2
sectionT
I i -! }
0 .2 .4 .6 .8 1.0
u/uoo
Figure 25.- Typical boundary-layer velocity profiles measured on sidewalls
of tunnel test section. M = 2.86; R : 3 x 10⁶ per ft (9.84 per m).
85

E_" ,,_. '_" oO "¢t . t:::: OO
,,O
e,w.'....._ X
0
o _ <_'O'_'_
I I I
I L I
Z
J
c_
r...4
,,D
n
u q,
• I I
I I I I I F
Lt_
N
J l
O
O
4_
O_
O
rd
rd
O
(1)
_ mc6
I ©_:_._
@
c6
I
C',I
1.4
-,--I
_D
CO
i. i illIIi ii iii!ii:

:; <:: _iii¸
/
L <i _
Pst/Pt
Pst/Pt
Pst/Pt
• 292,
.288
•28_440
•1o8_I
.104 _,_
100f_
09_64_
.038,,,,,,,,,
lliililll
_$iiiii•036_
" _--40I
-40
llft _ llm 060 2.00xl0 _ 6.56xi[] 4.00 13.12
_:, _...........__M=I. 47_
-20 0 20 40 60
i_!_ _ - '
'20 0 20 40 6O
1.46
M
1.47
2.12
2.14M
2.16
.................... _', ' 144+FI"_....... ',',,,._D,',', ',I ', [].[ _L-H-144_H+H4+H H444
-20 0 20 " 40
I I I I
-30 -20 -10 0
_4_r_r_rr_gN 2.80
___t 2.82H+I+t+F__I
2.84
60 OFI I
10 20 °C
M
Tdp, atm
Figure
(a) Test section i.
27.- Effect of dew point on probe static pressure.
87

: : :%: !: ::
7
, / .,
• i!_:/,:', } "
/
ii77<i_L_7!;i
• L , :
88
Pst/Pt
•088
.084
.080
ttt
:i_
_+
• l
ltTt_144
F_T
_+M H
.024 H__-,+÷l¢I:t
tXt
FN
/ Pt __Pst 022 t_÷_ _
I_H:trot!"t 111
020 .....• SHJ-40
•0032 _iT-_T44_
424-4-+:
Pst /Pt" 0028 _
_+_
• 0024 _-40
I-40
t_H
tttt
Htt
1i+q
i_L]
] l-t!
il;t4_
44H
a_-H+
-20
5_ItrLj tj
I111
H!t
F4t
F_<cfi-}4
+_t111#444
lfH
-20;fii
.1444
IIII
Iiii444_
S11-r
-20
O
O
IItI:tt44ttth , tSHfrttftttl!
0
_444441 Ii _#_4q14#4.L_45_H:+t H H_ b_
1 it tfttPVN tl t-t
t;:l#_# _H-I iF
_t_!T!!T!l-
J_+iH_fiii iJL
_14444_ _L44T_#
44_=II i 1144t_
tel t! t!t_tr!l m,
-tltft_,l fluff t t
N#!4 gJ,_4+-i4
0_mt&rrrtm
Ll44_$_44N,qTttt_tN_i ] i ] i i i i _ i i _
_mH_+44444+t-_ +H_ ++_i iJ i4 i$ii _ H
_F_N_m
llllliiii[iiii44
0
R
lift062.00xl 6.56x
4.00 13.12
tl!Ffii!_t4iilt!H!ti#ti! t!iHf _:i :J Utt !i q;_tfl_ml4,:!thldm4cih;
r +.... "Ni
f_NithrP_it_t_it]itil 7t7#!7I
20
7_fi}tI}1_HNiql
20i i4:i_@fl4CTiCJtf_[_
{_,i_lliiiiiiih%If_@FFFFfI+H4
]jjjjlii!j!H!hm! t_1 H
20
I I I I
l/m6
10
!! ;']'',,!!1,t!_:_ i, ili illlli!t .....!lttfttfit rl"t 11
....... iii$ " I l|I:NITHI!!i!_ :m_!!] !rtllltlltl!l ,,! !!!t
-" _'_'iij _H /i Millrl:i:HI,ti Ft tt_}lI_,_ '
l!!!!f!f71i7 l_t]7;t_t_2.28
b,_TtiIJd7 N_H:tttf_I2.3 o
_H4t__=2.3040 60
:tW_14
fffff_f tit IT_T$4 _- ÷_
u_ 3.12F i 4#4;_!ti[[7 u i .... tt-_ 3.14
_i_:3.22 _ 3.207_4 imHm Hi _FFH ;I-14
40 60i_T _47_
_mmmb44.60i i i ii Ht_lfft
_ i_ 4.68
F ]_tt_l'P_t_
I_ ;4444444_49444F#14 ,L,LIVIq
_[_ M=4.65 N
40 60
1__ ll0
o F
-30 -20 -I0 -0 20 °C
Tdp, atm
(b) Test section 2.
Figure 27.- Concluded.
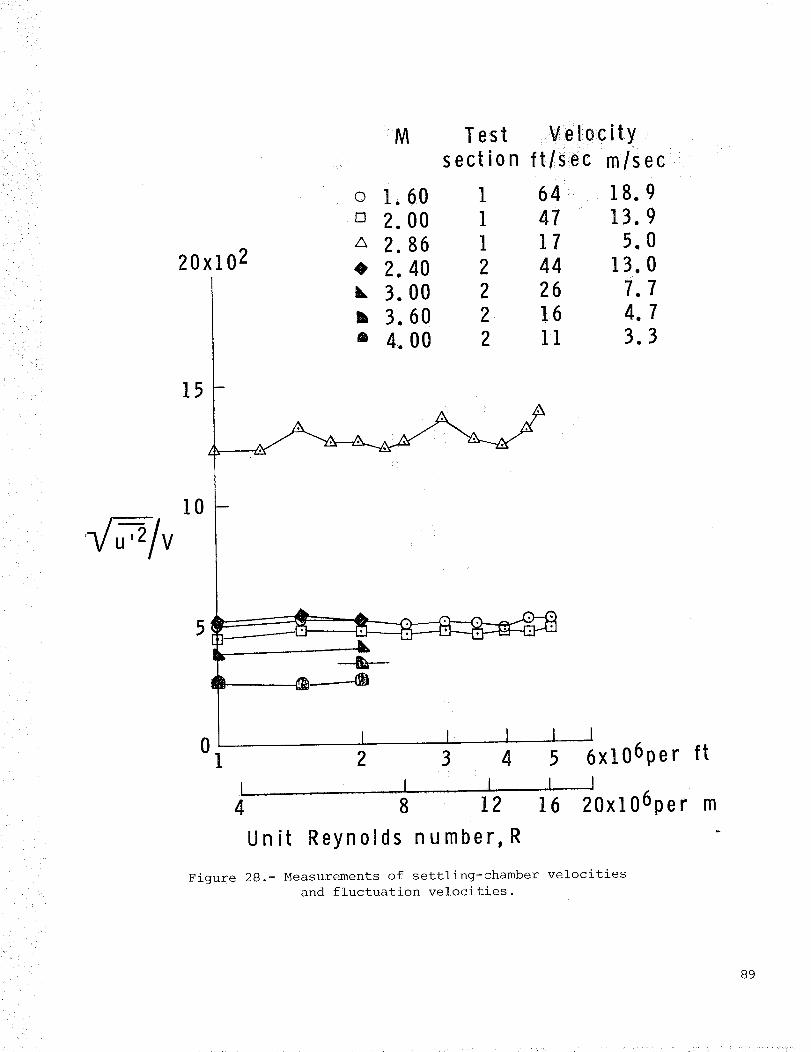
I:LII L_://
</
." !.;
_,: i i_
/ ill •
20x102
M Test Veloc itysection ftlsec mlsec
© I.60 1 64 18.9[] 2.00 1 47 13.9
2.86 1 17 5.0
4, 2.40 2 44 13.0
k, 3.00 2 26 7.7,,, 3.60 2 16 4.7t 4.00 2 11 3.3
iii_i
• ii
0 II 2
I
3
1 I4 8 12
Unit Reynolds number, R
I I lf
4 5 6xlO°p er ft
I .I 1
16 20xlO6per m
Figure 28.- Measurements of settling-chamber velocities
and fluctuation velocities.
89

< •• • <!i!• •_•••....• _ :;il)i:ilia!7!i .•
<oo
O©
_dr _
_W
Figure 29.- Photograph of i0 ° transition cone from reference 9.
L-79-7924

o--
_ I I I I .... I0
X _ X,o0 _ 00
X
1 I
OJ
c-O
.m
!--
OJ
X
X0
--00
E
_L
0
X
- ce't C3:C
_o0 _• _
-_ ._
¢-
e_
e"
_4
,-Q
o
0
O©0
,--4
m 0
_q
-,--I _
E
©
©(1)
qqq_
I
0
U_

• f•
;]
E
c-
oc-
c-O
Om
c-
8 xlO 6Conditions:
Adiabatic wallZero incidenceR=2.0x10 6 to 3.0x10 6 Per ft
(6.56x10⁶ to 9.84x10⁶per m)
F, Tunnel
I i NASA Langley 8TPTGROUP I A NASA Langley 16TDT• NSR DC7x10T
o AEDC 16T[] AEDC 4T
GROUP 2o ONERA, S-2 NIA
o r_ AEDC 16S[] (_ RAE Bedford 8 x 8 SWT
GROUP 3 1 q' NASA Langley 4 SPTNASA Langley UPWT (TS #1)
{_ NASA Langley UPWT (TS #2)GROUP 4 RAE Bedford 3 x 4 HSST
I I I I I1 2 3 4 .5
Free-stream Mach number. NI
Figure 31.- General trends of the variation of cone transition Reynolds number
with Mach number. Data are from reference 9. Wind-tunnel designations not
previously defined: NSR DC (Naval Ship Research and Development Center);
ONERA, S-2 MA (supersonic tunnel no. 2 at National Bureau of Aerospace
Research at Modane-Avrieux, France); RAE Bedford (Royal Aircraft
Establishment at Bedford, England).
92

0"_ 0
lel.uauJ1jadx3
009
"uJ
000[
x_°
3c-
3
o
I
¢D
_0
o
::3
C,7

N
in.
_' cm 20(J
¢-._40I"_ 20_10
_, 0- 0°__ -20 -_ -10 -
> -40 --20_1
-30
t=Osec t=5
i i i P i i i i i®[ = i i I t
0 30 -30 0 30 -30
I I I I I I 1 I I I I I I ,1 I I
-15 0 15 -15 0 15 -15
Tt-Tt, CL
t=15
I QI I
0I
30 -30
t=30
I I I I I
0 15
i ] lq J i I
0 30°R
I I t I I I I
-15 0 15 K
K
380 -
360
Tt, CL
340 -
320 -
t=Osec
°RI
750-
700
650
t=5._ t=15 __
..... .......
@
.)
I I I ! J
6000 I0 20 30 40 50
t, sec
/t=30 I_
(a) M = 2.49.
Figure 33.- Total-temperature variation across test section 2.
R : 3 x 10⁶ per ft (9.84 x 10⁶ per m).
94
L,

¢ .
N in.
_" cm 20,-- 40
.__ 20_
-20- t> -40- -20
-30
K
380 I
360 I
340 I
320L
t=0sec t=5 t=15 t=30
i i 9_ i L0
C)
°8.J
C)
¢t t _t t t i
30 -30 0t I t®l I l I
30 -30 0i i ¢)t I i I
30 -30 0 30°R
I, I I I I I,I
-15 0 15I i I I I j I I I I I I I l
-15 0 15 -15 0 15I I i I i I I
-15 0 15 K
t=0sec
750-
700 -
65O
6000
Tt-Tt, CL
[/ t=15 t=30
G
0
Q
Q
I I I I II0 20 30 40 50
t, sec
(b) M = 3.51.
Figure 33.- Continued.
95
• ..... : •. :r.,<<u/¸

}i/!:: :::
• i_ i_ _
L _
<
cmN
u 40-t-
-,-. 20_
0-
-20 -
,_ -40 -
Tt, CL
96
in ¸ ,
20
10
(0
-10
-20-30
360 -
340
320
t=Osec t=5 t=15 t=30
i iQI _ i0
i 9, i t i i
30 -30 0
I /Q I I t i
30 -30 0 30 -30
I I I I I I I
-15 0 15I I I I I I I
-15 0 15
L I_ i i i i
0 30 OR
i I I I ] I I L ] I
-15 0 15 -15
Tt-Tt, CL
I I I I
0 15 'K
t=Os,ec
750
700
650
60(
J jjt
(D(D
I I I I I
10 20 30 40 50
t, sec
(c) M = 4.44.
Figure 33.- Concluded.
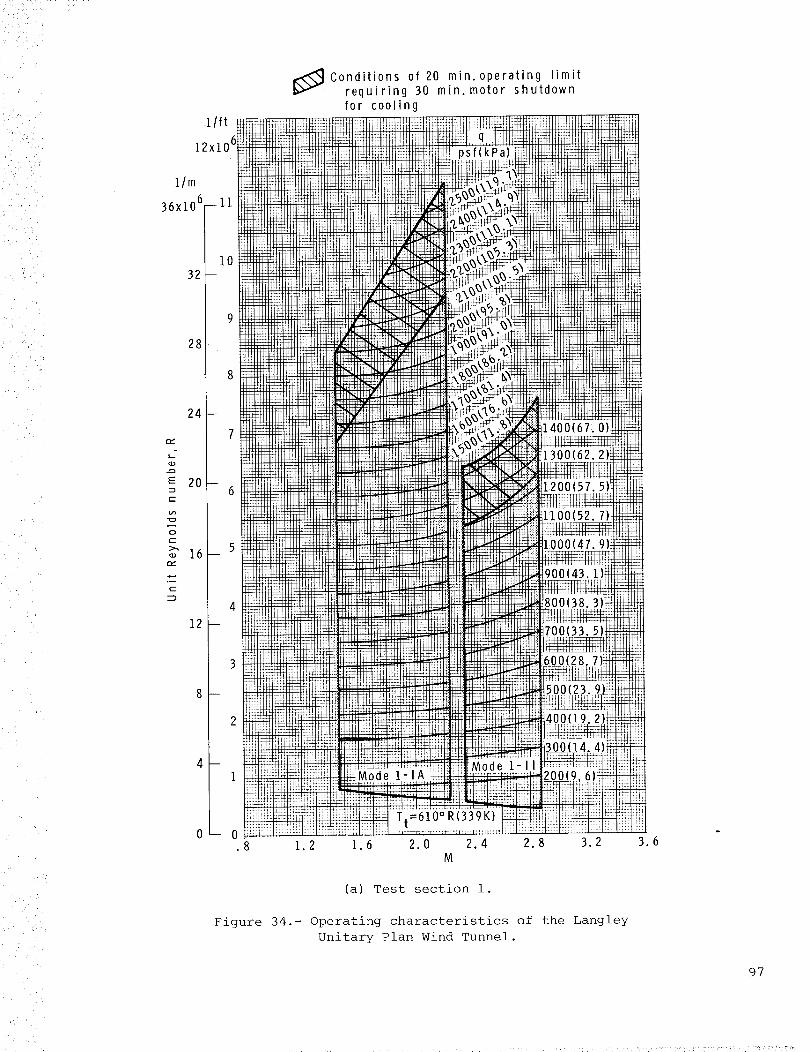
i,_'ii_ii!i_i!i_i!_iii _ "
/i,/i_ __ii/
ii _.
• 7
lift
12x
l/m
36x106
32
28
24
e_
L.
E 20
u,1
o
E
16
¢--
-"'1
12
Conditions of 20 min.operating limitrequiring 30 min. motor shutdownfor cooling
.8 1.2 1.6 2.0 2.4 2.8 3.2 3.6M
(a) Test section i.
Figure 34.- Operating characteristics of the Langley
Unitary Plan Wind Tunnel.
97

/x_ .i I •
L
i_I__"
> : }i >'i/
98
I/ft
12xiO 6
11m
36xi061 _If
i0
32 -
1.6
!it ;_:iJ !!
IL i_!:rt
:u
ii i_i- Ht
!ii
:i! I+
? i):ii
!_!: i!)(_ tH
(I
, 121
!l( '
:l
H
ii; ", =:i!itt
H tliU "+
:i!Iii
!?:, -,
_H
t'i ill
if''t i;'
H, if:
ii} '4:il )!
!_i !it11 :_!
:U
]i ii_ Hn
2.0
ill _iil! _ii_iii!_it_ Ilit Conditions of 20 rain.operating limit
requiring 30 rain. motor shutdown
(b) Test section 2.
Figure 34.- Concluded.

<
'i _ L _ •
• <i _:
/J'
AT t
K
8O
50-
40-i
3oL
oR
160
140
120
I00
8O
6O
4O I I I I I I I I
16-
i: _ ;v
/
' < _= !i _. '
t, sec
12-
8-
4-
02.0
I I I I I I I J
2.4 2.8 5.2 5.6 4.0 4.4 4.8 5.2
M
Figure 35.- Heat-pulse characteristics and time to stabilize for
heat-transfer tests in test section 2 of the Langley Unitary
Plan Wind Tunnel.
99
• , • •• • _ , 7; H •

L ¸ •
(i ! ¸
L
o
i00
8O
7O
6O
5O
4O
3O
2O
I0
Test section
.... - 12
R=
_-4. OOxlO6/ft
"\_ ._/--_ 2. OOx106/ft
T =150 ° F(339K)t Tt=175° F(353 K)
I I I I I I2 3 4
M
Figure 36.- Total operating power requirements for the
Langley Unitary Plan Wind Tunnel.
I
5


> •
'_ i%/
iilx j
1. Report No. J 2. Government Accession No.
INASA TP-1905
4. Title and Subtitle
DESCRIPTION AND CALIBRATION OF THE LANGLEY
UNITARY PLAN WIND TUNNEL
7 Author(s)
Charlie M. Jackson, Jr., William A. Corlett,
and William J. Monta
9.
12
PerformingOrganizationNameand Addre_
NASA Langley Research Center
Hampton, VA 23665
S_nsoring Agency Nameand Address
National Aeronautics and Space Administration
Washington, DC 20546
3. Recipient's Catalog No.
5. Report Date
November 1981
6. Pedorming Or_nization Code
505-42-23-02
8. PerformingOr_n,zation ReportNo.
L-14024
10. Work Unit No.
'11. Contract or Grant No.
13. Type of Report and Period Covered
Technical Paper
14. Sponsoring Agency Code
15. Supplementary Notes
16. Abstract
The two test sections of the Langley Unitary Plan Wind Tunnel have been calibrated
over the operating Mach number range from 1.47 to 4.63. The results of the cali-
bration are presented along with a description of the facility and its operational
capability. The calibrations include Mach number and flow-angularity distribu-
tions in both test sections at selected Mach numbers and tunnel stagnation pres-
sures. Calibration data are also presented on turbulence, test-section boundary-
layer characteristics, moisture effects, blockage, and stagnation-temperature
distributions. The faci!ity is described in detail including dimensions and
capacities where appropriate, and examples of special test capabilities are pre-
sented. The operating parameters are fully defined and the power-consumption
characteristics are discussed.
17. Key Words(Sugg_ted by Author(s))
Wind-tunnel description
Wind-tunnel calibration
Supersonic wind tunnel
19. S_urity Clasif.(ofthisreport)
Unclassified
18. Distribution Statement
Unclassified - Unlimited
20. S_urityClassif.(ofthis pege)
Unclassified
Subject Category 02
21. No. of Pages 22. Dice
103 A06
For sale by the National Technical Information Service, Springfield, Virginia 22161
NASA-Langley, 1981