Embed Size (px)
Citation preview
Title stata.com
Tables Builder — Tables Builder
Description Menu Remarks and examples
DescriptionAfter you have collected results using collect get, collect:, etable, or table, use the Tables
Builder to create tables of the results. In the Tables Builder, you can
• choose which results go in a table,
• lay out the rows and columns,
• change how row and column headers are arranged,
• change the look of anything, and
• export a table to Microsoft Word, Microsoft Excel, PDF, HTML, LATEX, SMCL, Markdown,and plain text.
MenuStatistics > Summaries, tables, and tests > Tables and collections > Build and style table
Remarks and examples stata.com
Remarks are presented under the following headings:
OverviewLaying out a tableLaying out a multiway tableModifying the layoutLaying out stacked dimensionsMultiple tablesChanging row and column headers
Text/labelsLayoutAppearanceShow/hide factor-variable base levels and empty cellsShow/hide omitted coefficients
Changing cell/results appearanceNumeric formatsBorders and horizontal or vertical rulesBold, italics, text color, and suchCell colorMarginsJustification/alignment
Adding significance starsAdding a custom table titleChanging table title appearanceAdding table notesChanging table note appearanceExporting a tableAdvanced tools
1
2 Tables Builder — Tables Builder
Position of interceptAutomatic dimension levelsRename dimension levelsRemap tags
OverviewThe Tables Builder works with an existing collection. You create a collection by collecting results
from commands using collect get, collect, etable, and table. The Tables Builder lets youchoose which results go in a table, lay out the rows and columns of a table, change how row andcolumn headers are arranged, change the look of anything in the table, and export a table to MicrosoftWord, Microsoft Excel, PDF, HTML, LATEX, SMCL, Markdown, and plain text.
You launch the Tables Builder by selecting the menu item Statistics > Summaries, tables, andtests > Tables and collections > Build and style table
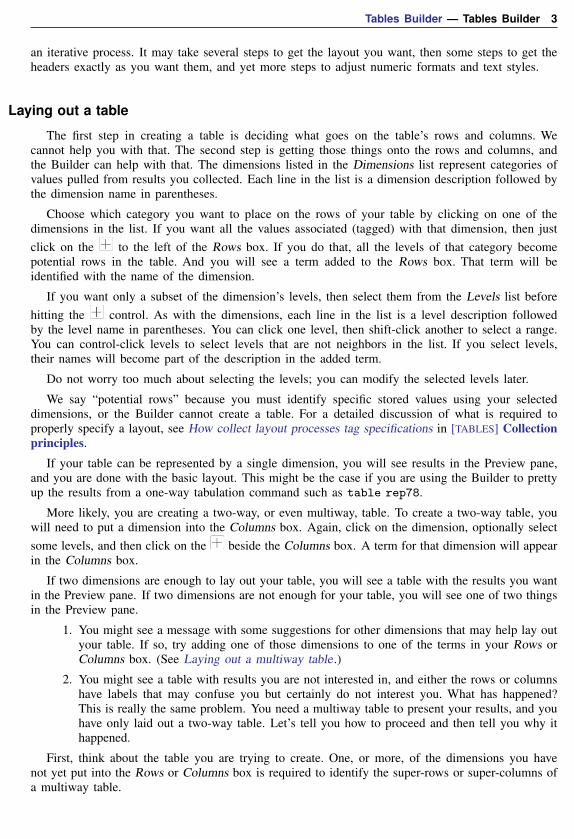
You can see the major components of the Tables Builder in this diagram.
Dimensions list Levels list Add button Term Rows block Columns block Tables block
Dialog buttons Preview pane
To use the Builder, you will need a basic understanding of what a collection is. In particular,if seeing the words Dimensions and Levels above leaves you confused, read Tags, dimensions, andlevels in [TABLES] Intro 2.
If you are creating a table only to understand your data, you probably just need to lay out yourtable. If you are creating a table for publication or to otherwise share with others, that is likely to be
Tables Builder — Tables Builder 3
an iterative process. It may take several steps to get the layout you want, then some steps to get theheaders exactly as you want them, and yet more steps to adjust numeric formats and text styles.
Laying out a table
The first step in creating a table is deciding what goes on the table’s rows and columns. Wecannot help you with that. The second step is getting those things onto the rows and columns, andthe Builder can help with that. The dimensions listed in the Dimensions list represent categories ofvalues pulled from results you collected. Each line in the list is a dimension description followed bythe dimension name in parentheses.
Choose which category you want to place on the rows of your table by clicking on one of thedimensions in the list. If you want all the values associated (tagged) with that dimension, then justclick on the to the left of the Rows box. If you do that, all the levels of that category becomepotential rows in the table. And you will see a term added to the Rows box. That term will beidentified with the name of the dimension.
If you want only a subset of the dimension’s levels, then select them from the Levels list beforehitting the control. As with the dimensions, each line in the list is a level description followedby the level name in parentheses. You can click one level, then shift-click another to select a range.You can control-click levels to select levels that are not neighbors in the list. If you select levels,their names will become part of the description in the added term.
Do not worry too much about selecting the levels; you can modify the selected levels later.
We say “potential rows” because you must identify specific stored values using your selecteddimensions, or the Builder cannot create a table. For a detailed discussion of what is required toproperly specify a layout, see How collect layout processes tag specifications in [TABLES] Collectionprinciples.
If your table can be represented by a single dimension, you will see results in the Preview pane,and you are done with the basic layout. This might be the case if you are using the Builder to prettyup the results from a one-way tabulation command such as table rep78.
More likely, you are creating a two-way, or even multiway, table. To create a two-way table, youwill need to put a dimension into the Columns box. Again, click on the dimension, optionally selectsome levels, and then click on the beside the Columns box. A term for that dimension will appearin the Columns box.
If two dimensions are enough to lay out your table, you will see a table with the results you wantin the Preview pane. If two dimensions are not enough for your table, you will see one of two thingsin the Preview pane.
1. You might see a message with some suggestions for other dimensions that may help lay outyour table. If so, try adding one of those dimensions to one of the terms in your Rows orColumns box. (See Laying out a multiway table .)
2. You might see a table with results you are not interested in, and either the rows or columnshave labels that may confuse you but certainly do not interest you. What has happened?This is really the same problem. You need a multiway table to present your results, and youhave only laid out a two-way table. Let’s tell you how to proceed and then tell you why ithappened.
First, think about the table you are trying to create. One, or more, of the dimensions you havenot yet put into the Rows or Columns box is required to identify the super-rows or super-columns ofa multiway table.
4 Tables Builder — Tables Builder
If you cannot think of any dimensions that you should add, clear your current layout by clicking onthe button in the lower left of the Builder. Repeat the process of selecting and adding dimensionsto your layout, but this time carefully select only the levels you are interested in. Now you will seea message in the Preview pane, and you can go back and proceed from item 1 above.
So what happened to create that useless table? The commands that collect results collect everythingby default, including things you may not want on your table. You may have noticed this when selectingdimensions for your table. You may have seen levels like c1 and c2 that do not interest you. Regardless,they are in the collection, as are the values they tag. When the Builder laid out your table by searchingover all the levels in the dimensions you selected for rows and columns, it found results that exactlymatched some of the row/column tag combinations. That happened because you asked for a two-way table when you wanted to ask for a three-way or higher multiway table. Once you add thedimensions for a multiway table, the results found for the mistaken two-way table will no longer befound—they only match the unwanted two-way table. For more details than you probably want aboutwhat is required to properly specify a layout, see How collect layout processes tag specifications in[TABLES] Collection principles.
Laying out a multiway table
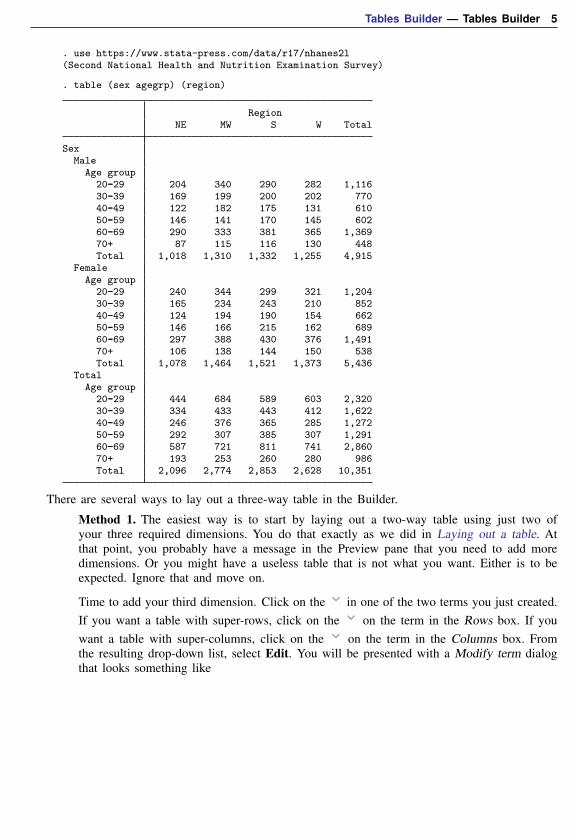
A multiway table has super-rows, super-columns, or both to present results that require more thantwo dimensions. Consider a cross-tabulation of frequencies by the categorical variables sex, region,and agegrp. Those counts form a cube with dimensions for each of the categorical variables. Wecannot put three-way results directly on a two-way table. What we can do is create a three-waytable using super-columns or super-rows for one of the dimensions. Here is what that looks like withsuper-rows for sex:
Tables Builder — Tables Builder 5
. use https://www.stata-press.com/data/r17/nhanes2l(Second National Health and Nutrition Examination Survey)
. table (sex agegrp) (region)
RegionNE MW S W Total
SexMale
Age group20--29 204 340 290 282 1,11630--39 169 199 200 202 77040--49 122 182 175 131 61050--59 146 141 170 145 60260--69 290 333 381 365 1,36970+ 87 115 116 130 448Total 1,018 1,310 1,332 1,255 4,915
FemaleAge group
20--29 240 344 299 321 1,20430--39 165 234 243 210 85240--49 124 194 190 154 66250--59 146 166 215 162 68960--69 297 388 430 376 1,49170+ 106 138 144 150 538Total 1,078 1,464 1,521 1,373 5,436
TotalAge group
20--29 444 684 589 603 2,32030--39 334 433 443 412 1,62240--49 246 376 365 285 1,27250--59 292 307 385 307 1,29160--69 587 721 811 741 2,86070+ 193 253 260 280 986Total 2,096 2,774 2,853 2,628 10,351
There are several ways to lay out a three-way table in the Builder.
Method 1. The easiest way is to start by laying out a two-way table using just two ofyour three required dimensions. You do that exactly as we did in Laying out a table. Atthat point, you probably have a message in the Preview pane that you need to add moredimensions. Or you might have a useless table that is not what you want. Either is to beexpected. Ignore that and move on.
Time to add your third dimension. Click on the in one of the two terms you just created.If you want a table with super-rows, click on the on the term in the Rows box. If youwant a table with super-columns, click on the on the term in the Columns box. Fromthe resulting drop-down list, select Edit. You will be presented with a Modify term dialogthat looks something like
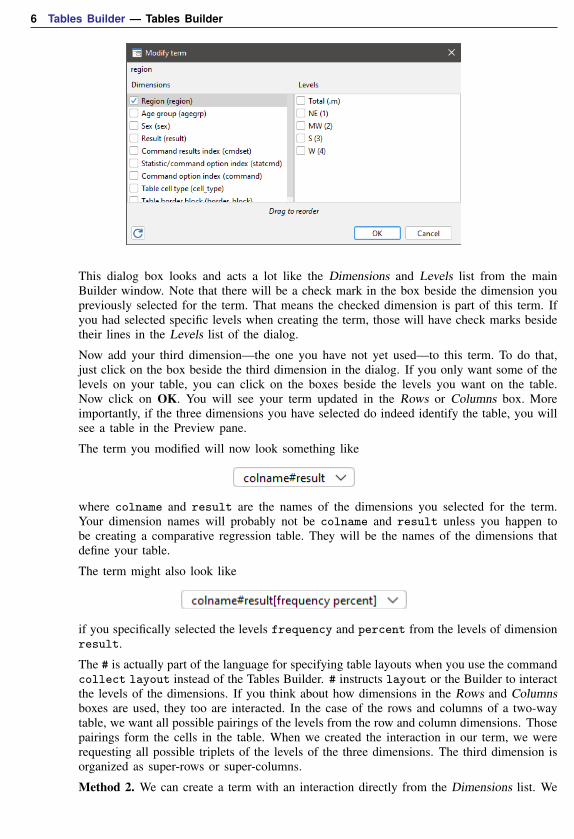
6 Tables Builder — Tables Builder
This dialog box looks and acts a lot like the Dimensions and Levels list from the mainBuilder window. Note that there will be a check mark in the box beside the dimension youpreviously selected for the term. That means the checked dimension is part of this term. Ifyou had selected specific levels when creating the term, those will have check marks besidetheir lines in the Levels list of the dialog.
Now add your third dimension—the one you have not yet used—to this term. To do that,just click on the box beside the third dimension in the dialog. If you only want some of thelevels on your table, you can click on the boxes beside the levels you want on the table.Now click on OK. You will see your term updated in the Rows or Columns box. Moreimportantly, if the three dimensions you have selected do indeed identify the table, you willsee a table in the Preview pane.
The term you modified will now look something like
where colname and result are the names of the dimensions you selected for the term.Your dimension names will probably not be colname and result unless you happen tobe creating a comparative regression table. They will be the names of the dimensions thatdefine your table.
The term might also look like
if you specifically selected the levels frequency and percent from the levels of dimensionresult.
The # is actually part of the language for specifying table layouts when you use the commandcollect layout instead of the Tables Builder. # instructs layout or the Builder to interactthe levels of the dimensions. If you think about how dimensions in the Rows and Columnsboxes are used, they too are interacted. In the case of the rows and columns of a two-waytable, we want all possible pairings of the levels from the row and column dimensions. Thosepairings form the cells in the table. When we created the interaction in our term, we wererequesting all possible triplets of the levels of the three dimensions. The third dimension isorganized as super-rows or super-columns.
Method 2. We can create a term with an interaction directly from the Dimensions list. We
Tables Builder — Tables Builder 7
start as we always do. Pick a dimension, and possibly select levels; then, use one of thecontrols to put it into the Rows or Columns box. Then, click on that newly added term.
It will be highlighted. Then, select the third dimension from the Dimension list, and clickon the control for the Rows or Columns box where the term is highlighted. The newdimension will be added to the highlighted term, and it will become an interaction term.Finally, add one or more other dimensions to the empty Rows or Columns box.
Other methods. We did not have to perform all the steps in method 1 or method 2 inexactly the order as written. And we can mix and match the methods from method 1 andmethod 2. Put one term into the Rows box and then another into the Columns box; thenuse method 2 to create interaction terms. We can delete terms and start over.
Moreover, we can create four-way tables, five-way tables, all the way up to silly-way tables.We can use method 1 and method 2 to create as complex a multiway table as we like.The important thing is to get our the interaction terms that specify our rows, super-rows,super-super-rows, . . . ; and our columns, super-columns, . . . built so that we get the tablewe want.
Modifying the layout
There are four main things we might want to change in a layout:
1. Make the rows columns and the columns rows.2. Make super-rows rows and rows super-rows.3. Make super-columns columns and columns super-columns.4. Add or remove levels from a dimension.
1. Make the rows columns and the columns rows. Swapping rows and columns is both acommon desire and easy. You might accidentally put a dimension on the columns andrealize that 87 cities makes for a truly wide table. Drag the cities dimension to the Rows box,where you always wanted it, and drag whatever dimension is in the Rows box to the Columns box.Done.
This works with terms that have interactions too. If you drag an interaction term from the Rowsbox into the Columns box, you are simply converting the whole super-row/row structure into asuper-column/column structure. And vice versa when dragging from the Columns box to the Rowsbox.
2. Make super-rows rows and rows super-rows. This is a little more subtle, and you may havealready encountered it if you tried your own example when we discussed multiway tables above. Weshowed a table in Laying out a multiway table . It had levels of the dimension sex as super-rows andlevels of the dimension agegrp as rows. That makes the comparison of age groups within sex easy.What if you really wanted to compare females and males within age groups?
We need to swap the dimensions that are on the rows and super-rows. First, click on the on theterm in the Rows box, and select Edit to launch the Modify term dialog. You would
see that the sex and agegrp dimensions are checked and that sex appears above agegrp. Simplyclick-and-hold on the agegrp dimension, and drag it above the sex dimension. Or click-and-holdon the sex dimension, and drag it below agegrp. Click on OK. The dimensions on the rows andsuper-rows have been swapped. The rows for females and males are now adjacent.
8 Tables Builder — Tables Builder
That is the general idea, and it also works for multiway terms where more than two dimensionsare interacted.
3. Make super-columns columns and columns super-columns. This is really just step 2.Reread step 2, and substitute “column” everywhere you see “row”.
4. Add or remove levels from a dimension. You have rows you do not want, or columns thatyou want are missing. You may have done this to yourself when creating terms by selecting too fewor too many levels for a dimension. Or you may have a collection from table that makes prettydraconian assumptions about which result dimensions you want from any command() options.
If you have been reading along, you may have guessed the answer to this one. Click on theof the term for which you want to add or remove levels, and select Edit to launch the Modify termdialog. In the dialog, click on the dimension for which you want to change the list of levels. Thencheck or uncheck levels until all the levels you want are checked, and only the levels you want arechecked.
Laying out stacked dimensions
There are cases where you do not want to interact a dimension with another dimension on the rowsor columns as we did in Laying out a multiway table . Instead, you want to stack some results belowsome other results. (Or perhaps stack them to the right if the original results are on the columns.)
Consider a table comparing two regressions. Each regression appears in a column, so you al-ready have the term in the Columns box. The coefficients and perhaps their standarderrors and confidence intervals appear on the rows. The values for these statistics require that youalso know the covariates. That means the Rows box will have an interaction term that looks like
.
Suppose you also want to place some of the model-level statistics below the coefficients and theirstatistics. Say you want the R-square, the model F statistic, and the p-value of the model F statistic.To add these statistics to the bottom of each regression, click on Result (result) in the Dimensionslist, and then control-click on R-square (r2), Model F test (F), and Model test p-value (p) in theLevels list. Then, after making sure that nothing is selected in the Rows box, click on the besidethe Rows box. You will see a new term added to the Rows box, and the model-level statistics willbe added to the bottom of the table.
Multiple tables
We have thus far completely ignored the Tables box. It has just one job. Instead of creatingsuper-rows or super-columns, any dimension placed in the Tables box creates multiple tables—onefor each level of the dimension. If you place or create an interaction term in the Tables box, a newtable will be produced for all combinations of the levels in the term.
What is more, you already know how to use it. Placing dimensions into the Tables box or creatinginteraction terms in the Tables box works exactly as it works in the Rows and Columns boxes. Youcan also drag terms into the Tables box from the Rows or Columns boxes, and vice versa.
Tables Builder — Tables Builder 9
Changing row and column headers
Row headers are the descriptions of the rows that you see along the left of a table. Column headersare the descriptions of the columns that you see along the top of a table. These headers are thereader’s guide to understanding your table. If the headers are good, your table will be easy to readand understand. If the headers are bad, readers will be left scratching their heads.
Perhaps you are lucky, and your variable labels along with the default result labels and the defaultheader composition will be just what you want. Perhaps not. If not, there is plenty of control for theheaders in the Builder. You just have to know where to look.
Let’s start with the easiest part, the text actually written in the headers.
Text/labels
You can change the label for any dimension on your table. This is the label for the dimensionitself, not for the levels of the dimension. It is the levels that actually form the rows and columns ofyour table. Sometimes, the dimension label is shown in the header; sometimes, it is not. See Layoutfor a discussion.
To change one or more of your dimension labels, click on the button Edit dimension labels tolaunch the dimension labels dialog. There you can select dimensions, see their current label, andchange that label.
You can also change the labels for levels in a dimension. These labels almost always appear onthe table because they identify the rows and columns. An exception is comparative regression tablesthat sometimes identify standard errors by placing them in parentheses and confidence intervals byplacing them in brackets. Such tables often dispense with labeling the statistics, the levels, altogether.Regardless, if you want to change labels for levels, click on the Edit level labels button to launcha dialog for editing labels. In that dialog, you can choose the dimension with the levels you wantto change, choose the level you want to change, see the current label for the level, and change thatlabel.
Layout
There are two components to header layout—what things are shown and hidden, and how thelabels and names are composed to form the header.
Let’s start with what is shown and hidden. In Text/labels, we alluded to cases where dimensionlabels themselves might or might not be shown. Consider a dimension created from a birth sexvariable. The two levels in that dimension would likely be labeled Female and Male. Those labelsare self-explanatory and do not need any additional labeling to be clear. We do not need, and probablydo not want, the label for the dimension itself. We would be perfectly happy with row headers thatlook like this:
Female ...Male ...
10 Tables Builder — Tables Builder
Now consider a variable from a Likert scale. Say we are talking about websites, and the labelon the dimension is “Easy to navigate”. The levels are labeled “Strongly agree”, “Agree”, “Neutral”,“Disagree”, and “Strongly disagree”. Those level labels do not mean anything by themselves. Weneed the dimension label—“Easy to navigate”. We now need row headers that look like this:
Easy to navigateStrongly agree ...Agree ...Neutral ...Disagree ...Strongly disagree ...
Click on the Show/hide header content to launch a dialog that lets you control which labels ornames are shown. You can choose to show labels, show names, or show nothing (hide). You can makethis decision for dimensions, for all levels in a dimension, or for individual levels in a dimension.You can even set the default behavior across all dimensions and levels.
Once your header content is set, you can change how row and column headers are composed orconstructed. You do that by clicking on the Compose row headers or Compose column headersbutton.
That word “composed” encompasses a lot of choices. Let’s consider a few.
Do you want cross-tabulation row headers that look like
Female EastFemale WestFemale NorthFemale SouthMale East...
or like
FemaleEastWestNorthSouth
MaleEast
...
Then choose either Split elements across columns or Stack elements in a single column on theCompose row headers dialog.
Do you want your factor-variable interactions to look like
Sex # RegionFemale # EastFemale # WestFemale # NorthFemale # SouthMale # East...

Tables Builder — Tables Builder 11
or like
SexRegion
FemaleEastWestNorthSouth
MaleEast
...
Then choose between Compose factor-variable elements in a single cell and Split factor-variableelements into separate cells on the Compose row headers dialog.
Similar choices can be made about column headers on the Compose column headers dialog.
There are many other changes to row and column headers you can make from these dialog boxes.We suggest you launch the dialogs and explore.
Appearance
You can change many things about the appearance of row and column headers, including bordersand horizontal or vertical rules, bolding, italics, font color, cell color, margins, and justification.
To change any of these properties for the row headers, click on the Cell appearance styles button.In the resulting dialog, click on one of the check boxes for the dimension and level rows, andthen select Table cell type (cell type) as the dimension. If you want to change the appearance ofrow headers, select row-header for the level. Alternately, if you want to change the appearance ofcolumn headers, select column-header for the level. Then click on any of the dialogs tabs—Borders,Diagonals, Fonts, Shading, Margins, Alignments, or Formats—and make any appearance changesyou want on that tab.
You can even target the appearance change to specific rows or columns. You do that by choosinga second dimension on the dialog. Choose one of the dimensions that is on the rows or columns ofyour table. Then, select the level of the dimension for the specific row or column header you wantto change. Finally, make the appearance changes you want on one of the tabs.
Show/hide factor-variable base levels and empty cells
Many applications of factor variables require that one of the levels in the variable be declared abase level. In those applications, nothing is estimated for that level, making its coefficient effectively0. By default, tables produced by the Builder include base levels for factor variables in the table with0s for coefficients or means and blanks for standard errors and other statistics about the coefficientor mean.
If you would rather have base categories dropped from a table, click on the Show/hide coefficientstyles button. On the resulting dialog, select Show base levels for factor variables. You then haveseveral choices for which base levels are shown. You can show base levels for factor variables butnot for interactions, show base levels for both factor variables and for interaction, or remove all baselevels.
Factor variables can be interacted, and sometimes there are no observations in one of thoseinteractions. Consider the interaction of race (which includes Aleut Eskimo) with city regions in LosAngeles (LA). If there are no Aleutians residing in East LA, then we say that cell of the interactionis empty.

12 Tables Builder — Tables Builder
As with base categories, you can control whether empty cells are shown or hidden on the dialoglaunched by the Show/hide coefficient styles button.
We put this discussion in Changing row and column headers because showing or hiding factor-variable base levels adds or removes entire rows or columns from the table, including their headers.
Show/hide omitted coefficients
Regressions and other estimators require that covariates not be collinear. If they are, this is flaggedin the output with a 0 coefficient and an (omitted) note. By default, tables produced by the Builderinclude collinear covariates with 0s for coefficients or means, and blanks for standard errors and otherstatistics about the coefficient or mean.
You can specify that collinear covariates instead be dropped from the results by clicking on theShow/hide coefficient styles button. On the resulting dialog, select Show omitted coefficients, andthen click on the Off radio button.
Changing cell/results appearance
You can change just about anything about how the values in your table look—numeric formats,borders, horizontal and vertical rules, bolding, italics, font, text color, cell color, margins, justification,and more. This is all done in the dialog launched by the Cell appearance styles button.
If you want to change the default look of everything on the table, including the headers, clickon the radio button labeled Edit base style. Then click on one of the tabs—Borders, Diagonals,Fonts, Shading, Margins, Alignments, or Formats. Whatever changes you make on those tabs willapply to all text or cells throughout the entire table, both cells in the body of the table and in theheaders. Because you are modifying the base appearance, if you have previously made changes tomore specific tags (dimensions and levels), those changes will still be applied.
To make changes that override the default appearance for everything, first click on the radio buttonlabeled Edit styles for specified tags.
If you want to change the appearance of only the results and cells in the body of the table, andnot the headers, then select the dimension Table cell type (cell type) and select the level item. Nowany changes you make on the other tabs applies to all results and cells in the main body of the table,and not to any of the headers.
You can be specific about which results are affected by the appearance changes you make on theother tabs. For example, if your table has regression results, you could select the Result (result)dimension, then select Coefficient ( r b). Any changes you make after that affect only the coefficients.You might then click on the Formats tab and change the format type to Fixed numeric with 2 digitsto the right of the decimal. You could make the same changes to the Std. error ( r se) and 95%CI ( r ci) by repeating the process on those levels.
You can get even more specific. So far, we have picked only one dimension. The Main tab ofthe dialog allows you to pick up to 10 dimensions. Continuing with the regression example fromthe prior paragraph, after selecting Coefficient ( r b) from the Result (result) dimension, we mightnow pick a second dimension, say, Covariate names and column names (colname). Imagine we aretrying to highlight the results from one of the covariates in our regression. We would then select thatcovariate from the Level drop-down list. So we have two things: the coefficient and the covariatewe want to emphasize. With those two tags chosen, any changes we make on the other tabs affectonly the coefficient and our chosen covariate. We can highlight those results any way we wish—bold,italics, text color, cell color, etc. You could make the same changes to the Std. error ( r se) and95% CI ( r ci) of the covariate by repeating the process on those levels.
Tables Builder — Tables Builder 13
It is important to realize that not all appearance edits can be rendered on all export formats. Forexample, plain text (.txt) is called “plain” for a reason. Aside from numeric formats and somehorizontal and vertical rules, nothing from the appearance edits can be rendered in plain text. Mostappearance edits can be rendered in HTML, PDF, Microsoft Word, and Microsoft Excel. Many, butfewer, can be rendered in LATEX. No export format can render all the changes you can make on thisdialog.
Because the Preview pane renders one of the exports, you also will not be able to see all appearanceedits in the Preview pane. On Windows and Macintosh, the preview is HTML, so you will see mostappearance edits. On Linux, the preview is plain text, so you will see almost none of your edits.
Numeric formats
Make changes to numeric formats on the Formats tab. There you can also specify the delimitersfor confidence and credible intervals.
Borders and horizontal or vertical rules
Add or remove borders around cells on the Borders tab. You can create horizontal rules byspecifying borders only on the top or bottom of cells. You can create vertical rules by specifyingborders only on the left or right of cells.
Bold, italics, text color, and such
Make table text bold or italic, or change its color on the Fonts tab. You can also underline texton the Fonts tab, or render it with a strikeout. You can even put text in all capitals or initial capitals.There are also some special settings for LATEX and SMCL export. You can specify the font family, butthat must be done in a way that is supported by your intended export format.
Cell color
Change background and foreground cell color on the Shading tab. You can also set fill patternson that tab.
Margins
Set margins for the cells on the Margins tab. You can add “in”, “cm”, or “pt” to any value youtype here to specify that the margin is to be in inches, centimeters, or printers points.
Justification/alignment
Align text to the left or right and to the top or bottom on the Alignments tab.
Adding significance stars
You can add significance stars to coefficients in the dialog launched by clicking on the Constructsignificance stars. In fact, you can add any text you like to any result you like using rules on thevalue of any result you like. You can even limit the application of the “stars” to selected tags. A tagis defined by a dimension and one of its levels.

14 Tables Builder — Tables Builder
Adding a custom table title
You can add a custom table title in the dialog launched by clicking on the Custom table title.
Changing table title appearance
You can change the appearance of table titles in the dialog launched by the Table title stylesbutton. Click on the Fonts tab to change the font, size, text color, bolding, italics, and more. Clickon the Shading tab to change the background color, foreground color, and fill pattern.
Adding table notes
You can add table notes in the dialog launched by clicking on the Table notes.
Changing table note appearance
You can change the appearance of table notes in the dialog launched by the Table notes stylesbutton. Click on the Fonts tab to change the font, size, text color, bolding, italics, and more. Clickon the Shading tab to change the background color, foreground color, and fill pattern.
Exporting a table
Export your table by clicking on the Export ... button. You can choose from several exportformats—Microsoft Word, Microsoft Excel, PDF, HTML, LATEX, SMCL, Markdown, and plain text.
Advanced tools
Position of intercept
When your table contains regression results, the intercept is placed by default after all the othercoefficients. If you prefer, you can have it placed before the other coefficients. Use the dialog launchedfrom the Intercept position button.
Automatic dimension levels
If you requested specific results when creating your collection, the meaning of a dimension usedalone in the Builder has been changed. For example, to collect results, you could type
. collect _r_b _r_ci: regress . . .
If you then add the Result (result) dimension to one of the Rows or Columns boxes withoutchoosing any levels from the Level list, that dimension will no longer represent the result dimensionand all of its levels. It will instead represent only the levels you specified on dimension result whenyou collected the results.
Another way automatic levels are defined is when your collection was created by the tablecommand and you specified one or more command() options. table makes some choices on its ownabout what you would like to see in your table.
Tables Builder — Tables Builder 15
Regardless of whether you requested specific results at collection time or table made somechoices for you, you can change these “automatic” dimension levels by clicking on the Automaticdimension levels button. On that dialog, you can clear the automatic levels for any dimension. Youcan redefine the automatic levels for any dimension. Or you can create a new list of automatic levelsfor any dimension.
All of this can be tremendously helpful when typing commands to lay out a table. The Buildermakes it so easy to select levels while you are choosing dimensions for the rows or columns thatautomatic levels are rarely helpful.
The most likely surprise you will encounter in the Builder occurs after a table command thatincluded regressions specified in the command() option. You might then place the Results (results)dimension into the Rows or Columns boxes without selecting specific levels. If you do, only thecoefficients will be shown. That is because table set the automatic levels of dimension result tobe just the coefficients.
You could click on the Automatic dimension levels button and redefine the automatic levels forresult. But why? You can just click on the on the term, select Edit, and click onwhatever levels you want in the Modify term dialog.
Rename dimension levels
You can rename, or formally recode, any level from any dimension in the dialog launched byclicking on the Recode dimension levels button. That would rarely be done from the Builder.
Remap tags
Another, even more advanced, operation you can perform from the Builder is to remap dimensionsand their tags. Click on the Remap tags button to launch a dialog. On that dialog, you can movea level from one dimension to another dimension, create new dimensions and populate them fromexisting levels in existing dimensions, and rename a dimension. You can even limit this remappingto values where combinations of other tags are set.