Embed Size (px)
Citation preview
1
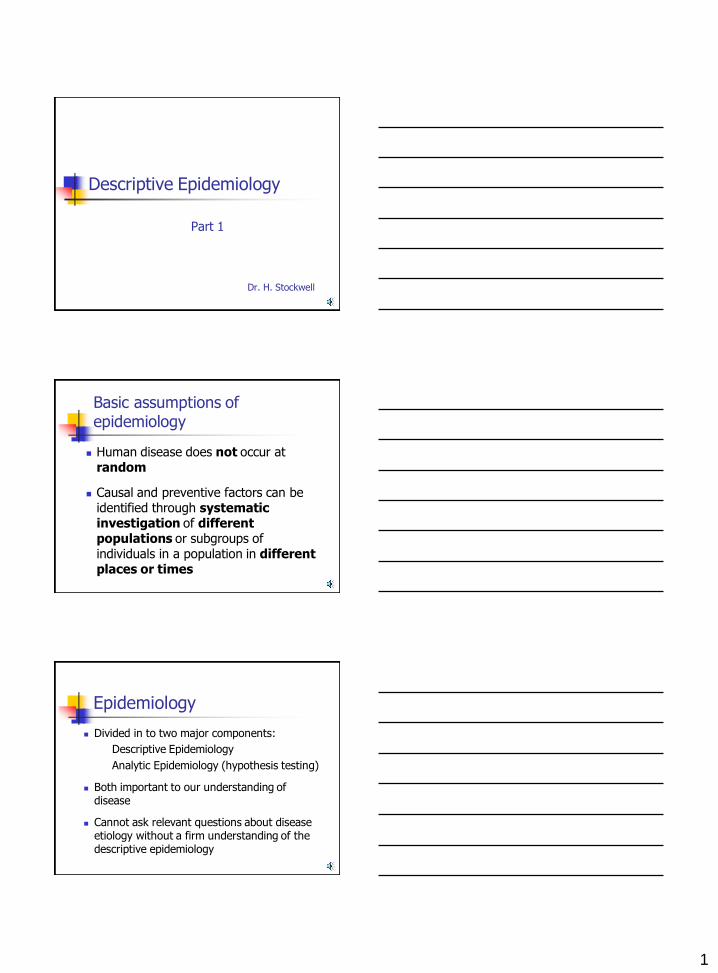
Descriptive Epidemiology
Part 1
Dr. H. Stockwell
Basic assumptions of epidemiology
Human disease does not occur at random
Causal and preventive factors can be identified through systematic investigation of different populations or subgroups of individuals in a population in different places or times
Epidemiology
Divided in to two major components:
Descriptive Epidemiology
Analytic Epidemiology (hypothesis testing)
Both important to our understanding of disease
Cannot ask relevant questions about disease etiology without a firm understanding of the descriptive epidemiology
2
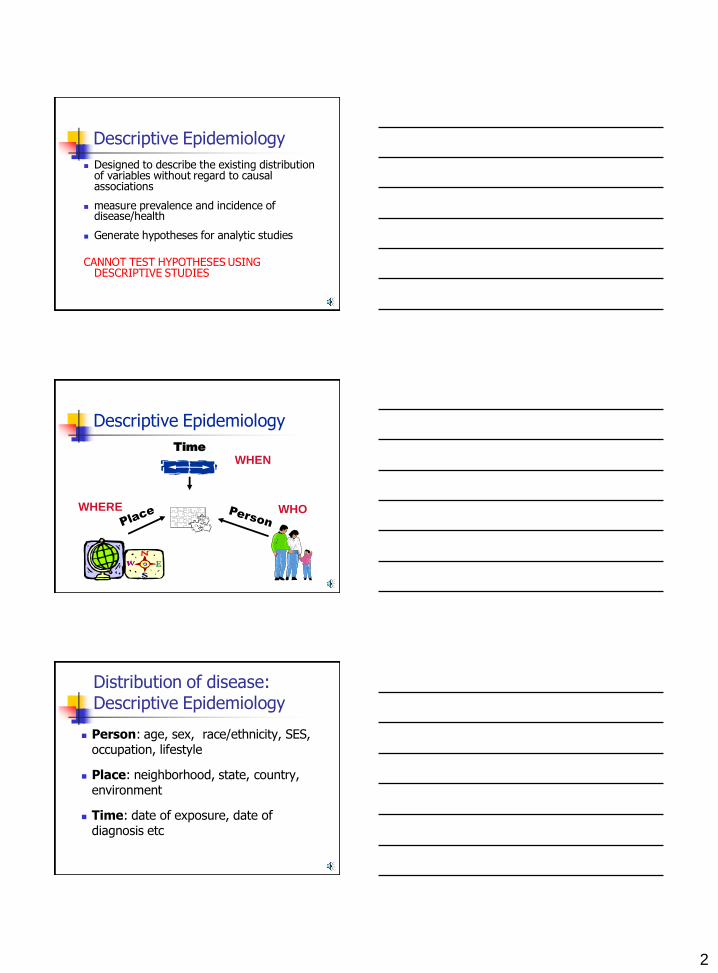
Descriptive Epidemiology
Designed to describe the existing distribution of variables without regard to causal associations
measure prevalence and incidence of disease/health
Generate hypotheses for analytic studies CANNOT TEST HYPOTHESES USING
DESCRIPTIVE STUDIES
Time
WHO WHERE
WHEN
Descriptive Epidemiology
Distribution of disease: Descriptive Epidemiology
Person: age, sex, race/ethnicity, SES, occupation, lifestyle
Place: neighborhood, state, country, environment
Time: date of exposure, date of diagnosis etc
3
Who gets disease?
Person
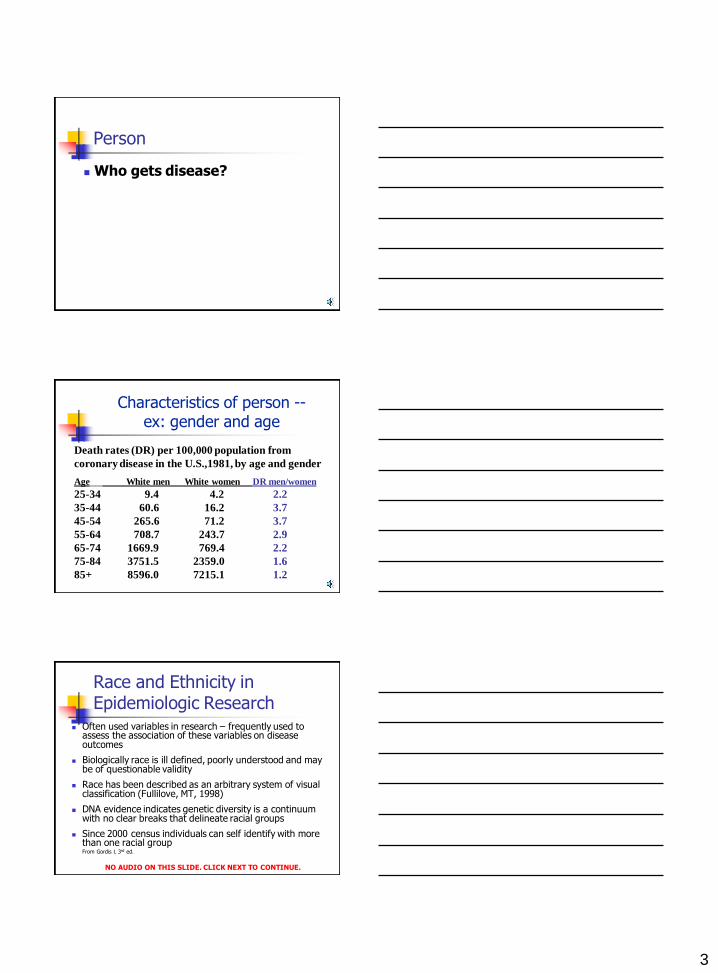
Death rates (DR) per 100,000 population from
coronary disease in the U.S.,1981, by age and gender
Age White men White women DR men/women
25-34 9.4 4.2 2.2
35-44 60.6 16.2 3.7
45-54 265.6 71.2 3.7
55-64 708.7 243.7 2.9
65-74 1669.9 769.4 2.2
75-84 3751.5 2359.0 1.6
85+ 8596.0 7215.1 1.2
Characteristics of person -- ex: gender and age
Race and Ethnicity in Epidemiologic Research
Often used variables in research – frequently used to assess the association of these variables on disease outcomes
Biologically race is ill defined, poorly understood and may be of questionable validity
Race has been described as an arbitrary system of visual classification (Fullilove, MT, 1998)
DNA evidence indicates genetic diversity is a continuum with no clear breaks that delineate racial groups
Since 2000 census individuals can self identify with more than one racial group
From Gordis L 3rd ed.
NO AUDIO ON THIS SLIDE. CLICK NEXT TO CONTINUE.
4
Race and Ethnicity in Epidemiologic Research
Alternative approach is to use ethnicity
Ethnicity is complex – may involve shared origins, culture, language
What is the relationship to disease – does it increase our understanding of disease process, risk etc?
From Gordis L 3rd ed.
Race and Ethnicity in Epidemiologic Research
Using race and/or ethnicity in our research may help us identify subgroups to which additional resources need to be directed.
Some believe this further stigmatizes certain sub-groups
If race is to be included in a study there should be a strong rationale, could other variables be better surrogates or is there a direct measure
From Gordis L 3rd ed.
Place
Is there a geographic pattern?
5
Across countries: latitude, temperature, amount of sunlight
Between cities or counties, areas: urban-rural and within a city
G.B. Japan Nigeria U.S.A.
Liver cancer LOW
Lung cancer HIGH
Stomach HIGH
Bladder LOW LOW HIGH
Colon LOW LOW HIGH
Prostate LOW LOW HIGH
Ovarian LOW LOW HIGH
Endometrial LOW LOW HIGH
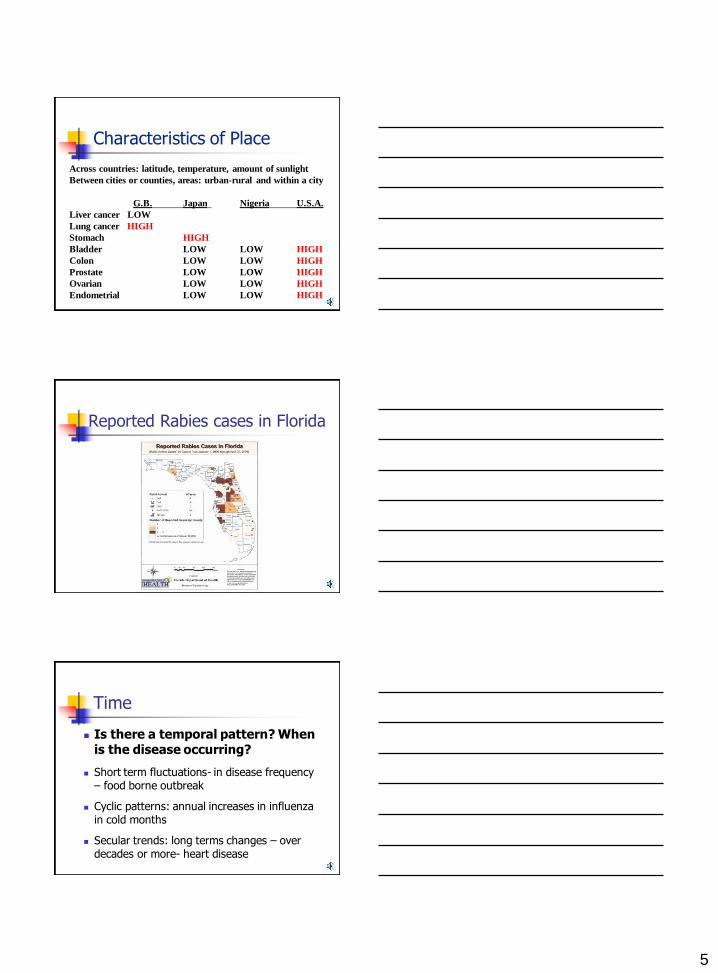
Characteristics of Place
Reported Rabies cases in Florida
Time
Is there a temporal pattern? When is the disease occurring?
Short term fluctuations- in disease frequency – food borne outbreak
Cyclic patterns: annual increases in influenza in cold months
Secular trends: long terms changes – over decades or more- heart disease
6
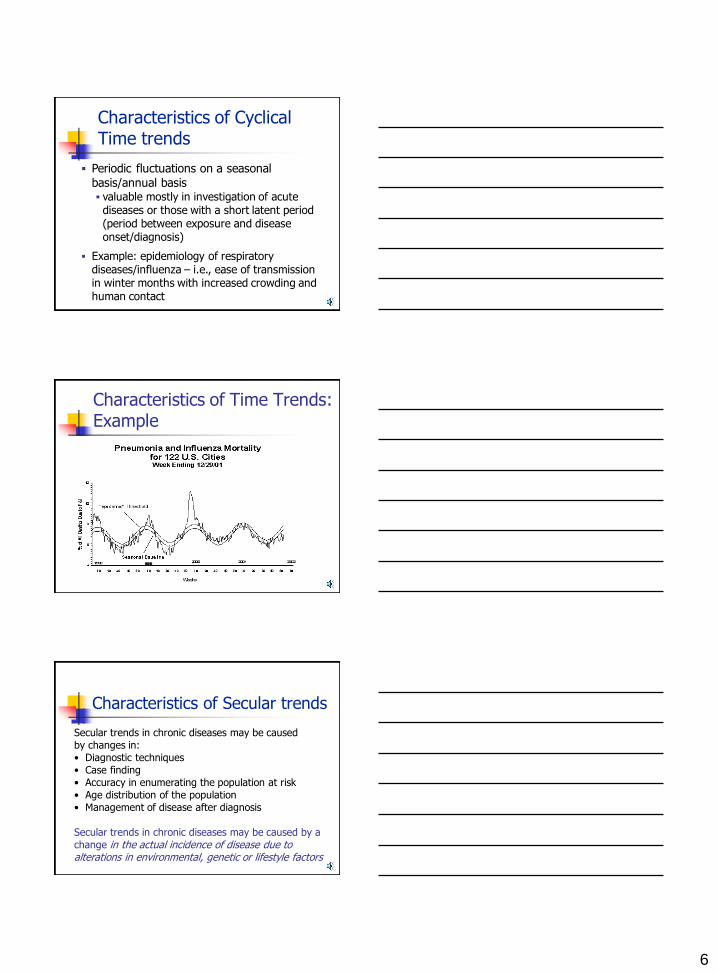
Periodic fluctuations on a seasonal
basis/annual basis valuable mostly in investigation of acute
diseases or those with a short latent period (period between exposure and disease onset/diagnosis)
Example: epidemiology of respiratory diseases/influenza – i.e., ease of transmission in winter months with increased crowding and human contact
Characteristics of Cyclical Time trends
Characteristics of Time Trends: Example
Secular trends in chronic diseases may be caused by changes in:
• Diagnostic techniques
• Case finding
• Accuracy in enumerating the population at risk
• Age distribution of the population
• Management of disease after diagnosis
Secular trends in chronic diseases may be caused by a
change in the actual incidence of disease due to alterations in environmental, genetic or lifestyle factors
Characteristics of Secular trends
7
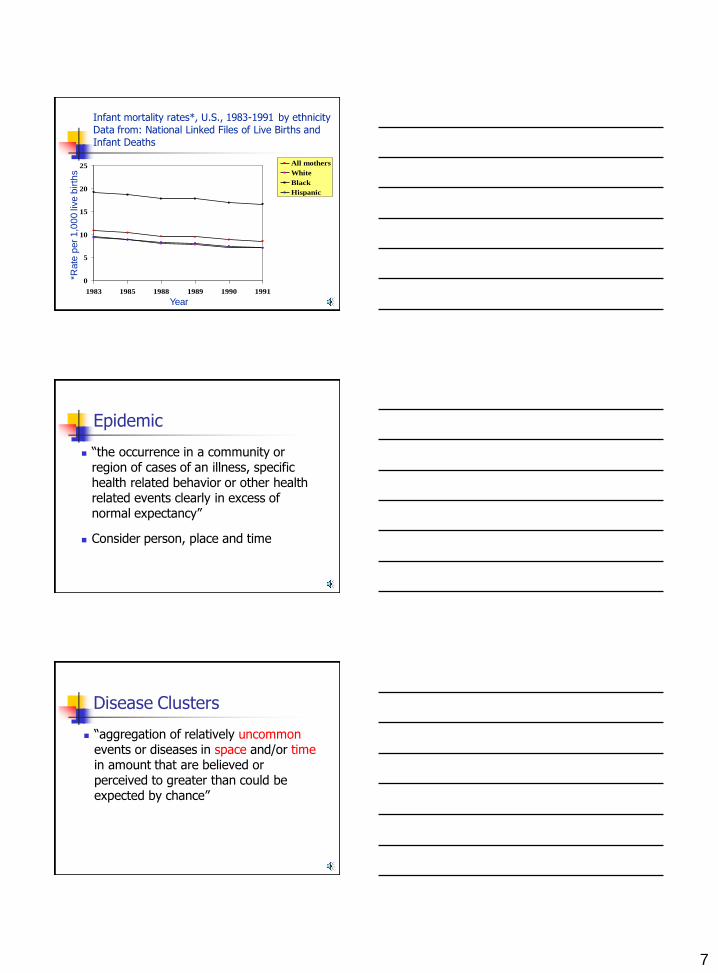
0
5
10
15
20
25
1983 1985 1988 1989 1990 1991
All mothers
White
Black
Hispanic
*Rate
per
1,0
00
live b
irth
s
Year
Infant mortality rates*, U.S., 1983-1991 by ethnicity
Data from: National Linked Files of Live Births and
Infant Deaths
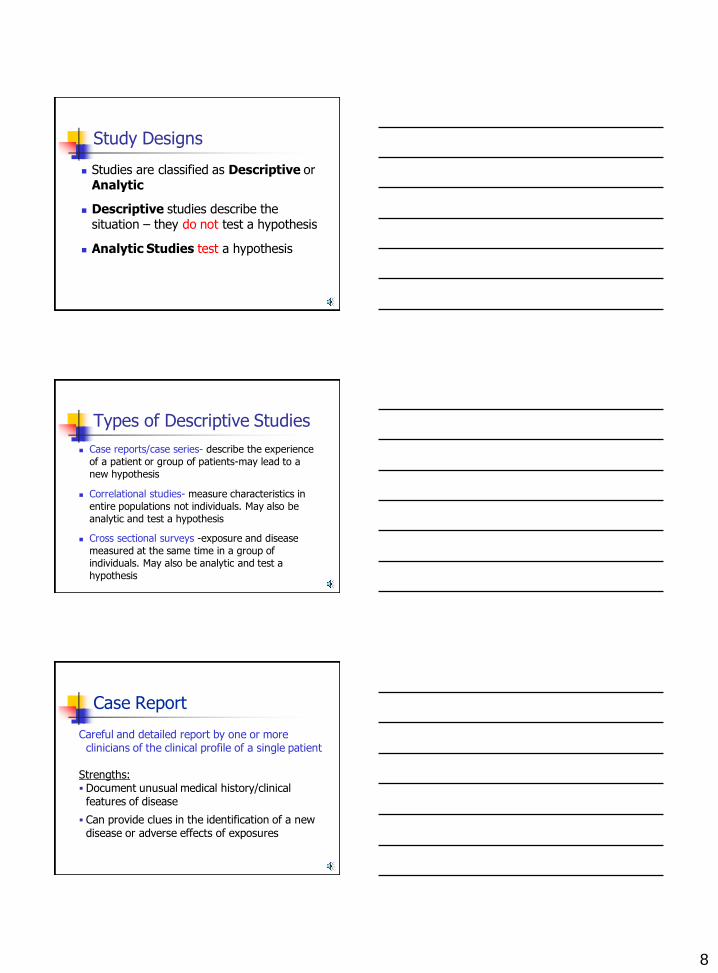
Epidemic
“the occurrence in a community or region of cases of an illness, specific health related behavior or other health related events clearly in excess of normal expectancy”
Consider person, place and time
Disease Clusters
“aggregation of relatively uncommon events or diseases in space and/or time in amount that are believed or perceived to greater than could be expected by chance”
8
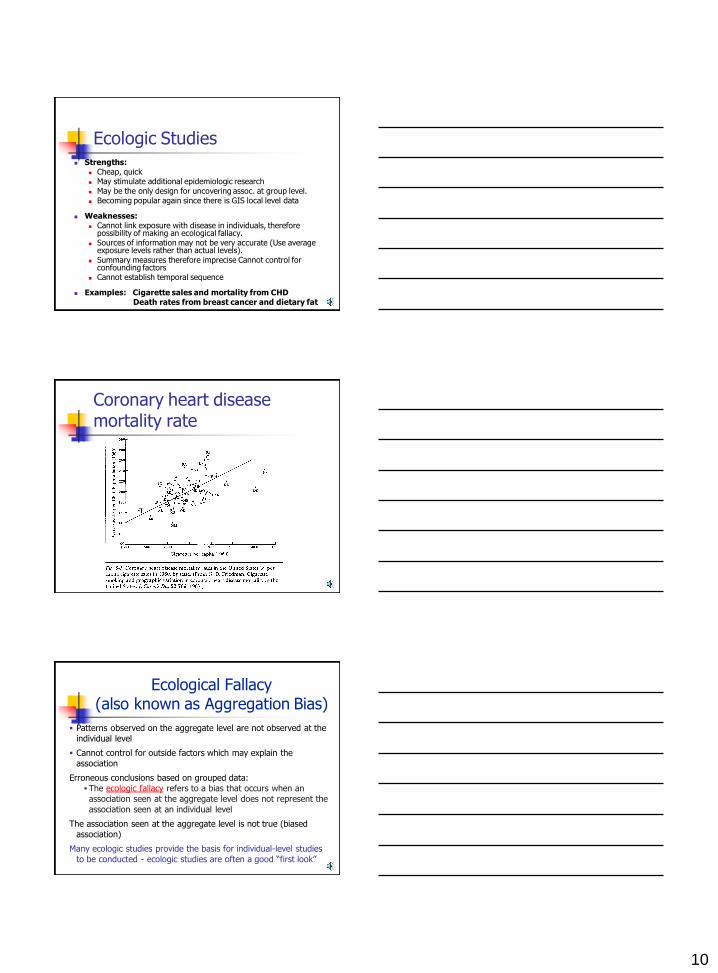
Study Designs
Studies are classified as Descriptive or Analytic
Descriptive studies describe the situation – they do not test a hypothesis
Analytic Studies test a hypothesis
Case reports/case series- describe the experience
of a patient or group of patients-may lead to a
new hypothesis
Correlational studies- measure characteristics in
entire populations not individuals. May also be
analytic and test a hypothesis
Cross sectional surveys -exposure and disease
measured at the same time in a group of
individuals. May also be analytic and test a
hypothesis
Types of Descriptive Studies
Careful and detailed report by one or more clinicians of the clinical profile of a single patient
Strengths: Document unusual medical history/clinical
features of disease
Can provide clues in the identification of a new disease or adverse effects of exposures
Case Report

9
Case Report
Limitations: There is nothing with which to compare the
data - can’t determine whether something is unusual unless you know what’s usual
Cannot be used to test for presence of a valid statistical association
Since based on 1 person, presence of characteristic (risk factor - RF) may be coincidental
Collections of individual case reports, usually within a fairly short
period of time; description of clinical/epidemiologic
characteristics of a number of patients with a given disease
Strengths:
Better because it does not rely on a single case; shows better
probability of a pattern
Can examine the dose-response (D-R) relationship by examining
the levels of exposure with the levels of disease severity
Limitations:
No comparison group so cannot test for the presence of a valid
statistical association
Case Series
Correlational/Ecologic Studies
Uses data from the entire population to compare disease frequencies between different groups during the same time period or same population at different points in time
Example: per capita consumption of meat and colon cancer rates
May be descriptive or analytic depending on whether testing a hypothesis
10
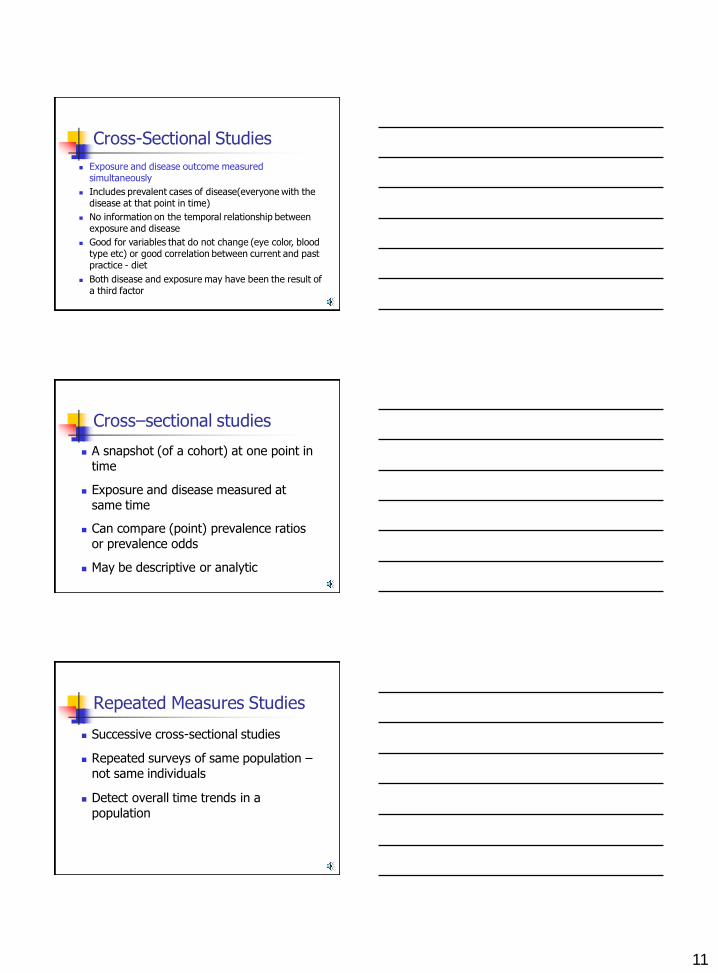
Ecologic Studies Strengths:
Cheap, quick May stimulate additional epidemiologic research May be the only design for uncovering assoc. at group level. Becoming popular again since there is GIS local level data
Weaknesses: Cannot link exposure with disease in individuals, therefore
possibility of making an ecological fallacy. Sources of information may not be very accurate (Use average
exposure levels rather than actual levels). Summary measures therefore imprecise Cannot control for
confounding factors Cannot establish temporal sequence
Examples: Cigarette sales and mortality from CHD Death rates from breast cancer and dietary fat
Coronary heart disease mortality rate
Patterns observed on the aggregate level are not observed at the
individual level
Cannot control for outside factors which may explain the
association
Erroneous conclusions based on grouped data:
The ecologic fallacy refers to a bias that occurs when an
association seen at the aggregate level does not represent the
association seen at an individual level
The association seen at the aggregate level is not true (biased
association)
Many ecologic studies provide the basis for individual-level studies
to be conducted - ecologic studies are often a good “first look”
Ecological Fallacy (also known as Aggregation Bias)
11
Exposure and disease outcome measured simultaneously
Includes prevalent cases of disease(everyone with the disease at that point in time)
No information on the temporal relationship between exposure and disease
Good for variables that do not change (eye color, blood type etc) or good correlation between current and past practice - diet
Both disease and exposure may have been the result of a third factor
Cross-Sectional Studies
Cross–sectional studies
A snapshot (of a cohort) at one point in time
Exposure and disease measured at same time
Can compare (point) prevalence ratios or prevalence odds
May be descriptive or analytic
Repeated Measures Studies
Successive cross-sectional studies
Repeated surveys of same population – not same individuals
Detect overall time trends in a population
12
Person, Place and Time
To learn more about the importance of place, please listen to the TED lecture
http://www.ted.com/talks/lang/en/bill_davenhall_your_health_depends
_on_where_you_live.html
![MALARIA [Descriptive Epidemiology of Malaria] Dr …wp.cune.org/.../11/MALARIA-descriptive-epidemiology-of-malaria.pdfMALARIA [Descriptive Epidemiology of Malaria] Dr Adeniyi Mofoluwake](https://img.pdfslide.net/doc/110x75/5ac17de07f8b9ad73f8cf6b2/malaria-descriptive-epidemiology-of-malaria-dr-wpcuneorg11malaria-descriptive-epidemiology-of-.jpg)