Embed Size (px)
Citation preview
Desert CoolAire™ Package Unit Technical Assessment – Field Performance of a Prototype Hybrid Indirect Evaporative Air-Conditioner Final Report July 2007
Prepared by: Cathy Higgins – Program Director Howard Reichmuth – Senior Engineer
Prepared for: Jeff Harris and Andy Ekman, Northwest Energy Efficiency Alliance Dave Bisbee and Jim Parks, Sacramento Municipal Utility District

This page intentionally left blank
Acknowledgements This report was prepared by New Buildings Institute (NBI) and funded by the Northwest Energy Efficiency Alliance (NEEA - Contract M-10108), and Sacramento Municipal Utility District (SMUD - Contract 4500039274) with support from the American Public Power Association Demonstration of Energy Efficient Developments (DEED) program. NBI would like to thank the many individuals whose vision and pursuit of new solutions to low-energy cooling made this research and report possible.
Research Sponsors and Project Managers
• NEEA: Jeff Harris and Andy Ekman
• SMUD: Dave Bisbee and Jim Parks
• APPA: DEED Program Manager – Michele Suddleson
Research Technical Team
• New Buildings Institute: Research Director – Cathy Higgins; Analysis Management – Howdy Reichmuth; Editing – Pat Heatherly
• Architectural Energy Corporation – Monitoring Contractor: Vern Smith, John Browne, and Rod Foth
• Western Environmental Services Corporation – Contractor Training: Jim McKillip
• Portland Energy Conservation Inc. – Monitoring Equipment Commissioning: Larry Luskay
• ADM – Monitoring Equipment Field Support: Dan Mort and Doug Thomas
Manufacturers
• Desert Aire Corporation, Milwaukee Wisconsin – CoolAire Manufacturer: Keith Coursin, Ron Pabich, and Craig Burg
• Coolerado Corporation, Boulder Colorado – Patent Holder and Original Heat Exchanger Manufacturer: Lee, Rick and Alan Gillan, and Tim Heaton
• Delphi Corporation, El Paso Texas – New Heat Exchanger Manufacturer: John Hoog and Joe Dunlop
Installation Sites
• Fred Meyer Corporation, Portland Oregon (Northwest Sites) – Installation Sites and Technical Advisor: Bil Pletz
• Los Rios Community College, Sacramento California: Mike Goodrich and Willie Williams
• SKW Architects, Sacramento California: Brian Wiese
• McKinstry Mechanical, Seattle Washington:: Greg Wineland and Nate Hafezi
Installation Contractors:
• Reitmeier Mechanical, Portland Oregon: Mike Yablonsky, Jeff Nusz, Mike Nichols, and Alex Ragusa
• YMC Inc, Boise Idaho: John Brandon and Brian Dalrymple
• Luppen and Hawley, Sacramento California: Terry O’Connor and Darryl Matsuda
• Park Mechanical, Sacramento California

This work was performed with reasonable care and in accordance with the highest professional standards. However, neither NBI nor any entity performing or funding the work pursuant to NBI’s authority make any warranty or representation, expressed or implied, with regard to this report, the merchantability or fitness for a particular purpose of the results of the work, or any analyses, or conclusions contained in this report. The results reflected in the work are generally representative of operating conditions; however, the results in any other situation may vary depending upon particular operating conditions.
Funding provided by the Northwest Energy Efficiency Alliance (NEEA) does not constitute an endorsement by NEEA of the views expressed herein.
© 2007 Northwest Energy Efficiency Alliance, Inc. All rights reserved. Northwest Energy Efficiency Alliance grants permission to reproduce this material in whole or in part only for information or education purposes.
DESERT COOLAIRE TECHNICAL ASSESSMENT
NEW BUILDINGS INSTITUTE, INC. TOC - Page i JULY 2007 FINAL REPORT
Table of Contents
EXECUTIVE SUMMARY.........................................................................................................................................1 BACKGROUND............................................................................................................................................................1 RESEARCH OBJECTIVES AND APPROACH....................................................................................................................1 LAB TESTING .............................................................................................................................................................2 FIELD TESTING...........................................................................................................................................................2 KEY FINDINGS ...........................................................................................................................................................3
Successes...............................................................................................................................................................3 Challenges ............................................................................................................................................................5 Summary ...............................................................................................................................................................5
1 INTRODUCTION ..............................................................................................................................................1 1.1 RESEARCH BACKGROUND AND SCOPE .............................................................................................................1 1.2 REPORT FORMAT..............................................................................................................................................2
2 DESIGN INTENT...............................................................................................................................................4 2.1 MARKET DRIVERS............................................................................................................................................4
2.1.1 Market Share .........................................................................................................................................4 2.1.2 Energy Performance..............................................................................................................................5 2.1.3 Indoor Air Quality .................................................................................................................................7 2.1.4 Summary ................................................................................................................................................8
2.2 EVAPORATIVE COOLING ..................................................................................................................................9 2.2.1 Core Effectiveness .................................................................................................................................9
2.3 THE HMX CORE DESIGN ...............................................................................................................................10 2.4 THE DESERT COOLAIRE SYSTEM ...................................................................................................................12
3 LAB RESULTS.................................................................................................................................................16 3.1 APPROACH .....................................................................................................................................................16 3.2 OUTCOMES.....................................................................................................................................................16
4 FIELD INSTALLATION AND SUPPORT ...................................................................................................18 4.1 SITE SELECTION .............................................................................................................................................18 4.2 INSTALLATION ISSUES....................................................................................................................................19
4.2.1 Installation Summary...........................................................................................................................21 5 MONITORING AND DATA COLLECTION...............................................................................................23
5.1 DATA COLLECTION AND PROCESSING............................................................................................................26 5.2 MONITORING ISSUES AND CORRECTIONS .......................................................................................................29
6 ANALYSIS APPROACH ................................................................................................................................30 6.1 HOURLY AGGREGATION BY MODE ................................................................................................................30
6.1.1 Two-Week Analytical Data Blocks ......................................................................................................31 6.1.2 The Hourly Data Aggregation Interval ...............................................................................................32
6.2 ESTIMATES OF AIRFLOW BY MODE .................................................................................................................32 6.3 ELECTRICAL ENERGY USE MEASUREMENTS BY MODE ..................................................................................34 6.4 RECONSTRUCTION OF ENERGY USE DATA AND DATA BLOCKS OF RECORD...................................................35
6.4.1 Final Assembly into Seasonal or Annual Data Summary....................................................................35 7 FIELD PERFORMANCE FINDINGS ...........................................................................................................37
7.1 HMX CORE AND SYSTEM PERFORMANCE......................................................................................................37 7.1.1 HMX Core Contribution ......................................................................................................................37 7.1.2 Efficiency Performance .......................................................................................................................39

DESERT COOLAIRE TECHNICAL ASSESSMENT
NEW BUILDINGS INSTITUTE, INC. TOC - Page ii JULY 2007 FINAL REPORT
7.2 COMPRESSOR PERFORMANCE.........................................................................................................................43 7.3 FAN ENERGY PERFORMANCE .........................................................................................................................44 7.4 WATER...........................................................................................................................................................47
7.4.1 Water Use ............................................................................................................................................47 7.4.2 Water Bypass .......................................................................................................................................50 7.4.3 Biological growth ................................................................................................................................51 7.4.4 Scaling .................................................................................................................................................52
8 PERFORMANCE COMPARISON ................................................................................................................53 8.1 HIGH COOLING CASE .....................................................................................................................................54
8.1.1 Energy Comparison.............................................................................................................................55 8.1.2 Demand Comparison...........................................................................................................................56 8.1.3 Hourly EER Perspective ......................................................................................................................57
8.2 MEDIUM COOLING CASE................................................................................................................................59 8.2.1 Energy Comparison.............................................................................................................................59 8.2.2 Demand Comparison...........................................................................................................................60 8.2.3 Hourly EER Perspective ......................................................................................................................62
8.3 PERFORMANCE SUMMARY .............................................................................................................................63 9 NEXT GENERATION DESIGN.....................................................................................................................65
9.1 MARKET FACTORS .........................................................................................................................................65 9.2 DESIGN CONSIDERATIONS..............................................................................................................................66
9.2.1 The Need for the DX ............................................................................................................................66 9.3 DESIGN CHANGES ..........................................................................................................................................70 9.4 CONCLUSIONS ................................................................................................................................................71
Table of Figures Figure 0-1 CoolAire Monitored Data from Sacramento at 100°+F .............................................................. 4 Figure 2-1 Floorspace Distribution of HVAC Systems in Commercial Buildings....................................... 5 Figure 2-2 Distribution of Package DX System Size by Number of Systems............................................. 5 Figure 2-3 Frequency of Problems in New Small Commercial Package HVAC Systems ........................... 6 Figure 2-4 Impact of Outdoor Temperature on Energy Efficiency Rating (EER) for Small Package HVAC Systems ......................................................................................................................................................... 7 Figure 2-5 Impact of Outdoor Temperature on Cooling Capacity for Small Package HVAC Systems ....... 7 Figure 2-6 Diagram of the Prototype Desert CoolAire Indirect Evaporative Hybrid Unit......................... 13 Figure 2-7 Diagram of Un-Occuped Mode of the Prototype Desert CoolAire........................................... 14 Figure 2-8 Diagram of First Stage Cooling (Economizer Mode) of the Prototype Desert CoolAire ......... 14 Figure 2-9 Diagram of Second Stage Cooling (Evap. only) of the Prototype Desert CoolAire ................. 15 Figure 2-10 Diagram of Third Stage Cooling (Evap. & Dx) of the Prototype Desert CoolAire ................ 15 Figure 5-1 Schematic Cross-section of CoolAire Package Unit with Approximate Sensor Locations ...... 25 Figure 5-2 Data Acquisition and Communications Gateway Box.............................................................. 26 Figure 5-3 Screen Shot of MicroDataNet Interface during Lab Testing..................................................... 27 Figure 5-4 Mode Summary by Day with Daily Average Outdoor Temperature ....................................... 28
DESERT COOLAIRE TECHNICAL ASSESSMENT
NEW BUILDINGS INSTITUTE, INC. TOC - Page iii JULY 2007 FINAL REPORT
Figure 6-1 Evaporator Coil Flow vs. Pressure........................................................................................... 33 Figure 6-2 All Cases of Pressure Drop ...................................................................................................... 33 Figure 6-3 Long Duration Cases of Pressure Drop.................................................................................... 34 Figure 6-4 Typical Evaporation Mode Power............................................................................................. 35 Figure 7-1 Typical Air Temperatures for the HMX core in the Evaporative Cooler – Boise Idaho Site ... 38 Figure 7-2 Performance of CoolAire in Sacramento at 100°F.................................................................... 39 Figure 7-3 Hourly Energy Performance – Prototype at High Cooling ....................................................... 40 Figure 7-4 Hourly Energy Performance – Prototype at Medium Cooling.................................................. 40 Figure 7-5 Hourly Demand Performance – Prototype at High and Medium Cooling ................................ 41 Figure 7-6 Hourly EER Comparisons – High Cooling Case ...................................................................... 42 Figure 7-7 Hourly EER Comparisons – Medium Cooling Case................................................................. 43 Figure 7-8 EER Function at Two Different Fan Powers............................................................................. 44 Figure 7-9 Fan Power vs. Air flow ............................................................................................................. 45 Figure 7-10 EER vs. Airflow ...................................................................................................................... 45 Figure 7-11 Evaporative Core Efficiency at Two Control Pressures.......................................................... 46 Figure 7-12 Water flow vs. Room Temperature in late August 2006......................................................... 48 Figure 7-13 Observed Water Flow vs. Limit .............................................................................................. 49 Figure 8-1 Energy Comparison with SEER 10 – High Cooling Case ........................................................ 55 Figure 8-2 Energy Comparison with SEER 13 – High Cooling Case ........................................................ 55 Figure 8-3 Demand Comparison with SEER 10 - High Cooling Case ....................................................... 56 Figure 8-4 Demand Comparison with SEER 13 - High Cooling Case ....................................................... 57 Figure 8-5 Hourly EER Comparison – High Cooling Case........................................................................ 58 Figure 8-6 Energy Comparison with SEER 10 - Medium Cooling Case ................................................... 59 Figure 8-7 Energy Comparison with SEER 13 - Medium Cooling Case ................................................... 60 Figure 8-8 Demand Comparisons with SEER 10 – Medium Cooling Case ............................................... 61 Figure 8-9 Demand Comparisons with SEER 13 – Medium Cooling ........................................................ 61 Figure 8-10 Hourly EER Comparison - Medium Cooling Case ................................................................. 62 Figure 9-1 Evaporative Cooler Operating Points........................................................................................ 66 Figure 9-2 Core Inlet and Outlet Temps at Max. Summer Conditions for Sacramento.............................. 68 Figure 9-3 Core Inlet and Outlet Temps at Max. Summer Conditions for California Deserts and Phoenix.................................................................................................................................................................... 69

DESERT COOLAIRE TECHNICAL ASSESSMENT
NEW BUILDINGS INSTITUTE, INC. TOC - Page iv JULY 2007 FINAL REPORT
Table of Tables Table 0-1 High Cooling Comparison of CoolAire and Reference Systems ................................................ 4 Table 2-1 Standard Desert CoolAire Prototype Specifications................................................................... 12 Table 4-1 Summary of Desert CoolAire Installations................................................................................. 19 Table 5-1 Desert CoolAire Point List ......................................................................................................... 24 Table 6-1 Operating Modes ....................................................................................................................... 30 Table 6-2 Conditional Variables ................................................................................................................ 31 Table 7-1 Sampling of Water Use Rates, average gallons/day ................................................................... 50 Table 7-2 Installation Site Water Quality ................................................................................................... 52 Table 8-1 Assumed SEER 10 Performance Factors – 5 Ton Unit Capacity............................................... 53 Table 8-2 Assumed SEER 13 Performance Factors – 5 Ton Unit Capacity............................................... 54 Table 8-3 Energy Reduction of CoolAire to Reference Systems – High Cooling Case............................. 56 Table 8-4 Demand Reduction of CoolAire to Reference Systems – High Cooling Case ........................... 57 Table 8-5 EER Comparisons of CoolAire and Reference Systems – High Cooling Case.......................... 59 Table 8-6 Energy Reduction of CoolAire to Reference Systems – Medium Cooling Case ....................... 60 Table 8-7 Demand Reduction of CoolAire to Reference Systems – Medium Cooling Case ..................... 62 Table 8-8 EER Comparison of CoolAire and Reference Systems – Medium Cooling Case...................... 62 Table 8-9 Desert CoolAire Performance Comparisons............................................................................... 64
DESERT COOLAIRE TECHNICAL ASSESSMENT
NEW BUILDINGS INSTITUTE, INC. ES - Page 1 JULY 2007FINAL REPORT
Executive Summary
In 2005, the Northwest Energy Efficiency Alliance (NEEA), recognizing the need for new approaches to reducing commercial cooling energy use, funded a performance investigation of a prototype package air-conditioning system in the Northwest. The research was later extended to the California market through participation of the Sacramento Municipal Utility District (SMUD) with support from the American Public Power Association Demonstration of Energy-Efficient Developments (DEED) Program.
The field research shows a highly promising new hybrid air-conditioner that demonstrated 50 percent demand savings and increased capacity during times of summer peak, provided pre-compressor cooling at temperatures that allow for aggressive compressor lock-out schemes, and delivered 100 percent outside air throughout the cooling season with no energy penalty.
The modeled performance of a next generation unit redesigned based on research findings had an average daily Energy Efficiency Ratio (EER) of 19 and a peak EER of 25 – significantly beyond anything available on the market today.
This combination of significant demand savings, energy control potential and indoor air quality benefits are compelling factors for the continued investigation of this equipment’s performance and market potential. This project has been extended to continue field monitoring and analysis in the summer of 2007 with a supplementary report due at the end of 2007.
Background Package rooftop units are the dominant commercial cooling equipment - cooling 47 percent of commercial floorspace. Package units of 10 tons or less capacity represent 90 percent of the units sold, with the 5 ton unit as the most popular. Yet, research on new package units (4 years old or less) showed that in-field energy performance was well below the efficiency specifications1. In addition, standard package units experience reductions in efficiency and capacity during hot outdoor conditions coincidental with times of strain on the electric supply.
Based on growing market interest in improved energy efficiency and indoor air quality, Desert Aire Corporation designed the Desert CoolAireTM air-conditioner in 2005. The Desert CoolAire combines a new indirect evaporative heat exchanger (HMX core), the Delphi HMX2, with compressor-based cooling and gas heating to create a 5-ton capacity hybrid package unit. Twelve prototype units were manufactured; each with eight indirect evaporative cores, a 4-ton digitally controlled scroll compressor (DX), 100,000 British Thermal Units (btu) gas heat, variable speed fan, enhanced controls, and sensors for lab and field research testing.
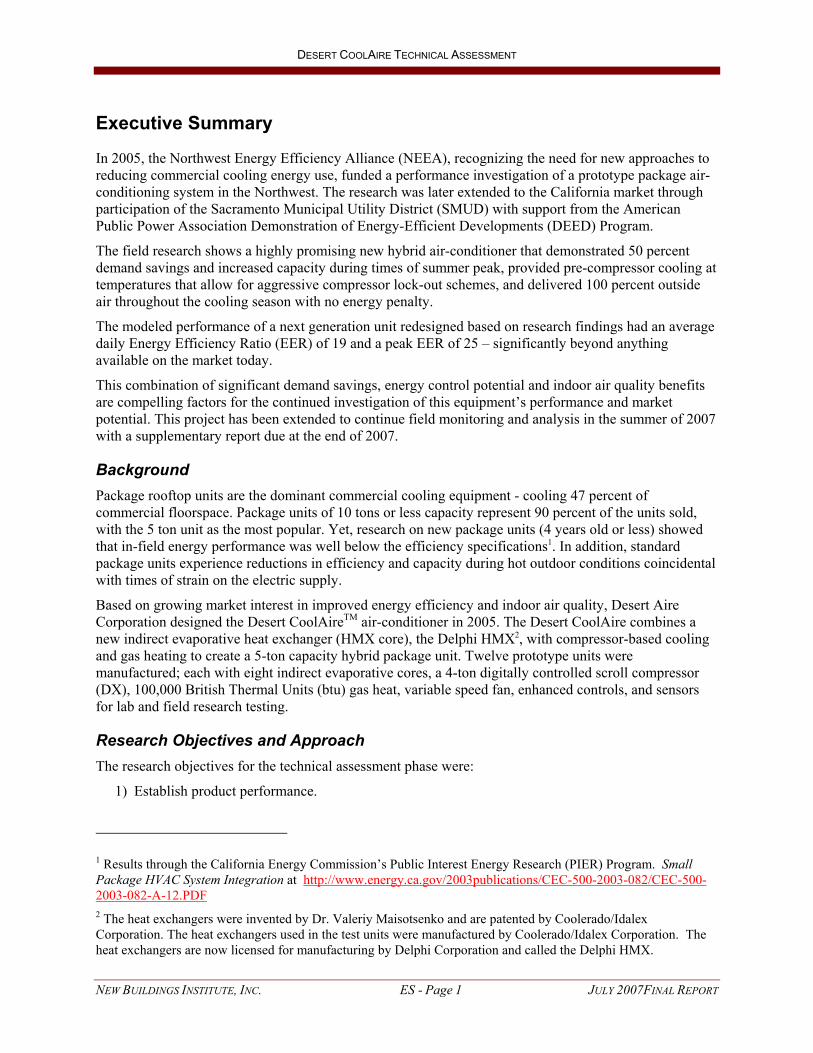
Research Objectives and Approach The research objectives for the technical assessment phase were:
1) Establish product performance.
1 Results through the California Energy Commission’s Public Interest Energy Research (PIER) Program. Small Package HVAC System Integration at http://www.energy.ca.gov/2003publications/CEC-500-2003-082/CEC-500-2003-082-A-12.PDF 2 The heat exchangers were invented by Dr. Valeriy Maisotsenko and are patented by Coolerado/Idalex Corporation. The heat exchangers used in the test units were manufactured by Coolerado/Idalex Corporation. The heat exchangers are now licensed for manufacturing by Delphi Corporation and called the Delphi HMX.

DESERT COOLAIRE TECHNICAL ASSESSMENT
NEW BUILDINGS INSTITUTE, INC. ES - Page 2 JULY 2007FINAL REPORT
2) Understand product design and installation requirements.
3) Refine product design to increase performance and address cost, design and installation issues.
The efficiency target for the prototype unit was 50 percent energy savings over the federal standard at the time of SEER 9.7 for equipment of 5 tons or less capacity. Establishing production and installation costs was not part of the technical assessment research phase. The approach for completing the research included lab testing, installation and monitoring of units in distinct climates, analysis of data and establishment of findings to support next-phase decisions.
A preliminary unit received Electrical Testing Laboratories (ETL) approval and was lab-tested during summer 2005 and spring 2006. Eight field units were tested through the cooling season of 2006 with a geographic diversity intended to represent the western U.S. climate. Five were tested in hot climates (Sacramento, California, and Boise, Idaho) and three were tested in mild climates which only occasionally get hot (Portland, Oregon, and Vancouver and Seattle, Washington).
This report reflects the aggregated results for the Northwest and Sacramento sites during 2006. At the time of this report, field investigation has been extended into the summer of 2007 with additional findings expected in November 2007.
Lab Testing Lab tests were conducted to evaluate air flow performance as well as cooling effectiveness and output in varying temperature and humidity conditions of both the indirect evaporative module and the CoolAire prototype package unit. Test conditions included a range of 11 ambient temperature and moisture levels to investigate performance relative to leaving air temperature set points of 55°F and 65°F.
The evaporative cooling effectiveness of the HMX core was better than 78 percent and as high as 98 percent, with an average of 82 percent for the lab conditions tested. The cooling output of the HMX core alone was as high as 66,434 Btu/hour (5.5 tons) with an EER as high as 33 for the moment of most extreme outside air condition tested (101°F and 32 percent relative humidity) and the unit’s total cooling capacity at the same conditions was 92,519 Btu/hour (7.7 tons) with an EER of 13.
Field Testing Each of the eight field tested units was monitored to collect 25 performance measures every minute with real-time data available on a project website and performance models developed for all operating modes.
As a means of comparing the operation of the CoolAire prototype unit (prototype) to a conventional DX unit hypothetical SEER 10 and SEER 13 DX units3 (reference units) were simulated to meet the exact same cooling loads as delivered by the tested prototype unit. The reference units were simulated based on their efficiency specifications which are typically greater then their actual field performance as cited earlier, but without economizer cooling4. The prototype results are actual measured field performance. In addition, a next generation CoolAire (Gen2) unit was modeled based on redesign as suggested from the research findings. Based on these parameters the comparison of field operation of the CoolAire prototype
3 The SEER 10 unit was used as proxy for the current federal standard (SEER 9.7) for 3-phase < 60,000 Btu unitary equipment and the baseline used to target 50-percent energy savings. The SEER 13 unit represents the current minimum standard adopted by ASHRAE, the Consortium for Energy Efficiency and by some states. The date for federal adoption of the SEER 13 standard is currently dependant on factors at DOE and the legislature but will be in early 2008 or by 2010 at the latest. 4 Economizers fail to operate as designed in 90 percent of field checked units (source: merged analysis studies from PIER, RLW Analytics, NBI and others presented at the California Public Utilities Commission hearing on Big Bold Strategies for HVAC savings June 2007 by Abram Conant of Proctor Engineering)
DESERT COOLAIRE TECHNICAL ASSESSMENT
NEW BUILDINGS INSTITUTE, INC. ES - Page 3 JULY 2007FINAL REPORT
and the simulated performance of conventional DX systems are believed to be conservative estimates of true side-by-side energy use.
Key Findings Key findings of the research are organized by “Successes” and “Challenges” for the equipment.
Successes
• Integration of the components into a hybrid package system proved successful and was able to fully meet cooling and heating commercial space conditioning needs.
• The prototype consistently demonstrated strong demand savings of 2-3 kW over reference systems (33 to 49 percent) with greatest demand savings aligned with periods of utility coincident summer peak (hot outdoor temperatures).
• The peak performance of the evaporative section was measured at 25 EER with the whole system performance prototype (evaporative and DX) measured at 15 EER at 103°F.
• Simulation runs for a next generation unit under the same load showed a peak EER of 25 at 103°F.
• At the time of this report the units had been operating under cooling conditions for about nine months. No scaling of the HMX core media (coated cellulose paper) was observed.
• Average daily energy savings of the prototype were significant, 23 percent compared to a conventional SEER 10 unit, but fell short of the targeted goal of 50 percent largely due to the poor performance of the compressor and fan.
• The prototype had a measured daily average EER of 12.3 including non-cooling and recirculation modes. The modeled performance of the reference units had a daily average EER of 9.6 for the SEER 10 unit and 11.6 EER for the SEER 13 unit.
• The HMX cores consistently delivered 65-72°F air temperature and 100 percent outdoor air with little or no increase in absolute humidity regardless of the inlet (outdoor) temperature to the core.
Figure 0-1 shows monitored data at a California site on a day that exceeded 100°F. The HMX core is cooling the outdoor (inlet) air by 32°F leaving a much smaller load for the compressor to carry.

DESERT COOLAIRE TECHNICAL ASSESSMENT
NEW BUILDINGS INSTITUTE, INC. ES - Page 4 JULY 2007FINAL REPORT
Sacramento
32° F cooling from the HMX core!
Sacramento
32° F cooling from the HMX core!
The Dx provides 17° F cooling for supply air at 50°F. The Dx role would be very small (5-10°F) at more typical supply air points of 55-60 °F.
Figure 0-1 CoolAire Monitored Data from Sacramento at 100°+F
• Space cooling could be supplied without compressor assistance during moderate cooling seasons (e.g. Northwest climates) or in applications conducive to supply air temperatures in the mid-to-high 60’s.
• Given the performance of the evaporative section, it appears that the compressor could be aggressively controlled, or locked-out, as a demand strategy while continuing to deliver 65°F to the space.
• The 5-ton capacity prototype provided up to 6 tons of cooling (a 20% increase in capacity) during periods of hot outdoor temperatures whereas traditional package unit capacity decreases during hot outdoor periods.
• The research identified changes capable of making the system perform at the 50 percent energy savings target or better.
Table 0-1 shows the daily average EER for a high temperature event comparison of the measured as-operated performance of the CoolAire prototype and the simulated (modeled) performances of the next generation system (Gen2) and standard reference units.
Table 0-1 High Cooling Comparison of CoolAire and Reference Systems
System Avg. Daily EER Tmax Hour EER
SEER 10 (modeled) 9.6 8.5
SEER 13 (modeled) 11.6 10
Prototype (as operated) 12.3 15
Gen2 (modeled) 19 25
EER Comparison of CoolAire and Reference Systems
Ref
eren
ceC
ool A
ire
High Cooling Case (Tmax 103F)

DESERT COOLAIRE TECHNICAL ASSESSMENT
NEW BUILDINGS INSTITUTE, INC. ES - Page 5 JULY 2007FINAL REPORT
Challenges
• The following limitations resulted in an unreasonably low compressor cooling EER (not including fan energy) of 6-8 EER for the prototype significantly affecting overall system energy efficiency.
o The variable-speed scroll compressor is widely misunderstood. The output can be precisely reduced from full output, but the input electric energy is not proportionally reduced. At less than full output, demand is reduced, but so is compressor energy efficiency.
o Testing revealed that the compressor was inefficiently controlled (routinely invoked as second-stage cooling and then limited in output by cycling on/off) and oversized.
o The prototype 4-ton compressor was oversized for the role of supplemental cooling to the HMX cores. Findings were that very little cooling was actually needed from the compressor - only about 10°F after the core - equivalent to approximately 1 to 1.5 tons of cooling.
• The prototype used a single plug fan to accomplish both supply air delivery to the space as well as pushing evaporative working air through the HMX core. This design required significant fan power during all modes and was a major issue affecting the energy efficiency of the prototype units.
• Core reliability for water bypass and bio-growth mitigation was not proven. Changes to the cores have been made for summer 2007 testing.
• Although water use during peak cooling periods was reasonable, the prototype used excessive amounts of water during moderate cooling periods. A new water control board has been developed and will be tested in summer 2007.
• The cost of the unit itself, although pricing estimates were not done for this project, is likely greater by 2+ times that of a comparably sized standard rooftop unit due to the integration of multiple technologies and more refined controls.
• The prototype unit is considerably larger, heavier and more sophisticated than conventional package units. This presents some installation issues, as well as unique maintenance requirements that remain for the product to become more applicable to wide market adoption, particularly as a replacement system.
Summary Although the original prototype revealed several challenges, the substantial peak demand savings, ability to control for DX lock-out, the market attraction of 100 percent outside air and promising outlook for Gen2 were found to be sufficiently compelling by the sponsors to warrant ongoing investigation of the Desert CoolAire.
The revised core, water control box and control changes are being tested in the summer of 2007. A next generation unit incorporating the final set of redesign options will then need field research testing in summer 2008 with product availability targeted for 2009. SMUD has already expressed interest in sponsoring deployment and testing of the Gen2 systems.
At the time of this report publication new chemically treated cores have been installed in the current prototype units and July 2007 field inspections found them completely clear of biological growth. Based on this encouraging result and ongoing monitoring the work on the Gen2 design will continue as described in the full report.
DESERT COOLAIRE TECHNICAL ASSESSMENT
NEW BUILDINGS INSTITUTE, INC. Page 1 JULY 2007 FINAL REPORT
1 Introduction
Low-energy cooling solutions are critical to achieving long-term energy and demand savings in the commercial building sector. The Northwest Energy Efficiency Alliance (NEEA) recognized the need for new products and approaches to reduce cooling energy use and funded the investigation into a prototype air-conditioning system. The research was later extended to the California market through the participation of the Sacramento Municipal Utility District (SMUD). This report presents the results of the Desert CoolAire™ Package Unit Technical Assessment.
1.1 Research Background and Scope Desert Aire (Milwaukee, Wisconsin) is a major manufacturer of dehumidification equipment and indoor air quality products for 100 percent outside air up to 100 tons. Many of their products combine refrigerant-based cooling technology with another technology such as DX cooling to achieve dehumidification or air treatment at a lower energy cost. In 2004, Desert Aire, hearing customer interest in an air-conditioner (AC) unit with increased outside air to improve indoor air quality and greater energy efficiency, proposed to develop a new prototype hybrid air-conditioner.
The Desert CoolAire unit is a heating, air-conditioning and ventilation (HVAC) package rooftop unit (RTU) targeted to achieve greater energy efficiency and improved indoor air quality by combining a promising new indirect evaporative heat exchanger core (HMX core) with traditional direct-expansion (DX) refrigeration cooling . The CoolAire package unit is the first product that combines these two cooling systems into a hybrid RTU to meet the full cooling needs of commercial space.
The CoolAire unit is based on one of the most promising variations of indirect evaporative cooling. It is referred to as the Maisotsenko cycle and explained in Section 2. This approach attracted the attention of the sponsors of this project because initial tests at National Renewable Energy Laboratory (NREL) showed that the thermal performance for this approach could exceed the high performance limit commonly accepted for an indirect evaporative cooler5. In fact, this test caused researchers at NREL to reformulate their understanding of the upper limits for indirect evaporative cooling performance in general.
Research project work began in March 2005 with the selection of New Buildings Institute as Project Coordinator of the Technical Assessment. The project team is comprised of: Architectural Energy Corporation, monitoring contractor; Portland Energy Conservation, Inc., field monitoring commissioning agent; Wescor Inc., contractor trainer; and Desert Aire, engineering and product development.
The project’s market transformation approach is based on bringing any resulting product to market, including pre-commercial product technical testing and optimization, market testing, and final product design and production. This Technical Assessment phase deals only with these initial steps of product development, with further work needed for next-phase product refinement and marketing.
The technical assessment work had three primary goals:
• Establish product performance. This goal involved measuring equipment performance under actual conditions, as well as laboratory-controlled tests to validate a model of performance that would be trusted by the design and decision-making communities plus the utility regulatory community for justifying product incentives.
5 NREL laboratory studies for Idalex Corporation in February 2003 and July 2004 on the Coolerado Core. Available from Idalex Corporation at http://www.coolerado.com/NewsAndNotable/NRELquote.htm

DESERT COOLAIRE TECHNICAL ASSESSMENT
NEW BUILDINGS INSTITUTE, INC. Page 2 JULY 2007 FINAL REPORT
• Understand product design and installation requirements. By installing a small number of units in real buildings, we can better understand issues around designing, installing, commissioning and operating these units.
• Refine product design to increase performance and cost ratio and address design and installation issues. Use the information gained from analyzing product performance and design and installation requirements to refine the CoolAire package unit for second-generation product development that can be tested more broadly to gauge market interest.
The project strategy was to:
• Conduct a laboratory test to determine performance under standard conditions and to determine if and how the system will fail if subjected to freezing conditions.
• Install and monitor units in distinct geographic areas.
• Gather and analyze performance data to determine how the units operated, what might have gone wrong, and how much electrical energy is consumed to provide cooling.
• Provide information to the manufacturer to improve the units.
• Establish findings to support next phase decisions regarding additional research.
Twelve prototype units were completed and instrumented in spring 2005. The preliminary unit received Electrical Testing Laboratories (ETL) approval for electrical safety and was lab-tested for thermal performance during the summer and fall of 2005. Three units were installed in the Portland and Boise areas in late 2005, with two additional units installed in 2006 in the Seattle and Boise areas. These systems were extensively monitored through the fall of 2006 with real-time data available on a project website.
In early 2006, SMUD expanded the field assessment to their area and supported the installation and testing of three units. Two units were installed in Sacramento in summer and one in fall of 2006. This combined West Coast technical testing effort provides increased climate and market data for the research.
This report address background and field results for 2006 but ongoing monitoring and assessment is continuing through 2007.
1.2 Report Format This report addresses the full scope of the first phase of project research and combines the results of the Northwest and Sacramento units’ performance during the summer of 2006. This report covers the research and analysis results in the following sections:
Section 2 Design Intent—The market basis for product development, evaporative cooling approaches, the Maisotsenko Cycle (M-Cycle) cooling design, and the CoolAire prototype design specifications.
Section 3 Lab Results—Summary of the lab test results.
Section 4 Field Installation and Support—Results of work “up on the roof” including site acquisition, installation, and maintenance.
Section 5 Monitoring and Data Collection—The method and process for collecting and monitoring the large amounts of field data.
Section 6 Analysis Approach—What data were available and the analysis methods used to determine the findings in this report.

DESERT COOLAIRE TECHNICAL ASSESSMENT
NEW BUILDINGS INSTITUTE, INC. Page 3 JULY 2007 FINAL REPORT
Section 7 Field Performance Findings—Findings on operating modes and performance results in the four key topics: the system, the fan, the compressor, and water.
Section 8 Performance Comparison—Specifics on what the equipment did in terms of energy use and efficiency compared to reference standard equipment and what it could potentially do based on the research observations and analysis.
Section 9 Next Generation Design—Design and operations improvements under consideration for optimal performance and market acceptance.
Section 10 Appendices

DESERT COOLAIRE TECHNICAL ASSESSMENT
NEW BUILDINGS INSTITUTE, INC. Page 4 JULY 2007 FINAL REPORT
2 Design Intent
The ultimate goal for the CoolAire package unit is to provide all heating, cooling and ventilation in a single modular unit at the highest efficiency possible. This section discusses the market drivers for the CoolAire, evaporative principles, HMX core and CoolAire system design and specifications.
2.1 Market Drivers One underlying rationale for development of this product is based on the premise that an indirect evaporative cooler included in a package rooftop unit could potentially apply to a large portion of the Western commercial cooling market. A second primary driver was the ability to greatly exceed the field performance of standard RTUs particularly during hot conditions when utility systems are stressed. These drivers are discussed below.
2.1.1 Market Share Package units6 have so many advantages in cost and maintainability that the concept has dominated the industry for the last 30 years. Package rooftop units now are the most widely used means of commercial heating and cooling. Single-package DX cooling systems account for over 47 percent of commercial space conditioning (Figure 2-1). The most popular package DX system size is five tons, as shown in Figure 2-2. Units between one and 10 tons represent close to 90 percent of the total unit sales in new buildings in California, which is roughly equivalent to national sales distribution. In units currently on the market, heating is usually done by gas and cooling by a refrigerant-based AC unit for commercial spaces.
The commercial (particularly small commercial) market penetration of evaporative coolers for air conditioning has remained low – less than 5% in total commercial floorspace and for package units almost non-existent (Figure 2-1). This is because the successful applications of commercial evaporative cooling have been in large and relatively complex systems that represent only a small portion of the commercial cooling market. A motivation for using this particular indirect evaporative technology is that its operation is quite simple and thus it can potentially apply to smaller commercial rooftop units, 10 tons or less, that is the largest portion of the commercial cooling market.
6 Package units are also referred to as modular, or as unitary systems within the American Refrigeration Institute and HVAC industry. Modular and/or unitary denotes that all the components are contained in a single physical structure or package.

DESERT COOLAIRE TECHNICAL ASSESSMENT
NEW BUILDINGS INSTITUTE, INC. Page 5 JULY 2007 FINAL REPORT
Cooling System Type Distribution by Commercial Floorspace
No Cooling, 19.1%
Single Pkg DX AC, 43.9%
Single Pkg DX Heat Pump, 3.5%
Built-up System, 17.4%
Evaporative System, 5.1%
Water Loop Heat Pump, 2.9%
Split DX AC, 5.9% Other, 0.3%Split DX Heat Pump, 0.9%
Figure 2-1 Floorspace Distribution of HVAC Systems in Commercial Buildings
Figure 2-2 Distribution of Package DX System Size by Number of Systems
2.1.2 Energy Performance The amount of power package RTU units use depends principally on the outside temperatures. In practice, they collectively account for approximately 40 percent of the peak day summer load. More efficient cooling in this market can reasonably be a large offset to peak load.
Small rooftop units are the workhorses of the commercial building industry, yet many systems fail to reach their full potential due to problems with design, installation and operation. The AC industry has built more efficient units by increasing the size of the heat exchangers and using sophisticated exchanger technology such as microgrooves and more efficient compressors. However, the industry acknowledges it is approaching the theoretical efficiency limits of its technology.

DESERT COOLAIRE TECHNICAL ASSESSMENT
NEW BUILDINGS INSTITUTE, INC. Page 6 JULY 2007 FINAL REPORT
Some of the most extensive research on the efficiency and effectiveness of small RTUs was done through the California Energy Commission’s Public Interest Energy Research (PIER) program7 and is shown in Figures 2-2 through 2-5. The 2003 findings represented in Figure 2-3 show the variety of energy and operational problems from field research of over 200 RTUs that were less than four years old. The research demonstrated that the actual field efficiency of even new units is far less than their efficiency rating and thus less than the assumptions used for energy policies and planning. Economizer operation was the dominant problem, with over 60 percent of new units in the PIER study having performance and related energy issues. These findings match results from several other investigations into RTU performance that, in aggregate, showed economizers fail to operate as designed in as much as 90 percent of field checked units8.
0 0.1 0.2 0.3 0.4 0.5 0.6 0.7
No outside air intake atunit
Simultaneous heatingand cooling
Fans run duringunoccupied period
Cycling fans duringoccupied period
Low air flow
Refrigerant charge
Economizers
Problem Frequency
Figure 2-3 Frequency of Problems in New Small Commercial Package HVAC Systems
The same PIER research project also presented the impacts of high outdoor temperatures on efficiency and on system capacity. In Figure 2-4 the efficiency of a 13 EER RTU dropped by approximately 20 percent between outside temperatures of 85°F and 105°F. Figure 2-5 shows that the same system loses almost 5,000 btus of cooling capacity over this temperature range.
7 Source: results through the California Energy Commission’s Public Interest Energy Research (PIER) Program. Small Package HVAC System Integration at http://www.energy.ca.gov/2003publications/CEC-500-2003-082/CEC-500-2003-082-A-12.PDF 8 Source: merged analysis studies from PIER, Ecotope, RLW Analytics, NYSERDA, NBI and others presented at the California Public Utilities Commission hearing on Big Bold Strategies for HVAC savings June 5, 2007 by Abram Conant of Proctor Engineering

DESERT COOLAIRE TECHNICAL ASSESSMENT
NEW BUILDINGS INSTITUTE, INC. Page 7 JULY 2007 FINAL REPORT
6.06.57.07.58.08.59.09.5
10.010.511.011.512.012.513.013.5
85F 90F 95F 100F 105F 110F 115F 120F 125F 130F
Outdoor Temperature (oF)
EER
(Btu
/hr/
wat
ts)
Standard Unit High Efficiency UnitPoly. (High Efficiency Unit) Poly. (Standard Unit)
Figure 2-4 Impact of Outdoor Temperature on Energy Efficiency Rating (EER) for Small Package HVAC Systems
48,000
53,000
58,000
63,000
68,000
73,000
85F 90F 95F 100F 105F 110F 115F 120F 125F 130F
Outdoor Temperature (oF)
Gro
ss C
oolin
g C
apac
ity (B
tu/h
r)
Standard Unit High Efficiency UnitPoly. (High Efficiency Unit) Poly. (Standard Unit)
Figure 2-5 Impact of Outdoor Temperature on Cooling Capacity for Small Package HVAC Systems
To get beyond the efficiency and temperature limits, researchers are turning to other technologies, which prominently include evaporative cooling. Evaporative cooling is not suitable in all climates, but where it is well suited, it can reduce cooling energy by a factor of three. More important: the hotter the day, the greater the contribution from evaporative cooling. In essence, evaporative cooling serves as a hedge against peak cooling loads caused by hot weather.
2.1.3 Indoor Air Quality Interest in indoor air quality began in the 1980s with prominent news stories about sick-building syndrome and the build up of indoor pollutants. Since we spend over 90 percent of our time in buildings the health and related cost issues drew the attention of both the public and the commercial real estate and design industry. Traditional evaporative technologies contribute to, rather than reduce, indoor air quality issues by adding moisture to the supply air thus increasing the potential for moisture-related health risks.
The increased demand for technologies that improve indoor air quality, however, is much more recently elevated by the impressive membership and market impact of the U.S. Green Building Council and its
DESERT COOLAIRE TECHNICAL ASSESSMENT
NEW BUILDINGS INSTITUTE, INC. Page 8 JULY 2007 FINAL REPORT
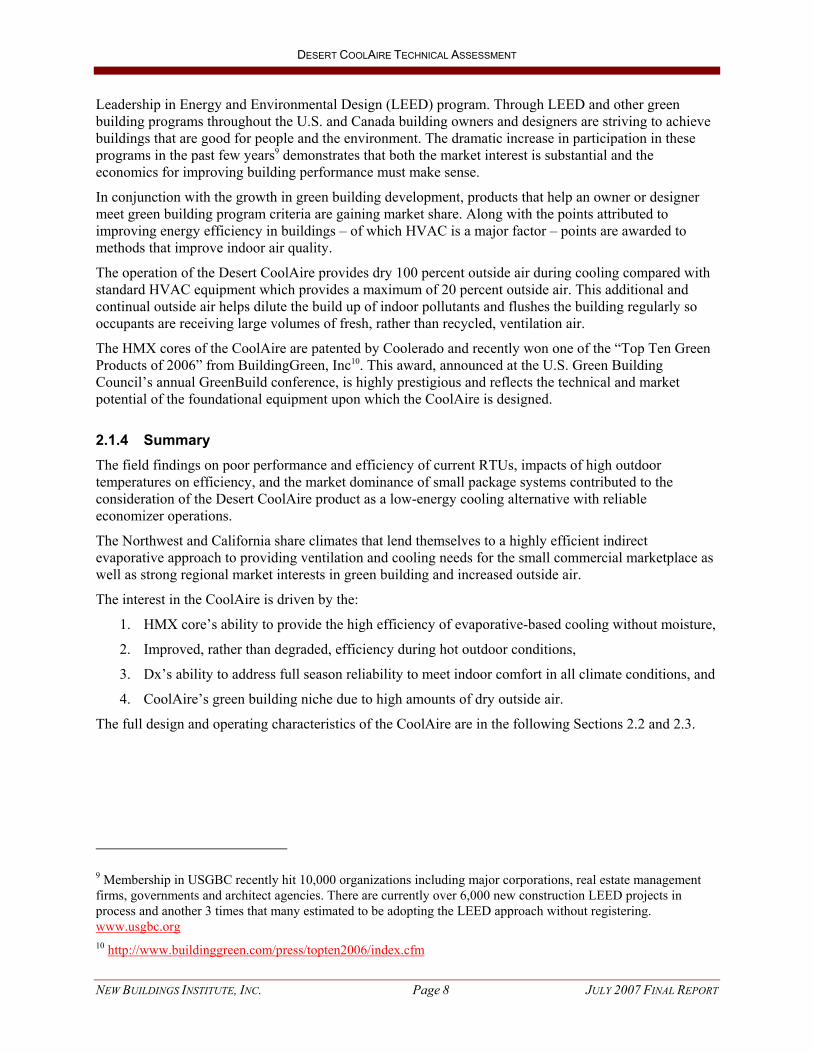
Leadership in Energy and Environmental Design (LEED) program. Through LEED and other green building programs throughout the U.S. and Canada building owners and designers are striving to achieve buildings that are good for people and the environment. The dramatic increase in participation in these programs in the past few years9 demonstrates that both the market interest is substantial and the economics for improving building performance must make sense.
In conjunction with the growth in green building development, products that help an owner or designer meet green building program criteria are gaining market share. Along with the points attributed to improving energy efficiency in buildings – of which HVAC is a major factor – points are awarded to methods that improve indoor air quality.
The operation of the Desert CoolAire provides dry 100 percent outside air during cooling compared with standard HVAC equipment which provides a maximum of 20 percent outside air. This additional and continual outside air helps dilute the build up of indoor pollutants and flushes the building regularly so occupants are receiving large volumes of fresh, rather than recycled, ventilation air.
The HMX cores of the CoolAire are patented by Coolerado and recently won one of the “Top Ten Green Products of 2006” from BuildingGreen, Inc10. This award, announced at the U.S. Green Building Council’s annual GreenBuild conference, is highly prestigious and reflects the technical and market potential of the foundational equipment upon which the CoolAire is designed.
2.1.4 Summary The field findings on poor performance and efficiency of current RTUs, impacts of high outdoor temperatures on efficiency, and the market dominance of small package systems contributed to the consideration of the Desert CoolAire product as a low-energy cooling alternative with reliable economizer operations.
The Northwest and California share climates that lend themselves to a highly efficient indirect evaporative approach to providing ventilation and cooling needs for the small commercial marketplace as well as strong regional market interests in green building and increased outside air.
The interest in the CoolAire is driven by the:
1. HMX core’s ability to provide the high efficiency of evaporative-based cooling without moisture,
2. Improved, rather than degraded, efficiency during hot outdoor conditions,
3. Dx’s ability to address full season reliability to meet indoor comfort in all climate conditions, and
4. CoolAire’s green building niche due to high amounts of dry outside air.
The full design and operating characteristics of the CoolAire are in the following Sections 2.2 and 2.3.
9 Membership in USGBC recently hit 10,000 organizations including major corporations, real estate management firms, governments and architect agencies. There are currently over 6,000 new construction LEED projects in process and another 3 times that many estimated to be adopting the LEED approach without registering. www.usgbc.org 10 http://www.buildinggreen.com/press/topten2006/index.cfm
DESERT COOLAIRE TECHNICAL ASSESSMENT
NEW BUILDINGS INSTITUTE, INC. Page 9 JULY 2007 FINAL REPORT
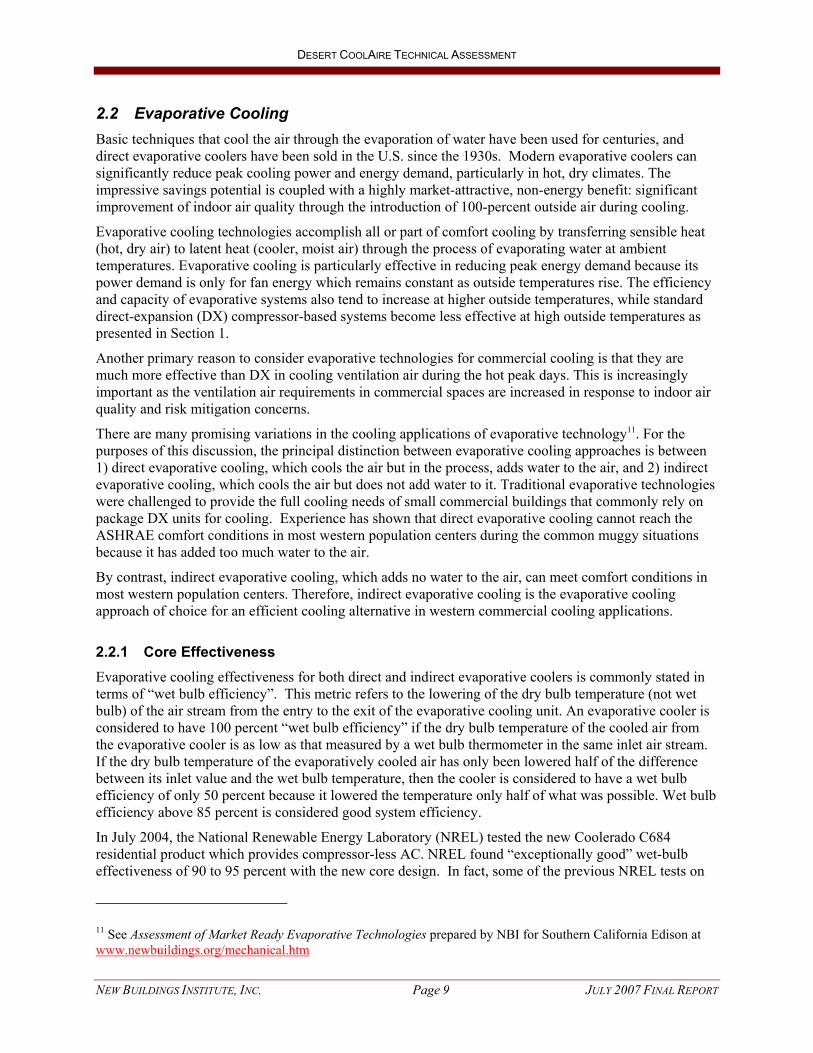
2.2 Evaporative Cooling Basic techniques that cool the air through the evaporation of water have been used for centuries, and direct evaporative coolers have been sold in the U.S. since the 1930s. Modern evaporative coolers can significantly reduce peak cooling power and energy demand, particularly in hot, dry climates. The impressive savings potential is coupled with a highly market-attractive, non-energy benefit: significant improvement of indoor air quality through the introduction of 100-percent outside air during cooling.
Evaporative cooling technologies accomplish all or part of comfort cooling by transferring sensible heat (hot, dry air) to latent heat (cooler, moist air) through the process of evaporating water at ambient temperatures. Evaporative cooling is particularly effective in reducing peak energy demand because its power demand is only for fan energy which remains constant as outside temperatures rise. The efficiency and capacity of evaporative systems also tend to increase at higher outside temperatures, while standard direct-expansion (DX) compressor-based systems become less effective at high outside temperatures as presented in Section 1.
Another primary reason to consider evaporative technologies for commercial cooling is that they are much more effective than DX in cooling ventilation air during the hot peak days. This is increasingly important as the ventilation air requirements in commercial spaces are increased in response to indoor air quality and risk mitigation concerns.
There are many promising variations in the cooling applications of evaporative technology11. For the purposes of this discussion, the principal distinction between evaporative cooling approaches is between 1) direct evaporative cooling, which cools the air but in the process, adds water to the air, and 2) indirect evaporative cooling, which cools the air but does not add water to it. Traditional evaporative technologies were challenged to provide the full cooling needs of small commercial buildings that commonly rely on package DX units for cooling. Experience has shown that direct evaporative cooling cannot reach the ASHRAE comfort conditions in most western population centers during the common muggy situations because it has added too much water to the air.
By contrast, indirect evaporative cooling, which adds no water to the air, can meet comfort conditions in most western population centers. Therefore, indirect evaporative cooling is the evaporative cooling approach of choice for an efficient cooling alternative in western commercial cooling applications.
2.2.1 Core Effectiveness Evaporative cooling effectiveness for both direct and indirect evaporative coolers is commonly stated in terms of “wet bulb efficiency”. This metric refers to the lowering of the dry bulb temperature (not wet bulb) of the air stream from the entry to the exit of the evaporative cooling unit. An evaporative cooler is considered to have 100 percent “wet bulb efficiency” if the dry bulb temperature of the cooled air from the evaporative cooler is as low as that measured by a wet bulb thermometer in the same inlet air stream. If the dry bulb temperature of the evaporatively cooled air has only been lowered half of the difference between its inlet value and the wet bulb temperature, then the cooler is considered to have a wet bulb efficiency of only 50 percent because it lowered the temperature only half of what was possible. Wet bulb efficiency above 85 percent is considered good system efficiency.
In July 2004, the National Renewable Energy Laboratory (NREL) tested the new Coolerado C684 residential product which provides compressor-less AC. NREL found “exceptionally good” wet-bulb effectiveness of 90 to 95 percent with the new core design. In fact, some of the previous NREL tests on
11 See Assessment of Market Ready Evaporative Technologies prepared by NBI for Southern California Edison at www.newbuildings.org/mechanical.htm

DESERT COOLAIRE TECHNICAL ASSESSMENT
NEW BUILDINGS INSTITUTE, INC. Page 10 JULY 2007 FINAL REPORT
the predecessor Coolerado core design at very low airflow rates showed wet bulb efficiencies of 120% - which is beyond the expected theoretical limit but achieved due to the unique “M-Cycle” design of sequential evaporative cooling explained below.
The performance data developed in this project shows practically and theoretically that the performance of an indirect evaporative cooler cannot be captured by a single term “wet bulb efficiency”. This efficiency metric may have been suitable for characterizing direct evaporative cooler performance, but it fails to recognize the principal distinguishing benefits of the indirect evaporative coolers in general: the indirect evaporative cooler reduces the wet bulb temperature as well as the dry bulb temperature whereas a direct evaporative cooler cannot reduce the wet bulb temperature resulting in a primary deficiency in terms of indoor comfort. In this project, wet bulb efficiency is not used as a field metric and a broader characterization of indirect evaporative cooler performance is needed in future research.
2.3 The HMX Core Design The heart of the CoolAire package unit is its patented Coolerado core (now licensed for manufacturing by Delphi Corporation)12. The Coolerado core is an indirect evaporative cooling module that features a unique pre-cooling design to dramatically increase the cooling capacity of the exchange media to use less exhaust air and less water than conventional modules.
The Coolerado heat exchanger core design is based on the patented and innovative Maisotsenko Cycle (M-cycle), which uses wet and dry sides of a plate, as is common for an indirect evaporative cooler but with a much different geometry and airflow, creating a new thermodynamic cycle. The M-cycle is essentially a sequential evaporative cooler where some of the cooled output of the unit is directed to the final portion of the evaporation process which leads to cooler product air, typically quite close to the wet bulb temperature. In principal, the M-cycle can allow any liquid or vapor to be cooled below the wet bulb temperature and toward the dew point temperature of the incoming air, but in practice the product air flow would need to be unreasonably low and achieving cooling to temperatures near the wet bulb is sufficiently attractive in terms of efficiency.
Within the heat exchanger, the cycle divides the incoming air stream into a product air stream and a working air stream. The product air (supply air) travels through the dry side of the heat exchanger, and is the “product” of the cooling process. It is the cooled air delivered to the occupied space. The working air removes heat by evaporation from the wet side of the heat exchanger. Heat is removed from the dry product air stream and conducted to the wet working air stream through the heat exchanger membrane. By design none of the evaporated moisture removed from the wet side will be in the product air.
The heat-and-mass exchanger consists of several sheets of a cellulose-blended fiber designed to wick fluids evenly. The sheets are stacked on one another, separated by channel guides placed on one side of the sheet. One side of each sheet is also coated with polyethylene. The channel guides attached to the polyethylene sides of the sheet run along the length of the sheet. The guides that are placed on the non-coated side run along the width of the sheet forming a grid within the exchanger. These channel
12 The heat exchangers were invented by Dr. Valeriy Maisotsenko and are patented by Coolerado/Idalex Corporation. The heat exchangers used in the test units were manufactured by Coolerado/Idalex Corporation. The heat exchangers are now licensed for manufacturing by Delphi Corporation and now called the Delphi HMX.

DESERT COOLAIRE TECHNICAL ASSESSMENT
NEW BUILDINGS INSTITUTE, INC. Page 11 JULY 2007 FINAL REPORT
guides are fabricated from ethyl vinyl acetate (EVA). They provide structure to the exchanger as well as guide air movement within the exchanger.
When assembled, the coated side of the top sheet is placed facing down, and the coated side of the second sheet is facing up. When placed together, these two coated sheets form a dry channel. Conversely, the underside of the second sheet, which is uncoated, is placed with the third sheet, uncoated side up, to form a wet channel.
The exchanger has a trough shape that directs water to drain holes in the trough. The polyethylene coating prevents the dry channel from becoming wet, while the troughs guide the water to the non-coated surface of a wet channel below. Through the natural capillary capabilities of the cellulose, the water is evenly distributed through the wet channels, resulting in alternating wet and dry channels.
The product air is separate from the working air and remains within dry channels the entire length of the exchanger. The product air rejects its heat to the working air and travels the distance of the exchanger and into the occupied space for cooling. The working air channels are blocked at the opposite end of the inlet, preventing the wet working air or any fluid from reaching the product air or cooling space.
Upon entering the exchanger, the working fluid is pre-cooled sensibly in a dry channel. Then, through the design of the heat-and-mass exchanger, the working air is fractioned into multiple streams which are directed into wet channels. The working air (also called purge air) absorbs the heat from the product in the wet channels and then is exhausted by means of a purge damper out of the sides of the exchanger. The special cellulous material used in the manufacture of the exchanger acts as a natural capillary wick within the wet channels. The natural wicking assures uniform wetting within the heat
exchanger with no excess fluid, thereby focusing energy removal on the cooling of the product stream. The wicking nature of the cellulose material also helps break down the surface tension of the water, resulting in a higher mass and heat transfer rate.
The arrows show the air flow through the module (the product supply air flows in the direction of the V, the working purge air flows perpendicular). The center V trough shows holes for water distribution.
The green is a polyethylene moisture barrier. The gray is cellulose blended fibers. Together they are formed into a single sheet.
Because the heat from the product air is rejected to the working air through the heat exchange surface of the exchanger, only the product air experiences sensible cooling. The product stream is separate from the

DESERT COOLAIRE TECHNICAL ASSESSMENT
NEW BUILDINGS INSTITUTE, INC. Page 12 JULY 2007 FINAL REPORT
working air and never comes in contact with a wetted surface unless it is desirable for the application. This cycle occurs multiple times in a short physical space within the same exchanger, resulting in a progressively colder temperature as the product air continues to flow across the working air.
2.4 The Desert CoolAire System Desert Aire built on the M-Cycle efficiency by using the Coolerado HMX cores with a direct expansion (DX) compressor to create a prototype hybrid they named the Desert CoolAire.
The Desert CoolAire is a 5-ton capacity, 1800-cubic-foot-per-minute (CFM) supply air, rooftop package HVAC unit. The Desert CoolAire system combines eight indirect evaporative Coolerado cores and a 4-ton capacity Copeland modulating scroll DX compressor with a 100,000 btu gas pack to create a complete AC and heating system. Because of its use of evaporatively-based cooling, the Desert CoolAire system introduces outside air in significantly higher quantities than code ventilation requires.
The Desert CoolAire package unit is controlled by the latest Johnson FX-15 digital thermostatic control technology and incorporates a variable speed fan. The equipment specifications are in Table 2-1 below.
Table 2-1 Standard Desert CoolAire Prototype Specifications
Operating environment range: Temperature: -20°F to 110°F
Humidity: 20% to 80% RH
Supply Air: 1,800 cfm @ 1 inch WC ESP
Total System Cooling Capacity: 60,000 BTU
Total Refrigerant Cooling Capacity:
48,000 BTU
Total Gas Heating Capacity 100,000 BTU
Voltage: 208-230/3 phase or 460/480/3 phase
Compressor type: Digital Modulating Scroll - 10% to 100%
Blower Type: Plenum type with VFD control
Blower HP: 3.0 HP
Refrigerant: R22
Filters: 25% extended surface
Dimensions: 132L x 54W x 60H
Weight: 2300 lbs wetted
The Desert CoolAire has three cooling stages plus a heating mode provided by the gas pack.
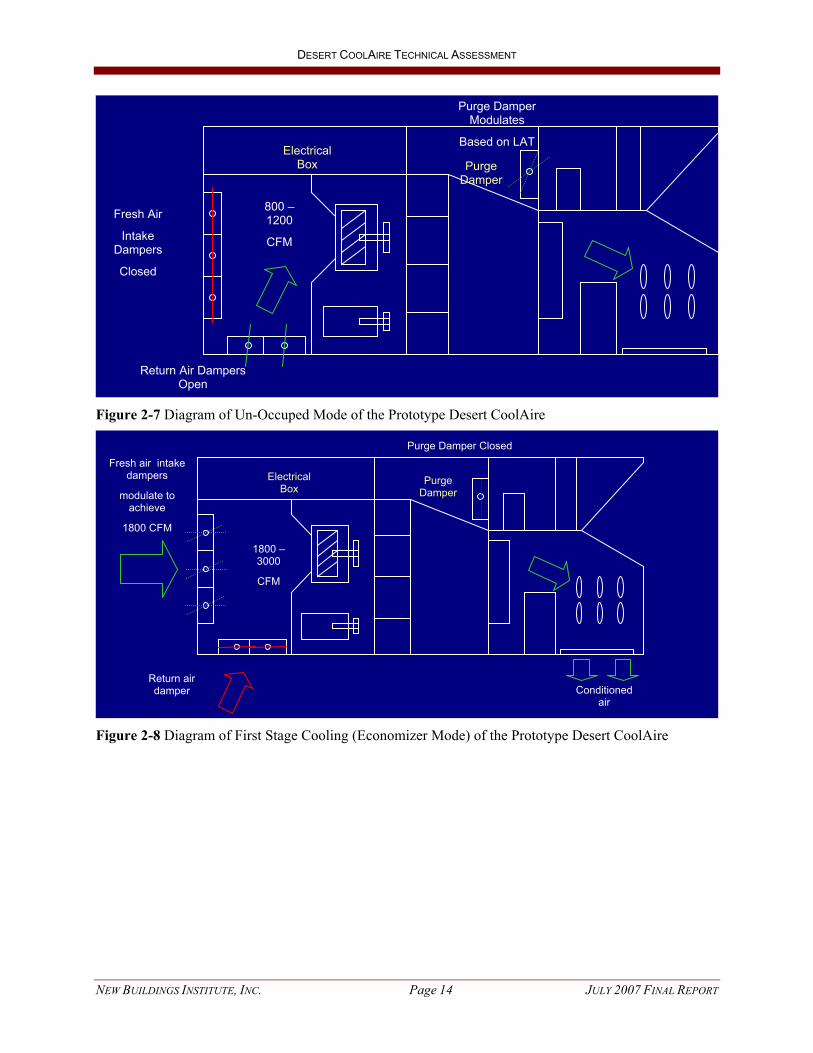
Stage 1 cooling uses an economizer to directly provide outside air when the outside temperature is sufficient to meet the comfort needs of the occupants. During economizer mode, the indirect evaporative core is wet, but the outside air damper is 100 percent open and the purge air damper that discharges the product air is closed. Fan energy is the only power for cooling provided in this mode.
Stage 2 cooling uses the indirect evaporative cooling module (HMX core). This module pre-cools outside air. For example, when the outside temperature reaches 90ºF on a typical day in the western U.S., the indirect evaporative cooling module cools the air to around 65-70ºF without adding moisture to the air
DESERT COOLAIRE TECHNICAL ASSESSMENT
NEW BUILDINGS INSTITUTE, INC. Page 13 JULY 2007 FINAL REPORT
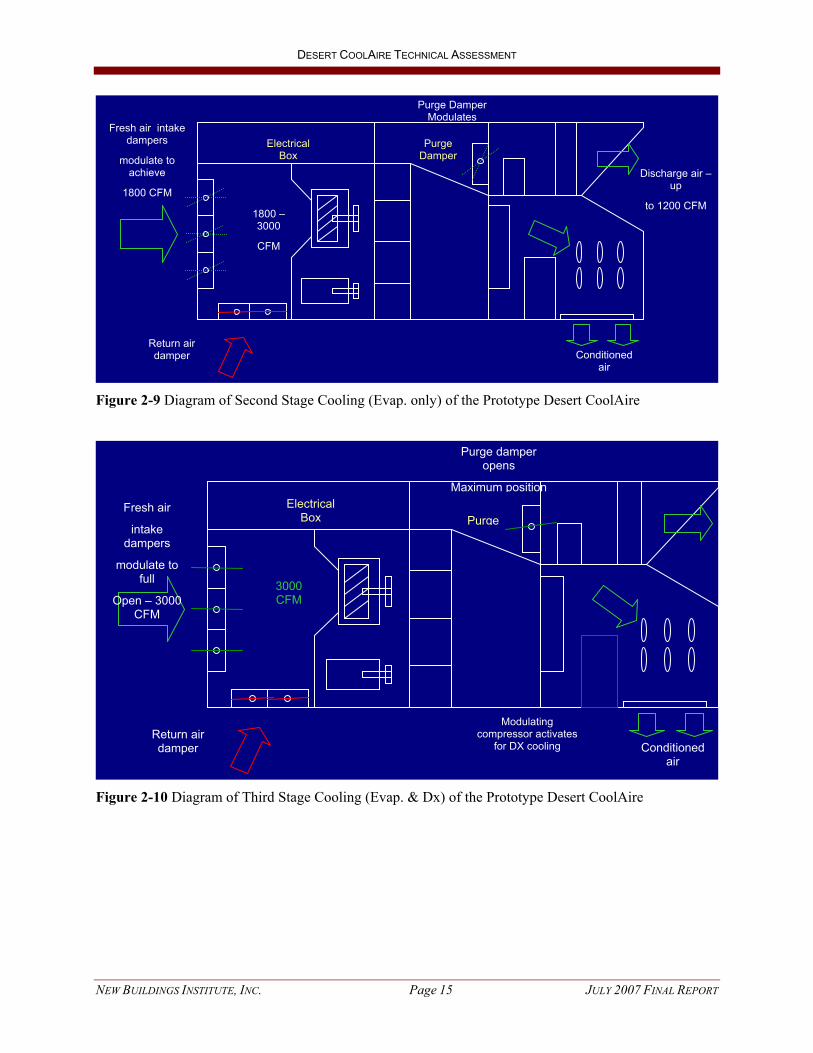
stream. Typical performance for a high efficiency indirect evaporative cooler will be to discharge supply air in the 65-70ºF range regardless of the inlet air temperature, be it anywhere in the range from 80-120º F. This is the “workhorse” stage where most of the sensible cooling is done. Stage 2 cooling is done with no compressor and thus uses only fan energy with much lower electrical power than using a traditional air conditioner. During indirect evaporative cooling, the outside air damper is 100 percent open, and the purge damper is open to a pre-determined amount necessary for the working air exhaust.
Stage 3 cooling uses a digital modulating scroll compressor. If the unit’s indirect evaporative cooler cannot meet the entire cooling load, the compressor and the cooling coil are activated to provide final cooling. This compressor can vary its output from 10 to 100 percent of rated capacity, depending on required conditions. Under all but the most extreme hot weather conditions, the compressor will operate at substantially lower than its rated capacity. Since DX cooling is always a combination of indirect evaporative cooling with the DX complement, the outside air damper is 100 percent open, and the purge damper is fully open to maximize the working air flow because the condenser portion of the compressor system is located in the purge air flow and requires maximum air flow for efficient operation. Since the HMX core will reliably bring the outside air down to the 65-70ºF range the work of the compressor is significantly reduced and on the order of 8-15ºF maximum. Stage 3 cooling uses energy for the fan and the DX but at significantly less power than a DX alone that would be cooling the air 20-60ºF alone. In the event of failure of the indirect core, the DX can be operated independently, providing up to four tons of cooling.
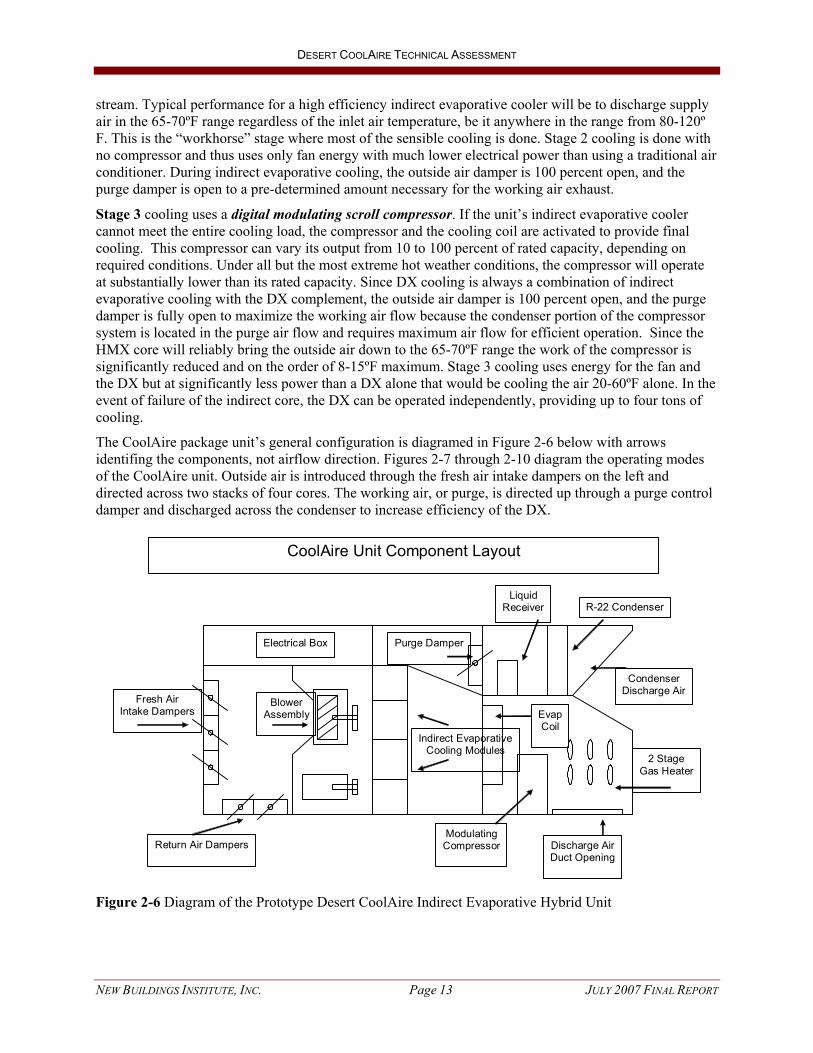
The CoolAire package unit’s general configuration is diagramed in Figure 2-6 below with arrows identifing the components, not airflow direction. Figures 2-7 through 2-10 diagram the operating modes of the CoolAire unit. Outside air is introduced through the fresh air intake dampers on the left and directed across two stacks of four cores. The working air, or purge, is directed up through a purge control damper and discharged across the condenser to increase efficiency of the DX.
CoolAire Unit Component Layout
Electrical Box
Fresh Air Intake Dampers
Return Air Dampers
Indirect Evaporative Cooling Modules
Condenser Discharge Air
Discharge Air Duct Opening
2 Stage Gas Heater
Blower Assembly
Purge Damper
R-22 CondenserLiquid
Receiver
Evap Coil
Modulating Compressor
Figure 2-6 Diagram of the Prototype Desert CoolAire Indirect Evaporative Hybrid Unit
DESERT COOLAIRE TECHNICAL ASSESSMENT
NEW BUILDINGS INSTITUTE, INC. Page 14 JULY 2007 FINAL REPORT
Figure 2-7 Diagram of Un-Occuped Mode of the Prototype Desert CoolAire
Figure 2-8 Diagram of First Stage Cooling (Economizer Mode) of the Prototype Desert CoolAire
Fresh air intake dampers
modulate to achieve
1800 CFM
Electrical Box
Purge Damper
1800 – 3000
CFM
Purge Damper Closed
Return air damper Conditioned
air
Electrical Box
Fresh Air
Intake Dampers
Closed
Return Air Dampers Open
Purge Damper
800 – 1200
CFM
Purge Damper Modulates
Based on LAT
DESERT COOLAIRE TECHNICAL ASSESSMENT
NEW BUILDINGS INSTITUTE, INC. Page 15 JULY 2007 FINAL REPORT
Figure 2-9 Diagram of Second Stage Cooling (Evap. only) of the Prototype Desert CoolAire
Figure 2-10 Diagram of Third Stage Cooling (Evap. & Dx) of the Prototype Desert CoolAire
Electrical Box Purge
3000 CFM
Purge damper opens
Maximum position
Return air damper Conditioned
air
Modulating compressor activates
for DX cooling
Fresh air
intake dampers
modulate to full
Open – 3000 CFM
Fresh air intake dampers
modulate to achieve
1800 CFM
Electrical Box
Purge Damper
1800 – 3000
CFM
Purge Damper Modulates
Return air damper
Discharge air – up
to 1200 CFM
Conditioned air

DESERT COOLAIRE TECHNICAL ASSESSMENT
NEW BUILDINGS INSTITUTE, INC. Page 16 JULY 2007 FINAL REPORT
3 Lab Results
3.1 Approach As part of the first phase of the technical assessment program, two sets of laboratory testing were performed by project team partner Architectural Energy Corporation in their Chicago ventilation lab to establish baseline performance characteristics. The results of the lab testing assisted in evaluating the performance of CoolAire units installed in commercial buildings in the Pacific Northwest as part the technology demonstration project.
During the first set of lab tests in 2005, a test matrix consisting of a range of 11 ambient temperature and moisture conditions was established to investigate performance relative to meeting leaving air temperature set points of 55°F and 65°F.
For the second set of lab tests (performed in the second quarter of 2006), the rated design airflow was reduced from 3000 cubic feet per minute (cfm) to 2500 cfm, which allowed the unit to perform more closely to expected performance criteria.
As part of the second set of lab tests, structured flow tests were performed to exercise the operation of the HMX under a variety of control pressure and purge air damper settings. The compressor operation was disabled for the entire structured flow test sequence to eliminate thermal transients. The indirect evaporative module was run at six different main control pressure settings, nominally 1.5 inches water column (WC), 1.35 inches WC, 1.2 inches WC, 1 inch WC, and 0.85 inches WC. At each of these settings the fan control maintained a constant pressure from the module inlet to the supply outlet. Then at each different control pressure, the purge damper was moved through a range of settings: 0 deg, 12 deg, 24 deg, 36 deg, 48 deg and 60 deg.
3.2 Outcomes During the first set of lab tests, the unit did not achieve design airflow of 3,000 cfm of outside air at the design pressure drop across the HMX core. Several components and control settings were adjusted to maximize the achieved airflow. The maximum outside airflow rate achieved with these changes was about 2,900 cfm in cooling mode with a wetted HMX core.
During the first set of lab tests, the HMX core provided the expected temperature depression. In many cases, however, the compressor did not deliver sufficient cooling to achieve the design leaving air temperatures. It is not clear why the compressor did not perform as expected, but the control and quantity of purge air over the condenser coil may have been a factor, as well as how the digital controls of the variable capacity compressor were set.
Based on the results of these first lab tests, the field test units were modified as follows:
• The fan motor pulley was replaced.
• A shroud was installed between the fan outlet and the HMX core inlet.
The second set of lab tests showed that the”wet bulb efficiency” of the indirect evaporative module was in the range of 85-90%. Under the most extreme condition tested the cooling output of the indirect evaporative module alone was as high as 45,160 Btu/h (3.8 tons) with an EER as high as 22 for the most extreme outside air condition tested (101 F and 32 percent RH). The CoolAire package unit’s total cooling capacity including the compressor at the same conditions was about 72,000 Btu/h (6 tons) with an overall cooling EER of 10. It is evident that this second set of laboratory tests was run with a relatively high fan control pressure of 1.2 inches WC, and a high fan power of 2 kW. This high fan power led to unusually low EERs observed in the laboratory tests.
DESERT COOLAIRE TECHNICAL ASSESSMENT
NEW BUILDINGS INSTITUTE, INC. Page 17 JULY 2007 FINAL REPORT
The 2006 laboratory tests also involved a structured set of full system performance tests under orderly varied conditions of purge damper setting and control pressure. These tests run after the primary lab test sequence showed quite clearly an energy optimum operating region with low fan control pressure and a partially open purge damper. Control settings close to these optima observed in the lab were used at various field test sites during the summer of 2006.
A full Laboratory Testing Report prepared by Architectural Energy Corporation is available from NBI or the sponsors

DESERT COOLAIRE TECHNICAL ASSESSMENT
NEW BUILDINGS INSTITUTE, INC. Page 18 JULY 2007 FINAL REPORT
4 Field Installation and Support
Identifying field issues and possible market barriers associated with design and installation were fundamental to the research project. This section provides the basis and approach used in selecting sites and the issues encountered during installation. Performance findings are addressed in Sections 7 and 8, and solutions and next generation modifications to address some of the field issues are in Section 9.
4.1 Site Selection One of the project’s early challenges was finding participants and appropriate sites. Owner and facility manager willingness to provide third-party access to their buildings has decreased since the incidents of September 11, 2001. To facilitate communications and credibility of the research effort, the project developed the following items:
• Introduction letter from the sponsor described the purpose of the research and stated the support by the local or regional sponsor.
• Project description and technical information provided background on standard RTU equipment and the technical basis of the research equipment and hoped-for efficiency improvements.
• Owner information outlined the project commitment to:
♦ Provide the equipment at no cost.
♦ Fund partial installation costs (generally $4,000-$6,000), depending on sponsor and phase.
♦ Include extended (three-year) equipment warranty and maintenance.
♦ Provide access to the real-time operating data and final report.
In turn, the owner would cover any remaining costs, provide access to the building and equipment and be willing to have the results published and promoted.
• Contractor Information included installation obligations, requirement to include three-year maintenance in the costing and the method for reimbursing the owner for installation costs.
The project investigated over 20 potential sites with nine owners based on the following site and project criteria:
• Owner and contractor willingness to participate
• Northwest sites in various climates with ideal locations in Portland, Seattle and Boise
• Office and retail sites preferred
• 50 hours per week or more of HVAC operations
• Existing 5-ton capacity package rooftop unit matching the voltage of the research units and planned for replacement
• Existing unit serves a non-critical area in case of downtime between system change-outs
• Existing unit roof location has physical space for the larger replacement unit and retrofit roof curb
• Visibility of new unit from parking lot or street acceptability
• Existing duct transition and supply in good shape and appropriate for the airflow specifications
• Structural capacity of the roof to support the research unit

DESERT COOLAIRE TECHNICAL ASSESSMENT
NEW BUILDINGS INSTITUTE, INC. Page 19 JULY 2007 FINAL REPORT
• Water supply and drain location reasonable to supply the research unit
• Access to the roof without disruption of tenants and a location for the data communications gateway
• Final price estimate from the contractor acceptable following site and structural assessment
During the late summer and early fall of 2005, three CoolAire package units were installed at sites in the Pacific Northwest (Portland, OR, Vancouver, WA, and Boise, ID). During the summer of 2006, three units were installed in the Sacramento, California area, one was installed near Boise, and one was installed near Seattle. Shortly after installation of each unit, PECI commissioned of the data acquisition systems.
The project team had the early benefit of access to an owner’s representative of a large retail/grocery chain interested in improving HVAC performance, particularly for RTUs, and willing to participate in the project. The initial participating contractors also helped identify potential sites and assess application options. Ultimately, the NEEA project funded the installation and research of five units at five sites, and the SMUD project resulted in three units installed at two sites. Site locations and characteristics are shown in Table 4-1 below.
Table 4-1 Summary of Desert CoolAire Installations Data Site # Location - City, State (Sponsor) Owner Type Utility Install Date
Unit Voltage Zone Served
13 Portland, OR (NEEA) Retail Chain PacifiCorp - ETO 10/3/2005 460/480 Deli14 Vancouver, WA (NEEA) Retail Chain Clark PUD 10/31/2005 460/480 Office15 Boise, ID (NEEA) Retail Chain Idaho Power 12/7/2005 460/480 Jewelry16 Nampa, ID (NEEA) Retail Chain Idaho Power 7/26/2006 460/480 Price Check room17 Sacramento, CA (SMUD) Comm. College SMUD 7/31/2006 208/230 "Dance" room18 Sacramento, CA (SMUD) Comm. College SMUD 7/31/2006 460/480 "Dance" room19 Seattle, WA (NEEA) Office Seattle City Light 9/20/2006 208/230 open offices20 Sacramento, CA (SMUD) Office SMUD 10/13/2006 460/480 open offices
8 Total units installed, 7 operating for summer 2006 cooling assessment
4.2 Installation Issues The CoolAire package unit has the same components as a standard RTU plus the indirect evaporative heat exchanger. This first generation design and integration created a unit that varied sufficiently from a standard RTU to create new challenges for the sites and the contractors, as described below:
Weight—The CoolAire prototype’s weight was approximately three times that of a standard unit. This created a significant barrier to site selection and installation due to the need for a structural assessment of each potential roof location. Many potential sites were eliminated based on assessment of the roof’s ability to support the unit, the costs to modify the roof to handle the added weight, or both. Successful sites also had to plan on using a larger crane than typically used for a standard RTU to load the CoolAire prototype. The structural assessment required a third-party engineering review and was a requirement of most municipal permitting agencies. Acquiring the necessary drawings and information for the engineering report took time and effort, adding to the hard costs of the assessment and the additional structural permit cost that are not factors for typical RTU installations.
There is an industry trend toward heavier small package units based on changes to the evaporator coil and configurations to gain higher efficiency. Older standard 5-ton units are typically 400 to 600 pounds. Newer high efficiency units run 800 to 1,200 pounds, and the CoolAire prototype had a wetted weight of 2,200 pounds. Based on the foot print of each of these units the loading per square foot was not significantly different but the overall weight of the CoolAire raised flags not yet experienced by standard RTUs.

DESERT COOLAIRE TECHNICAL ASSESSMENT
NEW BUILDINGS INSTITUTE, INC. Page 20 JULY 2007 FINAL REPORT
The structural issues encountered with the CoolAire prototype may be equally problematic for many of the new replacement units due to upgraded code requirements and the new weights of the higher efficiency equipment. Better front-end information regarding the overall loading roof weight rather than the nominal weight may help inspectors and contractors reduce assessment costs.
Size—The dimensional size of the CoolAire prototype is not unusual in appearance on commercial rooftops but is more equivalent to a 10- to 20-ton package system. The standard 5-ton RTUs that would have been selected to replace the existing systems would be a direct change-out onto the same curb with few modifications necessary to the transition or roof area. The size of the CoolAire prototype and resulting locations of the supply and return air required a custom curb be fabricated by the contractor based on drawings provided by the manufacturer.
In some locations, several RTUs are located together, which eliminates the option of the CoolAire prototype as a change-out due to space constraints. Other rooftop variations introduce installation barriers when moving from a unit with a footprint of approximately 10 square feet to one of over 50 square feet. The CoolAire prototype is also significantly taller than standard 5-ton systems, being approximately six feet high on the curb, and created the need to ensure the unit’s visibility from the street or parking area was not a problem.
Water—Water is the heart of evaporative technologies, and water is a common component of commercial building cooling for large built-up chiller and pre-cooling systems. Yet water is not a standard package RTU component with the exception of condensate. Many rooftops examined in the research did not have existing water lines to the rooftop or dedicated drains. Gaining access to a water supply sometimes required arduous routing within the building’s restrooms or utility areas.
Water supply and routing also required a third-party plumbing contractor at all sites. The price of this work varied widely, depending partly on the distance from water supply to the unit and partly on the current workload of the plumber.
Water issues were fundamentally a factor of retrofit applications and would be reduced in new construction where water access and drains would be pre-designed. Changes in the water line materials to pex and the location of the shut off could also reduce the need for excessive plumber costs and could be handled by the HVAC contractor.
Controls—The control system for the CoolAire prototype is the Johnson FX-15, which requires a room temperature and humidity sensor in the space with the controller mounted nearby. Installing the controller was standard for the contractors, but the system required additional water sensor wiring compared to a standard unit. Once enabled, the control setup was unique to the equipment, which meant a slower programming and troubleshooting process for the contractor than the standard stat installed with most package RTUs.
Access to control connections within the unit were well designed and completely separated from the monitoring control locations installed for the research.
Contractors—The contractors involved with the project were diligent toward their technical work and tolerant of the inevitable changes within the research. For some, this was a rare opportunity to explore an emerging technology and assist in the development of the concept to a market product. Still, the equipment was unfamiliar to them, and the core section brought up issues outside their experience or knowledge. Their expertise in the area of refrigeration and ventilation did not immediately transfer into ability with evaporative systems.
Although there was initial in-person group training, installation and operations manuals, support documents and a manufacturer’s representative at the site during all or most of the installation period, the learning curve and comfort with the installation were both slow, resulting in labor costs in excess of estimates. Two contractors installed more than one unit; the time and issues associated with the second
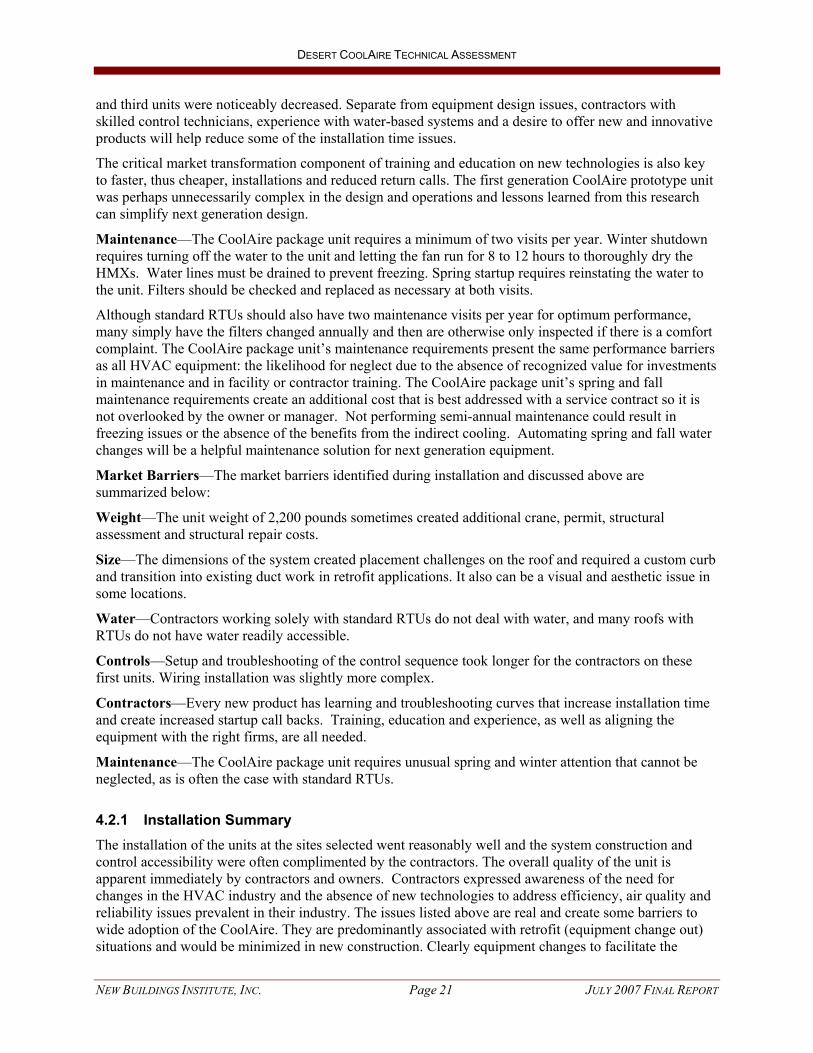
DESERT COOLAIRE TECHNICAL ASSESSMENT
NEW BUILDINGS INSTITUTE, INC. Page 21 JULY 2007 FINAL REPORT
and third units were noticeably decreased. Separate from equipment design issues, contractors with skilled control technicians, experience with water-based systems and a desire to offer new and innovative products will help reduce some of the installation time issues.
The critical market transformation component of training and education on new technologies is also key to faster, thus cheaper, installations and reduced return calls. The first generation CoolAire prototype unit was perhaps unnecessarily complex in the design and operations and lessons learned from this research can simplify next generation design.
Maintenance—The CoolAire package unit requires a minimum of two visits per year. Winter shutdown requires turning off the water to the unit and letting the fan run for 8 to 12 hours to thoroughly dry the HMXs. Water lines must be drained to prevent freezing. Spring startup requires reinstating the water to the unit. Filters should be checked and replaced as necessary at both visits.
Although standard RTUs should also have two maintenance visits per year for optimum performance, many simply have the filters changed annually and then are otherwise only inspected if there is a comfort complaint. The CoolAire package unit’s maintenance requirements present the same performance barriers as all HVAC equipment: the likelihood for neglect due to the absence of recognized value for investments in maintenance and in facility or contractor training. The CoolAire package unit’s spring and fall maintenance requirements create an additional cost that is best addressed with a service contract so it is not overlooked by the owner or manager. Not performing semi-annual maintenance could result in freezing issues or the absence of the benefits from the indirect cooling. Automating spring and fall water changes will be a helpful maintenance solution for next generation equipment.
Market Barriers—The market barriers identified during installation and discussed above are summarized below:
Weight—The unit weight of 2,200 pounds sometimes created additional crane, permit, structural assessment and structural repair costs.
Size—The dimensions of the system created placement challenges on the roof and required a custom curb and transition into existing duct work in retrofit applications. It also can be a visual and aesthetic issue in some locations.
Water—Contractors working solely with standard RTUs do not deal with water, and many roofs with RTUs do not have water readily accessible.
Controls—Setup and troubleshooting of the control sequence took longer for the contractors on these first units. Wiring installation was slightly more complex.
Contractors—Every new product has learning and troubleshooting curves that increase installation time and create increased startup call backs. Training, education and experience, as well as aligning the equipment with the right firms, are all needed.
Maintenance—The CoolAire package unit requires unusual spring and winter attention that cannot be neglected, as is often the case with standard RTUs.
4.2.1 Installation Summary The installation of the units at the sites selected went reasonably well and the system construction and control accessibility were often complimented by the contractors. The overall quality of the unit is apparent immediately by contractors and owners. Contractors expressed awareness of the need for changes in the HVAC industry and the absence of new technologies to address efficiency, air quality and reliability issues prevalent in their industry. The issues listed above are real and create some barriers to wide adoption of the CoolAire. They are predominantly associated with retrofit (equipment change out) situations and would be minimized in new construction. Clearly equipment changes to facilitate the
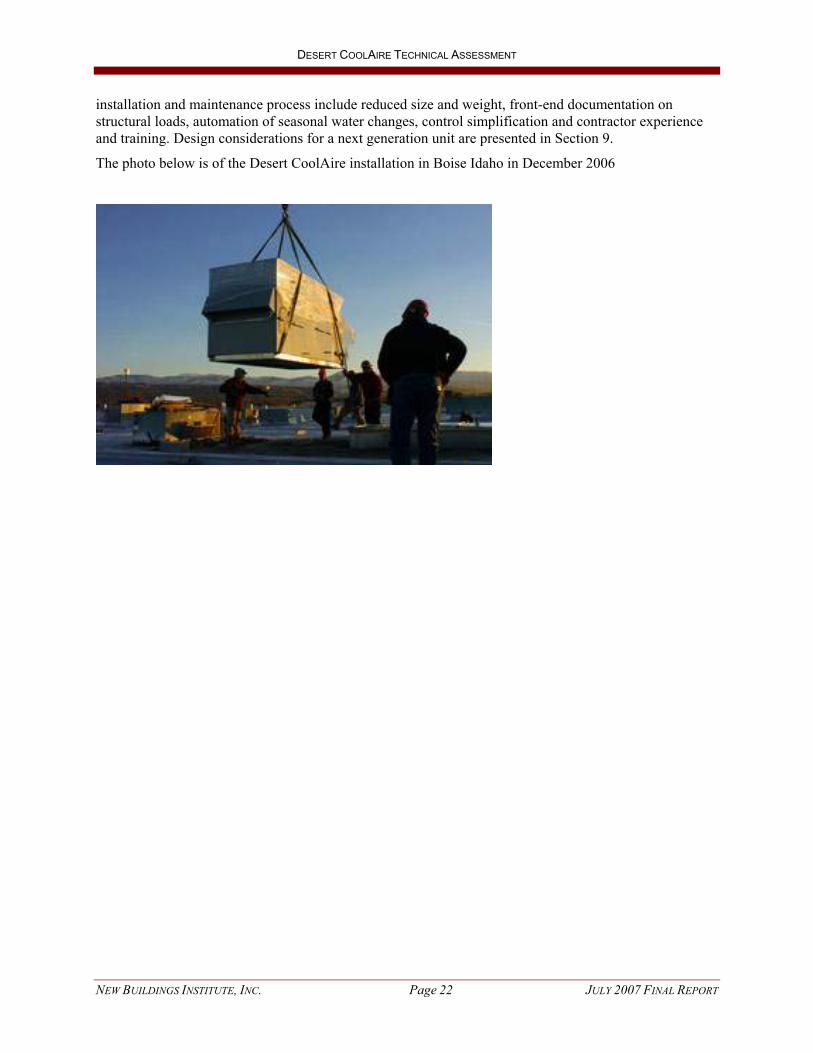
DESERT COOLAIRE TECHNICAL ASSESSMENT
NEW BUILDINGS INSTITUTE, INC. Page 22 JULY 2007 FINAL REPORT
installation and maintenance process include reduced size and weight, front-end documentation on structural loads, automation of seasonal water changes, control simplification and contractor experience and training. Design considerations for a next generation unit are presented in Section 9.
The photo below is of the Desert CoolAire installation in Boise Idaho in December 2006

DESERT COOLAIRE TECHNICAL ASSESSMENT
NEW BUILDINGS INSTITUTE, INC. Page 23 JULY 2007 FINAL REPORT
5 Monitoring and Data Collection
The objectives of the monitoring were to:
• Assess overall cooling energy efficiency.
• Assess general performance of all units.
• Identify unit design and operational flaws.
• Repair or redesign the units to eliminate flaws.
• Determine the peak kW demand and the hourly energy consumption for providing air conditioning.
• Analyze monitored data and report on system performance.
To calculate overall energy efficiency for cooling, measurements are needed for input energy and water as well as output energy. Input energy for cooling is electrical energy and water; these can be measured using watt meters and water flow meters, respectively. Output energy for cooling is calculated based on the enthalpy change as the outside air and return air are conditioned by the HMX indirect evaporative core, the direct expansion compressor and coil, or both. Enthalpy is calculated using dry bulb temperature and a moisture measurement, such as relative humidity. Output energy is calculated using the enthalpy and air flow. Air flow has the greatest measurement uncertainty due to inherent difficulty in measuring it.
To meet monitoring objectives, temperature, humidity, air pressure, water flow and electric power were metered. Laboratory measurements using an AMCA air flow measurement station were made along with pressure differential measurements across the HMX core and the DX cooling coil to provide a surrogate for measuring airflow in the field units. The laboratory measurements included a discharge duct with a damper set to provide 0.5 in wc of static pressure to emulate field installation conditions. Table 5-1 lists the sensors selected.
Sensors and data conditioning modules were installed in each unit at the Desert Aire facility in Milwaukee, Wisconsin. Desert Aire and Architectural Energy Corporation engineers and technicians selected the physical location for sensors on the first unit. Thereafter, Desert Aire technicians installed the sensors and modules on the remaining 11 units. A data acquisition gateway box was available at the factory to allow data access to confirm proper installation of sensors. This process was not fully executed during fabrication of the first units in 2005, in part due to the compressed time schedule to ship units. Checking for proper operation in the factory was not feasible because the water supply was hooked up.
Sensor Point number 7, Return Air Damper Position, was not installed because the damper used in the unit operates is either fully open or fully closed positions and does not modulate.
During laboratory testing of the second unit (the first unit was shipped for ETL testing) in the summer and early fall of 2005, we found the actual differential pressures in the unit exceeded those initially selected based on design information. These sensors were replaced (see note below Table 5-1) on all units.

DESERT COOLAIRE TECHNICAL ASSESSMENT
NEW BUILDINGS INSTITUTE, INC. Page 24 JULY 2007 FINAL REPORT
Table 5-1 Desert CoolAire Point List
Point Measurement Signal Sensor Measurement Range
1 Outside Air Temp 20 mA Vaisala +14°F to +140°F
2 Outside Air RH 20 mA Vaisala 10% to 90% RH
3 Outside Air Damper Position 2-10 volt Johnson 0° to 90° rotation
4 Return Air Temp 20 mA Vaisala +14°F to +140°F
5 Return Air RH 20 mA Vaisala 10% to 90% RH
6 Return Air Damper Position 2-10 volt Johnson 0° to 90° rotation
7 Mixed Air Average Temp 20 mA Grey Stone +32°F to +158°F
8 Core Inlet Air Temp 20 mA Vaisala +14°F to +140°F
9 Core Inlet Air RH 20 mA Vaisala 10% to 90% RH
10 Core Inlet/Exit Air Flow DP 20 mA Huba 0 to 1.2" w.c.
11 Core Inlet/Purge Air Flow DP 20 mA Huba 0 to 0.4" w.c.
12 Core Purge Air Temp 20 mA Vaisala +14°F to +140°F
13 Core Purge Air RH 20 mA Vaisala 10% to 90% RH
14 Core Purge Damper Position 2-10 volt Johnson 0° to 90° rotation
15 Core Exit Air Temp 20 mA Vaisala +14°F to +140°F
16 Core Exit Air RH 20 mA Vaisala 10% to 90% RH
17 Core Exit Air Average Temp 20 mA Grey Stone +32°F to +158°F
18 DX Coil Inlet/Exit Air Flow DP 20 mA Huba 0 to 0.4" w.c.
19 Supply Air Temp 20 mA Vaisala +14°F to +140°F
20 Supply Air RH 20 mA Vaisala 10% to 90% RH
21 Room Wall Temp 20 mA Vaisala +23°F to +131°F
22 Room Wall RH 20 mA Vaisala 10% to 90% RH
23 Water Supply, GPH 5 volt Proteus 0.1 to 1.0 GPM
24 Total Electrical, kWh pulse WattNode 208 volt 720 to 7197 watts
480 volt 830 to 8304 watts
25 Compressor, kWh pulse WattNode 208 volt 360 to 3598 watts
480 volt 415 to 4152 watts
NOTE Sensor Point 10, Core Inlet/Exit Differential Pressure, was replaced with a 0 to 2.0-inch wc Huba differential pressure sensor. Sensor Point 11, Inlet/Purge Air Flow Differential Pressure, was replaced with a 0- to 1.2-inch wc Huba differential pressure sensor.
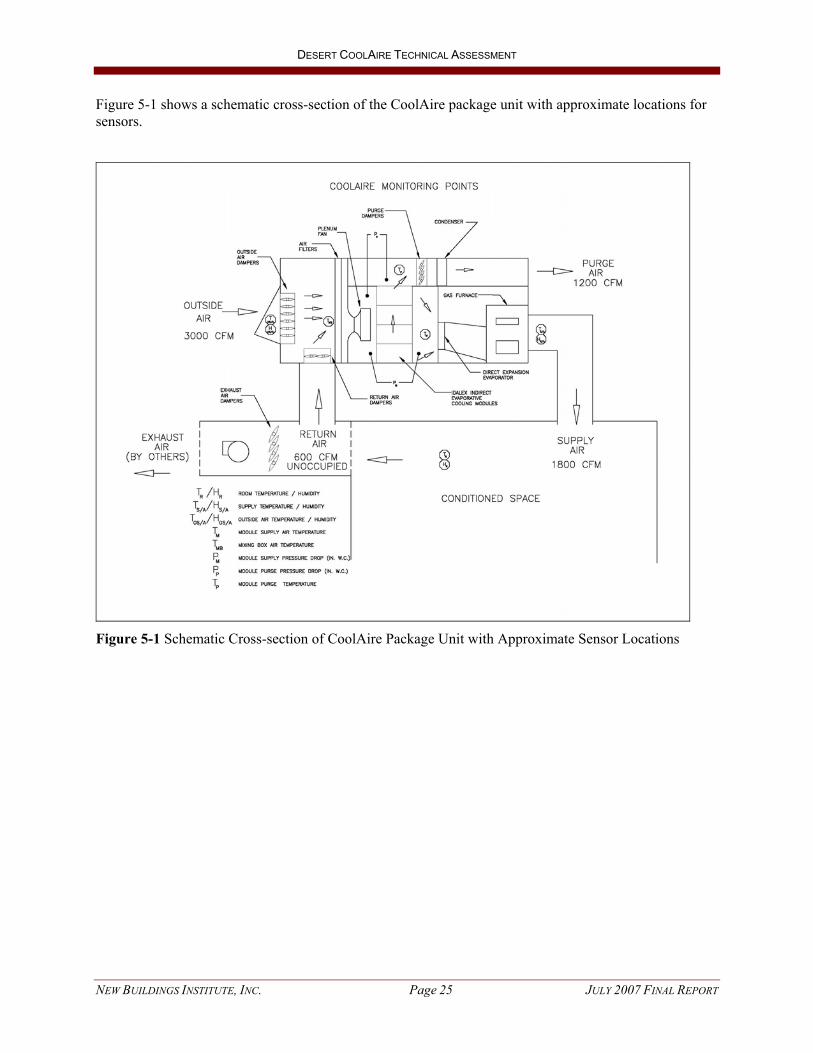
DESERT COOLAIRE TECHNICAL ASSESSMENT
NEW BUILDINGS INSTITUTE, INC. Page 25 JULY 2007 FINAL REPORT
Figure 5-1 shows a schematic cross-section of the CoolAire package unit with approximate locations for sensors.
Figure 5-1 Schematic Cross-section of CoolAire Package Unit with Approximate Sensor Locations

DESERT COOLAIRE TECHNICAL ASSESSMENT
NEW BUILDINGS INSTITUTE, INC. Page 26 JULY 2007 FINAL REPORT
5.1 Data Collection and Processing Data were recorded at one-minute intervals using an onsite computer and uploaded via the internet to the MicroDataNetTM web-based data acquisition system. Four sites used land phone line connections, and four used wireless modems. The computers dialed out to make connections with local internet service providers. Figure 5-2 is a photo of a gateway assembly that houses the data acquisition computer, power supply, data communication module and other accessories.
Figure 5-2 Data Acquisition and Communications Gateway Box
Data were initially uploaded once every half hour. During the field commissioning of the CoolAire package units, it was recognized that access to the data in near real time would facilitate investigating operational problems. Additional ISP accounts were acquired to allow near real time upload and processing of the data.

DESERT COOLAIRE TECHNICAL ASSESSMENT
NEW BUILDINGS INSTITUTE, INC. Page 27 JULY 2007 FINAL REPORT
Figure 5-3 shows a screen shot of the MicroDataNet software interface. Reviewing data remotely in near real time allowed the research team to confirm expected operation and discover and investigate anomalies.
Figure 5-3 Screen Shot of MicroDataNet Interface during Lab Testing

DESERT COOLAIRE TECHNICAL ASSESSMENT
NEW BUILDINGS INSTITUTE, INC. Page 28 JULY 2007 FINAL REPORT
Summaries of the one-minute data were prepared in several formats. One-hour summaries in two-week blocks were prepared as well as daily files with plots. A set of summary files by mode were prepared as well. The modes were defined as: Off, Heating, Recirculation, Economizer, Indirect Evaporative Cooling Only, Indirect Evap + DX Cooling, DX Cooling Only, and X-Mode (undefined mode). These are stored on an FTP site. Figure 5-4 shows an example chart of a daily mode summary with average outside temperature.
Fred Meyer, Garden City, IDHours in Mode and Temp
0
10
20
30
40
50
60
70
6/1/20
06
6/8/20
06
6/15/2
006
6/22/2
006
6/29/2
006
7/6/20
06
7/13/2
006
7/20/2
006
7/27/2
006
8/3/20
06
8/10/2
006
8/17/2
006
8/24/2
006
8/31/2
006
9/7/20
06
9/14/2
006
9/21/2
006
9/28/2
006
10/5/
2006
10/12
/2006
10/19
/2006
10/26
/2006
11/2/
2006
11/9/
2006
11/16
/2006
11/23
/2006
11/30
/2006
12/7/
2006
12/14
/2006
12/21
/2006
Date
Hou
rs
0
10
20
30
40
50
60
70
80
90
100
Avg
Dai
ly T
emp
(F)
X-modeDX onlyEvap+DXEvapEconRecircHeatingOffOSAT
Figure 5-4 Mode Summary by Day with Daily Average Outdoor Temperature

DESERT COOLAIRE TECHNICAL ASSESSMENT
NEW BUILDINGS INSTITUTE, INC. Page 29 JULY 2007 FINAL REPORT
5.2 Monitoring Issues and Corrections Field commissioning of the data acquisition systems showed that some of the sensors were not installed correctly. During installation of the first three units in 2005, air tubing to pressure sensors was found to be installed incorrectly. Additionally, the watt transducers were often not wired correctly. Checking for proper operation in the factory was recommended before units were shipped in 2006, but again various issues were discovered during field commissioning.
Communications with the gateway computers was intermittent during 2005 into the spring of 2006. In many cases, the only way to restart communications were to cycle power to the gateway computer. Investigation pointed to a faulty modem interface. All gateway computers and modems except one were replaced in 2006, and communications reliability improved to over 99 percent.
Software issues also created a problem with dropped data packets. This issue was resolved in July 2006, and the five systems installed in 2006 did not experience dropped data packets. The problem was corrected for Site 14 (Vancouver) on August 11 and for Sites 13 and 15 (Portland and Boise) on September 21. The power data for Sites 13, 14, and 15 was corrected for data analysis starting July 1, 2006.
A key to avoiding most of the monitoring equipment issues is to have a thorough in-factory commissioning of each unit, including the water supply, controls and the data acquisition system. The data acquisition system can be used to detect operational problems in near real time, which would allow both the unit and the data acquisition system to be fully commissioned before leaving the factory.

DESERT COOLAIRE TECHNICAL ASSESSMENT
NEW BUILDINGS INSTITUTE, INC. Page 30 JULY 2007 FINAL REPORT
6 Analysis Approach
The monitoring undertaken in this project is intended to lead to simple mathematical formulations that describe the performance of the Desert Aire unit in each of its operating modes. In this analysis, these simple formulations are referred to as models even though they are all very simple linear functions that describe the efficiency or other performance of the subject mode only as a linear function of outside air dry bulb temperature. Obviously, a true engineering model would include many other physical parameters such as size, power, humidity, etc. However, experience monitoring HVAC equipment in general has shown that a simple statistical model of each mode as a simple function of temperature can be derived. These simple functions can then be used to compound annual performance estimates for the equipment from monthly temperature averages or bins. It is noteworthy that all the performance modes for the Desert Aire unit could be closely approximated by such simple linear functions of temperature.
The path toward these aggregate models begins with extensive amounts of highly detailed data. The native form of the monitoring data is as minute–by-minute data. Such data is very rich and can be used to examine performance events in detail in hourly or even daily time spans. But this highly detailed data includes the operation of all modes, and any long-term aggregation of this data is usually very noisy and imprecise. This type of data cannot be worked into coherent mathematical functions until it has been divided into separate sets of data pertaining to each operating mode. This section describes the methods by which the detailed data is separated by mode and aggregated into a much more manageable hourly interval. The section also describes the means by which the data is further worked into annual performance estimates.
6.1 Hourly Aggregation by Mode The first step in a performance characterization for this type of technology is to divide the operating data into the fundamental equipment operating modes. The modes used in this analysis are given in Table 6-1.
Table 6-1 Operating Modes
Mode Code
Heat 1
Economizer 2
Recirculation 3
Evaporative 4
Evaporative/compressor 5
Compressor only 6
Unidentified 7
Off 0
Each minute of the raw data is post-processed by testing key variables to identify the operating mode, and a mode code is appended to the data. All monitored variables are then aggregated from minute-by–minute to hourly averages for each mode.
Key operating variables of the minute data are aggregated to hourly average values for the parameter while it is operating in each mode. This is called mode-conditional averaging. The variables that are conditionally averaged by mode are shown in Table 6-2.

DESERT COOLAIRE TECHNICAL ASSESSMENT
NEW BUILDINGS INSTITUTE, INC. Page 31 JULY 2007 FINAL REPORT
Table 6-2 Conditional Variables
Mode Conditional Variable Name Units or Definition
Duty cycle Fraction of hour in mode
kWh Average kWh in mode
OSA damper position Average in mode, deg open
Purge damper position Average in mode, deg open
Control pressure Pressure during mode, inches WC
Inlet/purge dp Pressure during mode, inches WC
Evaporator coil dp Pressure during mode, inches WC
Inlet air temperature Average deg F in mode
Inlet absolute humidity Average lbs water/lb dry air in mode
Core exit temperature Average deg F in mode
Supply temperature Average deg F in mode
Supply absolute humidity Average lbs water/lb dry air in mode
Purge temperature Average deg F in mode
Water flow Average gallons/minute in mode
Purge absolute humidity Average lbs water/lb dry air in mode
6.1.1 Two-Week Analytical Data Blocks These conditional variables and the other hourly average variables are blocked into two-week analytical blocks of data where regression analysis can be used to find the data correlations that underlie the fundamental performance characteristics of the equipment at the hourly level. These hourly performance correlations are the basis for calculating the energy inputs, outputs, and water use and control settings for each hour for each of the eight operating modes.
The two-week data analysis block is a compromise interval. It is intended to be long enough to capture two full weekly occupancy cycles of operation with sufficient data to support regression analysis, and short enough to preserve the unique seasonal characteristics of the data.
Ideally, the two-week data blocks will step consecutively through the operating year. However, an initial review of the data showed that control pressure had a very significant influence on the performance, so the dates of some two-week blocks have been adjusted so that each has essentially the same control pressure.
An annual characterization of the equipment operation is supported first by calculating the average values for performance during the full two-week analytical data block. These two-week average values are then used, along with various temperature and control assumptions, to develop the broad seasonal correlations (models) that can be used to describe the annual performance of the equipment for cost effectiveness and other broad performance comparisons.
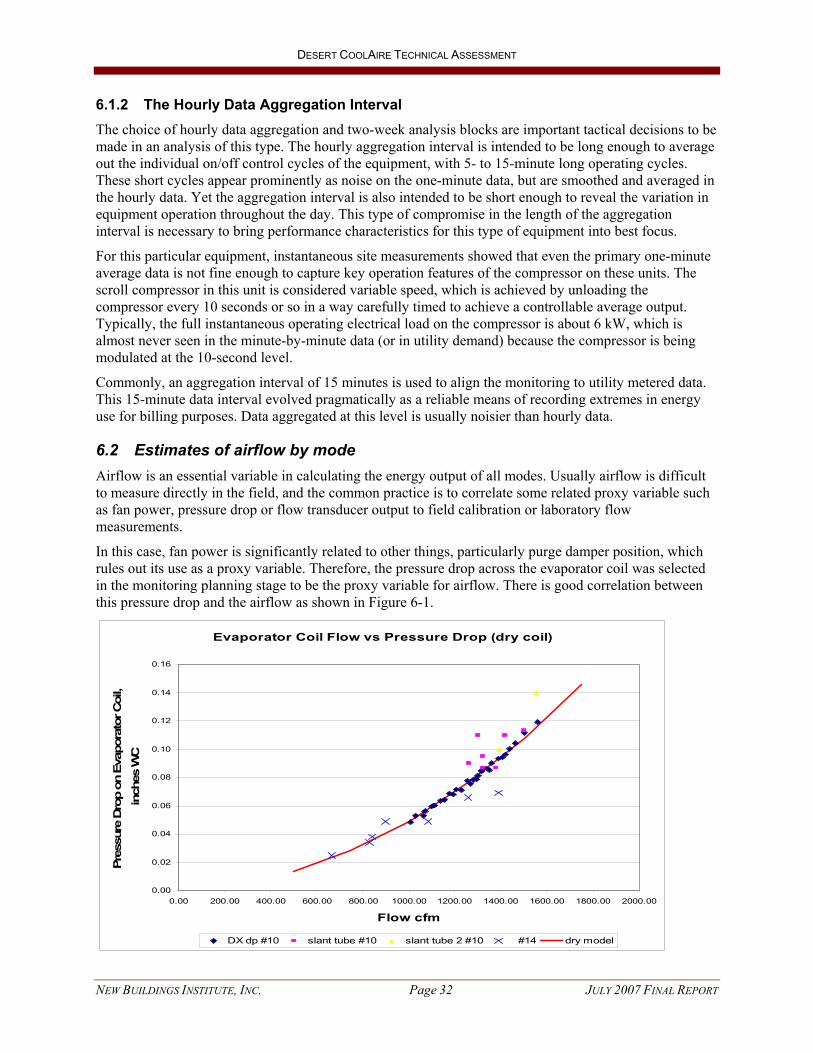
DESERT COOLAIRE TECHNICAL ASSESSMENT
NEW BUILDINGS INSTITUTE, INC. Page 32 JULY 2007 FINAL REPORT
6.1.2 The Hourly Data Aggregation Interval The choice of hourly data aggregation and two-week analysis blocks are important tactical decisions to be made in an analysis of this type. The hourly aggregation interval is intended to be long enough to average out the individual on/off control cycles of the equipment, with 5- to 15-minute long operating cycles. These short cycles appear prominently as noise on the one-minute data, but are smoothed and averaged in the hourly data. Yet the aggregation interval is also intended to be short enough to reveal the variation in equipment operation throughout the day. This type of compromise in the length of the aggregation interval is necessary to bring performance characteristics for this type of equipment into best focus.
For this particular equipment, instantaneous site measurements showed that even the primary one-minute average data is not fine enough to capture key operation features of the compressor on these units. The scroll compressor in this unit is considered variable speed, which is achieved by unloading the compressor every 10 seconds or so in a way carefully timed to achieve a controllable average output. Typically, the full instantaneous operating electrical load on the compressor is about 6 kW, which is almost never seen in the minute-by-minute data (or in utility demand) because the compressor is being modulated at the 10-second level.
Commonly, an aggregation interval of 15 minutes is used to align the monitoring to utility metered data. This 15-minute data interval evolved pragmatically as a reliable means of recording extremes in energy use for billing purposes. Data aggregated at this level is usually noisier than hourly data.
6.2 Estimates of airflow by mode Airflow is an essential variable in calculating the energy output of all modes. Usually airflow is difficult to measure directly in the field, and the common practice is to correlate some related proxy variable such as fan power, pressure drop or flow transducer output to field calibration or laboratory flow measurements.
In this case, fan power is significantly related to other things, particularly purge damper position, which rules out its use as a proxy variable. Therefore, the pressure drop across the evaporator coil was selected in the monitoring planning stage to be the proxy variable for airflow. There is good correlation between this pressure drop and the airflow as shown in Figure 6-1.
Evaporator Coil Flow vs Pressure Drop (dry coil)
0.00
0.02
0.04
0.06
0.08
0.10
0.12
0.14
0.16
0.00 200.00 400.00 600.00 800.00 1000.00 1200.00 1400.00 1600.00 1800.00 2000.00
Flow cfm
Pres
sure
Dro
p on
Eva
pora
tor C
oil,
inch
es W
C
DX dp #10 slant tube #10 slant tube 2 #10 #14 dry model
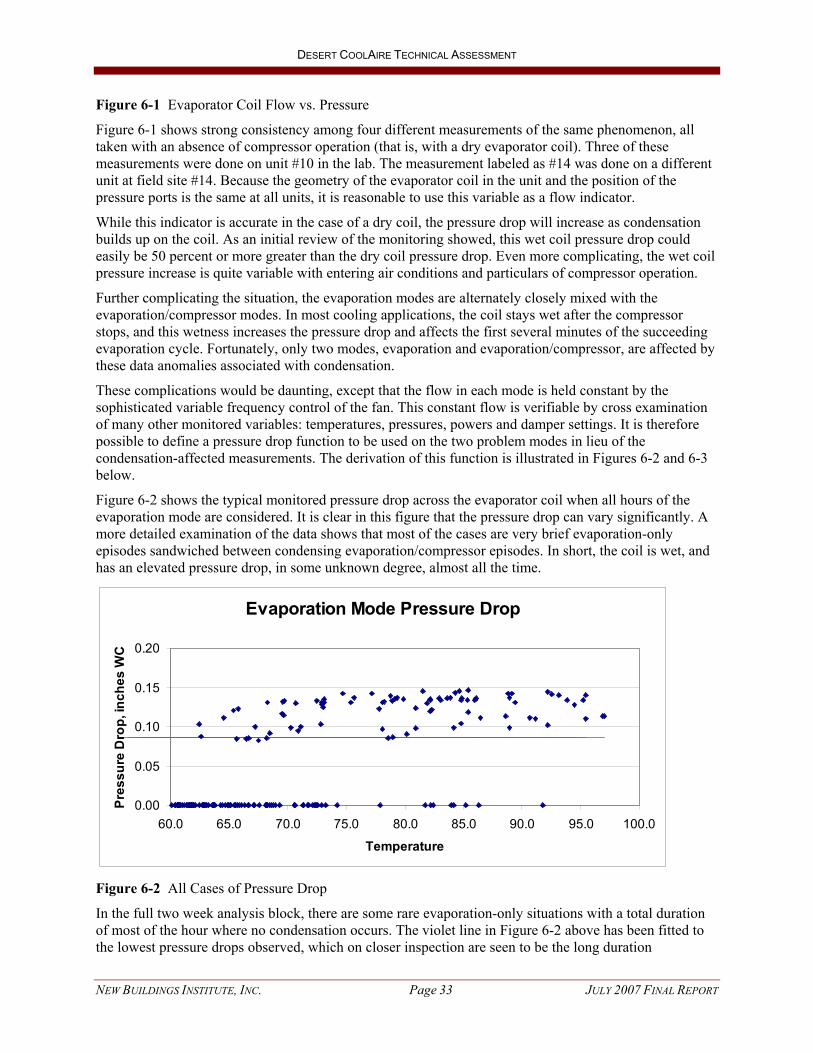
DESERT COOLAIRE TECHNICAL ASSESSMENT
NEW BUILDINGS INSTITUTE, INC. Page 33 JULY 2007 FINAL REPORT
Figure 6-1 Evaporator Coil Flow vs. Pressure
Figure 6-1 shows strong consistency among four different measurements of the same phenomenon, all taken with an absence of compressor operation (that is, with a dry evaporator coil). Three of these measurements were done on unit #10 in the lab. The measurement labeled as #14 was done on a different unit at field site #14. Because the geometry of the evaporator coil in the unit and the position of the pressure ports is the same at all units, it is reasonable to use this variable as a flow indicator.
While this indicator is accurate in the case of a dry coil, the pressure drop will increase as condensation builds up on the coil. As an initial review of the monitoring showed, this wet coil pressure drop could easily be 50 percent or more greater than the dry coil pressure drop. Even more complicating, the wet coil pressure increase is quite variable with entering air conditions and particulars of compressor operation.
Further complicating the situation, the evaporation modes are alternately closely mixed with the evaporation/compressor modes. In most cooling applications, the coil stays wet after the compressor stops, and this wetness increases the pressure drop and affects the first several minutes of the succeeding evaporation cycle. Fortunately, only two modes, evaporation and evaporation/compressor, are affected by these data anomalies associated with condensation.
These complications would be daunting, except that the flow in each mode is held constant by the sophisticated variable frequency control of the fan. This constant flow is verifiable by cross examination of many other monitored variables: temperatures, pressures, powers and damper settings. It is therefore possible to define a pressure drop function to be used on the two problem modes in lieu of the condensation-affected measurements. The derivation of this function is illustrated in Figures 6-2 and 6-3 below.
Figure 6-2 shows the typical monitored pressure drop across the evaporator coil when all hours of the evaporation mode are considered. It is clear in this figure that the pressure drop can vary significantly. A more detailed examination of the data shows that most of the cases are very brief evaporation-only episodes sandwiched between condensing evaporation/compressor episodes. In short, the coil is wet, and has an elevated pressure drop, in some unknown degree, almost all the time.
Evaporation Mode Pressure Drop
0.00
0.05
0.10
0.15
0.20
60.0 65.0 70.0 75.0 80.0 85.0 90.0 95.0 100.0
Temperature
Pres
sure
Dro
p, in
ches
WC
Figure 6-2 All Cases of Pressure Drop
In the full two week analysis block, there are some rare evaporation-only situations with a total duration of most of the hour where no condensation occurs. The violet line in Figure 6-2 above has been fitted to the lowest pressure drops observed, which on closer inspection are seen to be the long duration

DESERT COOLAIRE TECHNICAL ASSESSMENT
NEW BUILDINGS INSTITUTE, INC. Page 34 JULY 2007 FINAL REPORT
evaporation only situations. As a check, when the full set of evaporation events is filtered to leave only the long duration evaporation events, the picture becomes the one shown in Figure 6-3 below. The long-duration events shown in Figure 6-3 are the dry-coil events because they are long enough to evaporate the water from the coil in the earliest part of the event.
Evaporation Mode Pressure Drop
0.00
0.05
0.10
0.15
0.20
60.0 65.0 70.0 75.0 80.0 85.0 90.0 95.0 100.0
Temperature
Pres
sure
Dro
p, in
ches
WC
Figure 6-3 Long Duration Cases of Pressure Drop
Note that in Figure 6-3 above the long-duration cases are the lowest-pressure-drop cases, as expected from a dry coil. This figure also shows the violet line fitted to the lowest pressure points. This violet line is the function of outside air temperature that is used to describe the dry coil pressure drop for both the evaporation mode and the evaporation/compressor mode. Note in Figures 6-2 and 6-3 that the pressure drop across the evaporator coil is almost independent of the outside air temperature. At each site, this pressure function is separately fitted to each two-week block of data. These functions are found to depend primarily on the control pressure for the unit, which was changed from time to time during the 2006 cooling season as the control program was modified.
In all modes, once the dry coil pressure drop function of temperature is known, the flow rate is then calculated for all sites using the empirically derived equation (1).
1. Eq (1) Flow, cfm = [(pressure, in WC-.002)/.000000047]^.5
This equation was derived from the laboratory measurements and is and is the “dry model” illustrated in figure 6-1 (Evap Coil Flow vs. Pressure). It is unique to this particular equipment. It can, however, be used to determine the flow at all sites because the unit geometry and pressure measurement transducer position is identical from site to site.
6.3 Electrical Energy Use Measurements by Mode When the initial hourly-by-mode energy use was reviewed, there were many cases where the energy measurements appeared to be too low. These low energy measurements were predominantly in the evaporation-only mode, and to a lesser extent in the evaporation/compressor mode. Ultimately the data were restored by a manual process, but this discussion briefly documents the situation. Figure 6-4 illustrates this situation.
In Figure 6-4 there appear to be many cases where the fan power is 500 watts or less. Such low fan power has never been observed, and when other variables such as pressures and temperatures are reviewed, there is no evidence that the fan power was reduced. None of the other operational modes showed similar

DESERT COOLAIRE TECHNICAL ASSESSMENT
NEW BUILDINGS INSTITUTE, INC. Page 35 JULY 2007 FINAL REPORT
power drops. These erratic measurements were traced to faulty packet logic in the communication gateways at the earliest sites, 13, 14 and 15. This logic was restored on sites 13 and 15 by September 21, 2006. The logic was restored earlier at site 14 when the gateway was replaced.
Evaporation Mode Power
0.00
0.50
1.00
1.50
2.00
2.50
60.0 65.0 70.0 75.0 80.0 85.0 90.0 95.0 100.0
Temperature
Pow
er k
W
Figure 6-4 Typical Evaporation Mode Power
Note that power drops can affect both the apparent power for a mode and the apparent duration of a mode. The duration of the mode will be reduced along with the average power. Reviewing the data shows a high incidence of the off mode whenever the data drops are occurring. It was clear in this review that all modes were affected in differing degrees by the power drops.
Particularly troubling was the fact that the faulty power measurements affected most of the summer 2006 cooling intervals at the higher outdoor air temperatures. However here, the operational fact that the fan was run at constant speed provides an avenue to reconstruct the faulty data by a tedious manual process.
6.4 Reconstruction of Energy Use Data and Data Blocks of Record To reconstruct a reasonably accurate record of energy used, the mode duration (duty cycle) will need to be reconstructed as well as the power for the identified cases of power drops. In this analysis, the minute-by-minute data starting July 1 to September 21 for sites 13, 14 and 15 were manually reviewed to reconstruct the power data and the mode data. This reprocessed data, organized into consecutive two-week data blocks, is then used to develop the actual record of energy use and cooling delivered. These are referred to as the “data blocks of record.”
Note that these data blocks of record create a continuous operational record. In many cases, the data blocks of record will have different date spans than the analytical data blocks which have been organized around control events.
6.4.1 Final Assembly into Seasonal or Annual Data Summary The two-week data blocks are input into an analysis template that creates two-week averages or summaries for all key descriptive variables and calculated variables (EER, water use, time in mode, etc). These two-week summaries of key data are then copied into an annual summary template where the two-week summary data are collected into seasonal or annual arrays. They are then tabulated and graphed to give annual or seasonal views of performance.
DESERT COOLAIRE TECHNICAL ASSESSMENT
NEW BUILDINGS INSTITUTE, INC. Page 36 JULY 2007 FINAL REPORT
DESERT COOLAIRE TECHNICAL ASSESSMENT
NEW BUILDINGS INSTITUTE, INC. Page 37 JULY 2007 FINAL REPORT
7 Field Performance Findings
The technical objective of the research is to characterize field performance of the Desert CoolAire prototype. This section presents the performance in four key areas: 1) HMX Core and System Performance, 2) Compressor Performance, 3) Fan Performance and 4) Water.
Comparative performance with standard package HVAC units is presented in Section 8. The findings during field assessment lead to consideration of design and control modifications for next-generation units. A brief discussion of relevant improvements is included at the end of each topic here and Section 9, “Next Generation Design”, provides the current design team thinking on changes to optimize efficiency.
7.1 HMX Core and System Performance The prototype units demonstrated the capability to serve as a full replacement for a typical five-ton commercial rooftop unit. The units sequenced the full range of operating modes: cooling, heating, economizer and recirculation and provided adequate cooling and comfort to the area served. A principal design objective for this unit was to, for the first time ever, package together a backup DX cooling compressor and gas heating with indirect evaporative cooling and this combination of elements did fully meet cooling and heating loads.
7.1.1 HMX Core Contribution The energy savings attributable to this unit are due to cooling the inlet air as it passes through the evaporative element “core,” referred to commercially as the Delphi HMX (heat and mass exchanger). The air is cooled as shown in Figure 7-1.
Figure 7-1 is illustrative of a typical example of the fundamental operating effect of these units. As the outdoor temperature, noted here as IN db, rises to 90°F+, the output temperature, EXIT db, is reduced to a constant value of about 70°F. In practice, and for all the tested units, it mattered little what the inlet temperature was. The outlet temperature was always almost constant and in the range of 65°F-72°F. The higher the outdoor (IN db) temperature, the greater is the drop across the core. In Figure 7-1 below (Boise at 92°F), we see ~ 22°F of cooling from the core, and in Figure 7-2 further below (Sacramento at 100°F) the exit db is 32°F less than IN db.
Most importantly, notice in Figure 7-1 that the inlet wet bulb temperature, IN wb, is also lowered by the operation of the HMX core. This figure shows the inlet wet bulb temperature dropping from about 59°F to 53°F. Physically, whenever air is cooled without adding or removing water, the wet bulb temperature is reduced. From a human physiological stand point the wet bulb temperature is an important indicator. It is a good indicator of comfort with respect to humidity, and accordingly, the 68°F wet bulb temperature is taken as the upper limit of the ASHRAE comfort zone. In terms of comfort, even a reduction in the wet bulb temperature of only a few degrees F is very important.

DESERT COOLAIRE TECHNICAL ASSESSMENT
NEW BUILDINGS INSTITUTE, INC. Page 38 JULY 2007 FINAL REPORT
Figure 7-1 Typical Air Temperatures for the HMX core in the Evaporative Cooler – Boise Idaho Site
This reduction in the inlet wet bulb temperature is the principal distinction between direct and indirect evaporative cooling systems: Indirect evaporative cooling can lower the wet bulb temperature; direct evaporative cooling cannot. It is this reduction in wet bulb temperature that allows the indirect evaporative cooler to provide comfort in most of the western US, while direct evaporative cooling falls just short during muggy periods. In this way, the core proved to be a very reliable means of “skimming off” the high inlet air temperatures and responding to high daytime temperatures with only a constant fan energy use.
In Figure 7-2, the HMX reduced the entering air 32°F from 100°F to ~ 68°F. The indoor set points were aggressively controlled to deliver 50°F to the space so the compressor provided an additional 18°F. It is important to note that not only would a typical rooftop unit need to meet the full 45-50 degrees of cooling, but, due to the high outdoor temperature, it would be performing at ~ 20% reduced efficiency during the peak temperature period.
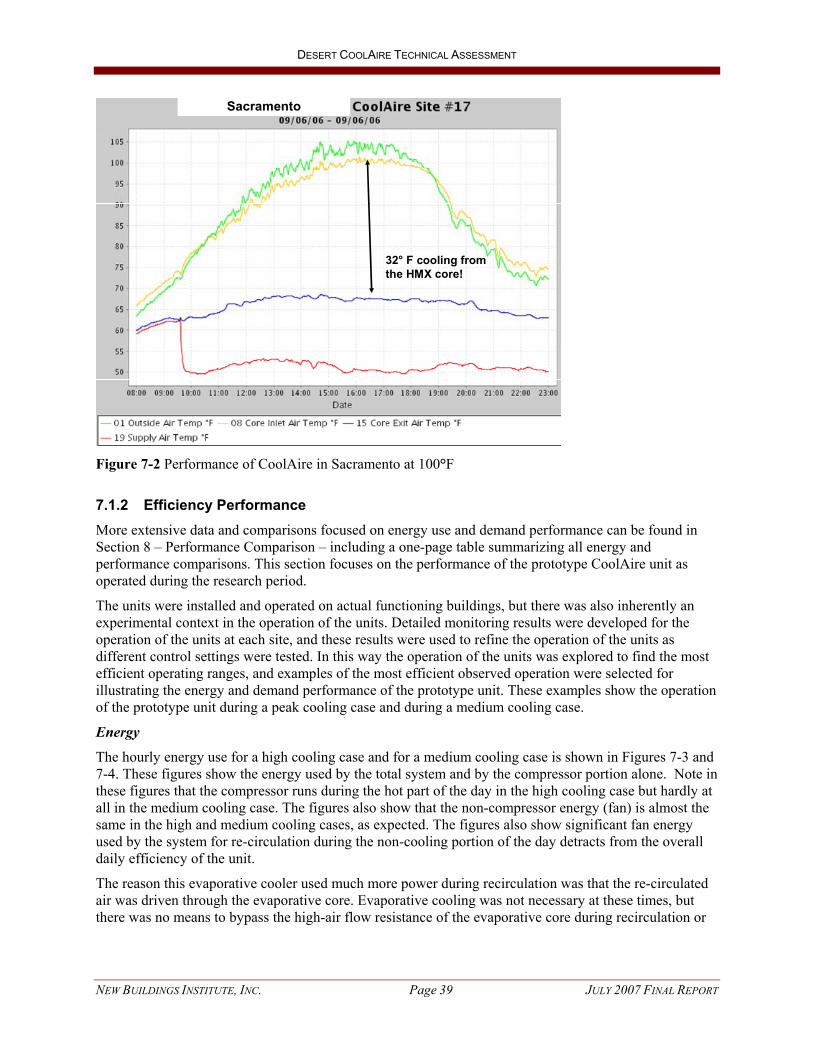
DESERT COOLAIRE TECHNICAL ASSESSMENT
NEW BUILDINGS INSTITUTE, INC. Page 39 JULY 2007 FINAL REPORT
Sacramento
32° F cooling from the HMX core!
Sacramento
32° F cooling from the HMX core!
Figure 7-2 Performance of CoolAire in Sacramento at 100°F
7.1.2 Efficiency Performance More extensive data and comparisons focused on energy use and demand performance can be found in Section 8 – Performance Comparison – including a one-page table summarizing all energy and performance comparisons. This section focuses on the performance of the prototype CoolAire unit as operated during the research period.
The units were installed and operated on actual functioning buildings, but there was also inherently an experimental context in the operation of the units. Detailed monitoring results were developed for the operation of the units at each site, and these results were used to refine the operation of the units as different control settings were tested. In this way the operation of the units was explored to find the most efficient operating ranges, and examples of the most efficient observed operation were selected for illustrating the energy and demand performance of the prototype unit. These examples show the operation of the prototype unit during a peak cooling case and during a medium cooling case.
Energy
The hourly energy use for a high cooling case and for a medium cooling case is shown in Figures 7-3 and 7-4. These figures show the energy used by the total system and by the compressor portion alone. Note in these figures that the compressor runs during the hot part of the day in the high cooling case but hardly at all in the medium cooling case. The figures also show that the non-compressor energy (fan) is almost the same in the high and medium cooling cases, as expected. The figures also show significant fan energy used by the system for re-circulation during the non-cooling portion of the day detracts from the overall daily efficiency of the unit.
The reason this evaporative cooler used much more power during recirculation was that the re-circulated air was driven through the evaporative core. Evaporative cooling was not necessary at these times, but there was no means to bypass the high-air flow resistance of the evaporative core during recirculation or

DESERT COOLAIRE TECHNICAL ASSESSMENT
NEW BUILDINGS INSTITUTE, INC. Page 40 JULY 2007 FINAL REPORT
heating. Such a bypass would improve the energy efficiency of the evaporative cooler significantly above what is shown in Figures 7-3 and 7-4 which show only the actual as-operated prototype performance.
Note in the figures the prototype compressor power. This is the actual compressor power observed even though the compressor was subsequently found to be operating very inefficiently. The compressor portion of the system performed at a very low efficiency, as is discussed in section 7.4 below, Therefore, during peak cooling times the compressor used more than 60% the energy but contributed on the order of only 30% of the cooling. In practice, the compressor use significantly lowered the overall operating efficiency of the prototype unit. If the compressor were operated efficiently then both the energy and demand would be less than specified here.
Hourly Energy Performance high cooling case, 7/27/06, Tmax 103 F, Tmin 67 F
0.000.501.001.502.002.503.003.50
7:00
8:00
9:00
10:0
0
11:0
0
12:0
0
13:0
0
14:0
0
15:0
0
16:0
0
17:0
0
18:0
0
19:0
0
20:0
0
21:0
0
22:0
0
23:0
0
0:00
1:00
2:00
3:00
4:00
5:00
6:00
Time of day
Hou
rly
Ener
gy,
kWh
Prototype Total kWh Prototype Compressor kWh
Figure 7-3 Hourly Energy Performance – Prototype at High Cooling
Hourly Energy Performance medium cooling case, 7/30/06, Tmax 84F, Tmin 62F
0.00
0.50
1.00
1.50
2.00
2.50
3.00
3.50
4:00
5:00
6:00
7:00
8:00
9:00
10:0
0
11:0
0
12:0
0
13:0
0
14:0
0
15:0
0
16:0
0
17:0
0
18:0
0
19:0
0
20:0
0
21:0
0
22:0
0
23:0
0
0:00
1:00
2:00
3:00
Time of day
Hou
rly
Ener
gy,
kWh
Prototype Total kWh Prototype Compressor kWh
Figure 7-4 Hourly Energy Performance – Prototype at Medium Cooling

DESERT COOLAIRE TECHNICAL ASSESSMENT
NEW BUILDINGS INSTITUTE, INC. Page 41 JULY 2007 FINAL REPORT
Demand
Perhaps the most important advantage of evaporative cooling lies in its potential to reduce cooling demand. Demand reduction is best quantified with reference to the demand of a reference alternative unit. This type of comparison is done in Section 8. In this section the actual demand observed for the prototype units during the high and medium cooling cases is presented in Figure 7-5.
Hourly Demand Performance high cooling case, 7/27/06, and medium case 7/30/06
0.000.501.001.502.002.503.003.504.004.50
4:00
5:00
6:00
7:00
8:00
9:00
10:0
0
11:0
0
12:0
0
13:0
0
14:0
0
15:0
0
16:0
0
17:0
0
18:0
0
19:0
0
20:0
0
21:0
0
22:0
0
23:0
0
0:00
1:00
2:00
3:00
Time of day
Hou
rly D
eman
d, k
W
Medium Cooling Case High Cooling Case
Figure 7-5 Hourly Demand Performance – Prototype at High and Medium Cooling
The demand shown in Figure 7-5 is actual demand derived by monitoring the total unit power during evaporation/compressor events and it is noteworthy that the demand during the high cooling case is about 1 kW higher than the demand for the medium cooling case. This is because the prototype compressor subsystem was less efficient in the high cooling case. In both cases the demand is 2-3 kW less than the demand that would have been observed in a comparable unit (see Section 8) but still the observed demand is higher than might be observed in an optimized version of the prototype unit.
Demand observations on the prototype unit are complicated by the fact that, in the case of the CoolAire unit, compressor control is unusual because the compressor subsystem was designed to use an almost full sized 4-ton rated variable output scroll compressor. In practice, the output of the compressor is limited by toggling an un-loader mechanism on and off very quickly (10 second cycling) resulting in an average power (as evident to the demand meter) that is lower than the full 4 ton compressor power. The output of this unit is de-rated in the control software to mimic the output of a smaller compressor, and thereby spreads the cooling over longer intervals at lower power. The average compressor power observed in the prototype unit can reasonably be taken as an upper value estimate of the power that would have been observed on a downsized, but not variable speed compressor. In fact, the demand observed in the prototype unit is considered an upper value estimate because the full four ton compressor friction will apply to the de-rated output. While it is reasonable to regard the compressor power as too high, in Fig 7-5 the power is reported without correction.
While the emphasis for this project is directed at efficient cooling, the monitoring showed that the duration of the other modes, particularly recirculation and heating, far exceeded the duration of the cooling modes. A broad view of the operational modes shows that reducing the overall energy use of the unit will require a balanced view of all modes.

DESERT COOLAIRE TECHNICAL ASSESSMENT
NEW BUILDINGS INSTITUTE, INC. Page 42 JULY 2007 FINAL REPORT
This was the first time gas heating was co-packaged with evaporative cooling, and the heating was very successfully sequenced into the operation. The thermal output of the gas heaters was nominally 100,000 BTU/hr, and this was often too much for the supply air stream and resulted in very high discharge (140°+ F) temperatures. At one unit, the heater output was limited to 50,000 BTU/hr, which proved appropriate for the lower airflow and discharge temperatures were moderate (about 120 deg F) and quite adequate to the heat load.
Energy Efficiency Ratio (EER)
A simulation was performed on a next-generation design objective unit here called Gen2. The parameters for the Gen2 were derived from the summer 2006 monitoring experience and are considered achievable improvements to the observed performance. The Gen2 unit is based on an assumed 15 percent reduction in fan power and an assumed 50 percent reduction in compressor energy through improved controls and compressor subsystem efficiency. This hypothetical next generation unit was simulated to match the same load and conditions as the as-operated prototype unit during the high and medium cooling cases.
The simulation results are presented in a performance comparison view in terms of the hourly EER achieved by the prototype and the Gen2 unit in Figures 7-6 and 7-7 and the potential for a greatly improved hourly EER through the redesign is clear.
Hourly EER - high cooling case 7/27/06, Tmax 103F ,Tmin 67F
0.00
5.00
10.00
15.00
20.00
25.00
30.00
7:00
8:00
9:00
10:00
11:00
12:00
13:00
14:00
15:00
16:00
17:00
18:00
19:00
20:00
21:00
22:00
23:00 0:0
01:0
02:0
03:0
04:0
05:0
06:0
0
Time of Day
Hou
rly E
ER
Prototype as Operated Gen2
Figure 7-6 Hourly EER Comparisons – High Cooling Case

DESERT COOLAIRE TECHNICAL ASSESSMENT
NEW BUILDINGS INSTITUTE, INC. Page 43 JULY 2007 FINAL REPORT
Hourly EER - medium cooling case, 7/30/06, Tmax 84F, Tmin 62F
0.00
5.00
10.00
15.00
20.00
25.00
4:00
5:00
6:00
7:00
8:00
9:00
10:00
11:00
12:00
13:00
14:00
15:00
16:00
17:00
18:00
19:00
20:00
21:00
22:00
23:00 0:0
01:0
02:0
03:0
0
Time of Day
Hou
rly E
ER
Prototype as Operated Gen2
Figure 7-7 Hourly EER Comparisons – Medium Cooling Case
7.2 Compressor Performance A primary design intention in this unit was to include a compressor in an indirect evaporative cooler as a cooling supplement for high internal gain situations and also as a backup for the infrequent times that the outdoor air was too muggy even for an indirect evaporative cooler of this type. Another reason for packaging a compressor in this unit is the sense that the market would find this a more credible and appealing package.
Scroll Operations & Condenser Location
This is the first time a compressor has been used as an adjunct to evaporative cooling in a package rooftop unit and it was apparent in the design stage that the choice, sizing, and control of the compressor would contribute significantly to the ultimate energy efficiency and demand of the unit. A 4 ton “variable speed” scroll compressor was chosen for this purpose. But the research uncovered a common misunderstanding regarding variable speed scroll compressors: the output of these compressors can be precisely reduced from full output through the use of an un-loader mechanism, but the input electric energy is not proportionally reduced. Therefore, when the compressor is operating at less than its full load, it will be operating at a significantly reduced efficiency.
The field test data showed that the compressor often cycled extensively because the actual need for the compressor boost was quite marginal and could be satisfied with very short 2-4 minute run cycles. Such short cycling is inherently inefficient. The operation of the compressor in conjunction with the evaporative cooling as intended was a challenging control problem because typically the need for compressor operation was so marginal that it could not be met with the longer more efficient compressor operating cycles. Such experience argues for a smaller compressor.
The most significant effect on compressor efficiency lies with the location of the condenser. In the current design, the compressor loop discharges waste heat to a condenser located in the purge air stream, which is at a lower temperature than the outside air. In concept, this should result in increased compressor efficiency if the condenser is located in a sufficiently strong and relatively cool air stream such as the purge or exhaust air flow. An industry rule of thumb for condenser airflow is that the flow should be
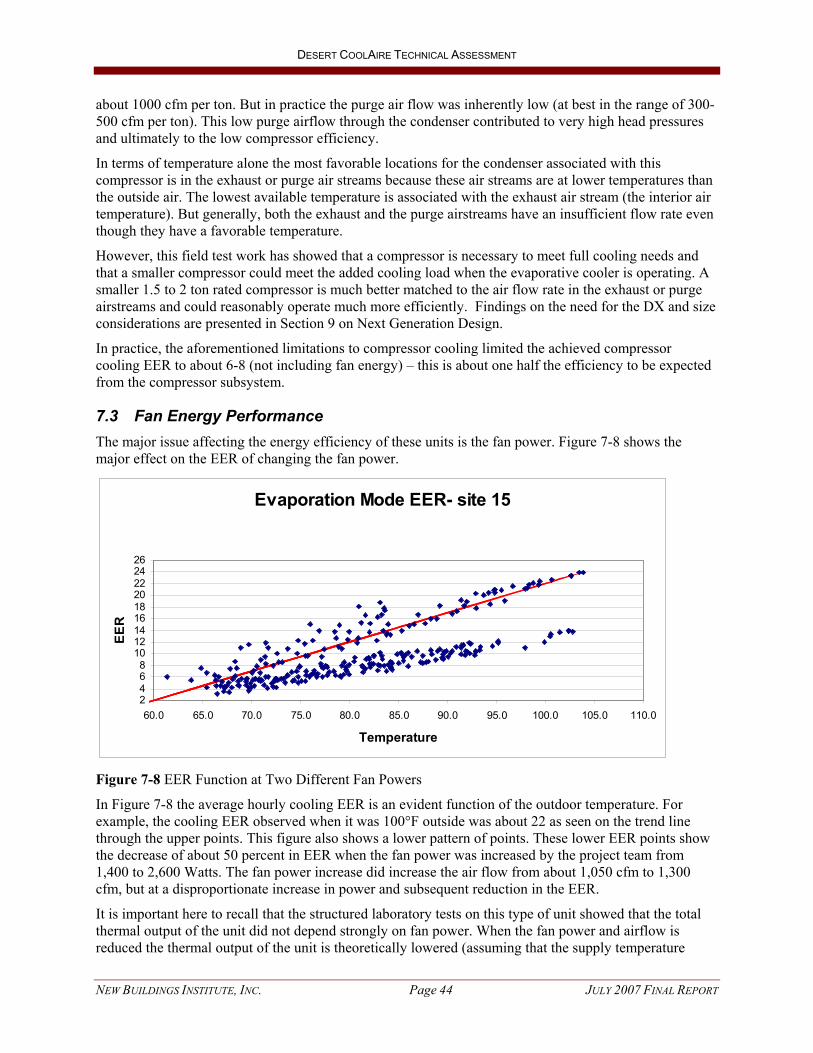
DESERT COOLAIRE TECHNICAL ASSESSMENT
NEW BUILDINGS INSTITUTE, INC. Page 44 JULY 2007 FINAL REPORT
about 1000 cfm per ton. But in practice the purge air flow was inherently low (at best in the range of 300-500 cfm per ton). This low purge airflow through the condenser contributed to very high head pressures and ultimately to the low compressor efficiency.
In terms of temperature alone the most favorable locations for the condenser associated with this compressor is in the exhaust or purge air streams because these air streams are at lower temperatures than the outside air. The lowest available temperature is associated with the exhaust air stream (the interior air temperature). But generally, both the exhaust and the purge airstreams have an insufficient flow rate even though they have a favorable temperature.
However, this field test work has showed that a compressor is necessary to meet full cooling needs and that a smaller compressor could meet the added cooling load when the evaporative cooler is operating. A smaller 1.5 to 2 ton rated compressor is much better matched to the air flow rate in the exhaust or purge airstreams and could reasonably operate much more efficiently. Findings on the need for the DX and size considerations are presented in Section 9 on Next Generation Design.
In practice, the aforementioned limitations to compressor cooling limited the achieved compressor cooling EER to about 6-8 (not including fan energy) – this is about one half the efficiency to be expected from the compressor subsystem.
7.3 Fan Energy Performance The major issue affecting the energy efficiency of these units is the fan power. Figure 7-8 shows the major effect on the EER of changing the fan power.
Evaporation Mode EER- site 15
2468
101214161820222426
60.0 65.0 70.0 75.0 80.0 85.0 90.0 95.0 100.0 105.0 110.0
Temperature
EER
Figure 7-8 EER Function at Two Different Fan Powers
In Figure 7-8 the average hourly cooling EER is an evident function of the outdoor temperature. For example, the cooling EER observed when it was 100°F outside was about 22 as seen on the trend line through the upper points. This figure also shows a lower pattern of points. These lower EER points show the decrease of about 50 percent in EER when the fan power was increased by the project team from 1,400 to 2,600 Watts. The fan power increase did increase the air flow from about 1,050 cfm to 1,300 cfm, but at a disproportionate increase in power and subsequent reduction in the EER.
It is important here to recall that the structured laboratory tests on this type of unit showed that the total thermal output of the unit did not depend strongly on fan power. When the fan power and airflow is reduced the thermal output of the unit is theoretically lowered (assuming that the supply temperature

DESERT COOLAIRE TECHNICAL ASSESSMENT
NEW BUILDINGS INSTITUTE, INC. Page 45 JULY 2007 FINAL REPORT
remains the same). But the operating nature of the HMX core will also lower the supply temperature when the airflow is decreased and this lowered supply temperature increases the cooling output almost enough to compensate for the lowered airflow.
The fan power in all air distribution systems shows a very strong relationship to the air flow rate. Figure 7-9 shows a typical fan power vs. flow rate function for these sites. This figure shows a flow vs. power curve as derived from the monitored data. In principal, the flow rate characteristics are unique to each site because of variations in the distribution ductwork. This curve shows clearly the fan power increasing as the cube of the flow, as theoretically expected.
Fan kW vs Flow - Site 15
0.0
0.5
1.0
1.5
2.0
2.5
3.0
3.5
4.0
4.5
0 200 400 600 800 1000 1200 1400 1600
Flow cfm
Fan
Pow
er, k
W
Figure 7-9 Fan Power vs. Air flow
Figure 7-10 below shows that the significant increases in fan power can have a very strong effect on the EER.
Fan Energy - moderate cooling
0
10
20
30
40
50
400 600 800 1000 1200 1400 1600
Flow cfm
kBTU
/hr,
EER
kBTU/hrEER
Figure 7-10 EER vs. Airflow
Figure 7-10 also shows the cooling output (kBTU/hr) increases at best linearly as the airflow increases, and it shows the corresponding EER decrease as the airflow, and thus fan power, increases. Figure 7-10 is

DESERT COOLAIRE TECHNICAL ASSESSMENT
NEW BUILDINGS INSTITUTE, INC. Page 46 JULY 2007 FINAL REPORT
based on a moderate cooling example, so EER represented here can be taken as approximately the EER to be found in average cooling operations.
For a unit of this type to be competitive and enticing from an energy efficiency point of view it will be necessary to show an average cooling EER of about 20. This will call for a reduction in fan power or flow of the order of 30%. This reduction can be achieved by a combination of design options including a more efficient fan and airflow design and the use of bypass dampers.
A second and subtler effect of higher fan speeds has also been observed. When the fan speed is increased, the airflow through the core increases and the efficiency of the evaporative core decreases as shown in Figure 7-10 above.
In Figure 7-11 below the points labeled Wet Bulb Efficiency (WBE) 1.2 in WC correspond to fan power of about 2,600 Watts, and the points labeled WBE .6 in WC correspond to a fan power of about 1,400 Watts. In practice, this decrease in core efficiency of about 10% would increase the core outlet temperature by about 3°F-5°F.
Figure 7-11 Evaporative Core Efficiency at Two Control Pressures
It is this effect that underlies the laboratory observation that the thermal output is almost independent of airflow rate. With regard to high efficiency operation, there appears to be a natural optimum flow rate based on the nature of the HMX core, and this flow rate is toward the lower end of the flow rates observed during the field tests. Metaphorically, getting the best energy performance from these units is more like playing a flute than a tuba.
A third effect contributing to high average fan power lies in the use of the fan during the non-cooling modes such as recirculation and heating. These modes do not require the use of the core, yet in the current units there is no bypass of the core for these non-cooling modes. A core bypass in these modes could lower the fan energy at these times by about 50 percent +, which can lead to significant energy savings because the combined daily duration of these non-cooling modes is usually more than 12 hours/day.
In general, the overall effect of raising the fan power on energy efficiency is negative and it brings into focus the need for very careful airflow design in a successful follow on model.

DESERT COOLAIRE TECHNICAL ASSESSMENT
NEW BUILDINGS INSTITUTE, INC. Page 47 JULY 2007 FINAL REPORT
7.4 Water The operational experience in the first cooling season showed that evaporative cooling performance of the core was approximately in line with design intention. But the use of water in a rooftop unit is an unusual circumstance, and there were several significant problems. Fortunately, the experience in the first cooling season was monitored and followed closely enough and urgently enough to develop timely technical solutions. The water areas covered in this section address four topics: amount of water use, leaks, biological issues, and scaling.
7.4.1 Water Use The as-operated water distribution for these units was flawed. These units employ a “once through” water distribution strategy that uses the wicking properties of the evaporative media to distribute the water over the media. This differs from most other evaporative coolers which use a more conventional strategy involving a sump and a re-circulation pump to distribute the water over the evaporative media. The disadvantage of the conventional strategy is that it requires some ongoing maintenance for cleaning the sump and some special controls for purging the sump in order not to concentrate dissolved solids. By contrast, the once through strategy employed in the test units avoids the sump maintenance, but it requires careful control of the amount of water distributed.
In practice, the observed water use, on average, was typically about eight times as much as was theoretically needed. This was relatively a very high water use of the order of a few hundred gallons per day. This high water use is unsuitable from a policy viewpoint because the intended application of these units is generally the dry regions where summer water use often strains the supply and is sometimes rationed.
Monitoring showed that during the brief very hot periods, the water was supplied at about the correct rate. But the water continued to be supplied at this rate during other times of much greater duration even when there was little need for cooling. Water use was compared to the theoretical amount necessary for evaporative cooling and to the California Energy Commission’s upper limit of 9 gallons per hour (gph) per ton used in reviewing evaporative-cooled condensers for code compliance. Observed water during the field tests use ranged from 5.0 gph/ton to as much as 26 gph/ton as shown in Figure 7-12 below. However, during high cooling situations water use was about 75 percent of the reference limit.
Typical Water Use
In the early part of the summer 2006 cooling season, the water flow sensors were not reading properly, and also the control of the water sub-system was not well understood. Early summer water flows were plagued by undersized or clogged water filters, and unexpected compressor interactions with the water control. Accordingly, water flows during this period were quite variable. But by August, the water flow was more orderly. Figure 7-12 shows typical water flow data from a two week period in late August.

DESERT COOLAIRE TECHNICAL ASSESSMENT
NEW BUILDINGS INSTITUTE, INC. Page 48 JULY 2007 FINAL REPORT
Water Use Model - site 13
0.00
5.00
10.00
15.00
20.00
25.00
30.00
70.0 71.0 72.0 73.0 74.0 75.0 76.0 77.0 78.0 79.0 80.0
Room Temperature
Wat
er u
se, G
ph
watermodel
Figure 7-12 Water flow vs. Room Temperature in late August 2006
Figure 7-12 above shows that most of the cooling water flow starts when the room temperature is above about 74 F, the approximate set point of the room thermostat. This is consistent with the control intent that cooling water flow be turned on when there is a call for cooling. This figure shows that cooling is active; the water flows are about 15 gallons/hour, increasing as the cooled space gets warmer.
There is also another class of water flows shown by the low water flows in Figure 7-12: flows of about 5 gallons/hour or less. These water flows are standby water flows, triggered automatically every six hours. The principal purpose of these standby water flows is to prevent biological growth by periodically dousing the core with the chlorine typically present in city water or with bromine supplied by flowing water through a bromine canister installed in the earlier units.
Figure 7-12 also shows the model used to characterize the water flows. This model has four parameters:
1. Cooling set temperature, in Figure 7-12, was 74°F
2. Flow at set temperature, in Figure 7-12, 15 gallons/hour
3. Flow slope, the increase in flow with every 1 degree increase in room temperature, in Figure 7-12, .8 gallons/hr/deg F
4. Standby flow, in Figure 7-12, 4 gallons/hr
Figure 7-12 shows a relatively well-behaved situation. When the same model is applied to the other sites, the pattern is not so precise, indicating that the water control was somewhat erratic.
High Water Use Limit
In this analysis, we used a measure that includes both the cooling water need and the flushing. There are no existing standards on this total evaporative cooler water use, but California Energy Commission staff used a value of 0.15 gpm/ton (9 gph/ton) as an upper limit of water use in the context of reviewing the performance of an evaporatively cooled condenser for code compliance. Part of the mandate for the project team in this case was to review the potential water use by this product in the extreme event that it was used on all new housing in California. In this admittedly extreme scenario, the team determined that the water use was quite small compared to other uses and that it would not adversely affect other water uses. Therefore, in this analysis we will use .15 gpm/ton as the high limit reference for water flow. At the

DESERT COOLAIRE TECHNICAL ASSESSMENT
NEW BUILDINGS INSTITUTE, INC. Page 49 JULY 2007 FINAL REPORT
monitored sites, cooling output in tons is known, and the associated high flow limit can readily be calculated.
In Figure 7-13 this calculated high limit reference is compared to the observed water flow.
Observed Flow vs Limit of .15 gpm/ton
0.00
5.00
10.00
15.00
20.00
25.00
30.00
0 5 10 15 20 25 30
Flow at Limit, gph
Obs
erve
d Fl
ow, g
ph
observedMAXNew Control - as isNew Control - best
Figure 7-13 Observed Water Flow vs. Limit
In this figure the thermal output (tons) of the evaporative cooler for every hour of evaporative operation in a two week period is examined, and the high limit flow of water at the observed thermal output is calculated. In figure 14 this is referred to as the flow at limit, and it is the x axis. Corresponding to each of these calculated flows at limit is the actual flow derived from monitoring, plotted as the y axis. For example, in figure xx above, the right most point has a flow at limit of about 29 gallons/hr. This means that if the measured evaporative cooling output for that hour (3.2 tons) was assigned the maximum flow allowed, it would be allowed 29 gallons/hr, here called the flow at limit. Now notice that the observed flow, the y value for that point, is about 21 gallons/hr. That point shows that for that hour the evaporative cooler used only 21 gallons even though it would have been allowed 29 gallons if it had operated at the allowed upper limit.
In Figure 7-13 above, the points above the red line labeled MAX have a monitored flow that exceeds the flow at limit. It is apparent in this figure that most flow points with a high cooling thermal output and a therefore a high flow at limit showed a monitored flow below the red line hence below the limit. And it is also apparent in this figure that the points with excess flow, (above the red line) are almost all associated with the lower flow at limit situations which have the lower thermal output. This is consistent with the operational experience that showed excessive water flow in non cooling situations. Underlying almost all the excess flow points, is the problem of controlling the water flow in the less than full cooling situations.
This over-watering during periods of low cooling need has led to the development, by Coolerado Corporation, of a new digital water control that applies the water flow based on measurements of temperature and humidity.
Equally important in Figure 7-13 are the points at the upper end of the flow at limit axis: the points corresponding to high limit flows of 25-30 gallons per hour. These points correspond to high cooling situations, and they show that in these situations the water use is about 75 percent of the high limit. This is firm evidence that the core can deliver cooling within the high flow limit. Since there was no scaling observed in this first season, we will assume that this performance at 75 percent of the high limit can be sustained without scaling.
The new water control is intended to avoid the oversupply of water during low cooling situations shown in Figure 7-13. It is probable that if the new control works as intended the excess water flow corresponding to low thermal output and hence low flows at limit can be eliminated, and the flow can be

DESERT COOLAIRE TECHNICAL ASSESSMENT
NEW BUILDINGS INSTITUTE, INC. Page 50 JULY 2007 FINAL REPORT
reduced to the green line labeled “new control as is.” This line represents 75 percent of the high limit based on performance that has already been demonstrated.
Improved evaporative performance has been observed in a case where the water flow was un-knowingly restricted. It is very likely that even lower water flows can deliver sustainable high performance. In Figure 7-13 this higher performance level corresponds to the line labeled “new control best” which represents 50 percent of the high limit. In either case, it is reasonable to expect the new water control to bring the water use to well within the high limit.
Actual Water Use
While it is probable that future water use will be significantly reduced with the new water control board, it is important to review the magnitude and composition of the observed water use. A sampling of this observed water use at all sites is presented in Table 7-1. A full tally of the water use is presented in the Appendix.
Table 7-1 Sampling of Water Use Rates, average gallons/day
Site and start of data block
CEC HI Limit
Observed Total
@ high cooling
@ low cooling
@ standby
13, 08/24/06 155 199 125 63 11
14, 08/24/06 117 201 66 131 5
15, 08/24/06 227 256 197 59 0
17, 09/20/06 123 60 29 24 7
18, 09/20/06 109 64 35 22 7
The variation in water use was by site was due to commissioning and imprecision of the water controls as the installers and research team learned the control box set up and settings. The lower water use sites were installed later in the project and learning from the early set up informed their control settings. Adjustments to the first sites were not made prior to this data retrieval.
In Table 7-1, each row shows summary results from a single two-week analytical data block. The results are the average of two weeks data expressed in terms of gallons/day. The column labeled “HI Limit” has been calculated by applying the CEC high water flow limit of 0.15 gpm/ton to the two weeks of cooling output in the two week data block; the column labeled “Observed” is the daily average water use of the data block.
In the columns labeled @ high cooling, @ low cooling, and @ standby, the total monitored water use is partitioned into three components for discussion. The @ high cooling category corresponds to hours where the theoretical water use is 1.5 gallons/hour or greater; the @ low cooling corresponds to theoretical water use of less than 1.5 gallons/hour. The category for @ standby corresponds to cases where the water is being used for biological growth suppression, and some of this water use may be included in the low cooling use also.
The water flow for this unit with the new controls can be expected to be well within the limits stipulated by the CEC for evaporative cooling technology. The new water controls are being retrofitted on all units prior to the 2007 cooling season.
7.4.2 Water Bypass A second water problem pertained to water finding its way into the supply air stream where it is not designed to be. This is referred to here as water bypass. By midway through the 2006 cooling season, it was apparent that all units were suffering from water bypass to some degree. Water was evident on the
DESERT COOLAIRE TECHNICAL ASSESSMENT
NEW BUILDINGS INSTITUTE, INC. Page 51 JULY 2007 FINAL REPORT
supply side of the core, apparently trickling down the supply face of the core, leaking past gaskets at the perimeter of the core, and overflowing the drain at the base of the core.
The evaporative cooler was now a de-facto indirect/direct evaporative cooler as some of the leaked water diffused into the supply air and helped to lower its air temperature. This leakage actually increased the cooling capacity of the unit, but it also violated a significant marketing claim that none of the evaporator water would intrude into the supply air stream.
Initial attempts to seal the bypass were based on the premise that the core, essentially a paper structure, had sagged under its considerable wetted weight. So a wire support harness was retrofitted to all the cores to resist core movement due to sagging. Then the obvious bypass situations were sealed with duct putty. This resulted in extensive sealing around the perimeter of the core with spot sealing on a few passages on the core face. The support and sealing did retard some of the water bypass, but it did not eliminate it.
Further inspection, analysis, and some lab testing of the core, revealed that localized water bypass was possible in the portions of the core where the purge side of the core is at a higher pressure than the supply portion of the core by more than .5 inches WC. This situation was definitely the case whenever the purge damper was closed, as it was during economizer operations. And it was more likely when ever there was a large driving air pressure used to force air through the core as during times of high fan power. The immediate remedy in the current units is to operate with the purge dampers open, even though this increases the fan power.
7.4.3 Biological growth A routine core inspection (and partial disassembly) showed evidence of mold growth on the purge-only (wet) side of the core – which is completely isolated from the supply air. Samples of the growth were sent to a laboratory for identification. A black component of the mold was identified as Stachybotrys, a common but potentially hazardous mold variety. This mold has been the subject of well publicized building litigation that has been associated with moisture on other cellulose material such as sheetrock.
At this finding, the entire product development team was brought into the discussion. It soon became evident that even if the growth were functionally benign and/or isolated from the building conditioned space it is not an acceptable risk or good a marketing term for an innovative product. This galvanized action towards a possible solution.
As a caution, all cores were removed from the eight Desert Aire units in this project soon after the mold was discovered, and the units were modified to allow them to be used for winter heating.
Although Coolerado was the manufacturer of the cores and was active in working toward design solutions to eliminate biological growth on the core, Delphi has since acquired the manufacturing rights and has been working on changes to the core to provide long term effective control of microorganisms. Shortly following first notice regarding the growth Delphi formed a problem solving team and had an independent party conducting a full contingent of lab tests on various medias and biocide options. Through these tests and investigation with various chemical companies Delphi identified a product by Aegis Corporation that is applied to the paper that passed all accelerated tests to reliably eliminate any opportunity for the growth of mold.
New cores with a new chemical application to the paper were made by Delphi for the existing 8 CoolAire units as well as other related products being field tested by SMUD that use the Coolerado cores. At the time of this report publication field checks on these new cores in July 2007 found all cores clear of biological growth and is an encouraging result of the lab and product testing done by Delphi on the chemical treatment.

DESERT COOLAIRE TECHNICAL ASSESSMENT
NEW BUILDINGS INSTITUTE, INC. Page 52 JULY 2007 FINAL REPORT
7.4.4 Scaling A fourth water related issue pertains to salt deposits, a.k.a. scaling, in the core as water is evaporated from potentially salty feed water. The core has been designed to drive the hard water precipitate to the outer edge of the core where it will flake off. The design is that the air-driven water can evaporate some portion of itself and still travel in a super-precipitate state for a few inches before the precipitate salt actually forms. A very significant consideration in the long term performance of this core is the viability of this water distribution and precipitate control strategy.
In this field monitoring, there was no evidence of scaling on the cores including the thorough inspection of disassembled cores removed in the fall of 2006. This lack of scaling was encouraging as many other products would have demonstrated some build up under similar conditions over even one cooling season. Yet, because of the higher than design water flows it shows only that there was no scaling at high water flows; it does not show how low the water flow could reasonably be without the presence of scaling. And, although the sites varied widely in their water quality delivered to the core as shown in Table 7-2, this project has not conclusively demonstrated resistance to scaling of the core in poor water conditions.
Table 7-2 below is included as advisory data regarding the circumstances under which no scaling was observed. The total dissolved solids in parts per million (ppm) is currently regarded as the best indicator of the scaling potential for the water used. It is not known what the critical value for this parameter is in application to this evaporative cooling technology. Also it should be noted that these values can vary seasonally as rainfall may affect groundwater or as the mix of well water and reservoir water in municipal systems varies.
Table 7-2 Installation Site Water Quality
Site Total Dissolved Solids, ppm
13, Portland, OR 108 ground water, 30 reservoir
14, Vancouver WA 129-218
15, Boise, ID 16-382
16, Nampa, ID 16-382
17, Sacramento, CA (well) 189-358 from ground
18, Sacramento, CA (well) 189-358 from ground
19, Seattle, WA 40-43 reservoir
20, Sacramento, CA 49-160 reservoir
Source: City Water Departments

DESERT COOLAIRE TECHNICAL ASSESSMENT
NEW BUILDINGS INSTITUTE, INC. Page 53 JULY 2007 FINAL REPORT
8 Performance Comparison
This section provides additional and more detailed explanations of the system energy performance results and compares the field results with modeled performance of typical package rooftop units.
This section will compare the as-operated thermal performance of the CoolAire unit to a hypothetical SEER 10 and SEER 13 reference performance. Two comparisons will be made: SEER 10 & 13 versus the prototype CoolAire field performance (Prototype) and SEER 10 & 13 versus the next generation design objective unit here called Gen2. The parameters for the Gen2 were derived from the summer 2006 monitoring experience and are considered achievable improvements to the observed performance.
The SEER 10 reference is a close comparison to the federal standard in place at the time of the research initiation (SEER 9.7)13. This baseline was used to set the project target of the new system using 50% less energy than the existing federal standard. The SEER 10 reference also closely aligns with the baseline used in the Energy Policy Act of 2005 (EPACT 05) for tax incentives14. The SEER 13 comparison is the most appropriate market comparison as it is widely adopted today in voluntary standards and will be the federal minimum standard in the near future. Both of these baselines were selected as references for these reasons.
A performance comparison typically requires that the thermal loads and timing of the comparison cases be as similar as possible. In this demonstration exercise the units have been installed on large undefined spaces served by other units as well, and there is no clear estimate of the required thermal load. Therefore, for this analysis, the thermal load will be taken as the thermal output of the CoolAire unit. For this comparison, the energy and demand for a reference SEER 10 & SEER 13 units will be calculated assuming that these units are delivering the exact same thermal load as delivered by the CoolAire unit. At the end of this Section Table 8-9 summarizes the performance and energy of the different systems.
The assumed performance characteristics of the reference units are shown in Tables 8-1 & 8-2.
Table 8-1 Assumed SEER 10 Performance Factors – 5 Ton Unit Capacity
Temperature (dry bulb) Input Electric kW Output Thermal BTU/hr
85 6.05 63,500 10.5 EER
95 6.52 60,000 9.2 EER
105 6.81 56,500 8.3 EER
115 7.03 52,000 7.4 EER
13 The SEER 10 unit was used as proxy for the current federal standard (SEER 9.7) for 3-phase < 60,000 Btu unitary equipment and the baseline used to target 50-percent energy savings. The SEER 13 unit represents the current minimum standard adopted by ASHRAE, the Consortium for Energy Efficiency and by some states. The date for federal adoption of the SEER 13 standard is currently dependant on factors at DOE and the legislature but will be in early 2008 or by 2010 at the latest. 14 HVAC savings must equal or exceed 50% over the ASHRAE 90.1-04 standard for < 65,000 btus/hr unitary equipment of SEER 9.7.

DESERT COOLAIRE TECHNICAL ASSESSMENT
NEW BUILDINGS INSTITUTE, INC. Page 54 JULY 2007 FINAL REPORT
Table 8-2 Assumed SEER 13 Performance Factors – 5 Ton Unit Capacity
Temperature (dry bulb) Input Electric kW Output Thermal BTU/hr
85 5.27 68,500 13 EER
95 5.70 65,000 11.4 EER
105 6.25 62,500 10 EER
115 6.84 59,500 8.7 EER
These tables, derived from manufacturer’s performance data, give the typical performance for a unit with an outdoor air-cooled condenser. The indoor air conditions for dry bulb and wet bulb temperatures assumed in these tables were close to the indoor air conditions actually monitored.
Note the typical DX behavior expressed in these tables. The output decreases slightly as temperature increases, and the input power increases significantly as the temperature increases. These performance factors assume steady state performance, which is slightly better than would be observed. In this exercise we assume that the SEER 10 and 13 references operate at steady state, which is the best operation we could expect from such units and above typical field performance. Thus, the comparisons in this section show the best case modeled results of the reference cases (SEER 10 and 13) which are better than field performance research has demonstrated, the actual field case of the sub-optimal prototype (performance issues presented in Section 7), and the modeled performance of a Gen2 unit under the same loads. For these reasons the comparisons are considered conservative and likely efficiency potential equal to or higher than represented.
In this exercise, the hourly temperatures throughout the day are in general different than the ones in Table 8-1, so the values in the table are interpolated as appropriate to estimate performance at other temperatures.
The operating circumstances for the CoolAire units were experimentally varied through out the cooling season, and a seasonal comparison would include many events that would obscure the clarity of a comparison. Therefore, the comparison will be done on the basis of typical operating full day cases for medium and high cooling situations. The full seasonal average performance would be close to the medium cooling case with the high cooling case being critical for consideration of peak periods.
8.1 High Cooling Case In this case, as in the other cases, the fan is run 24 hours a day to provide recirculation when active cooling is not required. The hourly energy use in this case is given in Figure 8-1.

DESERT COOLAIRE TECHNICAL ASSESSMENT
NEW BUILDINGS INSTITUTE, INC. Page 55 JULY 2007 FINAL REPORT
8.1.1 Energy Comparison
Hourly Energy Comparison high cooling case, 7/27/06, Tmax 103 F, Tmin 67 F
0.00
1.00
2.00
3.00
4.00
5.00
6.007:
00
8:00
9:00
10:0
0
11:0
0
12:0
0
13:0
0
14:0
0
15:0
0
16:0
0
17:0
0
18:0
0
19:0
0
20:0
0
21:0
0
22:0
0
23:0
0
0:00
1:00
2:00
3:00
4:00
5:00
6:00
Time of day
Hou
rly
Ener
gy,
kWh
Prototype Total kWh SEER 10 Prototype Compressor kWh
Figure 8-1 Energy Comparison with SEER 10 – High Cooling Case
Note in this figure that the SEER 10 reference uses more energy during the 100+ deg F peak cooling portions of the day, and it uses slightly less energy in the non-cooling (recirculation) portions of the day. The line labeled “Prototype Compressor” shows the hourly energy use of the compressor in the CoolAire field prototype unit. In Figure 8-1, it is apparent that the CoolAire unit was using the compressor for most of the day in the high cooling case – a control approach that was not optimized during the research season.
In the simulation, the SEER 10 reference used 63 kWh/day for an average daily EER of 9.6, and the as-operated unit used 53 kWh/day for an average daily EER of 12.3. In the high cooling case, the Prototype CoolAire is using 23% less energy on a full day basis than the SEER 10 reference. The design objective system used 34 kWh/day - 50% less energy than the SEER 10 reference - with a daily EER of 19.
Hourly Energy Comparison - high cooling case, 7/27/06, Tmax 103 deg F, Tmin 67 deg F
0.00
1.00
2.00
3.00
4.00
5.00
7:00
8:00
9:00
10:0
0
11:0
0
12:0
0
13:0
0
14:0
0
15:0
0
16:0
0
17:0
0
18:0
0
19:0
0
20:0
0
21:0
0
22:0
0
23:0
0
0:00
1:00
2:00
3:00
4:00
5:00
6:00
Time of day
Hou
rly
Ener
gy,
kWh
Prototype Total kWh SEER 13 Prototype Compressor kWh
Figure 8-2 Energy Comparison with SEER 13 – High Cooling Case

DESERT COOLAIRE TECHNICAL ASSESSMENT
NEW BUILDINGS INSTITUTE, INC. Page 56 JULY 2007 FINAL REPORT
In Figure 8-2 the CoolAire is slightly better than the SEER 13 reference. The CoolAire unit used just 6% less energy on a 24 hour average basis but 33% less energy during the peak outdoor temperature hour.
In high cooling cases the CoolAire can clearly reduce total daily energy use with the field results of the Prototype unit saving 6-22% over the reference cases and the Design Objective unit capable of 19-50% savings. During peak temperature periods the CoolAire savings exceed the references by 33-67% as shown in Table 8-3.
Table 8-3 Energy Reduction of CoolAire to Reference Systems – High Cooling Case
System 24 hr Average % Peak hr % 24 hr Average % Peak hr %
SEER 10 (modeled) 22% 43% 50% 67%
SEER 13 (modeled) 6% 33% 19% 45%
Percent Energy (kWh) Reduction of CoolAire to Reference Systems - Avg. and Peak
Ref
eren
ce
Prototype (as operated) Gen2 (modeled)High Cooling Case (Tmax 103F)
8.1.2 Demand Comparison Figure 8-3 compares the demand for the high cooling case for the as operated CoolAire unit and the SEER 10 reference and begins to demonstrate the exceptional opportunity for evaporative technology during hot outdoor periods.
Hourly Demand Comparison high cooling case, 7/27/06, Tmax 103F, Tmin 67F
0.001.002.003.004.005.006.007.008.00
7:00
8:00
9:00
10:0
0
11:0
0
12:0
0
13:0
0
14:0
0
15:0
0
16:0
0
17:0
0
18:0
0
19:0
0
20:0
0
21:0
0
22:0
0
23:0
0
0:00
1:00
2:00
3:00
4:00
5:00
6:00
Time of day
Hou
rly
Dem
and,
kW
Prototype SEER 10
Figure 8-3 Demand Comparison with SEER 10 - High Cooling Case
In Figure 8-3 it is evident that the Prototype CoolAire has a significantly lower demand than the SEER 10 reference. In fact, the demand is 40% less than the reference. In both of these comparison cases, the compressor is being used for most of the mid-day hours. In the case of the SEER 10 reference, the full single stage compressor is toggled on and off for several minutes at a time, to meet load. And the assumed demand corresponds to the full compressor power.
In the case of the Prototype unit, the full compressor is also being toggled on and off to meet load. But it is being toggled on and off very quickly every ten seconds or so, resulting in an average power (as evident to the demand meter) that is lower than the full compressor power.
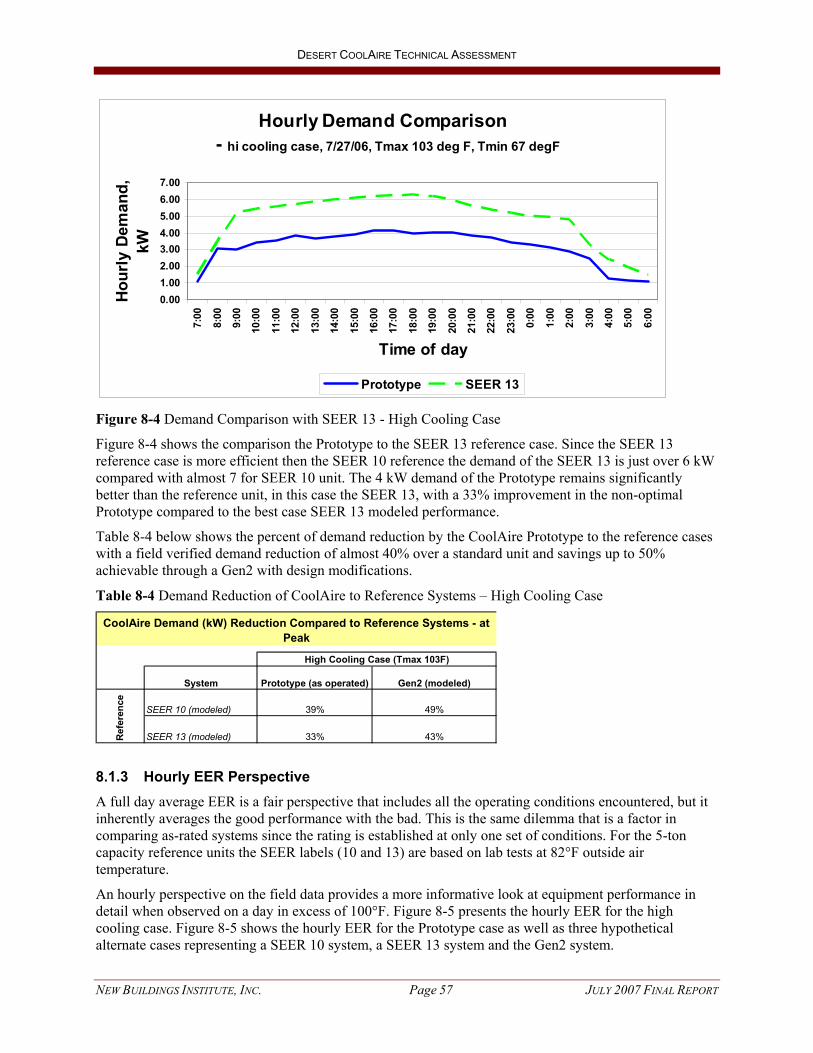
DESERT COOLAIRE TECHNICAL ASSESSMENT
NEW BUILDINGS INSTITUTE, INC. Page 57 JULY 2007 FINAL REPORT
Hourly Demand Comparison - hi cooling case, 7/27/06, Tmax 103 deg F, Tmin 67 degF
0.001.002.003.004.005.006.007.00
7:00
8:00
9:00
10:0
0
11:0
0
12:0
0
13:0
0
14:0
0
15:0
0
16:0
0
17:0
0
18:0
0
19:0
0
20:0
0
21:0
0
22:0
0
23:0
0
0:00
1:00
2:00
3:00
4:00
5:00
6:00
Time of day
Hou
rly
Dem
and,
kW
Prototype SEER 13
Figure 8-4 Demand Comparison with SEER 13 - High Cooling Case
Figure 8-4 shows the comparison the Prototype to the SEER 13 reference case. Since the SEER 13 reference case is more efficient then the SEER 10 reference the demand of the SEER 13 is just over 6 kW compared with almost 7 for SEER 10 unit. The 4 kW demand of the Prototype remains significantly better than the reference unit, in this case the SEER 13, with a 33% improvement in the non-optimal Prototype compared to the best case SEER 13 modeled performance.
Table 8-4 below shows the percent of demand reduction by the CoolAire Prototype to the reference cases with a field verified demand reduction of almost 40% over a standard unit and savings up to 50% achievable through a Gen2 with design modifications.
Table 8-4 Demand Reduction of CoolAire to Reference Systems – High Cooling Case
System Prototype (as operated) Gen2 (modeled)
SEER 10 (modeled) 39% 49%
SEER 13 (modeled) 33% 43%Ref
eren
ce
High Cooling Case (Tmax 103F)
CoolAire Demand (kW) Reduction Compared to Reference Systems - at Peak
8.1.3 Hourly EER Perspective A full day average EER is a fair perspective that includes all the operating conditions encountered, but it inherently averages the good performance with the bad. This is the same dilemma that is a factor in comparing as-rated systems since the rating is established at only one set of conditions. For the 5-ton capacity reference units the SEER labels (10 and 13) are based on lab tests at 82°F outside air temperature.
An hourly perspective on the field data provides a more informative look at equipment performance in detail when observed on a day in excess of 100°F. Figure 8-5 presents the hourly EER for the high cooling case. Figure 8-5 shows the hourly EER for the Prototype case as well as three hypothetical alternate cases representing a SEER 10 system, a SEER 13 system and the Gen2 system.

DESERT COOLAIRE TECHNICAL ASSESSMENT
NEW BUILDINGS INSTITUTE, INC. Page 58 JULY 2007 FINAL REPORT
Hourly EER - high cooling case 7/27/06, Tmax 103F ,Tmin 67F
0.00
5.00
10.00
15.00
20.00
25.00
30.00
7:00
8:00
9:00
10:00
11:00
12:00
13:00
14:00
15:00
16:00
17:00
18:00
19:00
20:00
21:00
22:00
23:00 0:0
01:0
02:0
03:0
04:0
05:0
06:0
0
Time of Day
Hou
rly E
ER
Prototype SEER 10 SEER 13 Gen2
Figure 8-5 Hourly EER Comparison – High Cooling Case
The general pattern in this figure shows the EER for the SEER 10 & 13 systems diminishing during the hot part of the day when DX systems are at their least efficient. The general pattern also shows the evaporative systems with increased EER during the hot part of the day when the evaporative process naturally operates at its most efficient.
The large change in EER between the two CoolAire cases, the Prototype and the Gen2, is caused by more efficient compressor operation in the Gen2 system than the inefficient compressor operation observed in the as operated system. The Gen2 system in Figure 8-5 is based on an assumed 15% reduction in fan power and an assumed 50% reduction in compressor energy through improved controls and condenser design.
At the peak of the day (103°F) the Prototype CoolAire unit achieved a high EER of 15 and the Gen2 unit showed max performance of EER 25. The reference units both dropped in efficiency to below EER 10 during the peak hours of outdoor temperature. For the high cooling case, the Gen2 unit has an all day average EER of 19 and a coincident peak demand EER of 25. The SEER 10 reference averaged a daily EER of 9.6 and a coincident peak demand EER of only 8. Table 8-5 provides a comparison of the CoolAire and the reference systems EER during the high cooling case.
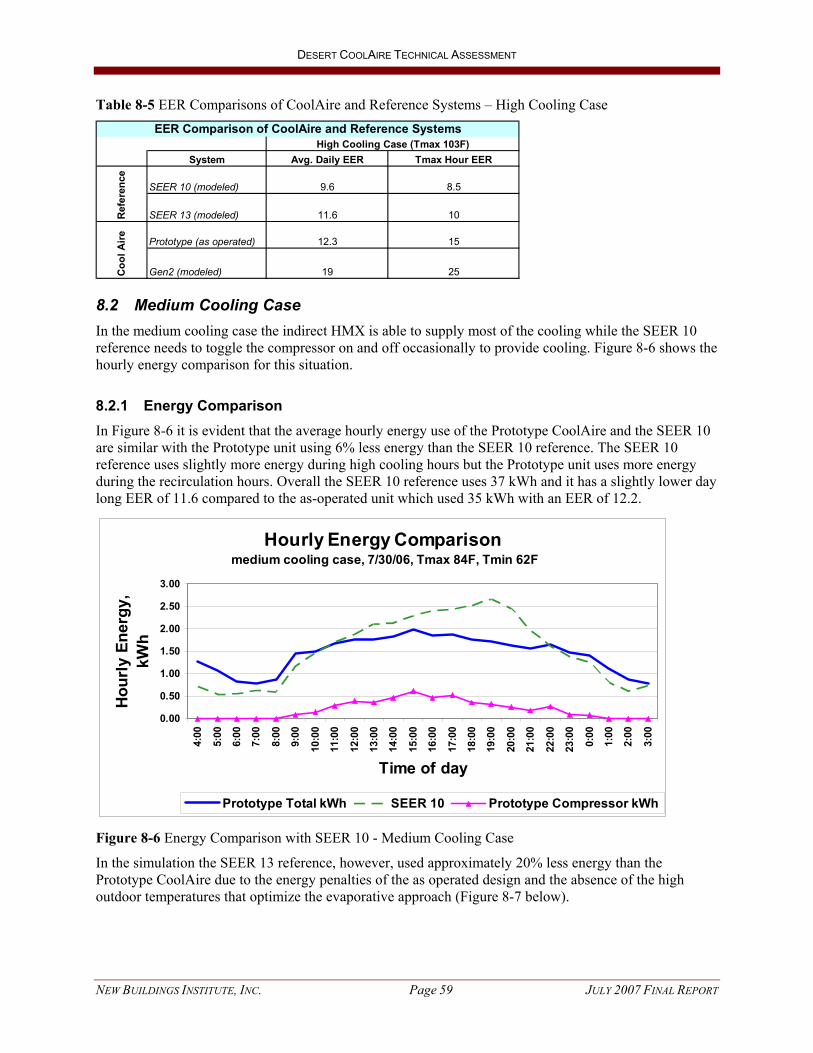
DESERT COOLAIRE TECHNICAL ASSESSMENT
NEW BUILDINGS INSTITUTE, INC. Page 59 JULY 2007 FINAL REPORT
Table 8-5 EER Comparisons of CoolAire and Reference Systems – High Cooling Case
System Avg. Daily EER Tmax Hour EER
SEER 10 (modeled) 9.6 8.5
SEER 13 (modeled) 11.6 10
Prototype (as operated) 12.3 15
Gen2 (modeled) 19 25
High Cooling Case (Tmax 103F)EER Comparison of CoolAire and Reference Systems
Ref
eren
ceC
ool A
ire
8.2 Medium Cooling Case In the medium cooling case the indirect HMX is able to supply most of the cooling while the SEER 10 reference needs to toggle the compressor on and off occasionally to provide cooling. Figure 8-6 shows the hourly energy comparison for this situation.
8.2.1 Energy Comparison In Figure 8-6 it is evident that the average hourly energy use of the Prototype CoolAire and the SEER 10 are similar with the Prototype unit using 6% less energy than the SEER 10 reference. The SEER 10 reference uses slightly more energy during high cooling hours but the Prototype unit uses more energy during the recirculation hours. Overall the SEER 10 reference uses 37 kWh and it has a slightly lower day long EER of 11.6 compared to the as-operated unit which used 35 kWh with an EER of 12.2.
Hourly Energy Comparison medium cooling case, 7/30/06, Tmax 84F, Tmin 62F
0.00
0.50
1.00
1.50
2.00
2.50
3.00
4:00
5:00
6:00
7:00
8:00
9:00
10:0
0
11:0
0
12:0
0
13:0
0
14:0
0
15:0
0
16:0
0
17:0
0
18:0
0
19:0
0
20:0
0
21:0
0
22:0
0
23:0
0
0:00
1:00
2:00
3:00
Time of day
Hou
rly
Ener
gy,
kWh
Prototype Total kWh SEER 10 Prototype Compressor kWh
Figure 8-6 Energy Comparison with SEER 10 - Medium Cooling Case
In the simulation the SEER 13 reference, however, used approximately 20% less energy than the Prototype CoolAire due to the energy penalties of the as operated design and the absence of the high outdoor temperatures that optimize the evaporative approach (Figure 8-7 below).

DESERT COOLAIRE TECHNICAL ASSESSMENT
NEW BUILDINGS INSTITUTE, INC. Page 60 JULY 2007 FINAL REPORT
Hourly Energy Comparison - medium cooling case, 7/30/06, Tmax 84F, Tmin 62F
0.00
0.50
1.00
1.50
2.00
2.504:
00
5:00
6:00
7:00
8:00
9:00
10:0
0
11:0
0
12:0
0
13:0
0
14:0
0
15:0
0
16:0
0
17:0
0
18:0
0
19:0
0
20:0
0
21:0
0
22:0
0
23:0
0
0:00
1:00
2:00
3:00
Time of day
Hou
rly
Ener
gy,
kWh
Prototype Total kWh SEER 13 Prototype Compressor kWh
Figure 8-7 Energy Comparison with SEER 13 - Medium Cooling Case
With the modifications to the compressor and fan power the Gen2 energy use was 27 kWh/day for an EER of 15.4 and approximately 6% less energy than the reference SEER 13. Table 8-6 shows a widely variable range of energy savings for the CoolAire under the medium cooling case.
Table 8-6 Energy Reduction of CoolAire to Reference Systems – Medium Cooling Case
System Average % Peak % Average % Peak %
SEER 10 (modeled) 5% 30% 26% 48%
SEER 13 (modeled) -20% 13% 6% 34%
Prototype (as operated) Gen2 (modeled)
Ref
eren
ce
Percent Energy (kWh) Reduction of CoolAire to Reference Systems - Avg. and Peak
Medium Cooling Case (Tmax 84F)
8.2.2 Demand Comparison Figure 8-8 below shows the comparison of hourly demand between the Prototype CoolAire and the SEER 10 for a medium cooling case on a day with a maximum temperature of 84°F.

DESERT COOLAIRE TECHNICAL ASSESSMENT
NEW BUILDINGS INSTITUTE, INC. Page 61 JULY 2007 FINAL REPORT
Hourly Demand Comparison medium cooling case, 7/30/06,Tmax 84F, Tmin 62F
0.001.002.003.004.005.006.007.00
4:00
5:00
6:00
7:00
8:00
9:00
10:0
0
11:0
0
12:0
0
13:0
0
14:0
0
15:0
0
16:0
0
17:0
0
18:0
0
19:0
0
20:0
0
21:0
0
22:0
0
23:0
0
0:00
1:00
2:00
3:00
Time of day
Hou
rly
Dem
and,
kW
Prototype SEER 10
Figure 8-8 Demand Comparisons with SEER 10 – Medium Cooling Case
In Figure 8-8, it is evident that the CoolAire Prototype unit is delivering a very significant demand benefit of about 50% reduction. Even in this medium cooling situation, the SEER 10 reference must operate long enough to show a significant demand effect. In this medium cooling case, there is a small energy benefit relative to the SEER 10 reference, but a significant 50% demand reduction.
Figure 8-9 below shows that even compared with a more efficient SEER 13 under medium cooling the Prototype used far less kW – almost 40% lower kW equal to 2 kW savings throughout the business hours of the day.
Hourly Demand Comparison - medium cooling case, 7/30/06, Tmax 84F, Tmin 62F
0.00
1.00
2.00
3.00
4.00
5.00
6.00
4:00
5:00
6:00
7:00
8:00
9:00
10:0
0
11:0
0
12:0
0
13:0
0
14:0
0
15:0
0
16:0
0
17:0
0
18:0
0
19:0
0
20:0
0
21:0
0
22:0
0
23:0
0
0:00
1:00
2:00
3:00
Time of day
Hou
rly
Dem
and,
kW
Prototype SEER 13
Figure 8-9 Demand Comparisons with SEER 13 – Medium Cooling
In Table 8-7 the strong demand savings associated with the CoolAire design, even in the medium cooling case, are shown. The Prototype CoolAire saved approximately 3 kW over the SEER 10 reference, as was

DESERT COOLAIRE TECHNICAL ASSESSMENT
NEW BUILDINGS INSTITUTE, INC. Page 62 JULY 2007 FINAL REPORT
the case in the high cooling case, but in the medium cooling case this translates to 47% reduction compared with the 6 kW peak of the SEER 10.
Table 8-7 Demand Reduction of CoolAire to Reference Systems – Medium Cooling Case
System Prototype (as operated) Gen2 (modeled)
SEER 10 (modeled) 47% 55%
SEER 13 (modeled) 39% 48%Ref
eren
ce
Medium Cooling Case (Tmax 84F)
CoolAire Demand (kW) Reduction Compared to Reference Systems - at Peak
8.2.3 Hourly EER Perspective The hourly EER for the as operated system and the hypothetical references is given in Figure 8-10.
Hourly EER - medium cooling case, 7/30/06, Tmax 84F, Tmin 62F
0.00
5.00
10.00
15.00
20.00
25.00
4:00
5:00
6:00
7:00
8:00
9:00
10:00
11:00
12:00
13:00
14:00
15:00
16:00
17:00
18:00
19:00
20:00
21:00
22:00
23:00 0:0
01:0
02:0
03:0
0
Time of Day
Hou
rly E
ER
Prototype SEER 10 SEER 13 Gen2
Figure 8-10 Hourly EER Comparison - Medium Cooling Case
As in the high cooling case, the general pattern in Figure 8-10 shows the EER for the SEER 10 & 13 systems diminishing during the hot part of the day when DX systems are at their least efficient. In the medium cooling case, the EER does not diminish as much because the air is cooler and the DX unit operates more efficiently than in the high cooling case. The general pattern also shows the evaporative systems with increased EER during the hot part of the day as the evaporative process operates at its most efficient. But here again, the EER does not increase as much during the medium cooling case as during high cooling.
It is apparent in this figure that the Gen2 system has a higher EER than the Prototype system. The change in EER between these cases is caused primarily by the assumed more efficient fan, and also by the more efficient compressor operation. Table 8-8 compares the CoolAire and the reference systems EER performance for the medium cooling case.
Table 8-8 EER Comparison of CoolAire and Reference Systems – Medium Cooling Case

DESERT COOLAIRE TECHNICAL ASSESSMENT
NEW BUILDINGS INSTITUTE, INC. Page 63 JULY 2007 FINAL REPORT
Avg. Daily EER Tmax Hour EER
11.6 10.8
14.8 13.4
12.2 13.9
15.4 19.2
Medium Cooling Case (Tmax 84F)EER Comparison of CoolAire and Reference Systems
Ref
eren
ceC
ool A
ire
8.3 Performance Summary The CoolAire Prototype unit shows strong, 40-50%, demand savings relative to a both a SEER 10 and a SEER 13 reference whenever there is significant cooling. These demand savings are reliable even in the highest cooling situations. These strong demand savings include the admittedly high fan energy of the CoolAire Prototype unit, but they are attributable significantly to the variable control of the compressor.
The CoolAire Prototype unit also showed significantly better energy performance than the SEER 10 reference in high cooling situations, and similar energy performance during medium and low cooling events. On a full season basis, it is estimated that the energy use of the CoolAire Prototype unit as operated, is significantly better than the SEER 10 reference, and just slightly better than the SEER 13 reference.
The improved Gen2 performance can be achieved by following two themes found in the field research field:
1) Minimize compressor energy by using a smaller compressor and by attending to the routine control set points so that the compressor is not unnecessarily used, and
2) Reduce fan energy use by breaking fan use into its primary purposes (evaporator supply, evaporator purge, recirculation, heating etc.) and by using the fan in each of these purposes only when needed, and at its most efficient. In practice, this could be achieved by rearranging the fan to be located after the HMXs and cooling coils, adding a separately controlled purge fan for the HMXs, and providing by-pass dampers around the HMXs so that the overall fan energy performance could be significantly improved.
Improvements to design are further discussed in Section 9 on Next Generation Design.
Table 8-9 provides the total performance comparisons and efficiencies of the CoolAire and the reference systems previously presented in this Section into one location for ease of use.

DESERT COOLAIRE TECHNICAL ASSESSMENT
NEW BUILDINGS INSTITUTE, INC. Page 64 JULY 2007 FINAL REPORT
Table 8-9 Desert CoolAire Performance Comparisons
Note: As Operated CoolAire performance is based on field monitored results - all others were modeled under the same load and conditions
System Avg. Daily EER Tmax Hour EER Avg. Daily EER Tmax Hour EER
SEER 10 (modeled) 9.6 8.5 11.6 10.8
SEER 13 (modeled) 11.6 10 14.8 13.4
Prototype (as operated) 12.3 15 12.2 13.9
Gen2 (modeled) 19 25 15.4 19.2
System Prototype (as operated) Gen2 (modeled) Prototype (as operated) Gen2 (modeled)
SEER 10 (modeled) 39% 49% 47% 55%
SEER 13 (modeled) 33% 43% 39% 48%
System 24 hr Average % Peak hr % 24 hr Average % Peak hr %
SEER 10 (modeled) 22% 43% 50% 67%
SEER 13 (modeled) 6% 33% 19% 45%
System Average % Peak % Average % Peak %
SEER 10 (modeled) 5% 30% 26% 48%
SEER 13 (modeled) -20% 13% 6% 34%
High Cooling Case (Tmax 103F) Medium Cooling Case (Tmax 84F)
Prototype (as operated) Gen2 (modeled)
Ref
eren
ce
Percent Energy (kWh) Reduction of CoolAire to Reference Systems - Avg. and Peak
Ref
eren
ce
Prototype (as operated) Gen2 (modeled)
Medium Cooling Case (Tmax 84F)
High Cooling Case (Tmax 103F)
Ref
eren
ce
High Cooling Case (Tmax 103F) Medium Cooling Case (Tmax 84F)
Desert CoolAire Performance Comparison
CoolAire Demand (kW) Reduction Compared to Reference Systems - at Peak
CoolAire Demand (kW) Reduction Compared to Reference Systems - at Peak
EER Comparison of CoolAire and Reference Systems
EER Comparison of CoolAire and Reference Systems
Ref
eren
ceC
ool A
ire
DESERT COOLAIRE TECHNICAL ASSESSMENT
NEW BUILDINGS INSTITUTE, INC. Page 65 JULY 2007 FINAL REPORT
9 Next Generation Design
The design of a next generation (Gen2) Desert CoolAire is a work in progress. The first and foremost feature of the CoolAire indirect evaporative air conditioner is the Delphi HMX core. The HMX demonstrated compelling potential for low-energy commercial cooling and increased ventilation but also experienced significant issues with water control, biological growth and leaking during the first testing season of summer 2006.
The research project has been extended through December 2007 to assess summer field performance, verify the reliability of new cores and new water controls, and test alternative control scenarios. In parallel, the project team and Desert Aire are actively working on design modification options to the CoolAire based on the working assumption that the new cores and water controls will prove reliable.
At the time of this report publication new cores chemically treated by Delphi have been installed in the current prototype units and the first round of summer 2007 field inspections found them completely clear of biological growth. Assuming the final rounds of field inspections confirm this encouraging result then the work on the Gen2 design will continue as described herein.
The approach for the next generation CoolAire is to utilize the lab and field findings to date to inform redesign priorities, assess cost and weight impacts of the draft Gen2 design, analyze the potential energy performance, consider trade offs between max performance and greater market acceptance, and finalize the Gen2 design by fall 2007. Assuming continued successful core and system performance in summer 2007, the next research step will be to manufacture prototypes of Gen2 for field testing in summer 2008 with an eye on market-ready products by 2009.
The current thinking on the Gen2 design is based on the technical and system issues identified throughout the research, and the collaboration between Desert Aire engineers and the project monitoring team and field contractors.
9.1 Market Factors The design intent of the first prototype was to be a full replacement system to a standard 5-ton capacity rooftop unit as presented in Section 2 – Design Intent. The size and weight field installation issues of the prototype in a retrofit application were significant and, although the Gen2 design can be relatively lighter and smaller, incorporating the cores with the DX and gas pack requires a much larger volume, and is unavoidably much heavier than conventional units of the same capacity. There are two product paths based on the weight and size issue: 1) eliminate the DX and gas pack and create a pure indirect evaporative cooling and ventilation system, or 2) maintain the hybrid package and target the best applications in new construction for the CoolAire to reduce the retrofit market barriers.
In both cases, the market demand for improved indoor air quality and “green” technologies is a product niche and key benefit of the CoolAire. The fact that the HMX design delivers cool outside air without the added moisture of typical evaporative systems is one of the drivers for its consideration by the commercial market.
Another driver is that 100 percent outside air ventilation, combined with the low energy and demand use during cooling, could allow a customer to be eligible for 2-4 points through the USGBC’s LEED program – a growing influence in new commercial construction and major renovations. The energy savings of the redesigned unit, as referenced earlier against a SEER 10 unit baseline, could also qualify for the federal energy tax credit.
In addition, the CoolAire and systems with HMX-alone designs lend themselves exceptionally well as Dedicated Out Side Air (DOSA) systems. As a DOSA the system can be installed as part of an overall

DESERT COOLAIRE TECHNICAL ASSESSMENT
NEW BUILDINGS INSTITUTE, INC. Page 66 JULY 2007 FINAL REPORT
cooling and ventilation strategy where the DOSA, by providing 100% outside air, allows the elimination of outside required ventilation for several adjacent standard design systems. This results in energy savings across all units and still introduces greater ventilation to the space served by the units than would occur with all standard systems operating at code ventilation levels. This application suits open zone areas which are common in many large offices and retail.
9.2 Design Considerations The fundamental design question for this unit concerns the compressor subsystem. Is it necessary, and if so how big? The ultimate need for a DX subsystem is questioned by some manufacturers that market evaporative units that are intended to be efficient enough that no back up cooling is ever necessary. These can definitely be applicable in a residential context where internal loads are minimal or in commercial applications where internal loads are low, or where slightly higher supply air temperatures are tolerable (65°F -70°F versus 55°F-60°F). This research demonstrated, however, that the DX portion of the CoolAire is critical to successfully meet the full cooling needs of many commercial and climate applications as explained below.
9.2.1 The Need for the DX The first part of addressing the question of whether a DX is actually necessary to meet cooling and comfort conditions is to show from the monitoring data just what an indirect evaporative core can do.
Figure 9-1 shows the operating points of the evaporative core at two sites including some hot weather operation. The condition of the air is expressed in terms of the dry bulb and wet bulb temperatures rather than in terms of the dry bulb temperature and the absolute humidity as it would be on a psychrometric chart.
Indirect Evaporative Cooler Operating Points
45.0
50.0
55.0
60.0
65.0
70.0
75.0
60.0 70.0 80.0 90.0 100.0 110.0
Dry Bulb Temperature
Wet
Bul
b Te
mpe
ratu
re
#15, Boise #13, PDX Comfort
Figure 9-1 Evaporative Cooler Operating Points
In this figure, the point at the right hand end of each line represents the initial outdoor air wet and dry bulb temperatures. The point at the left hand end represents the air conditions as it emerged from the evaporative cooler. The green box represents the approximate range of the ASHRAE comfort conditions. It is apparent that both the sites started from conditions much hotter than comfortable, and that both sites discharged air that was in the comfort region.

DESERT COOLAIRE TECHNICAL ASSESSMENT
NEW BUILDINGS INSTITUTE, INC. Page 67 JULY 2007 FINAL REPORT
This is typical indirect evaporative cooler performance. The dry bulb temperatures at the core exit are typically in the range of 62°F-72°F regardless of the initial outdoor dry bulb temperature. And as the dry bulb temperature is reduced in an indirect evaporative cooler without altering the water content of the air, the wet bulb temperature is also reduced. In a cooler with no leaks to the supply air stream, the wet bulb temperature reduction is always the same ratio of the dry bulb reduction (about 30%). Hence the lines in Figure 9-1 all show the same slope.
To assess the suitability of indirect evaporative cooling, (and DX backup), to a particular climate, the hourly typical meteorological year (TMY215) design data for a candidate site is examined in a plot similar to Figure 9-1. But this examination will require two other features not shown in Figure 9-1:
1) Saturation line: along this line the air is fully saturated and it cannot hold any more water. Thus air conditions to the left or above this line are not possible because they imply air holding more water than is possible, and
2) Indirect evaporative limit: this line has the constant slope corresponding to changing the temperature of the air without altering its water content, the basic principle of an indirect evaporative cooler. The effect of an indirect evaporative cooler is always to move points in a manner parallel to the line toward cooler dry bulb temperatures, as is clearly seen in Figure 9-1. If the air is initially described by a point below this line, the action of an indirect evaporative cooler will move that point parallel to the limit line, and it will enter the comfort box. But if the condition of the air is initially described by a point above the line, an indirect evaporative cooler will move the point in a manner parallel to the line, and it will not enter the comfort box. Hence this line is referred to as the indirect evaporative limit because initial air conditions described by points above this line cannot be brought into the comfort box by means of an indirect evaporative cooler.
An estimate of the core inlet and exit conditions during challenging, but reasonable summer conditions, is examined in Figures 9-2 and 9-3 that show the hottest summer months for Sacramento (Figure 9-2) and for the Southern California deserts including Phoenix (Figure 9-3). These conditions reasonably represent the most challenging performance for this system. Both these figures were derived from long term weather data, TMY2, and from empirical performance of the evaporative efficiency for these units.
15 The “2” indicates this is the second generation of TMY data produced primarily for use in DOE2 and other energy modeling programs.

DESERT COOLAIRE TECHNICAL ASSESSMENT
NEW BUILDINGS INSTITUTE, INC. Page 68 JULY 2007 FINAL REPORT
Cooling Conditions Sacramento - July TMY2
40
45
50
55
60
65
70
75
80
85
40 50 60 70 80 90 100
Dry Bulb Temperature, deg F
Wet
Bul
b Te
mpe
ratu
re, d
eg F
OSA Comfort saturation indirect evap limit evap exit
Figure 9-2 Core Inlet and Outlet Temps at Max. Summer Conditions for Sacramento
Definitions for Figure 7-14 and 7-15:
• OSA: Out side air temperature
• Comfort: The ASHRAE comfort zone for space temperature that are determined to be most comfortable by most people
• Saturation: Fully saturated air (100% humidity). Along this line the dry bulb temperature, wet bulb temperature and dew point temperatures are all equal, as is the case when the air cannot hold any more water
• Indirect evap limit: The approximate best performance to be expected from an indirect evaporative cooler
• Evap exit: Temperature of the air exiting the indirect evaporative core (HMX)
Note in 9-2 that the wide range of initial outside air conditions (open diamonds) are reduced to a much tighter cluster of air conditions emerging from the evaporator core (dense x symbols). About one third of these exit condition points lay within the green comfort zone; the rest are cooler than the comfort zone, in the 60°F-70°F range.
Figure 9-2 shows clearly that the unit can meet the needs of supplying and conditioning the ventilation air. But can it also remove the internal, solar, and metabolic gains from the conditioned space? The points in the comfort zone are initially quite adequate, but they have little further cooling capacity to apply to the internal gains. This alone argues for some additional cooling capability to lower the supply air temperature by a few more degrees. The target supply air temperature of 55°F used for years by the HVAC design community is based in large part on the need to reliably meet internal gains and create ultimate space comfort of 70°F-80°F.
Figure 9-3 shows some seasonal conditions that prevail in the quickly growing regions of Southern California and Phoenix that are distinctly humid during a brief season of about 2-3 weeks. These are the “monsoon” times observed in Southern California and even more strongly in Phoenix.

DESERT COOLAIRE TECHNICAL ASSESSMENT
NEW BUILDINGS INSTITUTE, INC. Page 69 JULY 2007 FINAL REPORT
Cooling Conditions Phoenix - July TMY2
40
45
50
55
60
65
70
75
80
85
60 70 80 90 100 110 120
Dry Bulb Temperature, deg F
Wet
Bul
b Te
mpe
ratu
re, d
eg F
OSA Comfort saturation indirect evap limit evap exit
Figure 9-3 Core Inlet and Outlet Temps at Max. Summer Conditions for California Deserts and Phoenix
In Figure 9-3 note that about one third of the core exit condition points are more humid than is comfortable and that the majority of the points lie in the comfort zone but have little capability of further cooling to remove the internal gains. This situation argues even more strongly for the use of auxiliary cooling, both to remove latent heat, and to remove internal gains.
In Figures 9-2 and 9-3 there appears to be evidence that additional cooling capacity is needed beyond the theoretical best cooling capability of the indirect evaporative cooler alone. This additional cooling is only needed some of the time, but it is a significant amount of time, and it is in the most significant target market for this unit.
Because our monitoring experience included only a limited number of sites, sometimes irregular operation, and often only a portion of the cooling season we chose to model a full cooling season and best case evaporator operation in the above Figures. This full season analysis showed that in the hotter regions of California and Arizona some supplemental DX cooling was definitely necessary. This same analysis also showed that the role and need for the supplemental DX in Portland and Seattle was less but not zero and that a functional economizer was very important in these cases.
There is also another practical argument for lower temperature supply air. The 55°F industry supply air target has led to duct sizing that is embedded in most existing building stock. In principle, the supply air could be served at a higher temperature, say 60°F or even up to 65°F, but this would require slightly larger ducts. When ASHRAE explored higher supply air temperatures, most of the considerable (and successful) opposition was based on the economic impact of changing duct sizing.
Size and Efficiency of the DX
It can be argued that many applications of the unit will be on very efficient spaces with low internal gains, and this may allow a higher supply temperature up to 60°F, but even with the higher supply temperature a small amount of additional cooling will occasionally be necessary to remove water from the ventilation air. The additional cooling varies from hour to hour from none to about 1.5 tons.
The very practical design problem is to devise an auxiliary compressor subsystem and control scheme that can deliver a highly variable quantity of additional cooling from hour to hour, all while maintaining

DESERT COOLAIRE TECHNICAL ASSESSMENT
NEW BUILDINGS INSTITUTE, INC. Page 70 JULY 2007 FINAL REPORT
compressor operation at its highest efficiency. If the Desert CoolAire unit can integrate a small but very well controlled auxiliary compressor cooling capability, it will then be able to serve both as a stand alone cooling unit and as a ventilation air only cooling unit in most western climates.
Other indirect evaporative cooling strategies propose to omit the compressor subsystem, and to let the auxiliary cooling be done by the associated existing DX units. This strategy will work to an extent, but it will be difficult to control the whole assembly of units to its most efficient. By including the compressor with the CoolAire that control issue is localized into a single unit where it can be most efficiently controlled.
The compressor cooling subsystem of this unit faces a unique circumstance: it has a limited output need of about 1.5 tons and it has a robust constant temperature air stream into which to reject heat (the exhaust or purge air stream). Under these favorable circumstances, the compressor cooling EER could reasonably be in the range of 15-20 (about three times the observed compressor EER). This potential performance is validated by other manufacturers (i.e. Freus) who state an EER of 17-19 at 95°F for their water cooled condenser operating under similar temperatures as a CoolAire with the condenser in the exhaust or purge air streams.
This field work has influenced the rationale for the use of the DX subsystem. The DX was originally intended just as full backup and as supplementary cooling. But now, it appears that a genuine hybrid evaporative /compressor unit is the best fit to the cooling mission. The most efficient hybrid configuration will employ very efficient and well controlled but small supplementary compressor cooling capability and it will de-emphasize the full backup cooling mode.
It is evident in this field test that this supplementary cooling load can be achieved with a much higher efficiency than can be achieved by a common air source DX unit alone. There is a real design synergy here: the evaporative component can be used to shield the DX system from the extreme ventilation driven cooling loads (which account for about one half the required installed tonnage), this in turn permits the DX system to be sized small enough that it can take advantage of the limited high efficiency opportunity provided by the exhaust or purge air streams.
If the hybrid system is proportioned properly it will perform better than the DX or HMX would have alone and the possibility of an overall operating EER of 20+ is a reasonable next generation design objective.
9.3 Design Changes Design changes currently under consideration based on the research and market factors are being evaluated by the manufacturer for impacts on cost, operation, installation, and energy efficiency. The project team is continuing to analyze different interactions and field data that will inform the preliminary list. Information to date resulted in the following list that is estimated to improve the overall unit efficiency to an EER of 20 or more and reduce cost and weight. The design changes under consideration for the next generation of the Desert CoolAire are:
• Reduce the cabinet size. The original cabinet size had additional space for the sensor and monitoring equipment. Elimination of that area plus length reductions associated with more precise airflow paths are planned in Gen2.
• Explore alternative airflow configurations to reduce static pressure and improve fan efficiency. As perspective, an efficient fan delivering an equivalent output in cfm and static pressure should require about 750 watts. Our field observations showed actual fan energy of about 1,400 Watts, indicating significant room for improvement. An important aspect of fan and airflow design is to maintain the pressure on the HMX core within its design range in order to minimize or eliminate water leaks. The design team is considering several approaches to lowering the overall fan energy.

DESERT COOLAIRE TECHNICAL ASSESSMENT
NEW BUILDINGS INSTITUTE, INC. Page 71 JULY 2007 FINAL REPORT
These include 1) incorporating by-pass dampers for non-cooling modes, 2) using multiple smaller fans, 3) using efficient direct drive fan configurations, and 4) planning low resistance airflow paths.
• Pass the return air through the HMX before it is exhausted from the building. This is a complex airflow configuration, but with multiple benefits. In principle, it can improve the evaporative cooling efficiency, it can lower the water use of the unit, it can provide some heat recovery during heating mode, and it can improve the compressor efficiency because the air temperature of the purge air stream and condenser can be slightly lowered. But this is a fundamental change and the benefits and costs have not yet been quantified. Some limited proof of concept tests is appropriate here.
• Reduce the compressor size. The monitoring showed a maximum need of 1.5 tons of cooling capacity to supplement the core. But the design team, for cost and market reasons, believes a 3-ton is the most likely next design size for the DX component. There is some question as to whether the compressor subsystem needs a true two stage compressor or a modulating scroll compressor. Whatever compressor is used, it will operate most of the time at about 1.5 tons output and this must therefore be its most efficient operating point.
• Reduce the gas pack size. The field monitoring generally showed very high supply air temperatures during heating mode. A smaller gas pack with an output of 50,000 BTU/hr instead of 100,000 BTU/hr would have been sufficient. But the Gen2 unit will have higher supply airflow and this will reduce the need to downsize the gas pack.
• Move the condenser to the exhaust air path. The exhaust air path is the theoretical best location for the condenser because it has the lowest available air temperature and a significant enough airflow to absorb the heat to be rejected by the condenser. However, if the return (exhaust) air is passed through the HMX then the condenser will remain in the purge air path. In principle the purge air path is not as ideal a location for the condenser as is the exhaust air path, but the other advantages associated with passing the return air through the HMX could outweigh the performance difference. If the option of passing the return air through the HMX is not pursued, then the condenser should definitely be placed in the exhaust air stream.
• Consider optimum capacity. The competitive market in equipment size and capacity for the CoolAire may be 6-7 ton units based on the CoolAire characteristics and capacity at hot conditions.
Although the original prototype revealed several challenges, the substantial peak demand savings, ability to control for DX lock-out and the market attraction of 100 percent outside air and promising outlook for Gen2 were found to be sufficiently compelling by the sponsors to warrant ongoing investigation of the Desert CoolAire.
The revised core, water control box and control changes are being tested in the summer of 2007. At the time of this report publication new chemically treated cores have been installed in the current prototype units and July 2007 field inspections found them completely clear of biological growth. Based on this encouraging result and ongoing monitoring the work on the Gen2 design will continue on the topics above. A next generation unit incorporating the final set of redesign options will then need field research testing in the summer of 2008 with product availability targeted for 2009. SMUD has already expressed interest in sponsoring deployment and testing of Gen2 systems.
9.4 Conclusions Targeting new commercial construction appears to be the best opportunity for this technology. Improved energy efficiency, increased ventilation, tax and green program benefits, and the ability to meet all cooling needs – especially during prolonged hot periods when standard systems under perform - will be attractive to HVAC system designers and particularly to leading companies striving for “green” new

DESERT COOLAIRE TECHNICAL ASSESSMENT
NEW BUILDINGS INSTITUTE, INC. Page 72 JULY 2007 FINAL REPORT
commercial construction. The size, weight and access to water will not be extraordinary limitations in a new construction system design.
The significant demand savings will be of high interest to the majority of utilities due to system and generation constraints during peak. The demand benefit to the customer varies dependant on the pricing structure from the utility associated with demand/time-of-use charges. These charges place a premium price for power during peak and are increasingly a common part of commercial rate structures with costs that strongly favor consideration of this type of system. In addition, the utility and owner will both benefit from the opportunity to lock out the DX on a system that continues to provide a very reasonable level of cooling.
Steps remain between these lab, field and modeling findings and a competitive market product. The economic analysis of component and manufacturing costs will be forthcoming and the next phase of field research will refine a Gen2 prototype leading to field testing of what is hoped to be the pre-market design with final product availability in 2009.
This limited demonstration experience and simulation runs show that a refined version of the Desert CoolAire unit could be designed to operate with an EER of 20+, and it could be designed to operate with a hot weather demand savings of 3-4 kW. Such performance is markedly superior to that offered in the current market or in the increasingly efficient higher CEE tiers. This new technology could be a key player, in combination with other advanced rooftop products and strategies, in accomplishing the aggressive goals for major reductions in commercial cooling energy use in the western U.S.