Embed Size (px)
Citation preview

Executive Council Meeting
Charter SELPA
Desert/Mountain
Jenae Holtz, CEO
Chair
CAHELP JPA
17800 Highway 18
Apple Valley, CA 92307
Phone: (760) 552-7700
Fax: (760) 242-5363
http://dmselpa.org

CALIFORNIA ASSOCIATION OF HEALTH AND EDUCATION
LINKED PROFESSIONS JOINT POWERS AUTHORITY (CAHELP JPA)
DESERT/MOUNTAIN CHARTER SELPA
EXECUTIVE COUNCIL MEETING
AGENDA
January 24, 2017 ∙ 11:00 a.m.
Desert/Mountain Educational Service Center
17800 Highway 18, Apple Valley, CA
1.0 CALL TO ORDER
1.1 Adoption of Agenda – January 24, 2017
1.2 Adoption of Minutes – October 26, 2016
2.0 COUNCIL MEMBERS’ COMMENTS/REPORTS
This is the time during the meeting when the California Association of Health and
Education Linked Professions (CAHELP) staff is prepared to receive concerns/requests
regarding items on this agenda or any school-related special education issues. Discussion
will include special education policies and procedures as they relate to district coordination
and implementation of the Charter SELPA Local Plan.
3.0 CHIEF EXECUTIVE OFFICER’S REPORTS
3.1 Public Policy Institute of California
3.2 Governor’s Budget
3.3 Chapter 22
3.4 New Membership Applications
4.0 PROGRAM MANAGERS’ ITEMS
4.1 Professional Learning Updates
4.2 Due Process Updates
4.3 Fiscal Updates
5.0 OTHER
Desert/Mountain Charter SELPA
Executive Council Meeting– Agenda
January 24, 2017 - Page 2 of 2
6.0 ADJOURNMENT
NEXT MEETING: Wednesday, March 29, 2017, in the Desert/Mountain Educational Service
Center, 17800 Highway 18, Apple Valley.
Individuals requiring special accommodations for disabilities are requested to contact Daria
Raines at (760) 955-3555, at least 24 hours prior to the date of this meeting

CALIFORNIA ASSOCIATON OF HEALTH AND EDUCATION
LINKED PROFESSIONS JOINT POWERS AUTHORITY (CAHELP JPA)
DESERT/MOUNTAIN CHARTER SELPA
CHIEF EXECUTIVE OFFICER COUNCIL MEETING
MINUTES
Wednesday, October 26, 2016
12:30 p.m.
Desert / Mountain Educational Service Center
17800 Highway 18, Apple Valley, CA
CEO COUNCIL MEMBERS PRESENT:
Kate Bean Aveson Global & Aveson School of Leaders
Debbie Tarver Desert/Trails Preparatory &
LaVerne Elementary Preparatory
Denise Griffin Encore Jr./Sr. High & Encore Riverside
John Griffin Encore Jr./Sr. High & Encore Riverside
Lauren O’Neill Odyssey Charter
Tim Smith Taylion Academy High Desert
STAFF PRESENT:
Janet Crabtree CAHELP
Denise Edge D/M SELPA
Maria Gallegos D/M SELPA
Jenae Holtz CAHELP
Linda Llamas DMCC
Adrienne Shepherd D/M SELPA
Daria Raines D/M SELPA
1.0 CALL TO ORDER
The regular meeting of the Desert/Mountain Charter SELPA Chief Executive Officers
(CEO) Council Meeting was called to order by Jenae Holtz, Chairperson, at 12:36 p.m., in
the Desert/Mountain Educational Service Center, Apple Valley, CA. The meeting Agenda
for October 26, 2016 and the meeting Minutes for March 30, 2016 were adopted as
presented.
2.0 COMMITTEE MEMBERS’ COMMENTS/REPORTS
None.
Desert/Mountain Charter SELPA
Chief Executive Officer Council– Minutes
October 26, 2016
- Page 2 of 7
3.0 CHIEF EXECUTIVE OFFICER’S REPORTS
3.1 Welcome New Member
Jenae Holtz welcomed Pathways to College to the D/M Charter SELPA. She stated Pathways to College CEO Dr. Sonya Joyner sent her regrets for being unable to attend today’s meeting due to needing to address an unanticipated situation at the school site.
3.2 Policies and Procedures
Jenae Holtz presented the draft revisions to the Charter SELPA for Policies and
Procedures, Chapters 1-9 and the Charter Fiscal Allocation Plan. Jenae stated all
chapters are being revised to indicate language that is specific to the Charter SELPA
members. The Desert/Mountain Charter SELPA has completed the drafts on the
aforementioned for review today.
Janet Crabtree presented a crosswalk comparing the existing language to the revisions
made in the Fiscal Allocation Plan. She stated this chapter will be numbered once all
of the Policy and Procedure revisions are finalized.
Discussion on the “high risk” category and what happens should an LEA experience ongoing declining ADA/enrollment occurred. Janet stated the SELPA will review the LEA’s audit findings. Janet explained the CEO Council would collectively discuss whether a member is deemed “high risk”; and substantial declining enrollment is one criteria of “high risk” status. Jenae stated there would be ongoing conversations with the LEA to discuss interventions and the LEA’s plans prior to making recommendations to the Governance Council. Janet explained with the revisions to the allocation plan either $250,000 or 5% of the
annual contributions (whichever is greater) would be held in the risk pool. At year-end
the balances will be reported to the CEOs for discussion o make the decision on the
appropriate use of the funds should there be an excess in the risk pool. The Governance
Council would then take action based on the recommendation of the Charter SELPA
CEO Council.
The CEO Council agreed to amend the language to include “…funds in excess of the threshold will be used as recommended by the CEO Council and the Governance Council”. Janet continued her review of the changes in the fiscal allocation plan. The members agreed to the procedures for the allocation of reimbursements for nonpublic school/nonpublic agency costs based on a master contract through the SELPA with the agency as presented. Members also agreed to the SELPA reviewing any contracts
Desert/Mountain Charter SELPA
Chief Executive Officer Council– Minutes
October 26, 2016
- Page 3 of 7
established independent of the SELPA’s master contract process. If the agency is not CDE certified, the LEA cannot utilize special education dollars to pay for the services.
Denise Edge stated if a contractor is providing related services for a student on an IEP,
the provider must be CDE certified or be an employee. Denise further stated NPS/NPA
providers have to be recertified by the CDE annually in October.
A discussion followed on the DMCC providing educationally related mental health
services (ERMHS) outside of San Bernardino County.
Debbie Tarver stated the question of how the SELPA and DMCC staff would be able
to continue providing supports and services was one of the concerns initially expressed
when discussion of the potential expansion of the Charter SELPA to include members
in outlying areas occurred.
Jenae stated part of the issue with providing ERMHS outside of San Bernardino County
is the lack of ability to bill Medi-Cal for funding to supplement the costs of providing
ERMHS services. Jenae stated staffing is an issue but the SELPA and DMCC staff will
further discuss how the DMCC can provide support for members in out-of-geographic
areas. Jenae stated the DMCC will assist with locating qualified providers for
behavioral health services for LEAs outside of San Bernardino County.
Janet concluded her presentation of the fiscal allocation plan revisions.
Jenae stated the CEOs may continue to review these policies and procedures at their
leisure. Should there be any recommendations for changes, Jenae requested the CEOs
notify the SELPA as soon as possible. Jenae concluded if no other changes are
necessary, these chapters will be presented to the Governance Council for approval on
November 18, 2016.
3.3 Results of Potential Membership Informational Meeting
Jenae Holtz reported two organizations attended the October 18, 2016 Potential
Membership Informational Meeting. She stated Opportunities for Learning (OFL) a
subsidiary of Options for Youth (OFY) was denied membership last year. OFL
Representatives attended the meeting and expressed interest in making application
again. Jenae stated the denial last year was based on concern for the provision of
services for children with disabilities, which they indicated they have made
improvements based on the recommendations made at the time of the initial denial.
Jenae stated representatives from Volunteers for America also attended the meeting.
Volunteers for America are based in El Centro and are planning to establish a location
in San Bernardino County. Jenae stated the SELPA will conduct site visits once the
applications are received. Jenae concluded the SELPA will include the Charter CEOs
in the invitation when the site visits are scheduled.
Desert/Mountain Charter SELPA
Chief Executive Officer Council– Minutes
October 26, 2016
- Page 4 of 7
3.4 MOU DMCS and DMCC
Jenae Holtz presented the Memorandum of Understanding (MOU) between the Charter SELPA and the D/M Children’s Center (DMCC). Jenae stated the MOU was approved by the Governance Council in September.
Denise Edge explained the initial MOU was established between the D/M SELPA and
the DMCC in 2004. She stated it was necessary to establish a separate MOU between
the Charter SELPA and the DMCC to protect the LEA, the Charter SELPA and DMCC.
3.5 OCR Complaint
Jenae Holtz reported a complaint against the SELPA was filed with the Office of Civil
Rights (OCR) alleging the website is noncompliant under the Americans with
Disabilities Act (ADA). The organization that filed the complaint against the SELPA
has also filed against several other organizations. Jenae stated the SELPA signed a
resolution agreement and is actively working on corrections to the issues of concern.
She stated a committee has been formed and new policy is being written for ADA
compliance. She concluded the SELPA is considering scheduling a workshop with
information technology support to provide tips on web access compliance for LEA
members.
4.0 PROGRAM MANAGERS’ REPORTS
4.1 Professional Learning Guide
Jenae Holtz presented the 2016-17 CAHELP Professional Learning & Services Guide. She stated the guide is posted on the website. Jenae concluded CEOs may contact Corinne Foley’s office at the SELPA should they have questions or need additional information about upcoming trainings.
4.2 I-MTSS Symposium
Jenae Holtz announced the February 15, 2017 Interconnected-Multi Tiered Systems
of Support (I-MTSS) Symposium. Jenae stated the cost is $200 per person and
includes two presenter books, am/pm refreshments and lunch. Jenae concluded online
registration is open and individuals may contact the SELPA for additional information
about the symposium.
4.3 DMCS 2015-16 Year End Balances
Janet Crabtree presented the 2015-16 year-end balances. Receipt of the 2016-17 award
is pending. There is an Alternative Dispute Resolution (ADR) grant of $16,571

Desert/Mountain Charter SELPA
Chief Executive Officer Council– Minutes
October 26, 2016
- Page 5 of 7
available. Janet stated these grant funds can be used to pay registration fees for the
upcoming ADR conference in March 2017. Janet stated currently there is a $293,611
ending balance of state funded mental health dollars.
Jenae commented it is important to spend the mental health dollars. The state is
monitoring the use of these funds and may consider withholding funding in the future
if it appears they are not needed.
A discussion followed on how the mental health dollars can be utilized.
Jenae stated the funds cannot be used for hiring educational psychologists or ABA
services but can be used for professional development for instruction in understanding
and identifying mental health needs in students. She stated these funds are allocated
based on ADA and should be allocated in the same manner. She further stated the
SELPA will have a discussion on the appropriate use of these dollars and send
information to the CEOs prior to the end of November. Jenae then explained what
happens with AB114 dollars in the SELPA. She stated AB114 dollars remain with the
SELPA and the DMCC provides all services for all LEA members geographically
located within the Desert/Mountain Region. She stated since adding members outside
the geographic area, the SELPA will need to prepare a proposal for members to make
the services equitable for all members.
Janet then stated in the revised allocation plan, the set-aside pool is now referred to as
the insurance pool. The balance is $271,751.00.
Denise Griffin, Encore Jr./Sr. High School, suggested moving the overage (in excess
of the $250,000) from the insurance pool over to the risk pool to cover any high legal
expenses.
Having the consensus of all members present, Jenae stated the SELPA will take this
proposal to transfer $21,000 from the insurance (set-aside) pool to the risk pool, to the
Governance Council for approval in November.
Lauren O’Neill inquired whether utilizing the risk pool on due process will
automatically move an LEA member into the high risk category of the allocation plan.
Jenae stated it depends on the circumstances surrounding the need for utilizing the
funds and whether there is a pattern.
Jenae stated expenditures for placement at a residential treatment center (RTC) are paid
from federal dollars first. Jenae concluded the SELPA will consider the potential for
an RTC expense when writing the proposal for the Governance Council to transfer the
excess dollars from the insurance pool to the risk pool.

Desert/Mountain Charter SELPA
Chief Executive Officer Council– Minutes
October 26, 2016
- Page 6 of 7
4.4 MOE Subsequent Year Rule & MOE Timeline
Janet Crabtree reported on the maintenance of effort (MOE) Subsequent Year Rule
imposed by the California Department of Education (CDE). Janet explained under the
Subsequent Years rule LEAs cannot compare 2015-16 years’ special education
expenditures to the prior year if the LEA did not pass MOE in one particular category.
She stated LEAs may use one of the following for methods: combined state and local
expenditures, combined state and local expenditures on a per capita basis, local
expenditures only, or local expenditures only on a per capita basis. Janet explained in
prior years the CDE completed the Subsequent Years test on LEAs and was intending
to bill LEAs that were noncompliant; however, the issues have been resolved and the
CDE will not bill at this time. Janet also stated this may not apply to the new LEA
charter members for this year.
4.5 Submission of Charter’s Year End Actual & Audit Report
Janet Crabtree presented a schedule of the financial reports and due dates. Janet
requested LEA members to submit a copy of the reports they share with the authorizing
LEA to assist the SELPA in maintaining current information.
4.6 Meeting of Charter School Finance Representative
Janet Crabtree stated based on prior discussions, the SELPA will plan a separate
meeting for charter financial representatives from both the D/M SELPA and the Charter
SELPA to discuss issues relative only to charters.
Jenae stated the meeting could follow the Governance Council meeting in San
Bernardino.
Debbie Tarver suggested holding the charter fiscal representative meeting following
the Finance Committee meeting; just before the CEO council meeting.
4.7 Due Process Summary
Denise Edge presented the Charter SELPA Due Process Summary. Denise reported the
Charter SELPA had two due process filing this year. One case was settled and one is
going to mediation next week. Denise then shared highlights from the Office of
Administrative Hearings (OAH) 4th Quarter Report on due process complaints filed
with the OAH. Denise stated 1,172 cases closed during the 4th quarter. Year-to-date 41
cases in hearing resulted in split decisions. She concluded the most common issues
raised during the 4th quarter were related services.

Desert/Mountain Charter SELPA
Chief Executive Officer Council– Minutes
October 26, 2016
- Page 7 of 7
Denise Griffin noted Encore Junior/Senior High School has been a member since
2013/14 and Encore Riverside since 2015/16. She stated the due process report has it
reversed.
5.0 INFORMATION ITEMS
5.1 2016/17 Meetings
Jenae Holtz presented the meeting schedule for 2016/17. She noted the schedule will
be updated to reflect the date change from the 18th to the 24th for the January meeting.
Jenae concluded the CEOs will receive an updated calendar invitation for the January
meeting.
6.0 OTHER
Jenae noted the CDE is reorganizing some of their departments and their processes. There is a new director of special education at the CDE. Jenae asked the CEOs to notify the SELPA should they receive any compliance complaints or other communication from CDE to ensure the SELPA is informed.
7.0 ADJOURNMENT
Having no further business to discuss, the meeting was adjourned at 2:43 p.m.
NEXT MEETING: Tuesday, January 24, 2017, at the Desert Mountain Educational Service
Center, 17800 Highway 18, Apple Valley.
Individuals requiring special accommodations for disabilities are requested to contact Daria
Raines at (760) 955-3555, at least 72 hours prior to the date of this meeting.
NOVEMBER 2016
Laura Hill, Paul Warren, Patrick Murphy, Iwunze Ugo, and Aditi Pathak
Supported with funding from the Dirk and Charlene Kabcenell Foundation and the Stuart Foundation
Special Education Finance in California

© 2016 Public Policy Institute of California
PPIC is a public charity. It does not take or support positions on any ballot measures or on any local, state, or federal legislation, nor does it endorse, support, or oppose any political parties or candidates for public office.
Short sections of text, not to exceed three paragraphs, may be quoted without written permission provided that full attribution is given to the source.
Research publications reflect the views of the authors and do not necessarily reflect the views of the staff, officers, or board of directors of the Public Policy Institute of California.
Introduction 5
Special Education Funding in California 6
Special Education Funding and the Distribution of Students with Disabilities 10
How SELPAs Affect Funding and Service Delivery 18
Special Education in Other States 24
Alternative Approaches to Special Education Finance and Structure 25
Conclusion 30
References 31
About the Authors 33
Acknowledgments 33
Technical appendices to this paper are available on the PPIC website.
California’s system of special education served about 718,000 students in 2014–15, or about 11.5 percent of the K–12 population. It is expensive, consuming some $12 billion in federal, state, and local dollars annually. And special education operates within a legal framework that sets it apart from the rest of the K–12 system.
The state’s enactment of the Local Control Funding Formula (LCFF) in 2013 consolidated most state categorical programs into district base grants in order to move decision making to the local level. However, special education was preserved as California’s largest remaining categorical grant operating mostly outside the LCFF governance framework.
This report examines California’s special education finance system in light of the principles that underlie LCFF—local control and accountability, transparency, and equity. It also draws on the findings of the 2015 Statewide Special Education Task Force report, which makes several recommendations to improve California’s system. The task force envisioned a unified system in which general and special education are part of a seamless program of student services.
California’s main program for financing special education, AB 602, was developed nearly two decades ago. We find several positive elements in AB 602. Most importantly, because it distributes funds based on census counts ofall students, not counts of students with special needs, it avoids creating financial incentives to identify students for special education services. In other respects though, AB 602 falls short:
It funds local programs at widely different rates.
The overall funding level has not kept pace with rising numbers ofstudents with disabilities or the growing share of high-cost disabilities.
Distributing AB 602 funds through Special Education Local PlanningAreas (SELPAs) runs counter to LCFF principles of transparency, localcontrol, and accountability.
In order to align California special education with the principles of LCFF and move towards a more seamless system of K–12 education, we recommend:
Funding districts directly including special education funding as part of adistrict’s LCFF allocation.
Preserving AB 602’s census count method of distributing specialeducation dollars, but developing ways to make funding more equal ona per-student basis. A plan to equalize funding across districts wouldresult in an additional $670 million every year in special educationspending. This would partly address rising special education caseloadsand the increased incidence of severe disabilities that has occurred overthe past decade.
CONTENTS
SUMMARY
PPIC.ORG Special Education Finance in California 4
Developing new ways to protect small districts and charter schools from extraordinary special education costs by encouraging pooling arrangements or insurance programs.
Better support for local infant and preschool special education programs, ensuring that the needs of young children with disabilities are served.
We believe these changes would help achieve the Task Force’s vision of providing special education services as part of a coordinated set of student supports. In addition, our recommendations will take fuller advantage of LCFF’s principles of accountability and local control.

PPIC.ORG Special Education Finance in California 5
Introduction
Special education in California is designed to improve schooling for the nearly 12 percent of students in the state with special needs. Two major questions are raised by the way special education is organized and financed in the state: Could special education funding be better aligned with (1) the principles of local control and accountability laid out in the Local Control Funding Formula (LCFF), California’s system for financing schools, and (2) the ideal of seamless integration of special and general education called for by California’s 2015 Statewide Special Education Task Force?
California special education operates in a unique legal framework. Federal law requires districts to meet the needs of each student with disabilities, including physical, mental, emotional, and processing disorders. California’s schools and districts spent over $12 billion on special education services in the 2014–15 school year, supported by the state’s largest remaining K–12 categorical funding program. In 2014–15, the state appropriated $3.2 billion in General Fund support for special education. Federal funds supplied an additional $1.2 billion, with the remaining $7.6 billion coming from local contributions, according to the California Department of Education. State funding is categorical because it requires districts and county offices to spend the money only on the services identified in the Individualized Education Programs (IEPs) of students with special needs.
The state funds special education services through Special Education Local Planning Areas (SELPAs). SELPAs coordinate local services and allocates funding to programs and districts. The state’s 133 SELPAS include some that operate in a single district and others that serve multiple districts. School districts are responsible for identifying students needing services, developing IEPs, and determining the settings in which students are educated.
LCFF’s enactment in 2013 inaugurated a different approach to K–12 governance in California, emphasizing local decision making. To foster greater local control, LCFF consolidated most state categorical programs into district base grants. The act also sought to promote greater accountability over spending and student performance. However, special education remained apart from the LCFF and largely outside its governance structure.
As LCFF was drafted, California’s State Board of Education formed a task force to make recommendations about how to help schools improve results for special education students. The Statewide Special Education Task Force report, published in 2015, called for additional funding, a stronger emphasis on early intervention, improved teacher training, and research-based approaches to education. The need to integrate special education with the rest of the K–12 program was a recurring theme. The report found “that significant barriers to school success for students with disabilities have grown out of [the] unfortunate evolution of two separate ‘educations.’”1 The task force envisioned a “unified” system, where general and special education would be part of a “seamless” system of student support (Statewide Special Education Task Force 2015).
LCFF’s underlying objectives and the issues raised by the task force provide an important starting point for examining whether California’s system of special education financing provides adequate funding and distributes funds appropriately. To explore these questions, this report is divided into several sections: (1) how California’s special education funding system is structured; (2) how well California special education funding aligns with the distribution of students with disabilities; (3) how California’s system of funding special education through SELPAs affects program quality and accountability; (4) how other states organize and finance special education; (5) recommendations for how California can improve special education organization and funding.
1 California's Statewide Task Force on Special Education. 2015. One System: Reforming Education to Serve All Students, p 8.

PPIC.ORG Special Education Finance in California 6
Special Education Funding in California
Special education funding is meant to pay the additional costs of serving students with disabilities. The California Legislative Analyst’s Office estimates that educating students with disabilities costs on average more than twice as much as educating general education students (LAO 2013). Three main sources finance California special education services: the federal government provides 9 percent, the state 29 percent,2 and local school districts 62 percent of total funding.
FIGURE 1 Most special education funding comes from local contributions
Sources: Authors’ calculations from CDE special education finance data, 2014–15
Notes: Shares are based on total state funding by source. California state special schools, CHELPAs, and the Los Angeles Court Schools SELPA are excluded.
Virtually all state funding is delivered through four formulas, shown in Table 1. AB 602, California’s main program for financing special education, distributes 80 percent of state special education funds. Its funding formula is based on a count of all enrolled K–12 students in each SELPA, not on the number of students with disabilities.3 This method is referred to as a census count, or average daily attendance (ADA) count.
TABLE 1 AB 602 distributes most state special education funding
2014–15 amount
(in millions) Formula Restrictions
AB 602 $2,587 Census Special Education costs
Mental health 357 Census Mental health costs of
special education students
Out-of-home care 146 Local capacity of licensed
community institutions Special education costs
Infant programs 71 Units Special education services for infants
Other 64
Total $3,225
SOURCES: Data from 2014–15, California Department of Education.
NOTE: Census refers to a complete count of all student attendance in grades K–12.
2 About 3% of state funding is offset by deductions from county office of education property tax revenues, an amount considered a state obligation in Figures 2 and 3. 3 AB 602 refers to the legislation that created the formula, enacted in 1996.
9%
31%
60%
Federal funding
State funding
District funding

PPIC.ORG Special Education Finance in California 7
The census formula was designed to allow flexible service delivery and avoid giving districts a monetary incentive for identifying students as having disabilities. Concerns that the previous funding formula created incentives to identify students with special needs4 and placed special education students in unnecessarily restrictive and expensive settings led to the enactment of AB 602. Federal law requires students with special needs to be educated in the least restrictive environment possible.5
The AB 602 formula was based on the conclusion that funding SELPAs using ADA, though imperfect, was the best option. This conclusion reflected the fact that educators have significant latitude in identifying students with special needs (Legislative Analyst’s Office et al 1995). It might seem that AB 602 creates a disincentive to identify students with special needs since funding does not rise as the number of students with disabilities or the cost of serving them increases. However, districts are legally obligated to identify children with special needs, and spend AB 602 funds solely on the educational needs of students with disabilities. Since most districts spend much more on special education than the funds they get from the state and federal governments, it is not clear that the fixed funding levels plays a major role in local program decisions. The sizable local share of costs, however, give them incentives to serve students with special needs efficiently.
Three other California programs fund special education:
Mental health funds. In 2011, California transferred responsibility for identifying and providing mental health services to students with disabilities from county mental health agencies to school districts. This funding, which must be used only for mental health needs of students with IEPs, is also based on census data.
Out-of-home care. This program adjusts the AB 602 formula to account for facilities like group homes and foster family homes. In general, SELPA allocations are based on the number, type, and size of such facilities in their districts. Funds may be spent for any special education purpose.
Infant programs. This program is based on the number of infants served and their educational settings. Infants are defined as children with identified disabilities under age 3.
How well have state funding programs worked? California’s four major programs for funding special education have been in place for at least a decade, but each has issues that should be addressed.6
AB 602 funding has not kept up with numbers of cases Over the past 10 years, AB 602 funding has not kept pace with the growth and change in the population of students with disabilities:
The number of students with IEPs and their share of the school population began to increase in 2010 after many years of being relatively flat. At the same time, overall K–12 student attendance, which drives funding, did not rise. As a consequence, total state funding for students with special needs has fallen in both nominal and constant dollars. Figure 1 shows that inflation-adjusted AB 602 funding dropped from a peak of $3.8 billion in 2007 to $3.2 billion in 2014. On a per-student basis, special education funding fell from $4,900 in 2007–08 to $4,478 in inflation-adjusted dollars (see Technical Appendix Figure A.2).
4 More recent research finds that this still is an issue in states that fund special education based on counts of students with disabilities rather than ADA. For example, Morrill (2016) finds states that pay districts based on the number of students with special needs have higher rates of attention deficit hyperactivity disorder (ADHD) than states that do not. The author argues that ADHD diagnoses are influenced by schools and relatively inexpensive to treat. 5 Least restrictive environment means that student with special needs should receive as much of their education as appropriate with the general student population. 6 See Technical Appendix A for additional analysis of these programs.

PPIC.ORG Special Education Finance in California 8
FIGURE 2 Inflation-adjusted state special education funding has decreased while number of students with disabilities has increased
SOURCE: CDE CASEMIS and AB 602 funding, including state property tax used in AB 602 funding distribution calculations and the Out-of-home care program.
NOTE: Includes ages 3–22.
The mix of disabilities has changed substantially, increasing local special education costs. Over the past decade, the number of students with relatively low-cost disabilities has fallen while the number with more expensive disabilities has risen. Autism offers an example. California’s 1.3 percent autism rate among K–12 students in 2012–13 was higher than the 1 percent national rate. Autism is increasing faster in California than in the rest of the United States. From 2001–02 to 2013–14, California’s autism caseload increased 5.4 times, while cases in the rest of nation increased 4.2 times. (NCES 2016 and Kids Data 2015). At both the state and national level, rising autism has been accompanied by shifts away from intellectual disability and specific learning disability diagnoses (CASEMIS data and Zablotsky et al 2015).
We estimate special education costs increased $1.1 billion between 2006–07 and 2015–16 based on national data on the average cost of educating students by type of disability.7 Our estimate reflects both the overall increase in the number of students with disabilities and the trend towards more expensive disabilities. However, this estimate should be viewed with caution since disability costs are based on 1999–2000 spending (Augenblick, Palaich and Associates 2011). In addition, it is not clear how well the national data reflect the cost of serving California students. Despite these qualifications, AB 602 funding has clearly not kept up with the escalating demands on districts.
Funding is not equal The state never achieved its goal of equalizing special funding rates, and wide differences in SELPA rates exist. Originally, AB 602 grants combined California and federal special education funds in a single allocation. The state tried to narrow the differences in SELPA funding rates. However, the state never succeeded in funding SELPAs equally on an ADA basis. In the early 2000s, the federal government required California to separate state and federal funds, which led to the current situation. Figure 2 shows SELPA variation in per-pupil AB 602 funding in 2014–15.
7 This calculation is explained in Technical Appendix A.
650
660
670
680
690
700
710
720
730
3,000
3,100
3,200
3,300
3,400
3,500
3,600
3,700
3,800
3,900
2005 2006 2007 2008 2009 2010 2011 2012 2013 2014
Stu
den
ts w
ith
dis
ab
ilit
ies (
tho
usan
ds)
AB
602 F
un
din
g (
2014 d
oll
ars
, m
illi
on
s) AB 602 funding
Students with disabilities

PPIC.ORG Special Education Finance in California 9
FIGURE 3 The top fifth of SELPAs by per-pupil funding receive 40 percent more funding that the bottom fifth
SOURCE: CDE CASEMIS and AB 602 funding data, 2014–15.
NOTES: AB 602 funding including out-of-home care and state property tax. The Los Angeles Court School SELPA is excluded.
The highest-funded SELPA received more than twice as much AB 602 funding per pupil as the lowest-funded one, and the top tenth of SELPAs receives $289 more per pupil than the bottom 90 percent, a difference of more than 50 percent.
AB 602 funds are like base funding for special education Many special education educators point out that school district contributions to special education have increased significantly while AB 602 funds have not grown at the same rate as LCFF funding. Full funding of LCFF has been the state’s priority since 2013. Since then, per-pupil allocations for LCFF’s base, supplemental, and concentration funds8 have posted large increases. By contrast, AB 602 special education funding has stayed relatively constant primarily for two reasons: (1) cost-of-living adjustments have been small because the inflation rate is low, and (2) overall ADA has declined slightly.
Educators we interviewed felt the disparity between LCFF and AB 602 created problems at the local level. For instance, significant increases in per-pupil LCFF funding prompts both special education and other teachers to expect salary increases. But flat special education funding means districts pay for increases in special education compensation out of LCFF funds. This creates the impression that local special education costs are out of control—especially if other special education costs are rising.
State and federal laws impose largely nonnegotiable special education mandates on districts. For this reason, AB 602 was intended to treat special education costs like other LCFF base costs. By dedicating most of California’s new K–12 funds to LCFF, the state is failing to recognize the interaction between increases in LCFF and special education costs at the local level. Thus, the system needs to find a way to link special education financing with
8 Base grants are the same by grade level of pupil. Supplemental grants are an additional 20% per unduplicated English Leaner, economically disadvantaged, or foster youth student. Concentration grants are an additional 50% for each unduplicated student over 55% of a school district’s population.
0
200
400
600
800
1,000
1,200
1,400
Lowest Bottom 20% 20-40% 40-60% 60-80% 80-90% Top 10% Highest
AB
602 f
un
din
g p
er
AD
A (
$)
AB 602 funding rank

PPIC.ORG Special Education Finance in California 10
other school funding. One way to do that is to tie special education funding to the LCFF so that when base, supplemental, and concentration dollars go up, special education funding rises as well.
Other state formulas raise issues While the three other principal state special education funding formulas appropriate far fewer dollars than AB 602, they play an important role in helping districts pay for services. These programs also need attention.
Mental health funds are provided separately. These funds may only be used to pay for mental health services for students with IEPs, a requirement that made sense when program responsibilities were transferred from county mental health services agencies to school districts. This restriction should now be reassessed. The categorical nature of mental health funds runs counter to the LCFF principle of local control. This is especially important as the funds are allocated using the same census formula as AB 602, but it is unclear whether that genuinely reflects local need for mental health services. Plus, this is the only category of special education services the state funds separately. Many special education administrators argue the program unnecessarily restricts their ability to use the funds most efficiently.
The Out-of-Home Care formula is threatened by other program changes. Changes in the licensing of residential foster care facilities by California’s Department of Social Services may force the state to modify or eliminate the Out-of-Home Care formula. A new state law is attempting to phase out these institutions. In the meantime, the law has eliminated classifications the Out-of-Home Care formula uses to distribute funds. During our review, we found that the formula distributes more funding than can be justified by the number of students living in these licensed community institutions. In the long run, changes in the foster care system will determine whether the Out-of-Home Care formula remains necessary.
Infant and preschool funding formulas have problems. Federal law requires districts to provide special education services to children under age five. The Statewide Special Education Task Force called for more emphasis on early services to children and for better-funded infant and preschool programs because they provide long-term benefits to children with disabilities. However, infant funds are not available to all districts and allocations are based on an outdated formula. For preschool, districts receive no base funding for three-to-four year olds. As a result, when pre-Kindergarten caseloads rise faster than K–12 ADA, as they did over the past decade, special education costs grow quickly. The state needs to consider how to support these programs and ensure that all eligible students receive services.
The state special education funding formulas are designed to avoid over- or misidentification of students with special needs. However, the categorical nature of the funds makes it difficult for districts and SELPAs to spend the money flexibly and makes integrating special needs and general education students more challenging. Moreover, funding is not distributed equally to SELPAs, despite the intent of AB 602. These issues raise questions of whether California’s system for funding special education is properly aligned with LCFF principles.
Special Education Funding and the Distribution of Students with Disabilities
Federal law grants students with disabilities a right to educational services. Districts identify students with disabilities, evaluate whether those disabilities interfere with each student’s education, and create an Individualized Education Program that spells out services to be provided. Students and parents can appeal district

PPIC.ORG Special Education Finance in California 11
decisions through a state hearing process or, ultimately, in court. This entitlement to services strongly shapes the size, scope, and cost of special education.
In 2014–15, special education served some 718,000 California students, including 54,000 infant and preschool-age students with special needs and 14,500 students over 18 but under 22.9 About 11.5 percent of K–12 students received special education services. Disabilities are classified in 13 categories. Figure 4 shows the share of students with special needs in the largest categories. The most common is specific learning disability,10 followed by speech and language impairment. These account for more than 60 percent of special education students. Other disabilities affect relatively few students. For instance, emotional disturbance accounts for about 3.4 percent of special education students, or 24,000 students statewide.11
FIGURE 4 Two disability categories represent more than half of California students with special needs
SOURCE: California Department of Education, special education enrollment, 2014–15.
NOTES: Other disabilities include orthopedic impairment, hard of hearing, multiple disability, visual impairment, deafness, traumatic brain injury, established medical disability, and deaf-blindness.
The AB 602 formula, based on the total number of K–12 students, assumes that all SELPAs face roughly the same challenges. The actual distribution of students with special needs shows that is not the case. Here we look at the distribution in three ways: overall incidence; the share of students with disabilities who are also high-needs, including English Learner (EL), free and reduced price meals eligible,12 and students with disabilities that are typically expensive to serve (with “severe” disabilities).13
9 Under federal law, students with special needs may attend school until they reach age 22. 10 Specific learning disability means a disorder in one or more of the basic psychological processes involved in understanding or using spoken or written language that may manifest in an imperfect ability to listen, think, speak, read, write, spell or do mathematical calculations. It can include perceptual disabilities, dyslexia, and other conditions. (California Education Code, Sec. 56337) 11 Seven other categories account for only 5.6% of special education students. These are orthopedic impairment, hard of hearing, multiple disability, visual impairment, deafness, traumatic brain injury, established medical disability, and deaf-blindness. 12 The Local Control Funding Formula calls high-needs students “unduplicated” because students are not double or triple counted if they are in more than one category. When we refer to high-need students, we use the term interchangeably with unduplicated. 13 The California Department of Education defines “severe” disabilities as including autism, blindness (including visually impaired), deafness (including hard of hearing), orthopedic impairment, serious emotional disturbance, intellectual disability, traumatic brain injury, and multiple disabilities.
0%
5%
10%
15%
20%
25%
30%
35%
40%
45%
Specificlearning disability
Speechor languageimpairment
Autism Other healthimpairment
Intellectualdisability
All otherdisabillties
Emotionaldisturbance
Perc
en
t o
f sp
ecia
l ed
ucati
on
stu
den
ts

PPIC.ORG Special Education Finance in California 12
Overall incidence of students with special needs Figure 5 shows the share of the K–12 population identified as students with disabilities varies widely across the state. Among SELPAs, the share ranges from 7 to 17 percent, with an average of 12.14 At the county level, the range is 7.6 to 16.8 percent. In approximately one-fifth of counties, more than 13 percent of students are identified as having a disability.
This distribution suggests the census formula may overfund some SELPAs and underfund others. However, this mismatch between funding and need was understood to be a potential consequence of the census enrollment model when it was enacted in 1996. It was expected that school districts would end up filling the gap between state funding and the cost of educating students with disabilities. Local contributions to funding special education were also seen as giving districts an incentive to provide services efficiently. In interviews, district and SELPA administrators expressed broad support for the existing AB 602 formula and reluctance to alter it in ways that might reestablish incentives to over- or misidentify students with disabilities.
Incidence rates are also influenced by the extent to which districts meet student needs with regular education services. For example, Sanger Unified School District in Fresno County has a relatively small proportion of students in special education because it integrates regular and special education services (Huberman, Navo, and Parrish, 2012).15 Three other districts with better-than-average performance for students with disabilities have been highlighted as integrating special and general education services. One district reported it saved money by doing so.16
FIGURE 5 Disability incidence rates vary widely across California counties
SOURCE: Authors’ calculations from CASEMIS and LCFF snapshot, 2014–15.
NOTE: Students with disabilities include pre-school and 5th year seniors (numerator). Denominator is K–12 student population.
14 The SELPA average is slightly higher that the state 11.5% average. 15 Sanger students with IEPs also performed well on state tests, which is surprising given that the district served a more concentrated group of special education students. Because of its low identification rate, district student disabilities were on average more severe than in other districts (Huberman, Navo, and Parrish 2012). 16 Upland Unified reported transportation savings when fewer students with IEPs needed to be bused (Huberman, Navo, and Parrish, 2012).
PPIC.ORG Special Education Finance in California 13
Distribution of English Learner and economically disadvantaged students with disabilities Many students with disabilities are also English Learners or economically disadvantaged, or in foster care. Such students are classified as high-need, as distinct from special needs which refers specifically to students with disabilities. The LCFF recognizes the additional costs of educating such high-need students by giving extra per-pupil weight for these categories.
High-need students with disabilities may be more expensive to educate than students who need special education services, but are not economically disadvantaged or English Learners, a point noted by the special education task force. This point is implicit in the federal funding formula for special education.17 The state distribution of high-need students with disabilities is not uniform,18 reflecting underlying differences in the share of high-needs students and variation in the identification of students with disabilities in the high-need population.
High-need students make up 70 percent of students with disabilities compared with 62 percent in the overall K–12 population. Some 31 percent of students with special needs are EL, substantially higher than the 22 percent in the K–12 population. In addition, 64 percent of special-needs students are economically disadvantaged, compared with 59 percent in the K–12 population.19
We also examined the relationship between high-need students in the overall K–12 student population and SELPA identification of students with special needs. Shares of EL and economically disadvantaged students are not related to shares of students with special needs. However, there is a slight relationship between shares of students with IEPs and shares of economically disadvantaged students.20
The distribution of students with severe disabilities We also examined the distribution of students with disabilities with conditions considered severe, which likely requires costly services. The California Department of Education (CDE) defines severe disability as including autism; blindness including visually impairment; deafness and other hearing impairments; orthopedic impairment; serious emotional disturbance; intellectual disability; traumatic brain injury; and multiple disabilities.
A number of studies have attempted to estimate special education costs by disability category. One study found that emotional disturbance, autism, hearing impairments/deafness, and multiple disabilities accounted for 77 percent of high cost disabilities (Chambers, Kidron, & Spain 2004). Another found that autism, multiple disabilities, traumatic brain injury, and visual impairment/blindness have high average costs (Chambers, Shkolnik, and Perez 2003). Augenblick, Palaich and Associates (2011) found autism, emotional disturbance, cognitive impairment, multiple disabilities, and visual disabilities to have high average per-pupil costs in New Jersey. Another way to estimate cost is to calculate the percentage of time students with disabilities spend outside regular classrooms or in specialized schools. This method shows no clear pattern based on disability type.21
To examine the distribution of severe disabilities in California, we calculated the number of students with autism, cognitive impairment, deafness-blindness, emotionally disturbance, multiple disabilities, and traumatic brain injury. Figure 6 shows students in these categories as a percentage of all K–12 students are not evenly distributed across the state.
17 The federal ADA rate for funding special-needs students assumes a 15% extra weight for low-income students, an explicit assumption in LCFF funding as well. 18 See Technical Appendix B. 19 Shares of high-needs students by county are displayed in Technical Appendix Figure B.1. Technical Appendix Figure B.2 shows the extent to which county shares of high-needs students with special needs vary from the share of high-need students. 20 The relationship is statistically significant, but the R2 is just 0.03. 21 See Technical Appendix Table B.1.

PPIC.ORG Special Education Finance in California 14
FIGURE 6 Students in severe disability categories are not evenly distributed across the state
SOURCE: Authors’ calculations from 2014–2015 CASEMIS.
NOTE: Students with disabilities include pre-school and 5th year seniors (numerator). Denominator is K–12 student population.
At the SELPA level, students with severe disabilities range from one to four percent of the total student population. However, even these small variations could produce large SELPA cost differences. At the county level, the range is identical.
SELPA Funding and Spending Our analyses of the variation in the proportion of students identified as needing special education services, the share of high-needs students with disabilities and the proportion of high-cost disabilities raise the question of whether AB 602’s census approach represents the best way to distribute state funds. If unequal funding and unequal need are balanced, the distribution may be fair. To investigate that possibility, we examine the extent to which SELPA spending exceeds state and federal special education funding and look at the relationship between SELPA spending and the population of students with disabilities.
SELPA spending exceeds state and federal funding In 2014–15, the federal government provided nine percent, the state 29 percent, and districts 62 percent of California’s special education budget. Federal funding largely comes in three grants. The largest, the Local Assistance Entitlement, accounted for 91 percent in 2014–15. In the Individuals with Disabilities Education Act (IDEA), the federal government set a goal of funding up to 40 percent of the per-pupil cost of special education, but the federal contribution historically has not reached that level.
Special education funding is sometimes called “encroachment,” a term that could be taken to imply that money spent on services for students with disabilities unfairly reduces support for general education. The one-system approach favored by the Statewide Special Education Task Force takes another view. Students with disabilities

PPIC.ORG Special Education Finance in California 15
are seen as general education students with needs that require additional spending. We estimate students with disabilities generate about $4.4 billion in LCFF funding.22
TABLE 2 Local contributions exceed 40 percent of special education spending at most SELPAs
% local contribution Number of SELPAs Expenditure per pupil (ADA)
Average local contribution (ADA)
0–20% 1 1,348 189
20–40% 6 1,594 503
40–60% 65 1,872 997
60–80% 53 2,365 1,546
SOURCES: Authors’ calculations from CDE special education finance data, 2014–15
NOTES: Local contributions are the difference between total special education spending and combined federal and state contributions. California state special schools, CHELPAs, and the Los Angeles Court Schools SELPA are excluded. SELPAs report spending data to the California Department of Education.
Local special education spending above federal and state contributions is substantial (Table 2). Nine in ten SELPAs generate more than 46 percent of special education expenditures locally. Over half of SELPAs contribute more than 40 percent.
Spending and disability at SELPAs An important question is whether SELPA spending patterns are related to the relative size and characteristics of their populations of students with disabilities. As Figure 7 shows, AB 602 funding is not closely aligned with the share of students with disabilities at SELPAs. Some higher-funded SELPAs serve relatively small shares of students and some low-funded SELPAs provide services to a much higher proportion. Specially, our analysis found a one percent increase in the share of students with disabilities is associated with a $5 increase in per-pupil funding. We conclude that unequal SELPA funding is not offset by unequal identification of students with disabilities.
22 To estimate LCFF funds generated by students with special needs, we assume each special education student generates LCFF funding through the base grant pegged to grade level. We also assume that each high-need special education student generates funding through the supplemental grant at a rate of 20% of the student’s base grant. Concentration grants are available when a school district’s high-need student population is greater than 55%, with each student over that percentage generating 50% of the base grant. We apply that rule to SELPAs, which underestimates concentration district-level grant funding. See Technical Appendix C for a discussion of how LCFF supplemental and concentration funds can be used for high-need students with special needs.

PPIC.ORG Special Education Finance in California 16
FIGURE 7 SELPA funding and share of students with disabilities
SOURCE: Authors’ calculations from CDE special education finance data and CASEMIS data, 2014–15. AB 602 funding includes out-of-home care and state property tax.
NOTES: A one percent increase in the share of students with disabilities is associated with a $5 increase in per-pupil funding. The coefficient is significant, but the model fit is low (p = 0.01, R2 = 0.06). The 12 SELPAs with the highest per ADA funding level are excluded. Funding is the sum of AB 602 funding and local property tax revenues earmarked specifically for special education services.
While funding isn’t related to SELPA disability rates, we might expect that spending would be. Figure 8 shows this is true for single-district SELPAs. As SELPA share of students with disabilities increases, spending per ADA rises. However, as Figure 8 shows, there is no relationship in multidistrict SELPAs between the share of students with disabilities and special education spending.
FIGURE 8 Spending and share of students with disability
SOURCE: Authors’ calculations from CDE special education finance data and CASEMIS data, 2014–15.
NOTES: A one percent increase in the share of students with disabilities is associated with a $134 increase in special education spending for single-district SELPAs and a $23 increase for multi-district SELPAs. However, only the coefficient for single-district SELPAs is significant (p = 0.00, R2 = 0.34) while the coefficient for multi-district SELPAs is not (p = 0.47, R2 = 0.01).

PPIC.ORG Special Education Finance in California 17
Spending at single-district SELPAs is not related to the share of students with IEPs who are English Learners, economically disadvantaged, or foster youth. Figure 9 shows spending is relatively flat as the share of these high-need students increases. However, spending at multi-district SELPAs decreases with increasing shares of high-need students, an unexpected result given that high-need students are overrepresented among students with IEPs and that such students tend to cost more to educate. Further research is necessary.
FIGURE 9 Multi-district SELPAs with more high-need students spend less on special education. There is no relationship for single-district SELPAs
SOURCE: Author’s calculations for CDE special education finance data and CASEMIS data, 2014–15.
NOTES: A one percent increase in the share of high-need students is associated with a $2 increase in special education spending for single-district SELPAs and a $9 decrease in funding for multi-district SELPAs. However, the coefficient for single-district SELPAs is not significant (p = 0.51, R2 = 0.01) while the coefficient for multi-district SELPAs is significant (p = 0.00, R2 = 0.12).
Figure 10 shows that SELPA spending increases as the share of students with severe disabilities rises. However, spending increases relatively more in single-district SELPAs than in multidistrict SELPAs. In separate analyses, we found higher rates of autism, emotional disturbance, other health impairments, and deafness-blindness are individually associated with higher SELPA spending. However, the variation in costs among districts with the same proportion of students with severe disabilities is wide. Overall, such students play a relatively small role in SELPA special education costs.

PPIC.ORG Special Education Finance in California 18
FIGURE 10 Spending increases as the share of severe students with special needs increases
SOURCE: Authors’ calculations from CDE special education finance data and CASEMIS data, 2014–15.
NOTES: A one percent increase in the share of students with high-cost disabilities is associated with a $252 increase in special education spending. The coefficient is significant (p = 0.00, R2 = 0.10).
No clear rationale for changes In summary, we found that (1) SELPAs uniformly spend more on students with disabilities than they get from state and federal sources; (2) single-district SELPAs spend more when they have a higher proportion of students with disabilities; and (3) both single- and multidistrict SELPAs spend more when they have a higher proportion of students with severe disabilities, although this relationship is stronger for single-district SELPAs.
In the end, we did not find reasons why California should change its practice of distributing funds based on ADA. The AB 602 formula was supported by all the special education administrators we interviewed. The proportion of students with severe disabilities has only a small influence on local costs and is dwarfed by other factors.
How SELPAs Affect Funding and Service Delivery
The state requires school districts to join a SELPA. Today, 40 single-district and 85 multidistrict SELPAs operate in California. Single-district SELPAs are mostly in large, urban areas, while multidistrict SELPAs cover the rest of the state. Most counties have at least one multidistrict SELPA. Four SELPAs, known as CHELPAs, serve charter schools. In 2014–15, 303 charters were CHELPA members. Three SELPAs serve other special populations.23
California created SELPAs to ensure that all students with disabilities are educated in compliance with federal law. State law gives SELPAs a range of policy and procedural responsibilities to make sure local special education programs meet the needs of students, teachers, and administrators.
23 They include SELPAs operated by the California Department of Development Services, the California Department of Corrections, and the California State Special Schools.
PPIC.ORG Special Education Finance in California 19
While state and federal funding are channeled through SELPAs, they do not administer classes, which are run by districts and county offices of education. The role of SELPAs is to help coordinate the system of special education services. SELPAs are required to develop annual budget and service plans. In multidistrict SELPAs, the budget plan identifies how state and federal special education funds will be allocated among districts and county offices. The service plan outlines how educational agencies will provide services that ensure all students receive appropriate instruction.
SELPAs also monitor the operation of safeguards mandated by state and federal law, such as complaint and dispute resolution procedures; hire professional development staff to train teachers and administrators; and collect and forward to the CDE legally required data on district special education programs.
Each district retains responsibility for designing its own special education program, including establishing a process for identifying students who need special education services; putting in place early services that could make special education unnecessary; developing IEPs for each student identified as special needs; and choosing the settings in which students with disabilities are schooled. How SELPA policies and funding formulas influence these choices is poorly understood.
Multidistrict SELPA fiscal practices Multidistrict SELPAs are special education consortiums guided by local boards composed of district superintendents and others. They allocate state and federal funds based on local priorities. State law provides them great flexibility so long as they spend funds on services for students with special needs.
We analyzed funding allocation patterns in 39 of the 80 multidistrict SELPAs using SELPA and county websites that posted plans from 2014 or later. This selection is not necessarily representative. SELPAs in several counties, including Los Angeles, are not included. However, we found no significant differences between our sample and the multidistrict SELPA average on a number of indicators, including the proportions of EL, low-income, and special education students.
Our review found no template for reporting SELPA budget plans. The level of information and detail on allocation plans varies widely. SELPAs may report their allocation models in one of several documents, including
Statutory SELPA Responsibilities A coordinated system of identification, referral, and placement An annual budget that includes a description of how funds are distributed to
member districts in multidistrict SELPAs An annual service plan outlining the services each district and county office of
education will provide Plans for providing services to students in medical, correctional, or other facilities A process for protecting student and parental rights Regional staff to train and consult with district teachers and administrators Submission of special education program data required by state and federal law Coordination with other public agencies that serve people with special needs
SOURCE: California Education Code, Sec. 56195–56208
PPIC.ORG Special Education Finance in California 20
the local plan, procedure manuals, and budgets. We are not confident that we obtained a full picture of each SELPA’s budget plan.24 Nevertheless, it became clear that there are a variety of approaches to allocating state and federal special education funds. Most SELPAs do not simply pass funds through to districts. Instead, SELPA plans are often quite complex, earmarking funds for specific programs or costs. However, we found plans all had three basic elements: allocations based on district size; off-the-top allocations, and regional programs.
Allocations based on district size. Virtually all SELPAs distributed a portion of state and federal funds to help pay for district special education classes and services. Some SELPAs distribute almost all state and federal special education funds to districts. Others distribute a relatively small share. For instance, one SELPA we visited distributes less than 25 percent of state and federal funds to districts based on district size. Most commonly, distribution mirrored the state AB 602 formula, providing a uniform per-ADA amount to districts. A few SELPAs based allocations on the number of students with special needs identified by each district.
Off-the-top allocations for programs. Off-the-top allocations are made from the combined pot of state and federal funds. Most SELPAs allocated a portion of these funds to specific programs or costs before making distributions based on district size. A significant proportion of SELPAs allocated funds for each student identified as having severe disabilities. Many paid the costs of students who attended private special education schools.25 In both cases, the average cost was often much higher than for other special education students. SELPAs also take funds off the top to pay extraordinary district costs, such as legal expenses.
“Off-the-top” allocations are made from the collective pot of state and federal funds. Because both state and federal programs use district size to allocate funds, large districts account for a greater share of multi-district SELPA funding than smaller districts. As a result, large districts “pay” for a greater proportion of the off-the-top allocations.
Regional programs. The administrative arms of multi-district SELPAs (a school district or county office of education) typically offer regional special education classes for students with severe or unusual disabilities. These programs are justified because they can offer higher quality instruction at lower average cost. SELPAs pay for regional programs in two ways. Some pay off-the-top funds to the district that operates regional program. Others charge districts when their students attend regional classes. Some SELPAs do both, directing off-the-top funds to pay a portion of the cost and charging districts for the remainder.
SELPAs redistribute funds in significant ways A Fiscal Crisis Management Assistance Team (FCMAT) audit of one multidistrict SELPA illustrates ways these agencies can shift resources among districts (Fiscal Crisis Management Assistance Team 2013). The review, spurred by concerns that the SELPA’s budget plan favored certain districts at the expense of others, found that district allocations of AB 602 funds ranged from about $100 to $199 per ADA. Federal funds were distributed based on the number of students with disabilities in each district, ranging from zero to $180 per ADA. The combined state and federal allocations to districts were between $180 and $285 per ADA.
Most of the remaining funds—$345 per ADA—were allocated off-the-top to regional programs for services to students with disabilities administered by county offices of education at an average cost of approximately $30,000 per student. The audit noted local concerns that small districts sent students with less severe disabilities to these regional classes, while large districts might serve these students in district programs. The high cost of these
24 Several studies by the Fiscal Crisis Management Assistance Team find that district superintendents do not understand SELPA funding models. See, for example, San Joaquin County Office of Education: SELPA Review, December 2013. 25 These schools are also known as nonpublic schools to distinguish them from private schools that serve a general student population.

PPIC.ORG Special Education Finance in California 21
classes combined with the fact that the SELPA paid for them with off-the-top funds gave districts a powerful incentive to refer students to them. The audit did not specifically find that small districts sent a disproportionate number of students to regional classes. The report did not address whether smaller schools sent students with less severe disabilities to such programs.
The issue of special education costs in small districts and charter schools is a particular concern. A single high-cost student can create significant budget stress for a small district or charter school. The FCMAT audit showed that smaller districts and independent charter schools with less than 3,000 ADA received an average of about $20 per ADA less than larger districts in direct AB 602 and federal funds. Of course, this does not account for students served in the very expensive regional programs.
At the state level, special education spending in districts with less than 1,000 ADA is about 49 percent higher than in larger districts, according to the state’s K–12 accounting database. On average, smaller districts spent slightly more than $2,664 per ADA in 2014–15 versus $1,784 in larger districts.26 However, the variation is large. About 16 percent of small districts reported spending more than $3,000 per ADA, while 36 percent spent less than $1,000. Among larger districts, spending at these high and low ranges was four percent and 13 percent respectively. These figures may understate actual spending because county office program costs cannot be attributed to the districts that benefited from the expenditures.27
In general, the larger size of most multi-district SELPAs allows them to help small districts cope with very high cost students. The state also provides higher funding to 19 “necessarily small SELPAs” covering rural counties with fewer than 15,000 students. The AB 602 formula multiplies the per-ADA rate by 15,000 to maintain a minimum level of funding.
SELPA allocation models raise issues The role multidistrict SELPAs play in distributing state and federal special education funds to districts and regional programs raises two major issues: (1) SELPA budget plans can inadvertently create incentives for districts to identify students in certain ways or use regional programs to serve students in lieu of district programs and (2) SELPA governance and accountability are not nearly as strong as those under LCFF.
SELPA allocations can create negative incentives AB 602 was designed to support local programs in ways that minimize incentives to overidentify students for special services or place students in certain educational settings. Similarly, the state Out-of-Home Care formula is based on the number of students residing in residential facilities and not the school setting those students are placed in. By divorcing funding from disability labels and educational settings, the state sought to encourage districts to educate more students with disabilities in regular classrooms. However, multidistrict SELPAs frequently tie funding to program settings. As a result, SELPA budget plans sometimes create precisely the problems the state sought to avoid.
Severe student allocations. SELPAs commonly allocate a large grant for each student identified with a severe disability. SELPAs that do this provided about $15,000 for each student with severe disabilities, much more than the amount distributed for most other special education students. This can create incentives to identify students as severe. One SELPA administrator we interviewed said such grants encourage districts to adjust diagnostic
26 Standardized Account Code data base, provided by California Department of Education. 27 No rules govern how districts and county offices account for regional program costs, according to California Department of Education Administrator Christine Davis. As a consequence, county offices often report regional program expenditures, not the district where the student resides.
PPIC.ORG Special Education Finance in California 22
practices in order to obtain higher funding.28 Allocating large amounts based on disability labels also can skew distribution of state and federal funds among districts.
Special education pupil count. A few SELPAs distribute funds at least partially based on the total special education pupil count in each district, another way SELPA plans connect funding and special education identification. Of the five SELPAs we found that distribute funds to districts based on the number of students with IEPs, four use a formula that combines special education counts and ADA. By linking identification with funding, these SELPAs may risk encouraging districts to identify more students as special needs. However, the proportion of students identified in the five SELPAs was not statistically higher than in the other SELPAs we studied, although the small sample size makes finding significant relationships difficult.
Regional programs. Regional programs that serve students with complex or rare disabilities may be funded with off-the-top dollars, which makes these classes “free” to member districts. These programs are administered by county offices of education or one or more districts. Because these programs are paid for and make district-level programs unnecessary, they give districts an incentive to refer students to them. Subsidies for these programs are questionable from a financial standpoint and the incentive districts have to place students in them potentially conflicts with the federal requirement to educate students in the least restrictive environment.
Nonpublic school costs. Many SELPAs reimburse districts for nonpublic school costs, a practice that undercuts the state’s goal of supporting public programs for students with disabilities. Nonpublic schools typically serve students with complex or severe disabilities, and often are quite expensive. To ensure that districts are protected from the most expensive nonpublic school placements, the state has a $3 million extraordinary-cost program that reimburses districts for costs over $75,000 for any individual nonpublic school placement.
Multidistrict SELPAs are less locally controlled and accountable Special education was not part of the LCFF reform. While SELPA budgets reflect the collective decisions of member districts, they are not subject to district control as understood in LCFF and they lack LCFF’s strong parental input and accountability processes.
Districts influence but do not control multidistrict SELPAs. The SELPA structure deprives districts of independent authority to use state and federal special education funds in ways that best meet student needs. Table 3 compares LCFF and SELPA policies for governance and accountability. Districts are governed by elected school boards, while multidistrict SELPAs are governed by boards composed primarily of district superintendents. Districts have at best one vote on the board and at worst no direct voice in SELPA decisions. A SELPA director we interviewed who had worked in both single and multidistrict SELPAs said that single-district SELPAs control spending and program decisions, while districts in multidistrict SELPAs influence, but do not control, such decisions. A district budget officer described the annual SELPA budget process as a negotiation in which districts vie for shares of special education resources.
28 The administrator reported that if a student has two diagnoses, the district will designate the more severe one as primary in order to secure “severe” funding.

PPIC.ORG Special Education Finance in California 23
TABLE 3 LCFF requires more local input and accountability than special education plans
Local Control Funding Formula Special Education Local Planning Area
Governance
Entity District District or regional
Accountable officials Elected school board members Appointed district or county office
superintendents
Public outreach Public, parents, district advisory councils Community advisory committee
Accountability
Performance goals 23 indicators of school and student success
None
Performance subgroups Low-income, English Learners,
foster care, students with special needs None
SOURCES: California Education Code Sections 52060– 52076 (LCFF accountability) and 56195–56500 (special education).
NOTE: The state board added students with disabilities as a subgroup under LCFF accountability. This is also included in federal accountability requirements.
The lack of direct control creates potential problems for districts, ranging from financial to the quality of regional services For instance, funding regional programs off the top might make it too expensive for districts to create their own program for students with severe disabilities. Unhappy districts can make their case to their SELPA boards, but otherwise have no recourse. In one case, a Southern California SELPA expelled a district amid a dispute over the quality of regional services.29
The state faced similar issues when it created charter school SELPAs.30 These statewide SELPAs allow independent charter schools to choose the level and type of special education support they receive. This greater flexibility generally gives charters more leverage than districts and may help ensure that funds are not diverted to off-the-top services.
Transparency and accountability. LCFF requires districts to go beyond existing advisory councils to engage parents and other community members. SELPAs do not have the same mandate. A community advisory committee is the SELPA’s main conduit for parent input. In addition, districts are governed by elected school boards, which generally makes them more responsive to parents and communities than appointed SELPA superintendents.
Multidistrict SELPAs may be insulated in other ways as well. For most parents, they are likely to be located further away than district headquarters. Moreover, information on the SELPA operations and budget may be difficult to obtain. We were unable to find budget and administrative plans on the internet for more than half of the state’s multidistrict SELPAs, including all 12 multidistrict Los Angeles County SELPAs. Without these resources, parents and community members may find it hard to get the information they need to take part in SELPA policy discussions.
Accountability also is a problem both at the district and SELPA level. Districts are accountable for the education of all students, including those in special education. LCFF directs districts to set performance goals for 23
29 Since state law requires districts to be part of a SELPA, the Ontario-Montclair School District has applied to the State Board of Education to become its own SELPA even though it does not meet the state’s 30,000-student threshold. 30 In a memo to the State Board of Education, Deputy Superintendent William J. Ellerby wrote that some “charter schools express a preference for exercising more influence over special education programs than they have under their existing SELPA membership, including instructional models, funding allocations, and program specific support personnel.” Special Education Local Plan Area and Charter Schools Pilot Project Report, California Department of Education, William Ellerby, December 8, 2009.

PPIC.ORG Special Education Finance in California 24
indicators of school and student success each year, and monitor performance by major subgroups. The State Board of Education recently added disabled students as a major student group for LCFF accountability. This will provide useful new information to parents. Special education will still be excluded from the budget and planning requirements of LCFF, which is hard to understand given the size of the special education population. California does not hold SELPAs accountable for student success in any formal way. SELPAs are not required to set goals or assess the progress of students with disabilities—even those who attend regional classes. SELPAs are responsible for ensuring that districts meet federal least-restrictive-environment requirements, but there is no local reporting of district and SELPA success in meeting performance goals. SELPAs cannot be held accountable for student performance if data are not available at the local level. Lack of accountability may affect the quality of special education services. According to one study, California has made slower progress in moving away from separate classrooms for students with disabilities than most other states (Parrish 2012).
Can separate governance result in a seamless system? In multidistrict SELPAs, special education has a dual governance process, one at the district and the other at the SELPA level. SELPAs allocate state and federal funds, and develop regional educational settings for students with severe disabilities. In many cases, multidistrict SELPAs also protect small districts from high special education costs.
The Statewide Special Education Task Force called California’s system “siloed” because of its separate instructional systems, accountability requirements, and reporting mandates (California's Statewide Task Force on Special Education 2015). We suggest that the requirement that districts belong to SELPAs is another reason special education is siloed in California. No federal rules or regulations require districts to operate special education programs apart from general education. Instead, a separate system represents the easiest way for districts to cope with the multiple mandates of state and federal law.
Helping districts develop more integrated special education systems means simplifying the current system. Whatever is not required by federal law should be reevaluated. That point raises a series of questions. Does the state need to require SELPAs or should districts be given more flexibility? Should funding for students with disabilities be added to LCFF as a way of unifying local governance and accountability processes? By giving districts more options and focusing more on outcomes, the state can encourage districts to see special education services as one end of the student-needs spectrum rather than as a separate system.
Special Education in Other States
For perspective on California special education, we looked at how other states finance and operate programs for students with disabilities. We found no single best model. Each state has developed its system in the context of its overall K–12 program. Here we look at three aspects of state support for special education: (1) Are state funds categorical, meaning they must be spent on special education, or general? (2) What formula drives how funds are distributed to districts? (3) Are there regional special education institutions?31
31 Technical Appendix D has a detailed discussion of special education financing in other states.
PPIC.ORG Special Education Finance in California 25
Categorical or general funds. In general, states use one of three models:
Thirty-three states finance special education as part of the main K–12 funding formula. This gives districts more flexibility in using funds.
California and 11 other states provide resources as a separate categorical grant, requiring that funds be spent only on special education.
Five states reimburse local school districts for a portion of special education expenses.
As in California, districts in other states spend more on special education than the funds the state provides. With one exception, every state we contacted noted that their districts felt state funding was insufficient. The exception was Wyoming, which reimburses districts for 100 percent of special education costs.
Formula driver. Within these three categories, states vary considerably in how special education funds are distributed. Like California, several states base allocations on a district’s overall student census. Others use the number of students with disabilities. Some states go a step further and weight their allocations on risk factors, such as the number of low-income students or the severity of student disabilities.
Regional services. Most states take steps to find economies of scale through regional services. Like California, many have state schools for blind and deaf students. Some have regional centers that provide services for students with low-incidence disabilities impractical to serve at the district level. Districts typically pay the regional center for these services. We did not find any state that uses an intermediary to distribute funds to districts as SELPAs do in California.32
In some ways, California’s special education financing system is similar to those of other states: California also uses a formula to determine allocations, seeks economies of scale, and places significant responsibility for special education funding on local districts. In other respects, California is unique. It is one of a minority of states that use categorical grants to fund special education and may be the only one to distribute special education dollars through intermediary institutions.
Alternative Approaches to Special Education Finance and Structure
Our analysis focuses on two interrelated features of California special education: funding and program structure. On the funding side, the AB 602 formula has successfully funded services without creating incentives to overidentify students for special education. While we observed increased spending in SELPAs with higher shares of severe disabilities, there are no compelling reasons to alter the current census-based formula. Similarly, based on current research, the slight relationship between economically disadvantaged students and shares of students with disabilities does not merit putting additional weight on funding special education for economically disadvantaged students.
Still, the current funding system has significant problems. Most importantly, total state special education spending has not kept pace with growth of caseloads and costs, and large disparities exist in AB 602 ADA rates among SELPAs.
On the program side, our concern is the role SELPAs play in determining how funds are spent and services delivered. Most districts in California receive only a fraction of special education funds directly. SELPA authority 32 Oregon’s Education Service Districts structure is perhaps most similar to the SELPA model. However, these regional consortiums provide a range of services beyond special education. See Technical Appendix E for a detailed discussion of state intermediaries.

PPIC.ORG Special Education Finance in California 26
over the allocation of funds reduces district control and flexibility. SELPA fiscal practices also can create negative incentives for districts, such as offering no-cost regional classes that make it too expensive for districts to set up their own programs. SELPA practices may also encourage districts to send students to private special education schools that may be more restrictive and expensive than district-level special education.
SELPA funding and governance clash with the principles of local control, transparency, and equity underlying LCFF and the goals of the Statewide Special Education Task Force. Overall, California’s special education finance system seems inconsistent with LCFF in these areas.
In our view, the state should be looking to create greater coherence between LCFF and special education. The web of state and federal special education rules, including categorical funding and maintenance of effort, shapes local educational practices and reinforce the special education silo. Building financial walls around programs encourages districts to keep special education separate from other programs. LCFF broke down similar walls in other K–12 areas. If the state hopes to integrate special and regular education, it needs to start by deregulating special education finance.
Another important step towards integration of regular and special education would be to include special-needs students in LCFF accountability and governance processes. Adding special education to district Local Control and Accountability Plans (LCAP) would highlight what districts are doing to improve services for students with disabilities and create benchmarks for determining whether outcomes are improving. It would also give parents of students with disabilities the same access as other parents to district program and budget plans.
Fund districts, not SELPAs The first step in improving special education financing should be to allocate state special education funds directly to districts. This represents a significant change and it makes sense to do this in a multiyear transition. In addition, it is important to address the special problems of small districts and charter schools, which could be overwhelmed by a few students with expensive disabilities.
Categorical versus general funds The state has several options on how to distribute special education funds to districts:
Maintain the existing categorical program for special education, but direct state funds to districts instead of SELPAs.
Add special education funding to the LCFF formula while keeping the requirement that the funds be spent only on special education. Merging special education funding into LCFF would mean that districts receive the same increases for special education as LCFF base, supplemental, and concentration grants, ensuring that special education funding would increase in step with the rest of the budget. Plus, special education would formally become part of LCAP outreach and planning.
Add special education funds to the LCFF formula with no firm restrictions on use. Instead, the state could require the money be earmarked for general special education purposes and for students at risk of needing an IEP. This would give districts maximum flexibility in using funds to meet student needs and promote more seamless provision of services. This option has the benefit of channeling virtually all Proposition 98 K–12 funding, through LCFF. Federal law would continue to require maintenance of effort on district special education spending as well as individual guarantees of services through IEPs.

PPIC.ORG Special Education Finance in California 27
In our view, the third option makes most sense and aligns most closely with the principles of LCFF and the Statewide Special Education Task Force report. Many other states provide unrestricted funds for special education instead of categorical dollars without undercutting guarantees of services to students with disabilities. The General Fund dollars California designates for special education are modest compared with the amounts districts contribute. It is unlikely that making state funds general instead of categorical would cut special education spending.
We recognize some may find this option threatening. Nevertheless, we view it as a critical step towards a more-integrated system of special and general education. By funding districts, the state can eliminate the dual governance special education system, which could help districts implement the classroom-based instructional model advocated by the special education task force.
Directly funding districts will not solve all special education issues—and undoubtedly would create new ones. Small districts and charter schools would need to be protected from extraordinary costs. The state may want to continue regional oversight to ensure students are receiving needed services. But funding districts would bring special education in line with the principles underlying LCFF and give the state the opportunity to fully integrate special education into the LCAP, thereby making district plans more responsive to parents and the community.
Continuing other SELPA functions While multidistrict SELPAs are problematic, these consortiums provide a range of benefits. They train teachers, help districts with curriculum development and legal compliance, work with districts and county offices to develop classes for students too difficult and expensive for districts to educate, and shield small districts from extraordinary special education costs.
Even if districts were directly funded, we expect some regional organizations similar to SELPAs to remain part of California’s special education system. In particular, smaller districts may want to join SELPA-like consortiums to achieve economies of scale. Under such a set-up, districts would be better able to choose services and negotiate prices.
Alternatively, county offices could assume SELPA duties and provide regionalized services to districts on a contractual basis. These offices could take over SELPA responsibilities for ensuring that students receive services in the least restrictive environment. Special education would become part of district LCAPs, generating more data and increasing attention to special education student performance. County offices already help districts develop improvement plans under LCFF, and they would be well-positioned to work with districts to improve the quality of services for students with disabilities.
One possible problem concerns the role of county offices in overseeing the LCFF improvement process. There is a potential conflict if they were to play a larger role in delivering special education services to students. Such an arrangement might undercut accountability because a county office heavily involved in educating students with disabilities might be less likely to press districts to improve special education programs. For this reason, the state should require county office LCAPs to include special education classes operated by the county office. That would give parents and districts better information on the quality of county office classes and provide them an avenue to work for improvement.
Options for protecting small districts
In our view, the thorniest issue created by directly funding districts for special education is how to protect small districts and charter schools. As a group, small districts already spend more than larger districts on special education and the variation among them is wider. One option for shielding small districts from excessive costs is

PPIC.ORG Special Education Finance in California 28
to offer them a modest increase in the per-ADA funding rate. The state already provides higher funding to 19 small SELPAs.
Special education poses two problems for small districts and charter schools: (1) ensuring that costs do not exceed reasonable levels without creating incentives that encourage higher district spending; (2) addressing the fact that some small districts and charters may have very low or no special education costs in a given year. Under the current system, SELPAs smooth the ups and downs of small-SELPA special education costs and ensure that all state and federal funds are spent. Under direct district funding, small districts could lose state and federal funds if their costs remain low for several years.
Addressing variability requires that districts be able to pool their funds with other districts. Pooling options include:
Continue the current SELPA system, but make the subsidies to small districts explicit. This could be done by requiring SELPAs to direct special education funds to districts on an ADA basis but creating an exception for small districts. SELPAs would continue to help small districts deal with the stresses of special education costs. This option would make small-district costs and subsidies more transparent, and would ensure an annual SELPA review of their special education costs.
Create statewide small-district SELPAs similar to charter SELPAs. These SELPAs could pool costs to protect small districts from extraordinary expenses.
The state could create small-district cost pools. These could operate like insurance (where charges are based on experience) or they could be like existing state cost pools that limit district liability for high-cost students.
The state needs better small-district cost data to evaluate these options. California could start by requiring SELPAs to report small district costs and subsidies in past and current years. This would give the state a more accurate picture of the internal subsidies in SELPA budgets.
Update AB 602 The second critical step in reforming California special education is to make the AB 602 formula more consistent with the LCFF principle of equity by achieving greater equality in the local funding rates. This would require assigning each district its current SELPA rate and then increasing the rate of low-funded districts. Currently, the highest per-ADA rate is twice as large as the average, and equaling to the highest rates may be prohibitively expensive and provide too much special education funding to some districts. We suggest three ways of thinking how to move towards equalization while controlling costs:
Equalize to the highest ADA rate after funding outliers have been eliminated and equalize district rates at this level. We propose the 90th percentile, which eliminates the 12 highest-funded SELPAs.33 The ADA funding rate at the 90th percentile is currently $653. This reform would cost an additional $670 million per year. For comparison, the 80th percentile is $578 and the 70th percentile $556 per ADA. Equalizing to either would cost considerably less, but also do less to close the gap between the top-funded and the average SELPA.
Equalize to the 2007 per-ADA rate, the peak year in which the average was $651 per ADA in 2014 dollars. This would cost approximately the same as equalizing to the 90th percentile.
33 Those SELPAs are Modoc, Sierra, Trinity, Mendocino, Lassen, Calaveras, Pasadena Unified, Marin, Siskiyou, Santa Clara III, Mono, and San Francisco.

PPIC.ORG Special Education Finance in California 29
Increase funding to recognize the higher costs generated by rising caseloads relative to ADA and the shift towards more severe disabilities. We estimate this could add $1.1 billion a year (although this estimate is highly uncertain). Under this approach, increased funding could be withheld from districts at the top of the distribution.
Simplify other funding programs Opportunities exist to simplify special education funding and create stronger incentives to establish programs that provide early services to children with disabilities.34 Specifically, we recommend:
Include Mental Health funding in AB 602. The LCFF principle of local control is inconsistent with funding mental health services as a separate special education program. The state lacks the information to determine the amount each district needs for these services. Moreover, language adopted as part of mental health services reform in 2011 specified that a separate appropriation was temporary.
More attention should be paid to the relationships between school districts and county mental health agencies. During district interviews, we heard that relationships between district special education and county mental health programs ranged from close and collaborative to nonexistent. Collaboration benefits both agencies, so it is important to understand the barriers to cooperation.
Base Out-of-Home Care funding on placements. This program distributes funding based on an area’s group home capacity, in contrast with other residential institutions, which are funded only for actual placements. Our research shows group homes are about half full at any one time. Changing the formula so funding for all facilities is based on actual residency would save about $50 million. Because of recent social services changes, group home placements and the cost of funding based on residency are expected to fall further. The state should monitor these changes to determine whether it makes sense to eliminate this allocation entirely. Increase state support for infants and preschoolers with disabilities. Funding for children from birth to age 4 receiving special education services seems unnecessarily complicated and gives districts a disincentive to serve the youngest population with disabilities. Infant programs are split between K–12 education and the Department of Developmental Services. The state’s K–12 formula is outdated and inequitable. Additional study is needed to better understand how to better support effective services for these children.
Special education funds pay the entire cost of preschool programs for children with disabilities because they are not considered students for LCCF purposes. Districts do not get base grants for these children and the AB 602 formula does not adjust when districts enroll more prekindergarten students. CDE data suggest that one in five special education kindergarten students, about 6,400 children, were not previously identified and did not receive preschool special education services. The Statewide Special Education Task Force called on the state to address this issue. We agree.
One option is to count preschool attendance towards school and district ADA, at an annual cost of over $500 million. By providing the same funding level as for other students with disabilities, this would remove the disincentive to serve younger children. Another option to boost incentives to serve these children is to increase the supplemental funding preschool programs receive for special education students. One problem though is that districts in more affluent areas do not operate state preschool programs. Still, this option might reduce the emphasis on separate classes for special education preschool students.
34 See Technical Appendix A.

PPIC.ORG Special Education Finance in California 30
Conclusion
Special education illustrates that the mechanisms California uses to fund school districts profoundly affect how students are educated. A variety of state and federal laws wall off special education funding from other areas of schooling. Moreover, in most cases, districts do not receive funding directly, but through regional SELPAs. The result is that special education often becomes a separate province in the K–12 system.
The current separate system achieves few of the principles underlying the LCFF or the 2015 Statewide Special Education Task Force report. Special education finance compromises local control and accountability, transparency, and equity. California’s system also contributes to the silo effect identified by the task force. Categorical funding rules and separate governance make it harder for districts to pursue the task force’s vision of a seamless system of services for both regular and special education. Infant and preschool programs represent a special problem. Funding for these programs operates differently than for other special education activities, and the relative lack of state support runs counter to the task force’s call for greater emphasis on early intervention.
Yet, special education finance works well in other respects. The AB 602 formula is widely considered a reasonable way to distribute funds, in part because it does not create negative incentives. Of course, some districts face greater challenges than others, but our review did not uncover a strong case for major adjustment. SELPAs value the flexibility AB 602 funds afford and most want even greater flexibility. The AB 602 formula’s biggest problems are that funding to SELPAs is not equal and that the state had not updated it in response to increased special education caseloads and the rising incidence of high-cost disabilities. We suggest equalizing funding rates. And we estimate that caseload changes may have increased special education costs by $1.1 billion, a burden that falls largely on the shoulders of school districts.
To encourage greater integration of special and general education, we recommend ending California’s parallel system of special education governance and distributing LCFF funds directly to districts instead of through SELPAs. Special education would become part of district LCAPs, which would raise the visibility of both the performance of students with IEPs and of district plans for improving those outcomes. The state would need to determine the future role of SELPAs—whether district membership in SELPAs or SELPA-like organizations is needed to protect small districts and charter schools from exceptional special education costs. In addition, there must be oversight to ensure students are receiving appropriate services in the least restrictive environment.
It has been more than 40 years since the federal government enacted the Education for All Handicapped Children Act requiring schools to provide students with disabilities equal access to education. Since that time, the share of students identified with disabilities, the legal protections for those students and their families, and the range of services that schools must provide have all expanded. At the same time, the cost of special education has grown. Today districts spend much more to serve children with disabilities than state and federal categorical programs provide.
In its fifth decade, perhaps we can say that special education has matured and that California school districts should be encouraged to develop new ways of funding and delivering special education services. The task force envisions a system that focuses on student outcomes, that flexibly delivers services to special and regular education students as needed, and that puts a priority on early intervention. By recasting special education’s finance and governance issues as a part of LCFF, our recommendations take the first step towards these important objectives.

PPIC.ORG Special Education Finance in California 31
REFERENCES Richard C. Adams, MD, and Carl Tapia, MD. 2013. “Early Intervention, IDEA Part C Services, and the Medical Home: Collaboration for
Best Practice and Best Outcomes.” Pediatrics 132 (4).
Ahern, Eileen. 2010. Financing Special Education: State Funding Formulas. National Association of State Directors of Special Education.
Augenblick, Palaich and Associates. 2011. “Analysis of New Jersey’s Census-Based Special Education Funding System.”
Burbank, April. 2015. “6 things to know about the Vt. Education Bill.” Burlington Free Press, March 13.
California Charter Schools Association. 2015. Special Education in California Charter Schools: All Students Welcome.
California Department of Education. 2016. Investigation of Appeal against the Los Angeles Unified School District, Reyna Frias, Appellant. As Clarified on Reconsideration (August 5).
California Department of Education. 2016. State Performance Plan and Annual Performance Report for Part B of the Individuals with Disabilities Education Act of 2004 covering program year 2014-2015.
California Department of Education. 2015. Data from California Special Education Management Information System (CASEMIS) 2014-2015.
California's Statewide Task Force on Special Education. 2015. One System: Reforming Education to Serve All Students.
California State Auditor. 2016. Student Mental Health Services: Some Students’ Services Were Affected by a New State Law, and the State Needs to Analyze Student Outcomes and Track Service Costs. Report 2015-112.
Carlson, Elaine, Tamara Daley, Amy Shimshak, Jarnee Riley, Brad Keller, Frank Jenkins, and Joy Markowitz. 2008. Changes in the Characteristics, Services, and Performance of Preschoolers with Disabilities from 2003-04 to 2004-05: Wave 2 Overview Report from the Pre-Elementary Education Longitudinal Study (PEELS). National Center for Special Education Research.
Chambers, Jay G., Jamie Shkolnik, and Maria Perez. 2003. Total Expenditures for Students with Disabilities 1999-2000: Spending Variation by Disability. Center for Special Education Finance. American Institutes for Research.
Chambers, Jay G., Yael Kidron, and Angeline K. Spain. 2004. Characteristics of High-Expenditure Students with Disabilities, 1999-2000. Center for Special Education Finance. American Institutes for Research.
Ellerbee, William J. 2009. Special Education Local Plan Area and Charter Schools Pilot Project Report. Memorandum to the State Board of Education, California Department of Education.
Fensterwald, John. 2016. “State Officials Find LA Unified shortchanged students.” EdSource. June 1.
Fiscal Crisis & Management Assistance Team. 2013. San Joaquin County Office of Education SELPA Review. California School Information Services.
Huberman, Mette, Matt Navo, and Tom Parrish. 2012. “Effective Practices in High Performing Districts Serving Students in Special Education.” Journal of Special Education Leadership 5 (2): 59–71.
Iowa Department of Education. 2013. Iowa Plan for High Cost Fund.
KIDS DATA. 2015. Special Education Enrollment, by Disability, 2002-2015. Autism.
Koegel, Lynn Kern, Robert L. Koegel, Kristen Ashbaugh, and Jessica Bradshaw. 2014. “The importance of early identification and intervention for children with or at risk for autism spectrum disorders.” International Journal of Speech-Language Pathology 16 (1): 50–56.
Legislative Analyst’s Office, Department of Education, and Department of Finance. 1995. New Funding Model for Special Education. Final Report.
Lipscomb, Stephen. 2009. Students with Disabilities and California’s Special Education Program. Public Policy Institute of California.
Millard, Maria and Stephanie Aragon. 2015. “State Funding for Students with Disabilities: All States Data.” Education Commission of the States.
Minnesota Department of Education, 2012. Education Finance Working Group Recommendations and Report. Minnesota Department of Education.
Moran, John, and Marybeth Sullivan. 2015. Regional and Statewide Special Education Service Delivery in Selected States. Office of Legislative Research. Connecticut General Assembly.
Morrill, Melinda Sandler. 2016. Special Education Financing and ADHD Medication: A Bitter Pill to Swallow. Working Paper.
PPIC.ORG Special Education Finance in California 32
Parrish, Thomas B., and Jay G. Chambers. 1996. “Financing Special Education.” The Future of Children 6 (1): 121–138.
Parrish, Thomas, Jenifer Harr, Jennifer Anthony, Amy Merickel, and Phil Esra. 2003. State Special Education Finance Systems, 1999-2000. Center for Special Education Finance. American Institutes for Research.
Parrish, Tom, Jenifer Harr, Yael Kidron, Leslie Brock, and Priyanka Anand. 2004. Study of the Incidence Adjustment in the Special Education Funding Model. American Institutes for Research.
Parrish, Tom. 2012. Special Education Expenditures, Revenues, and Provision in California. American Institutes for Research as a Partner in the California Comprehensive Center at WestEd.
Parrish, Thomas. 2015. “How Should We Pay For Special Education?” In Enduring Issues in Special Education: Personal Perspectives, ed. Barbara Bateman et al. (Routledge).
Richmond, Matthew, and Daniela Fairchild. 2013. Financing the Education of High-Need Students. Thomas B. Fordham Institute.
Snyder, Thomas D., Cristobal de Brey, and Sally A. Dillow. 2016. Digest of Education Statistics 2014. NCES 2016-006. National Center for Education Statistics, U.S. Department of Education.
Taylor, Mac. 2013. Overview of Special Education in California. Legislative Analyst’s Office.
Winters, Marcus A. 2013. Why the Gap? Special Education and New York City Charter Schools. Center on Reinventing Public Education and Manhattan Institute for Policy Research.
Zablotsky, Benjamin et al. 2015. Estimated Prevalence of Autism and Other Developmental Disabilities Following Questionnaire Changes in the 2014 National Health Interview Survey. U.S. Department of Health and Human Services, National Center for Health Statistics. National Health Statistics Reports, No. 87.

PPIC.ORG Special Education Finance in California 33
ABOUT THE AUTHORS Laura Hill is a senior fellow at the Public Policy Institute of California. Her areas of expertise are K–12 education and immigration. She is currently researching English Learners in California schools, the implementation of the Local Control Funding Formula, and undocumented immigrants and health insurance. Prior to joining PPIC, she was a research associate at the SPHERE Institute and a National Institute of Aging postdoctoral fellow. She holds a PhD in demography and an MA in economics from the University of California, Berkeley.
Paul Warren is a research associate at the Public Policy Institute of California, where he focuses on K–12 education finance and accountability. Before he joined PPIC, he worked in the California Legislative Analyst’s Office for more than 20 years as a policy analyst and director. He primarily analyzed education policy, but he also addressed welfare and tax issues. Prior to that, he was chief consultant to the state Assembly’s committee on education. He also served as deputy director for the California Department of Education, helping to implement testing and accountability programs. He holds a master’s degree in public policy from Harvard’s Kennedy School of Government.
Patrick Murphy is director of research and a senior fellow at the Public Policy Institute of California, where he holds the Thomas C. Sutton Chair in Policy Research. He is also a member of the PPIC Higher Education Center team. He is an adjunct professor of politics at the University of San Francisco, where he served as the director of the McCarthy Center for Public Service. Previously, he worked for RAND and at the Office of Management and Budget in Washington, DC. He holds a PhD from the University of Wisconsin–Madison and a master’s of public affairs from the University of Texas–Austin.
Iwunze Ugo is a research associate at the Public Policy Institute of California. His work focuses on K–12 education. Previously, he studied adolescent health and changes in education spending following the passage of Proposition 13. He holds a BA in economics and mathematics, with a minor in statistical science, from the University of California, Santa Barbara.
Aditi Pathak was a research intern at the Public Policy Institute of California. She is a Ph.D. candidate in economics at North Carolina State University. Her work has focused on a variety of public finance issues, including pensions, health care, and labor economics. She holds a B. Com. and M.A. in economics from the University of Pune and a M.A. in economics from North Carolina State University.
ACKNOWLEDGMENTS The authors wish to acknowledge Maureen Burness, Thomas Parrish, Olga Rodriguez, Sara Adan, and Mary Severance for their reviews and Lynette Ubois and Sam Zuckerman for editorial support. We also thank our former colleague Stephen Lipscomb and PPIC adjunct fellows Jon Sonstelie for consulting on this project and serving as our valued critical friends. Many individuals at the state and local level, as well as individuals from other states, took the time to talk with us and provide access to critical data. We would like to acknowledge the helpful staff at California Department of Education, the State Board of Education, SELPAs, districts, and other stakeholders. Any errors are our own.

PUBLIC POLICY INSTITUTE OF CALIFORNIA
Board of Directors
Mas Masumoto, Chair Author and Farmer
Mark Baldassare President and CEO Public Policy Institute of California
Ruben Barrales President and CEO GROW Elect
María Blanco Executive Director Undocumented Student Legal Services Center University of California Office of the President
Louise Henry Bryson Chair Emerita, Board of Trustees J. Paul Getty Trust
A. Marisa Chun Partner McDermott Will & Emery LLP
Chet Hewitt President and CEO Sierra Health Foundation
Phil Isenberg Former Chair Delta Stewardship Council
Donna Lucas Chief Executive Officer Lucas Public Affairs
Steven A. Merksamer Senior Partner Nielsen, Merksamer, Parrinello, Gross & Leoni, LLP
Gerald L. Parsky Chairman Aurora Capital Group
Kim Polese Chairman ClearStreet, Inc.
Gaddi H. Vasquez Senior Vice President, Government Affairs Edison International Southern California Edison
The Public Policy Institute of California is dedicated to informing and improving public policy in California through independent, objective, nonpartisan research.
Public Policy Institute of California 500 Washington Street, Suite 600 San Francisco, CA 94111 T: 415.291.4400 F: 415.291.4401 PPIC.ORG
PPIC Sacramento Center Senator Office Building 1121 L Street, Suite 801 Sacramento, CA 95814 T: 916.440.1120 F: 916.440.1121
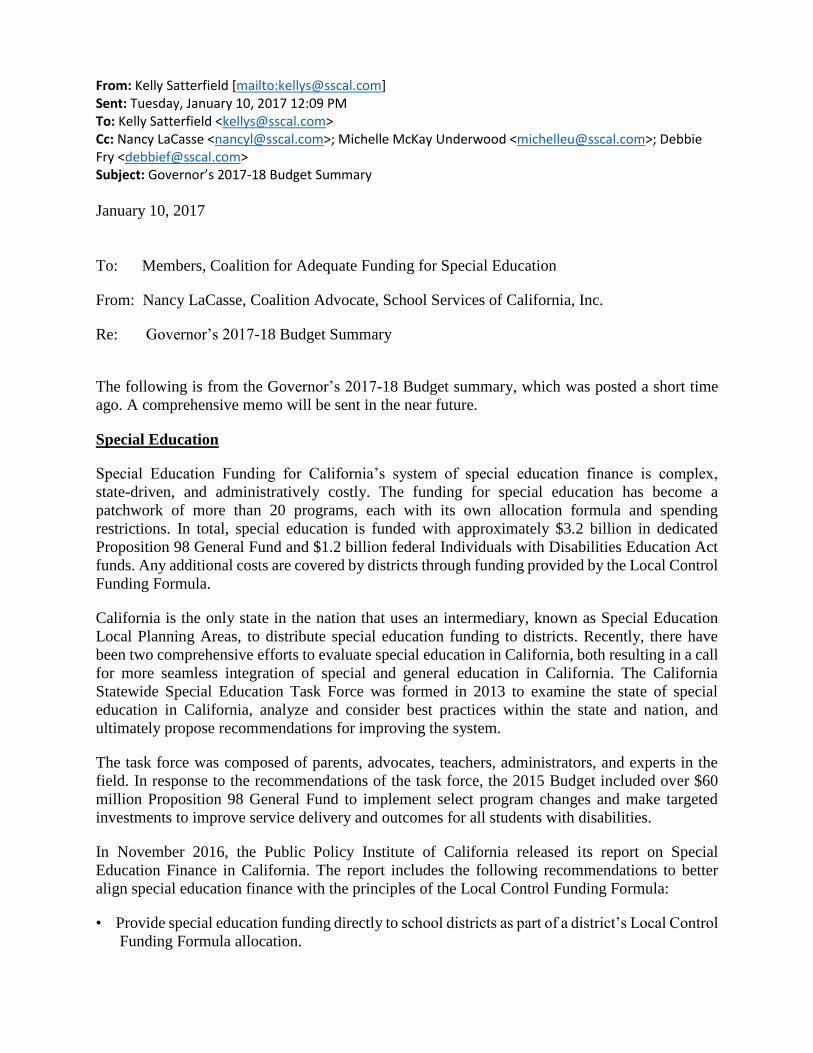
From: Kelly Satterfield [mailto:[email protected]] Sent: Tuesday, January 10, 2017 12:09 PM To: Kelly Satterfield <[email protected]> Cc: Nancy LaCasse <[email protected]>; Michelle McKay Underwood <[email protected]>; Debbie Fry <[email protected]> Subject: Governor’s 2017-18 Budget Summary
January 10, 2017
To: Members, Coalition for Adequate Funding for Special Education
From: Nancy LaCasse, Coalition Advocate, School Services of California, Inc.
Re: Governor’s 2017-18 Budget Summary
The following is from the Governor’s 2017-18 Budget summary, which was posted a short time
ago. A comprehensive memo will be sent in the near future.
Special Education
Special Education Funding for California’s system of special education finance is complex,
state-driven, and administratively costly. The funding for special education has become a
patchwork of more than 20 programs, each with its own allocation formula and spending
restrictions. In total, special education is funded with approximately $3.2 billion in dedicated
Proposition 98 General Fund and $1.2 billion federal Individuals with Disabilities Education Act
funds. Any additional costs are covered by districts through funding provided by the Local Control
Funding Formula.
California is the only state in the nation that uses an intermediary, known as Special Education
Local Planning Areas, to distribute special education funding to districts. Recently, there have
been two comprehensive efforts to evaluate special education in California, both resulting in a call
for more seamless integration of special and general education in California. The California
Statewide Special Education Task Force was formed in 2013 to examine the state of special
education in California, analyze and consider best practices within the state and nation, and
ultimately propose recommendations for improving the system.
The task force was composed of parents, advocates, teachers, administrators, and experts in the
field. In response to the recommendations of the task force, the 2015 Budget included over $60
million Proposition 98 General Fund to implement select program changes and make targeted
investments to improve service delivery and outcomes for all students with disabilities.
In November 2016, the Public Policy Institute of California released its report on Special
Education Finance in California. The report includes the following recommendations to better
align special education finance with the principles of the Local Control Funding Formula:
• Provide special education funding directly to school districts as part of a district’s Local Control
Funding Formula allocation.

• Preserve the current census-count methodology for distributing funding, and develop ways to
distribute funding more equitably throughout the state.
• Eliminate the current requirement for local educational agencies to join Special Education
Local Planning Areas, and develop new ways to encourage regionalized services and cost
pooling arrangements, particularly for small districts and charter schools.
• Ensure the early education needs of children with disabilities are met.
In response to these recommendations, the Administration will engage stakeholders throughout
the spring budget process for feedback on the current special education finance system and the
recommendations included in these recent evaluations. Central to these discussions will be the
following principles, which are consistent with the Local Control Funding Formula and apply to
all students, including students with disabilities:
• School funding mechanisms should be equitable, transparent, easy to understand, and focused
on the needs of students. General purpose funding should cover the full range of costs to
educate all students.
• School districts should be provided the flexibility to establish goals and design innovative ways
of delivering services to all students.
• School districts are responsible for planning and implementing programs that lead to continuous
improvement, measured by academic outcomes.
Kind Regards,
Kelly Kelly Satterfield Governmental Relations Assistant School Services of California, Inc. 1121 L Street, Suite 1060 Sacramento, CA 95814 916.446.7517, ext. 1140 Fax: 916.446.2011 [email protected]

Copyright © 2017 School Services of California, Inc.
Volume 37 For Publication Date: January 13, 2017 No. 1
Initial Impressions From the Governor’s 2017-18 State Budget Proposal
Today, January 10, 2017, Governor Jerry Brown released his proposal for the 2017-18 State Budget. Thepurpose of this article is to provide a quick overview of Governor Jerry Brown’s assertions regarding the2017-18 State Budget. We address the education topics highlighted by Governor Brown this morning in hispress conference and press release, but reserve our commentary and in-depth details for inclusion in ourSpecial Fiscal Report, to be released later today.
Overall Economic Outlook
As the Department of Finance has been signaling in recent monthly Finance Bulletins, the 2017-18 StateBudget proposal reflects a revised revenue forecast that is $5.8 billion lower for 2015-16 through 2017-18compared to the 2016-17 State Budget Act. This translates to reductions to the Proposition 98 minimumguarantee for prior years.
Overall Level of Proposition 98 Funding
The proposed 2017-18 State Budget includes Proposition 98 funding of $73.5 billion for 2017-18, comparedto $71.4 billion provided for in the 2016-17 State Budget. However, Governor Brown proposes reductions of$506 million to the 2016-17 guarantee and $953 million to the 2017-18 guarantee, relative to 2016 BudgetAct levels. The Governor manages these reductions by deferring $859.1 million in Local Control FundingFormula (LCFF) expenditures from June 2017 to July 2017 and $310 million of one-time discretionaryfunding expenditures attributable to the 2015-16 fiscal year to 2016-17. (We will provide greater detail andanalysis on these ups and downs in our Special Fiscal Report article later today.)
While there are many representations of the actual per-student funding provided, the Governor’s Budgetasserts that total per-pupil expenditures from all sources are projected to be $14,822 in 2016-17 and $15,216in 2017-18. From Proposition 98 alone, those figures are $10,579 and $10,910, respectively.
Special Education
Coming on the heels of the report by the Public Policy Institute of California, the Administration will“engage stakeholders throughout the spring budget process for feedback on the current special educationfinance system and the recommendations included in these recent evaluations,” also citing the CaliforniaStatewide Special Education Task Force report. Special education will be reduced by $4.9 million to reflect aprojected decrease in special education average daily attendance. No other changes are proposed at this time.
Local Control Funding Formula
Governor Brown proposes an additional $744 million to continue the implementation of the LCFF. Thisamount funds an estimated 1.48% cost-of-living adjustment, and maintains the LCFF implementation level
SSC Fiscal Report print http://www.sscal.com/fiscal_print.cfm?contentID=21404
1 of 2 1/23/2017 3:04 PM

at 96% as in the current year.
Discretionary Funds
As we have seen in the past several State Budget proposals, though at a significantly lower level of fundingreflecting the economic slowdown, Governor Brown proposes $287 million in one-time Proposition 98General Fund money for school districts, charter schools, and county offices of education to use at localdiscretion, which would be counted by the state as offsetting mandate reimbursement claims for theseentities.
K-12 School Facilities
Governor Brown acknowledged the $7 billion approved by voters in 2016 with the overwhelming passage ofProposition 51. However, the Governor believes there are “shortcomings” with the existing program andpledges to work with the State Allocation Board and the Office of Public School Construction to revisepolicies and regulations before any Proposition 51 funding is released. The Administration will alsointroduce legislation requiring facility bond expenditures to be included in the annual K-12 Audit Guide.
Summary
This very broad extract of the Governor’s Budget proposals is provided to keep you informed. Over the nextfew hours and days, we will be working to distill the information and make it actionable for local educationalagencies (LEAs).
Stay tuned for our Special Fiscal Report and for our Governor’s Budget Workshop. Those forums provide uswith an opportunity to add the details and clarifications that allow you to assess the impact of the Governor’sBudget proposal on your LEA.
—SSC Staff
posted 01/10/2017
SSC Fiscal Report print http://www.sscal.com/fiscal_print.cfm?contentID=21404
2 of 2 1/23/2017 3:04 PM

Thursday, January 19, 2017 9:00 to 11:30amArchibald Room
9630 7th St., Rancho Cucamonga, CA 91730
The 2017-18 budget proposal from Governor Brown will provide the first critical opportunity for school officials to focus their advocacy efforts and planning for the next school year. It already appears that there will be some significant disagreements about the short-term fiscal outlook. The Legislative Analyst’s Office (LAO) forecasts that revenues will likely continue to increase at a slow, steady rate. The Department of Finance and Governor have not yet released their forecast, but have suggested that the LAO projections are too optimistic and that revenues are likely to be lower. We will assess how the competing economic forecasts, as well as voter-approval of Propositions 51 (school facilities We will assess how the competing economic forecasts, as well as voter-approval of Propositions 51 (school facilities bond) and 55 (extension of high-income earner tax), will impact budget dynamics for the next few years. We will also provide a comprehensive review of the Governor’s January budget proposals, and the likely responses from the Legislature and the education community that will help shape the final 2017-18 budget. Please join us for this free workshop held at the county office. You can register for the budget workshop at www.CapitolAdvisors.org
To Register, Please go to:
www.CapitolAdvisors.org
Budget Perspectives Workshop Governor’s Budget 2017-18


™No. 17-2 F3 NewsFlash®
JANUARY 2017
California Supreme Court Declines Reviewof Out-of-District Charter School Decision
The debate over whether a charter school may operate outside of the geographical boundaries of itsauthorizing district, but within the same county, is now over.
On January 18, 2017, the California Supreme Courtannounced that it will not review the decision inAnderson Union High School District v. ShastaSecondary Home School (“Anderson decision”), acase that has been closely monitored by localeducational agencies and charter schools alike. TheCourt of Appeal had previously ruled that charterschools generally may not operate resource centersoutside of their authorizing school district’sboundaries even if they are within the same county,unless they fall within one of the narrow statutoryexceptions. The California Supreme Court’sdecision not to hear this case on appeal means thatthe Anderson decision stands.
Unless a charter school meets one of the limitedexceptions set forth in the Education Code, it maynot operate a resource center or other site outside of the boundaries of its authorizing district. Thisrestriction applies regardless of whether the charter school is operating a seat-based or nonclassroom-based (e.g., virtual, online, independent study) program. Please view our previous NewsFlash, availablehere, for a summary of the exceptions.
Given the California Supreme Court’s decision to let the lower court ruling stand, districts will want tocarefully review and consider their options and potential legal obligations in the event that they haveeither authorized a charter school operating a resource center or satellite facility outside of theirboundaries, or a charter school is currently operating an unauthorized resource center or satellite facilityin their district. Because such options and legal obligations will depend on the unique circumstances ofyour district, we recommend that you consult with your legal counsel to discuss potential next steps.
If you have any questions regarding this matter, please call one of our six offices.
F3 NewsFlash® prepared by Elizabeth (Lisa) Mori, Leslie Lacher and John Norlin.Lisa is a Partner in the F3 Oakland office.
Leslie is a Senior Associate in the F3 San Diego office.John is Special Counsel in the F3 San Diego office.
Have you authorized a charter school that operatesprogram(s) outside of your district boundaries?
Do you have any charter school program(s)operating within your boundaries that you did notauthorize?
Are you aware of any waiver requests pendingbefore the State Board of Education seeking relieffrom the geographical limitations at issue in theAnderson case for charters operating in yourdistrict?
If you answered “yes” to any of the above questions,the Anderson ruling will likely have implications foryour district whether you are an authorizer or a districthosting an unauthorized resource center or satellitefacility.
Who Does the Anderson Decision Impact?

This F3 NewsFlash® is a summary only and not legal advice. We recommend that you consult with legal counsel to determine howthis legal development may apply to your specific facts and circumstances. Information on a free NewsFlash subscription can befound at www.f3law.com.
Keep up to the minute on the latest updates, NewsFlashes, and legal news by following F3 on Twitter:@F3Law.
Document Number 00001-00001/3478117.5
7108 N. Fresno Street, Suite 270, Fresno, California 93720 Tel. 559.860.4700 Fax 559.860.47994160 Temescal Canyon Road, Suite 610, Corona, California 92883 Tel: 951.215.4900 Fax: 760.215.4911
6300 Wilshire Blvd., Suite 1700, Los Angeles, California 90048 Tel. 323.330.6300 Fax 323.330.631170 Washington St., Suite 205, Oakland, California 94607 Tel. 510.550.8200 Fax 510.550.8211
520 Capitol Mall, Suite 400, Sacramento, California 95814 Tel. 916.443.0000 Fax 916.443.00301525 Faraday Ave., Suite 300, Carlsbad, California 92008 Tel. 760.304.6000 Fax 760.304.6011
© 2017 Fagen Friedman & Fulfrost LLP
All rights reserved, except that the Managing Partner of Fagen Friedman & Fulfrost LLP hereby grants permission to any client of FagenFriedman & Fulfrost LLP to use, reproduce and distribute this NewsFlash intact and solely for the internal, noncommercial purposes of suchclient.

I-MTSSSYMPOSIUM
Let’s SetSail
February 15, 2017 Etiwanda Gardens Rancho Cucamonga, CAKeynote topics include:
All attendees will receive a copy of John Hattie’sbook, Visible Learning for Teachers
All attendees will receive a copy of Dr. Quaglia’s book,Student Voice: The Instrument of Change
Breakfast/Registration 8:00 - 8:30 a.m.8:30 a.m. - 4:00 p.m.
$200 per personRegistration includes presenter books, light breakfast,lunch, afternoon snack, and refreshments.
http://sbcss.k12oms.org/52-120886For more information, please visit cahelp.org/imtssor contact [email protected]
To register, please visit
Additional topics may include:
Universal Design for Learning, Equal Access for AllUnderstanding Cultural and Gender DiversityAmplifying Teacher VoiceCyberbullying, Haters and Trolls:The Growing Internet Crisis
When Children are Defiant:Creating a Responsive Classroom
The Science of How We Learn
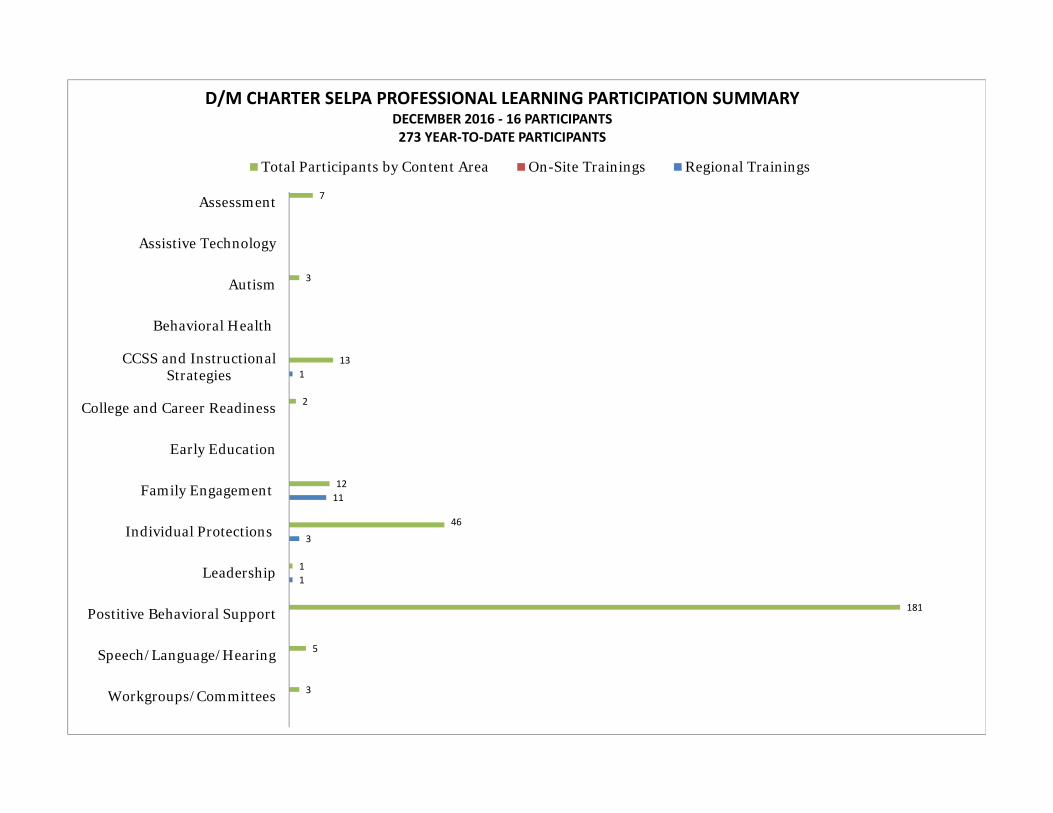
1
3
11
1
3
5
181
1
46
12
2
13
3
7
Workgroups/Committees
Speech/Language/Hearing
Postitive Behavioral Support
Leadership
Individual Protections
Family Engagement
Early Education
College and Career Readiness
CCSS and InstructionalStrategies
Behavioral Health
Autism
Assistive Technology
Assessment
D/M CHARTER SELPA PROFESSIONAL LEARNING PARTICIPATION SUMMARYDECEMBER 2016 ‐ 16 PARTICIPANTS273 YEAR‐TO‐DATE PARTICIPANTS
Total Participants by Content Area On-Site Trainings Regional Trainings

2
2
2
21
15
5
6
Workgroups/Committees
Speech/Language/Hearing
Postitive Behavioral Support
Leadership
Individual Protections
Family Engagement
Early Education
College and Career Readiness
CCSS and InstructionalStrategies
Behavioral Health
Autism
Assistive Technology
Assessment
AVESON GLOBAL LEADERSHIP ACADEMYDECEMBER 2016 ‐ 2 PARTICIPANTS
51 YEAR‐TO‐DATE PARTICIPANTS
Total Participants by Content Area On-Site Trainings Regional Trainings

17
2
1
Workgroups/Committees
Speech/Language/Hearing
Postitive Behavioral Support
Leadership
Individual Protections
Family Engagement
Early Education
College and Career Readiness
CCSS and InstructionalStrategies
Behavioral Health
Autism
Assistive Technology
Assessment
AVESON SCHOOL OF LEADERSDECEMBER 2016 ‐ 0 PARTICIPANTS20 YEAR‐TO‐DATE PARTICIPANTS
Total Participants by Content Area On-Site Trainings Regional Trainings

1
71
1
Workgroups/Committees
Speech/Language/Hearing
Postitive Behavioral Support
Leadership
Individual Protections
Family Engagement
Early Education
College and Career Readiness
CCSS and InstructionalStrategies
Behavioral Health
Autism
Assistive Technology
Assessment
DESERT TRAILS PREP ACADEMYDECEMBER 2016 ‐ 0 PARTICIPANTS73 YEAR‐TO‐DATE PARTICIPANTS
Total Participants by Content Area On-Site Trainings Regional Trainings

1
1
7
20
2
5
Workgroups/Committees
Speech/Language/Hearing
Postitive Behavioral Support
Leadership
Individual Protections
Family Engagement
Early Education
College and Career Readiness
CCSS and InstructionalStrategies
Behavioral Health
Autism
Assistive Technology
Assessment
ENCORE JUNIOR/SENIOR HIGH SCHOOLDECEMBER 2016 ‐ 1 PARTICIPANT37 YEAR‐TO‐DATE PARTICIPANTS
Total Participants by Content Area On-Site Trainings Regional Trainings

56
Workgroups/Committees
Speech/Language/Hearing
Postitive Behavioral Support
Leadership
Individual Protections
Family Engagement
Early Education
College and Career Readiness
CCSS and InstructionalStrategies
Behavioral Health
Autism
Assistive Technology
Assessment
LAVERNE ELEMENTARY PREP ACADEMYDECEMBER 2016 ‐ 0 PARTICIPANTS56 YEAR‐TO‐DATE PARTICIPANTS
Total Participants by Content Area On-Site Trainings Regional Trainings

2
8
3
3
Workgroups/Committees
Speech/Language/Hearing
Postitive Behavioral Support
Leadership
Individual Protections
Family Engagement
Early Education
College and Career Readiness
CCSS and InstructionalStrategies
Behavioral Health
Autism
Assistive Technology
Assessment
ODYSSEY CHARTER SCHOOLSDECEMBER 2016 ‐ 0 PARTICIPANTS16 YEAR‐TO‐DATE PARTICIPANTS
Total Participants by Content Area On-Site Trainings Regional Trainings
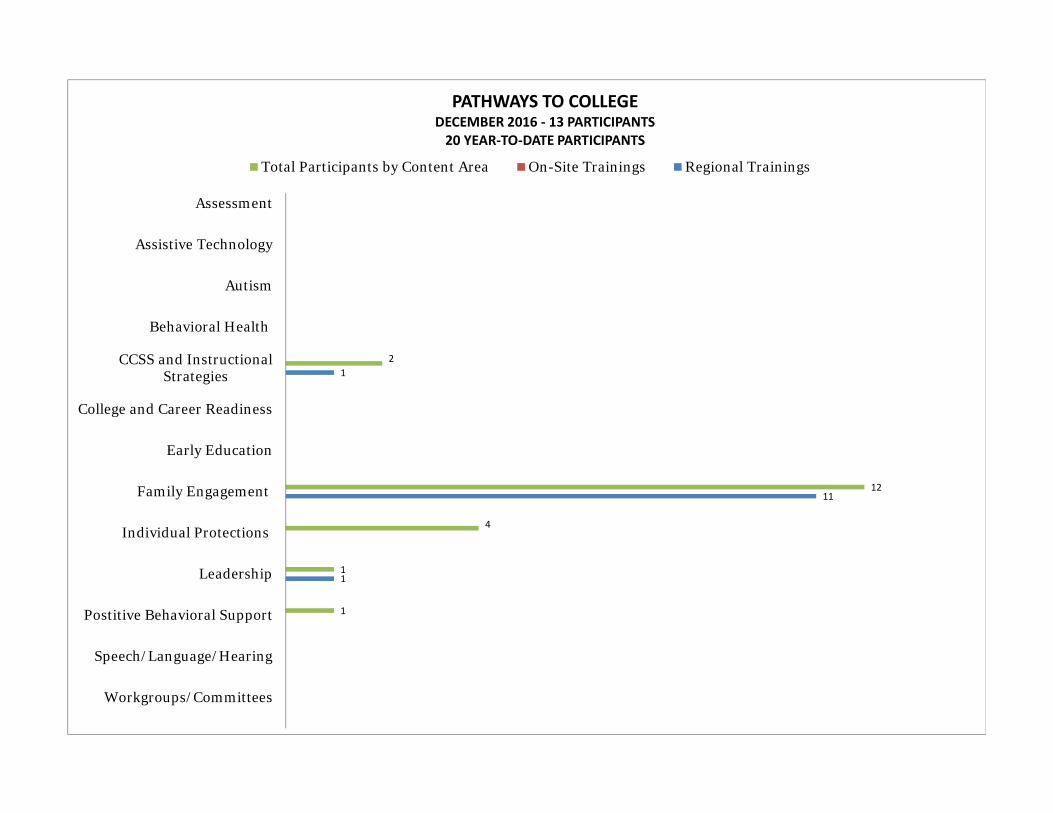
1
11
1
1
1
4
12
2
Workgroups/Committees
Speech/Language/Hearing
Postitive Behavioral Support
Leadership
Individual Protections
Family Engagement
Early Education
College and Career Readiness
CCSS and InstructionalStrategies
Behavioral Health
Autism
Assistive Technology
Assessment
PATHWAYS TO COLLEGEDECEMBER 2016 ‐ 13 PARTICIPANTS20 YEAR‐TO‐DATE PARTICIPANTS
Total Participants by Content Area On-Site Trainings Regional Trainings

1
1
Workgroups/Committees
Speech/Language/Hearing
Postitive Behavioral Support
Leadership
Individual Protections
Family Engagement
Early Education
College and Career Readiness
CCSS and InstructionalStrategies
Behavioral Health
Autism
Assistive Technology
Assessment
TAYLION HIGH DESERT ACADEMYDECEMBER 2016 ‐ 0 PARTICIPANTS2 YEAR‐TO‐DATE PARTICIPANTS
Total Participants by Content Area On-Site Trainings Regional Trainings

DISTRICT
13/14 14/15 15/16 16/17 Total D /W Resolution Mediation Settled Hearing
Aveson Global Leadership Acad N/A N/A 2 0 2 0 0 0 0 0
Aveson School of Leaders N/A N/A 0 2 2 0 0 0 2 0
Desert Trails Prep Academy 0 0 0 0 0 0 0 0 0 0
Encore Junior/Senior High School 0 0 0 0 0 0 0 0 0 0
Encore High School, Riverside N/A N/A 0 0 0 0 0 0 0 0
LaVerne Elem Preparatory 0 0 0 0 0 0 0 0 0 0
Odyssey Charter School N/A N/A 0 0 0 0 0 0 0 0
Pathways to College 0 0 0 0 0 0 0 0 0 0
Taylion High Desert Academy 0 0 0 0 0 0 0 0 0 0
SELPA-WIDE TOTALS 0 0 2 2 4 0 0 0 2 0
Desert/Mountain Charter SELPA
Due Process Summary
July 1, 2016 - January 13, 2017
CASE ACTIVITY FOR CURRENT YEAR
D = Complaint Dismissed W = Complaint Withdrawn
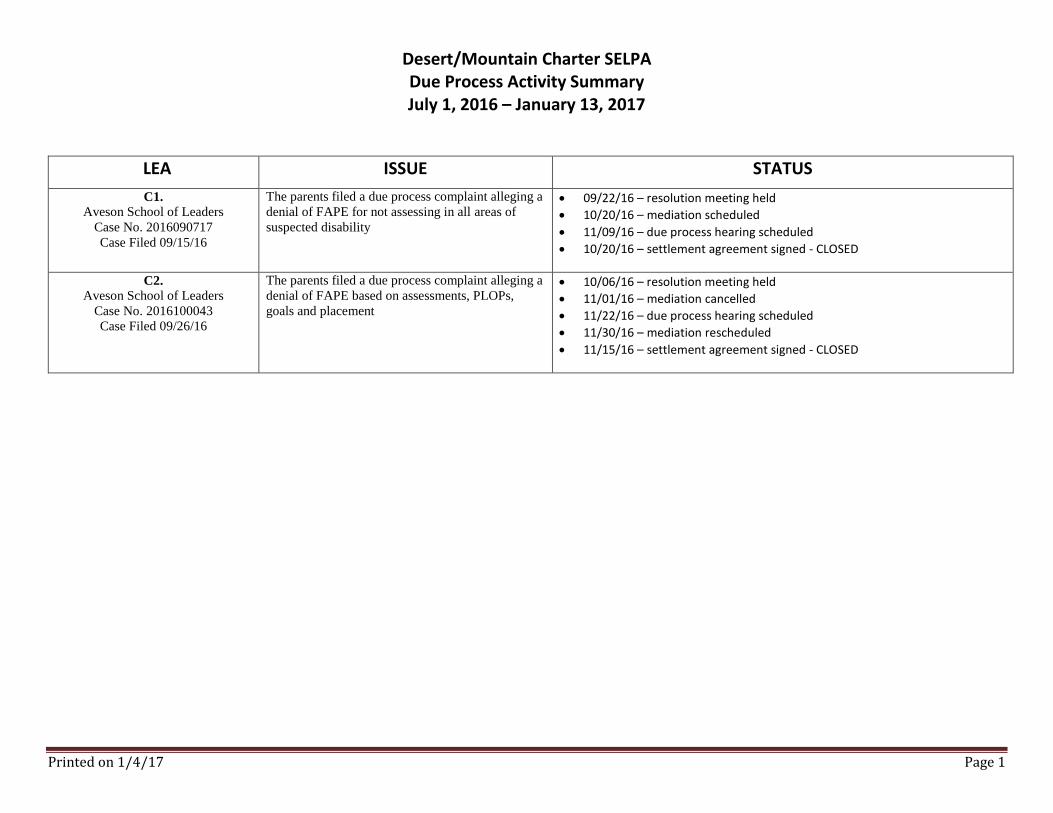
Desert/Mountain Charter SELPA Due Process Activity Summary July 1, 2016 – January 13, 2017
Printed on 1/4/17 Page 1
LEA ISSUE STATUS
C1. Aveson School of Leaders
Case No. 2016090717
Case Filed 09/15/16
The parents filed a due process complaint alleging a
denial of FAPE for not assessing in all areas of
suspected disability
09/22/16 – resolution meeting held
10/20/16 – mediation scheduled
11/09/16 – due process hearing scheduled
10/20/16 – settlement agreement signed - CLOSED
C2. Aveson School of Leaders
Case No. 2016100043
Case Filed 09/26/16
The parents filed a due process complaint alleging a
denial of FAPE based on assessments, PLOPs,
goals and placement
10/06/16 – resolution meeting held
11/01/16 – mediation cancelled
11/22/16 – due process hearing scheduled
11/30/16 – mediation rescheduled
11/15/16 – settlement agreement signed - CLOSED
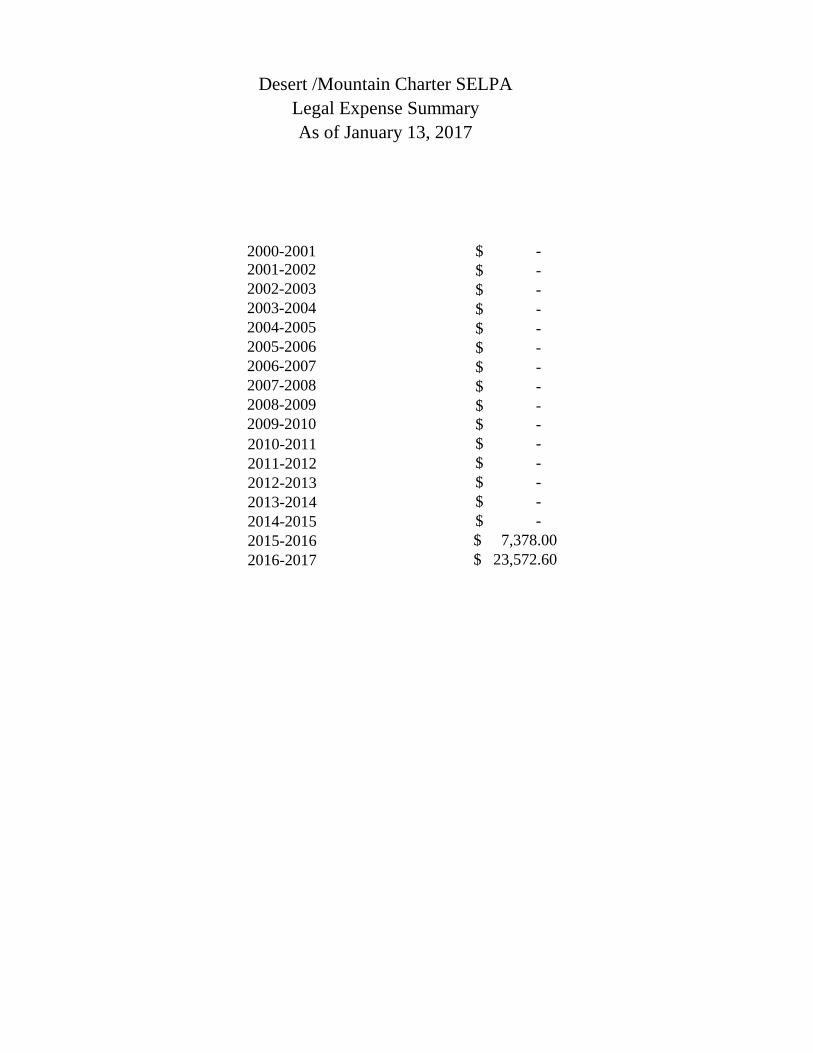
2000-2001 -$
2001-2002 -$
2002-2003 -$
2003-2004 -$
2004-2005 -$
2005-2006 -$
2006-2007 -$
2007-2008 -$
2008-2009 -$
2009-2010 -$
2010-2011 -$
2011-2012 -$
2012-2013 -$
2013-2014 -$
2014-2015 -$
2015-2016 7,378.00$
2016-2017 23,572.60$
Desert /Mountain Charter SELPA
Legal Expense Summary
As of January 13, 2017


![CERTIFICATE OF COMPLETION - Charter SELPA · Certificate of Completion (Education Code [EC] Section 56390) English Three years Four years of approved courses Four years of approved](https://img.pdfslide.net/doc/110x75/5ecc75eb8e53247b147c34ec/certificate-of-completion-charter-selpa-certificate-of-completion-education-code.jpg)