Embed Size (px)
Citation preview
DOI 10.1590/s1982-21702019000S00003
How to cite this article: AZEVEDO, S., OLIVEIRA, R. F., CASACA, W. and SILVA, E.T. Deshadowing of High Spatial Resolution
Imagery. Bulletin of Geodetic Sciences, 25(spe): e2019s003, 2019.
This content is licensed under a Creative Commons Attribution 4.0 International License.
Special Issue - X CBCG ORIGINAL ARTICLE
DESHADOWING OF HIGH SPATIAL RESOLUTION IMAGERY
APPLIED TO URBAN AREA DETECTION
Samara Azevedo¹ - ORCID: 0000-0001-6237-3070
Renan Furlan de Oliveira² - ORCID: 0000-0002-1361-0356
Wallace Casaca³ - ORCID: 0000-0002-1073-9939
Erivaldo Silva4 - ORCID: 0000 0002 7069 0479
1 Universidade Federal de Itajubá, Instituto de Recursos Naturais, Itajubá, MG, Brasil. E-mail: [email protected]
2 Universidade Estadual Paulista Júlio de Mesquita Filho - UNESP, Programa de Pós-Graduação em
Ciências Cartográficas - PPGCC, Presidente Prudente, SP, Brasil.
E-mail: [email protected]
3 Universidade Estadual Paulista Júlio de Mesquita Filho – UNESP - Campus Experimental de Rosana,
Departamento de Engenharia de Energia, Rosana, SP, Brasil.
E-mail: [email protected]
4 Universidade Estadual Paulista Júlio de Mesquita Filho - UNESP, Departamento de Cartografia,
Presidente Prudente, SP, Brasil.
E-mail: [email protected] in 19th November 2018
Accepted in 26th February 2019
Abstract:
Different built-up structures usually lead to large regions covered by shadows, causing partial or
total loss of information present in urban environments. In order to mitigate the presence of
shadows while improving the urban target discrimination in multispectral images, this paper
proposes an automated methodology for both detection and recovery of shadows. First, the image
bands are preprocessed in order to highlight their most relevant parts. Secondly, a shadow
detection procedure is performed by using morphological filtering so that a shadow mask is
obtained. Finally, the reconstruction of shadow-occluded areas is accomplished by an image
inpainting strategy. The experimental evaluation of our methodology was carried out in four study
areas acquired from a WorldView-2 (WV-2) satellite scene over the urban area of São Paulo city.
The experiments have demonstrated a high performance of the proposed shadow detection
scheme, with an average overall accuracy up to 92%. Considering the results obtained by our
shadow removal strategy, the pre-selected shadows were substantially recovered, as verified by
visual inspections. Comparisons involving both VrNIR-BI and VgNIR-BI spectral indices computed
from original and shadow-free images also attest the substantial gain in recovering anthropic
targets such as streets, roofs and buildings initially damaged by shadows.
Keywords: Shadow Removal, Inpainting, Built-up Area, High Resolution Imagery, Remote Sensing.
Deshadowing of High Spatial Resolution Imagery Applied to Urban Area detection 2
Bulletin of Geodetic Sciences, 25(spe): e20190s003, 2019
1. Introduction
Natural ecosystems changes induced by man suggest built-up regions and their resulting
activities as a significant and measurable driver for climate change (Polydoros and Cartalis, 2015).
Built-up areas are related to any materials primarily associated with human activities and
habitation (Zhang et al., 2017). Remote sensing (RS) imageries play an important role in built-up
areas mapping, since they are timely, cost-effective and useful for many applications which
demand interacting with geospatial data. Thanks to the recent advances in sensor technology,
satellite imagery can now provide very high spatial resolution data, allowing for checking details
in built-up areas. However, extracting urban information from high-resolution images usually
suffer from large areas damaged by shadows, which are misclassified and wrongly interpreted
(Dare, 2005).
Shadows are formed when sunlight is blocked by tall objects present at the scene, causing
partial or even total loss of spectral information from the Earth surface covered by shadows. This
effect can interfere in the acquisition of reliable data such as road network (Li et al., 2016),
buildings (Ok, 2013), and vehicles (Asaidi et al., 2014). Therefore, removing shadows from RS
images has been an important task for real-world applications, being essential as a preprocessing
step for multisource data such as video sequence (Sanin et al., 2012, Al-najdawi et al., 2012), aerial
(Adeline et al., 2013), and satellite images (Dare, 2005, Song et al., 2015). Diverse attempts have
been made in the RS literature towards dealing separately with the shadow detection and removal
in VHR images (Chung et al., 2009, Liasis and Stavrou, 2016, Tian et al., 2016, Sasi and Govindan,
2016). However, due to the complexity of both problems offers for existing techniques, processing
highly heterogeneous urban areas carrying distinct image elements has been a challenging and
labor-intensive task, especially when one intends to both detect and recover the patterns
damaged by the shadows. Moreover, misclassification and false detection due to the presence of
dark materials are other common issues recurrently faced by existing shadow detection methods,
as stated by Adeline et al. (2013).
Considering the image reconstruction task, most methods in the RS literature only address
the problem for low- or medium-spatial-resolution images, filling the gap caused by dead or
missing pixels from a sensor failure or natural sources as cloud cover (Vuolo et al., 2017). The use
of multitemporal data was proposed by Gao and Gu (2017) in order to recovering Landsat ETM+
SLC-off and cloud cover data. Although the aforementioned method can fully deal with those gaps,
the need for longer time series can be a barrier, especially for high spatial resolution images due
to its commercial acquisition. Moreover, multitemporal data-driven methods are prone to failure
when tackling the abrupt transformations of geographical objects over the time (Li et al., 2016).
The study of inpainting techniques has been received considerable attention, especially
when one needs to reconstruct textured regions or enhance data availability, since these
techniques only employ the information present in the images themselves to generate consistent
results. Mostly inpainting methods found in the literature focus on reconstructing clouds or cloud
shadows. For instance, Maalouf et al. (2009) proposed the use of Bandelet transform, with the
purpose of better representing the geometric flow of the image structures so as to fill RS images
impaired by clouds. Lorenzi et al. (2011) presented a reconstruction method for very high
3 Azevedo et al.
Bulletin of Geodetic Sciences, 25(spe): e20190s003, 2019
resolution (VHR) images, by propagating the spectral information retrieved from outside the
missing area to accomplish the restoration. Despite being pioneer in using inpainting for urban
targets reconstruction in high spatial resolution images, their method is sensitive to the size of the
area to be recover, leading to large errors of data propagation and visual inconsistencies as the
inpainting domain increases. Another issue is the search for optimal pixel blocks in different
resolutions of the image, which increases the computational burden of the method.
In this paper, both the shadow detection and the shadow removal problems are addressed
for RS images, by means of a unified framework which benefits from the high spatial resolution
satellite data from urban areas, combining both contextual and spectral data for the tasks of
detecting and recovering the urban targets occluded by shadows. First, the image bands are pre-
processed to increase the discrimination of urban targets in the urban scene. The shadow
detection modulus of our framework is then applied to identifying regions damaged by shadows,
which is properly performed by combing effective morphology-based filters. From the detected
shadow areas as given in previous step, a hybrid inpainting-inspired strategy specifically designed
to take advantage of the multispectral imagery context is applied. This strategy unifies anisotropic
diffusion, filling-in priority based on cartoon image representations, transport equation, and block-
based pixel replication from a locally dynamic sampling process.
The present algorithm was implemented in MATLAB platform and validated using
pansharpened reflectance WorldView-2 (WV2) imagery. Also, in order to check the real
effectiveness of our framework for the combined tasks of shadow detection and removal, two
visible-based built-up indices VrNIR-BI and VgNIR-BI (Estoque and Murayama, 2015) have been
computed over the shadow-free imagery. Based on these indices, the conducted experiments
have demonstrated that the proposed framework can significantly improve useful urban areas of
the image, as properly verified by visual inspections and by quantitative analysis involving urban
targets directly extracted by the built-up indices. Finally, another beneficial aspect of the current
method is that once only multispectral imagery is required as input data, it can be suitable to
support other remote sensing applications as well.
2. Methodology
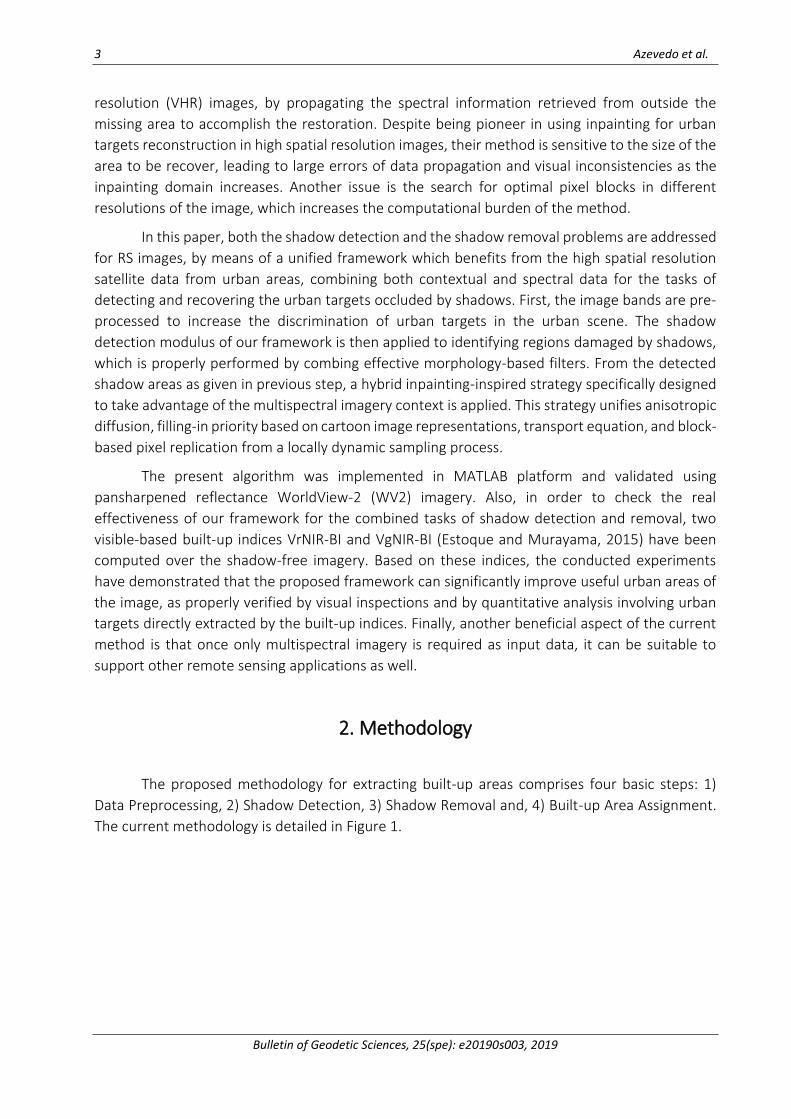
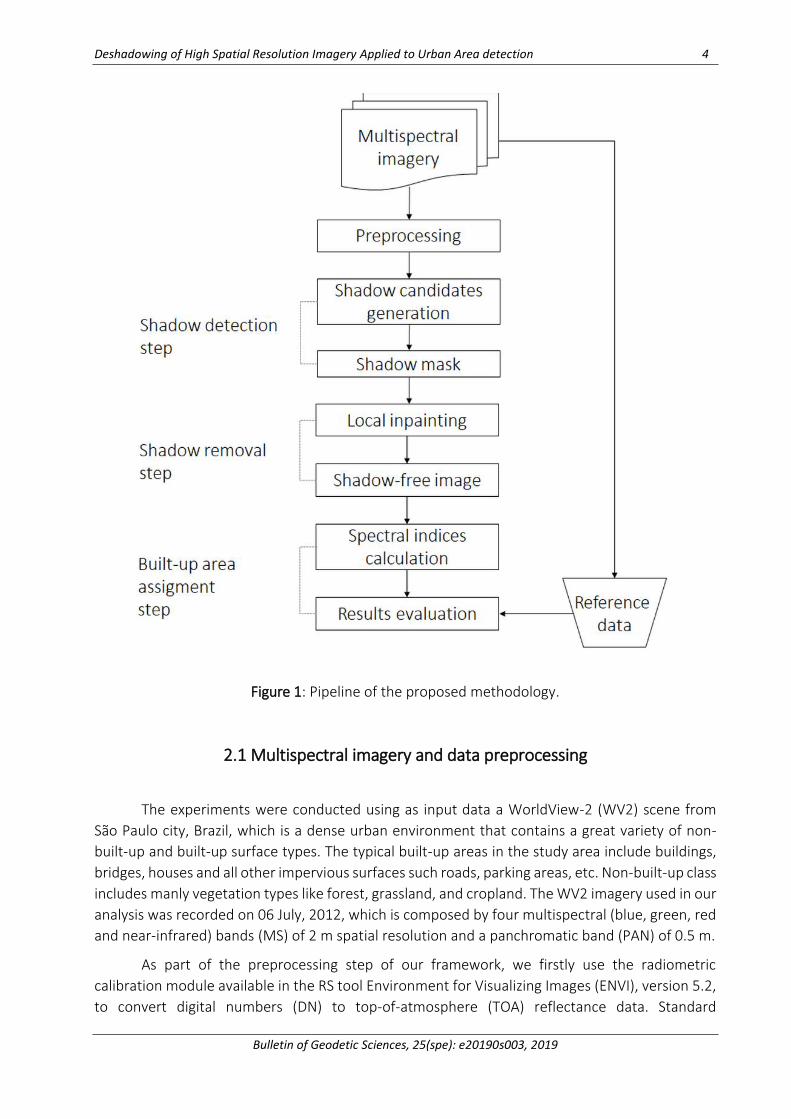
The proposed methodology for extracting built-up areas comprises four basic steps: 1)
Data Preprocessing, 2) Shadow Detection, 3) Shadow Removal and, 4) Built-up Area Assignment.
The current methodology is detailed in Figure 1.
Deshadowing of High Spatial Resolution Imagery Applied to Urban Area detection 4
Bulletin of Geodetic Sciences, 25(spe): e20190s003, 2019
Figure 1: Pipeline of the proposed methodology.
2.1 Multispectral imagery and data preprocessing
The experiments were conducted using as input data a WorldView-2 (WV2) scene from
São Paulo city, Brazil, which is a dense urban environment that contains a great variety of non-
built-up and built-up surface types. The typical built-up areas in the study area include buildings,
bridges, houses and all other impervious surfaces such roads, parking areas, etc. Non-built-up class
includes manly vegetation types like forest, grassland, and cropland. The WV2 imagery used in our
analysis was recorded on 06 July, 2012, which is composed by four multispectral (blue, green, red
and near-infrared) bands (MS) of 2 m spatial resolution and a panchromatic band (PAN) of 0.5 m.
As part of the preprocessing step of our framework, we firstly use the radiometric
calibration module available in the RS tool Environment for Visualizing Images (ENVI), version 5.2,
to convert digital numbers (DN) to top-of-atmosphere (TOA) reflectance data. Standard
5 Azevedo et al.
Bulletin of Geodetic Sciences, 25(spe): e20190s003, 2019
parameters as available at metadata files are considered to properly perform this correction. Also,
in this step, the MS bands are fused with the PAN band using the Gram-Schmidt pansharpening
method (Maurer, 2013), as available in the ENVI 5.2. This is done to improve the spatial details of
the MS images as well as to magnify the difference between certain types of land cover. Notice
that, in our preprocessing pipeline, no co-register between bands is necessary since the WV2
imagery was captured at the same time with the same sensor.
In order to verify the consistence of spectral and spatial characteristics of MS bands after
the fusion process, pansharpened imagery is assessed based on metrics such Correlation
Coefficient (CC), Universal Image Quality Index (UIQI), Root Mean Squared Error (RMSE), and
Relative Global Dimensional Synthesis Error (ERGAS) (Yuhendra et al., 2012). The evaluation is then
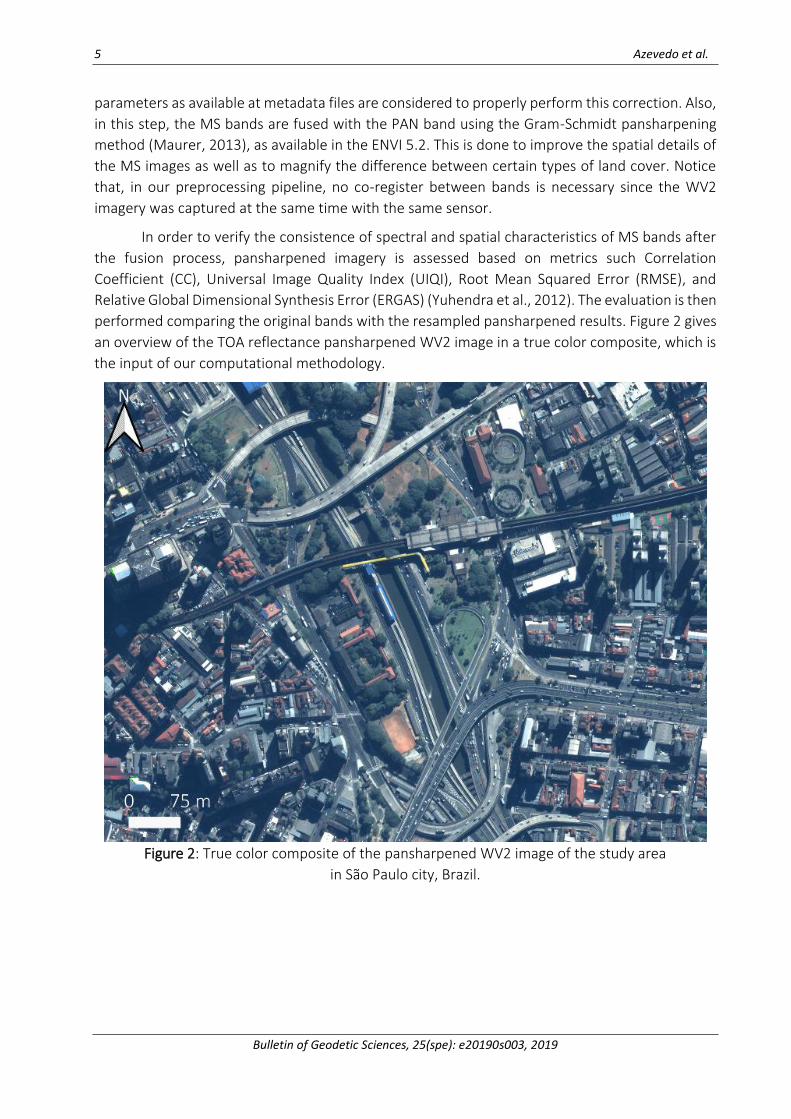
performed comparing the original bands with the resampled pansharpened results. Figure 2 gives
an overview of the TOA reflectance pansharpened WV2 image in a true color composite, which is
the input of our computational methodology.
Figure 2: True color composite of the pansharpened WV2 image of the study area
in São Paulo city, Brazil.
Deshadowing of High Spatial Resolution Imagery Applied to Urban Area detection 6
Bulletin of Geodetic Sciences, 25(spe): e20190s003, 2019
2.2 Shadow detection
The shadow detection and removal module has been implemented in MATLAB, version
R2017b. The shadow detection task is performed considering the spectral and contextual data as
provided by the shadows in MS and PAN images. First, based on the assumption that shadows
pixels are the lowest sensor radiance values than their sunlit neighborhoods (Adeline et al., 2013),
Black-Top-Hat (BTH) transformation (Equation 1) equipped with area closing instead of classical
closing operator is applied to the PAN image f. In more mathematical terms,
( ) ( )BTH f f f= − (1)
where represents the area closing operator for a gray scale image, computed by:
( )iB
if = (2)
with ∧ accounting for the infimum of all closings with connected structure elements (SEs) (Bi)
whose sizes, in number of pixels, are equal to λ (Soille, 2003). Thus, is applied to remove
connected dark components whose area portion is smaller than a parameter λ, being highlighted
when the arithmetic difference between and the input image f is achieved by BTH. The
underlying idea when using area closing is to avoid the computation of a prefixed SE, since these
transformations usually exploit contextual relations and spatial information more effectively than
operators based uniquely on fixed SEs. Such a versatility becomes important when dealing with
undesirable objects like shadows which assume a variety of sizes and shapes in the image. In
addition, the area verification is performed only at the flat zones of the image (i.e., a set of
connected iso-intensity pixels), thus decreasing the processing complexity (Mura et al., 2010).
The so-called shadow spectral index Normalized Saturation-Value Difference Index
(NSDVI), proposed by Ma et al. (2008), is applied to automatically estimate the shadow damaged
area. This spectral index states that shadows are composed by higher saturation and lower values
in the HSV color space, including a short blue-violet wavelength due to the Rayleigh effect of
atmospheric scattering (Polidorio et al., 2003). Normal color composite pansharpened WV2 image
is converted from RGB to HSV space color, and the NSDVI is then calculated. Finally, a binary image
containing shadow candidate pixels is obtained via Otsu binarization (Otsu, 1979).
Although an overestimation is observed in the NSDVI binary mask due to occurrence of
patterns with a similar behavior, NSDVI ensures the coverage of large areas, guaranteeing the
identification of all shadow areas. Indeed, the flexibility promoted by the morphological closing
area operator is of paramount importance for achieving a good level of simplification for the VHR
data, hence reducing the complexity of the data analysis in the next steps of our framework.
Additionally, the described shadow detection steps ensure a fully non-supervised approach which
could be used to support other applications that demand using shadow segmentation into their
computational pipelines.
7 Azevedo et al.
Bulletin of Geodetic Sciences, 25(spe): e20190s003, 2019
Finally, in order to reach more refined results for the pre-segmented shadows, the
resulting mask is processed to remove any vegetation misclassified pixels, by computing the
intersection of shadow candidates generated in the previous step with the spectral Normalized
Difference Vegetation Index (NDVI) mask. Shadow detection results are quantitative assessed
from manually-labeled reference images, i.e., based on the popular Ground Truth (GT) and
performance metrics such as producer’s accuracy, user’s accuracy and overall accuracy, as
properly described by Adeline et al. (2013).
2.3 Local inpainting method
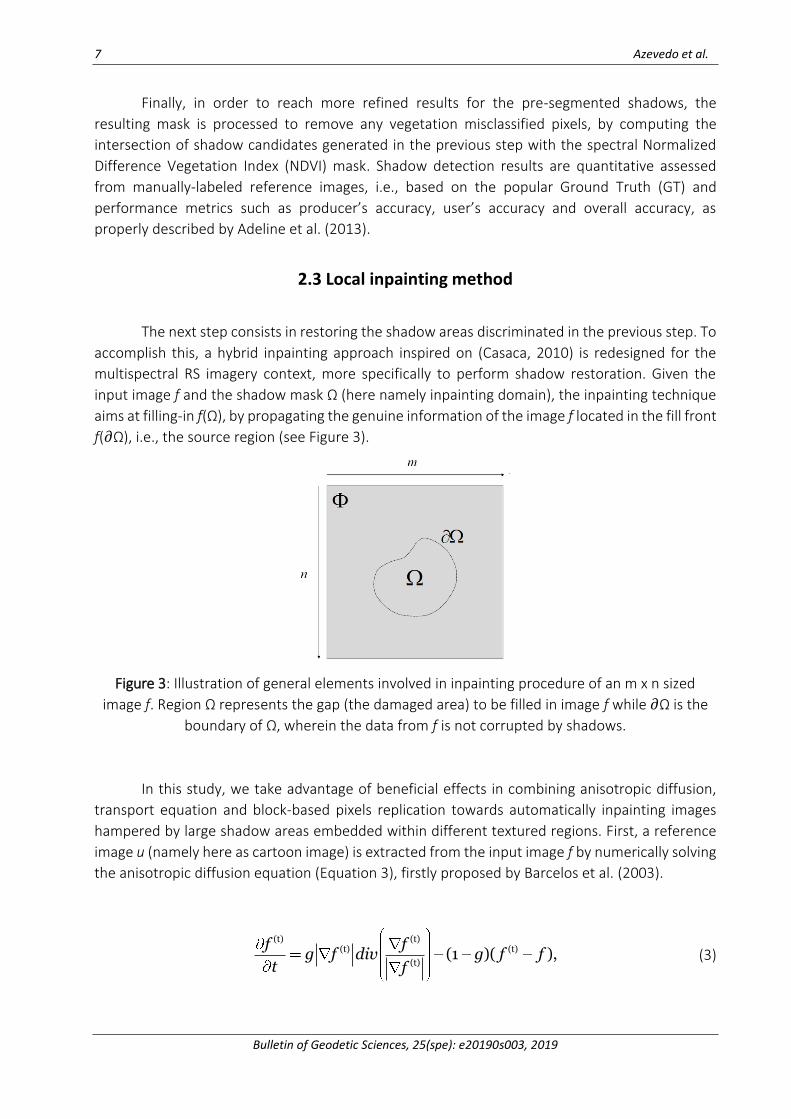
The next step consists in restoring the shadow areas discriminated in the previous step. To
accomplish this, a hybrid inpainting approach inspired on (Casaca, 2010) is redesigned for the
multispectral RS imagery context, more specifically to perform shadow restoration. Given the
input image f and the shadow mask Ω (here namely inpainting domain), the inpainting technique
aims at filling-in f(Ω), by propagating the genuine information of the image f located in the fill front
f(𝜕Ω), i.e., the source region (see Figure 3).
Figure 3: Illustration of general elements involved in inpainting procedure of an m x n sized
image f. Region Ω represents the gap (the damaged area) to be filled in image f while 𝜕Ω is the
boundary of Ω, wherein the data from f is not corrupted by shadows.
In this study, we take advantage of beneficial effects in combining anisotropic diffusion,
transport equation and block-based pixels replication towards automatically inpainting images
hampered by large shadow areas embedded within different textured regions. First, a reference
image u (namely here as cartoon image) is extracted from the input image f by numerically solving
the anisotropic diffusion equation (Equation 3), firstly proposed by Barcelos et al. (2003).
(t) (t)
(t) (t)
(t)(1 )( ),
f fg f div g f f
t f (3)
Deshadowing of High Spatial Resolution Imagery Applied to Urban Area detection 8
Bulletin of Geodetic Sciences, 25(spe): e20190s003, 2019
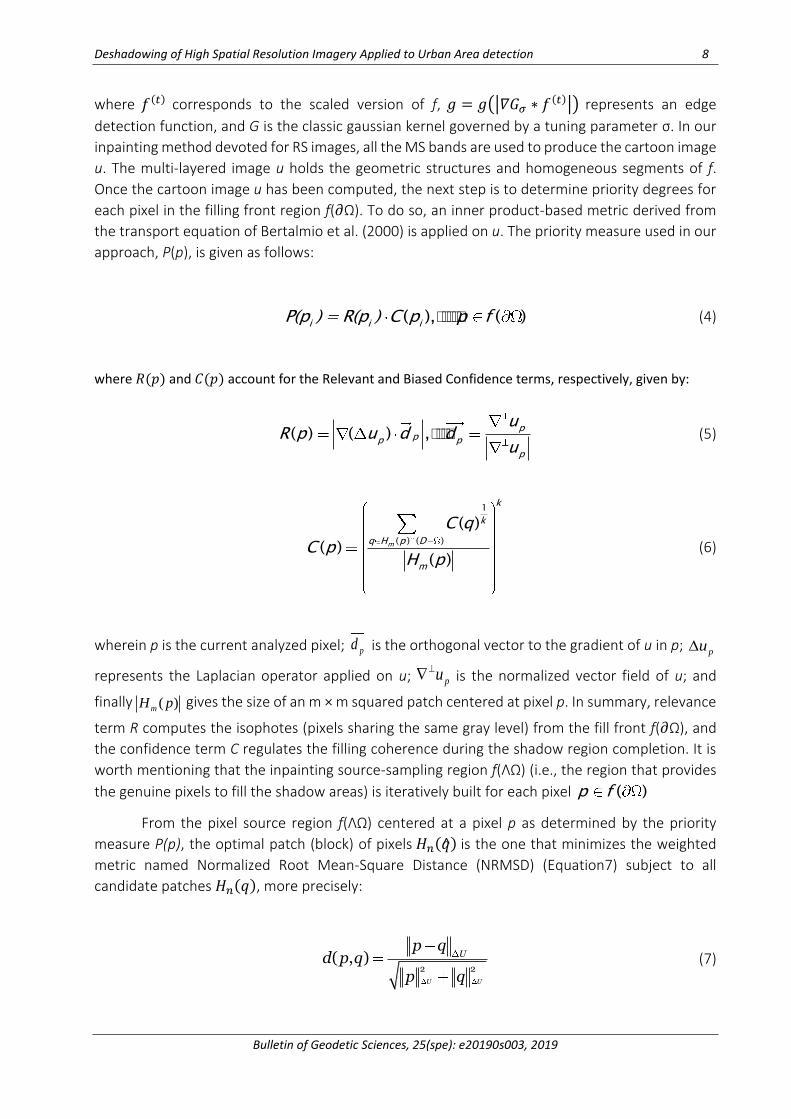
where 𝑓(𝑡) corresponds to the scaled version of f, 𝑔 = 𝑔(|𝛻𝐺𝜎 ∗ 𝑓(𝑡)|) represents an edge
detection function, and G is the classic gaussian kernel governed by a tuning parameter σ. In our
inpainting method devoted for RS images, all the MS bands are used to produce the cartoon image
u. The multi-layered image u holds the geometric structures and homogeneous segments of f.
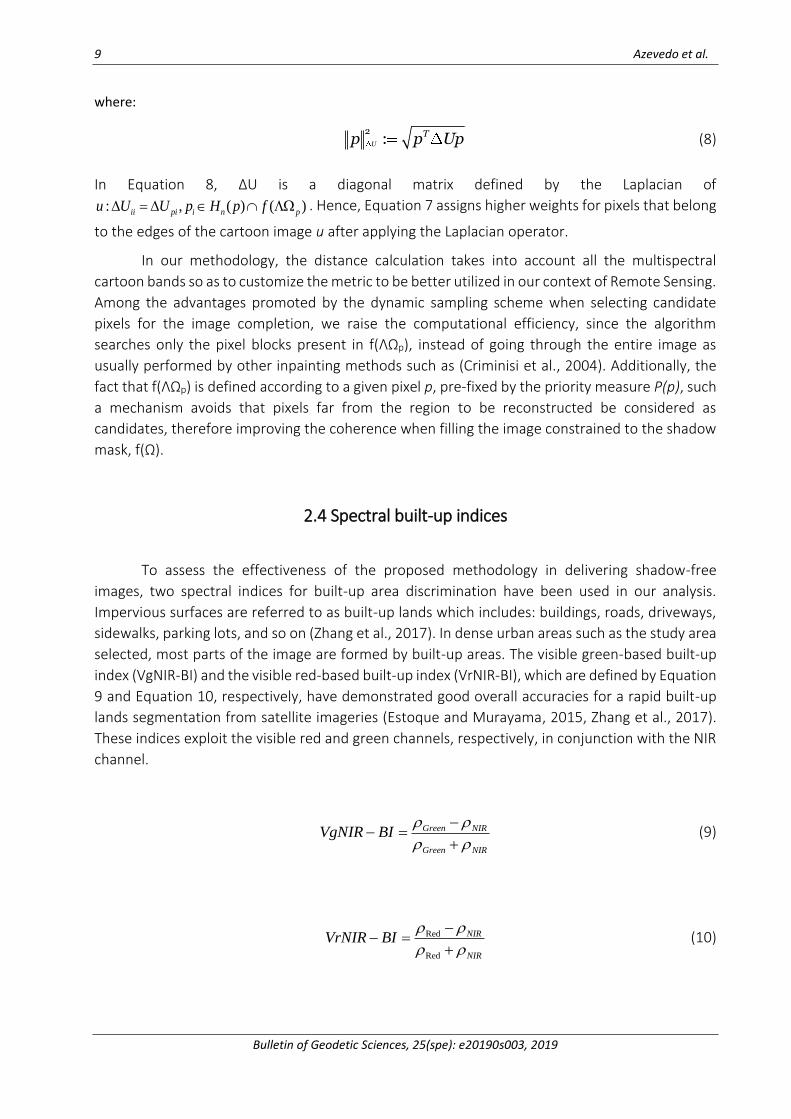
Once the cartoon image u has been computed, the next step is to determine priority degrees for
each pixel in the filling front region f(𝜕Ω). To do so, an inner product-based metric derived from
the transport equation of Bertalmio et al. (2000) is applied on u. The priority measure used in our
approach, P(p), is given as follows:
), ( ( )i i iP(p ) = R(p ) C p p f (4)
where 𝑅(𝑝) and 𝐶(𝑝) account for the Relevant and Biased Confidence terms, respectively, given by:
( ) ( ) , ppp p
p
du
R p u du
(5)
1
( ) ( )
( )
( )( )
m
k
k
q H p D
m
C q
C pH p
(6)
wherein p is the current analyzed pixel; pd is the orthogonal vector to the gradient of u in p; pu
represents the Laplacian operator applied on u; pu⊥ is the normalized vector field of u; and
finally ( )mH p gives the size of an m × m squared patch centered at pixel p. In summary, relevance
term R computes the isophotes (pixels sharing the same gray level) from the fill front f(𝜕Ω), and
the confidence term C regulates the filling coherence during the shadow region completion. It is
worth mentioning that the inpainting source-sampling region f(ΛΩ) (i.e., the region that provides
the genuine pixels to fill the shadow areas) is iteratively built for each pixel ( )p f
From the pixel source region f(ΛΩ) centered at a pixel p as determined by the priority
measure P(p), the optimal patch (block) of pixels 𝐻𝑛(𝑞) is the one that minimizes the weighted
metric named Normalized Root Mean-Square Distance (NRMSD) (Equation7) subject to all
candidate patches 𝐻𝑛(𝑞), more precisely:
2 2
( , )
U U
Up q
d p qp q
(7)
9 Azevedo et al.
Bulletin of Geodetic Sciences, 25(spe): e20190s003, 2019
where:
2:U
Tp p Up (8)
In Equation 8, ∆U is a diagonal matrix defined by the Laplacian of
: , ( ) ( )ii pi i n pu U U p H p f = . Hence, Equation 7 assigns higher weights for pixels that belong
to the edges of the cartoon image u after applying the Laplacian operator.
In our methodology, the distance calculation takes into account all the multispectral
cartoon bands so as to customize the metric to be better utilized in our context of Remote Sensing.
Among the advantages promoted by the dynamic sampling scheme when selecting candidate
pixels for the image completion, we raise the computational efficiency, since the algorithm
searches only the pixel blocks present in f(ΛΩp), instead of going through the entire image as
usually performed by other inpainting methods such as (Criminisi et al., 2004). Additionally, the
fact that f(ΛΩp) is defined according to a given pixel p, pre-fixed by the priority measure P(p), such
a mechanism avoids that pixels far from the region to be reconstructed be considered as
candidates, therefore improving the coherence when filling the image constrained to the shadow
mask, f(Ω).
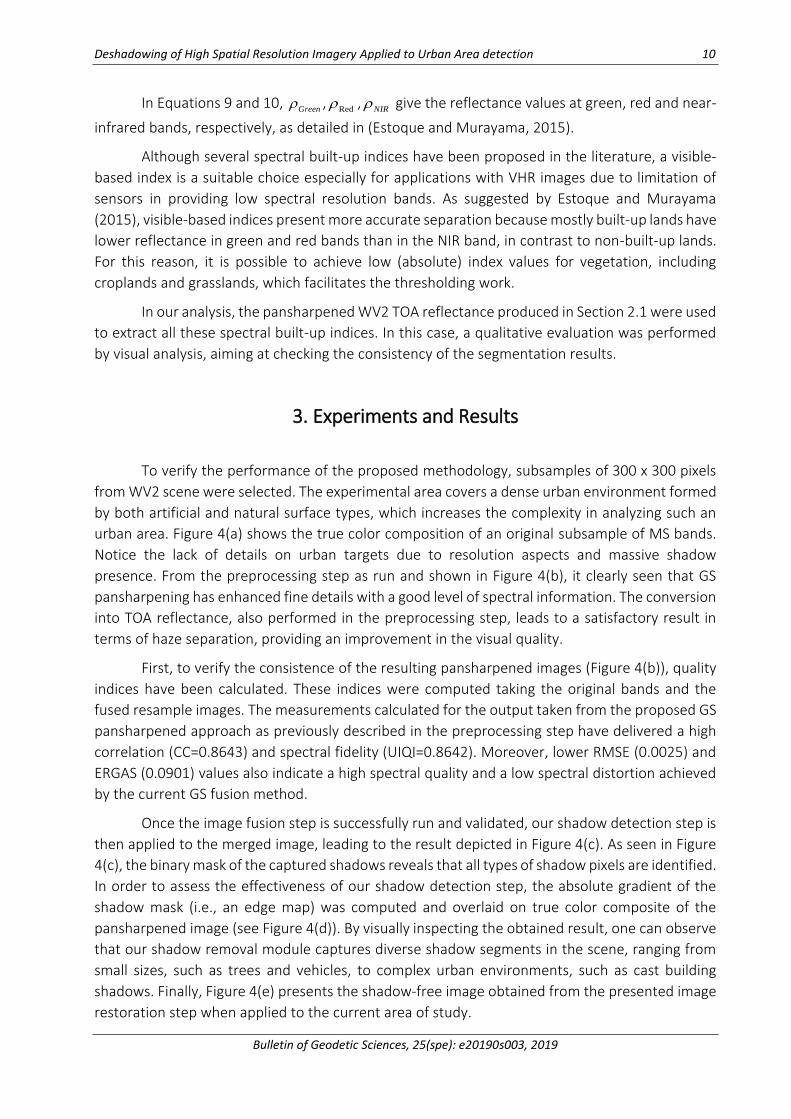
2.4 Spectral built-up indices
To assess the effectiveness of the proposed methodology in delivering shadow-free
images, two spectral indices for built-up area discrimination have been used in our analysis.
Impervious surfaces are referred to as built-up lands which includes: buildings, roads, driveways,
sidewalks, parking lots, and so on (Zhang et al., 2017). In dense urban areas such as the study area
selected, most parts of the image are formed by built-up areas. The visible green-based built-up
index (VgNIR-BI) and the visible red-based built-up index (VrNIR-BI), which are defined by Equation
9 and Equation 10, respectively, have demonstrated good overall accuracies for a rapid built-up
lands segmentation from satellite imageries (Estoque and Murayama, 2015, Zhang et al., 2017).
These indices exploit the visible red and green channels, respectively, in conjunction with the NIR
channel.
Green NIR
Green NIR
VgNIR BI
−− =
+ (9)
Red
Red
NIR
NIR
VrNIR BI
−− =
+ (10)
Deshadowing of High Spatial Resolution Imagery Applied to Urban Area detection 10
Bulletin of Geodetic Sciences, 25(spe): e20190s003, 2019
In Equations 9 and 10, Green ,
Red ,NIR give the reflectance values at green, red and near-
infrared bands, respectively, as detailed in (Estoque and Murayama, 2015).
Although several spectral built-up indices have been proposed in the literature, a visible-
based index is a suitable choice especially for applications with VHR images due to limitation of
sensors in providing low spectral resolution bands. As suggested by Estoque and Murayama
(2015), visible-based indices present more accurate separation because mostly built-up lands have
lower reflectance in green and red bands than in the NIR band, in contrast to non-built-up lands.
For this reason, it is possible to achieve low (absolute) index values for vegetation, including
croplands and grasslands, which facilitates the thresholding work.
In our analysis, the pansharpened WV2 TOA reflectance produced in Section 2.1 were used
to extract all these spectral built-up indices. In this case, a qualitative evaluation was performed
by visual analysis, aiming at checking the consistency of the segmentation results.
3. Experiments and Results
To verify the performance of the proposed methodology, subsamples of 300 x 300 pixels
from WV2 scene were selected. The experimental area covers a dense urban environment formed
by both artificial and natural surface types, which increases the complexity in analyzing such an
urban area. Figure 4(a) shows the true color composition of an original subsample of MS bands.
Notice the lack of details on urban targets due to resolution aspects and massive shadow
presence. From the preprocessing step as run and shown in Figure 4(b), it clearly seen that GS
pansharpening has enhanced fine details with a good level of spectral information. The conversion
into TOA reflectance, also performed in the preprocessing step, leads to a satisfactory result in
terms of haze separation, providing an improvement in the visual quality.
First, to verify the consistence of the resulting pansharpened images (Figure 4(b)), quality
indices have been calculated. These indices were computed taking the original bands and the
fused resample images. The measurements calculated for the output taken from the proposed GS
pansharpened approach as previously described in the preprocessing step have delivered a high
correlation (CC=0.8643) and spectral fidelity (UIQI=0.8642). Moreover, lower RMSE (0.0025) and
ERGAS (0.0901) values also indicate a high spectral quality and a low spectral distortion achieved
by the current GS fusion method.
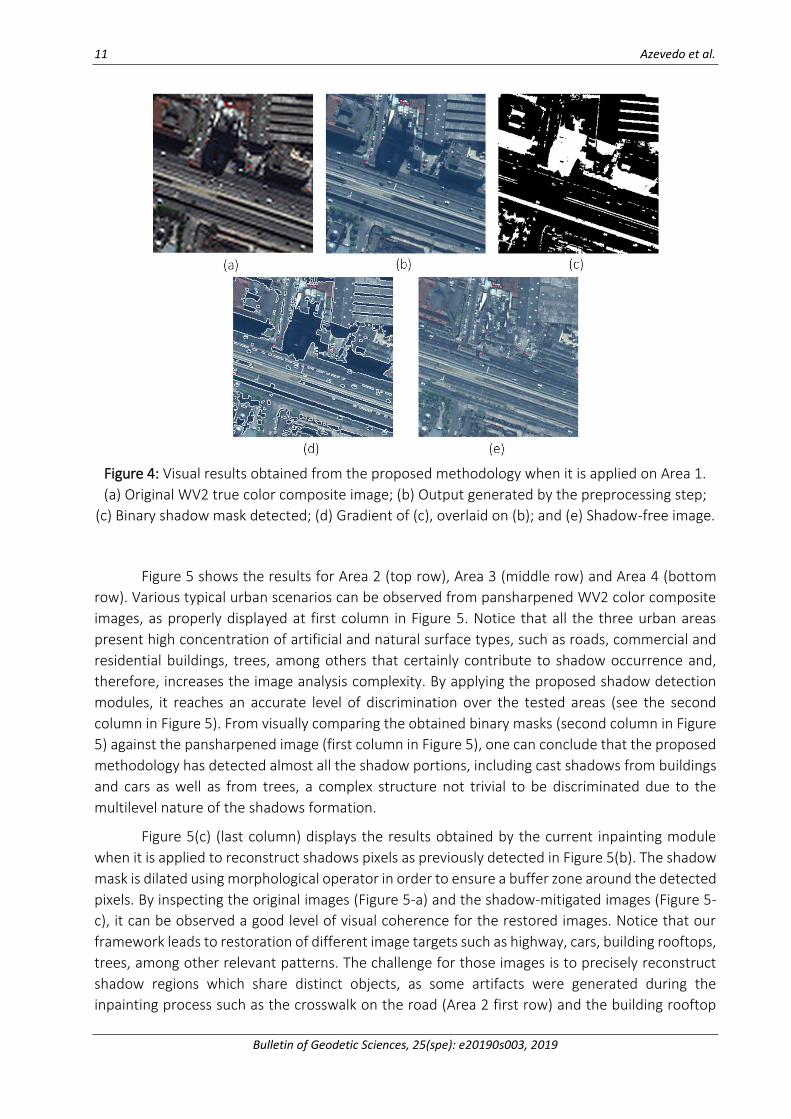
Once the image fusion step is successfully run and validated, our shadow detection step is
then applied to the merged image, leading to the result depicted in Figure 4(c). As seen in Figure
4(c), the binary mask of the captured shadows reveals that all types of shadow pixels are identified.
In order to assess the effectiveness of our shadow detection step, the absolute gradient of the
shadow mask (i.e., an edge map) was computed and overlaid on true color composite of the
pansharpened image (see Figure 4(d)). By visually inspecting the obtained result, one can observe
that our shadow removal module captures diverse shadow segments in the scene, ranging from
small sizes, such as trees and vehicles, to complex urban environments, such as cast building
shadows. Finally, Figure 4(e) presents the shadow-free image obtained from the presented image
restoration step when applied to the current area of study.
11 Azevedo et al.
Bulletin of Geodetic Sciences, 25(spe): e20190s003, 2019
Figure 4: Visual results obtained from the proposed methodology when it is applied on Area 1.
(a) Original WV2 true color composite image; (b) Output generated by the preprocessing step;
(c) Binary shadow mask detected; (d) Gradient of (c), overlaid on (b); and (e) Shadow-free image.
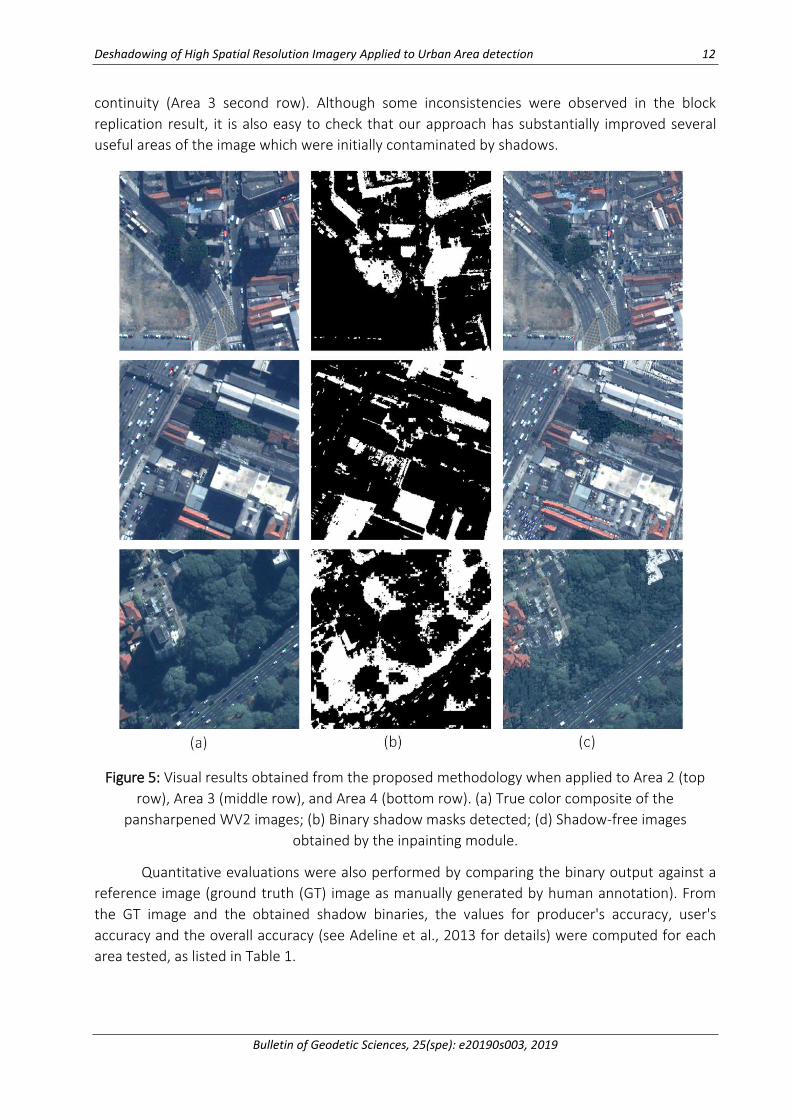
Figure 5 shows the results for Area 2 (top row), Area 3 (middle row) and Area 4 (bottom
row). Various typical urban scenarios can be observed from pansharpened WV2 color composite
images, as properly displayed at first column in Figure 5. Notice that all the three urban areas
present high concentration of artificial and natural surface types, such as roads, commercial and
residential buildings, trees, among others that certainly contribute to shadow occurrence and,
therefore, increases the image analysis complexity. By applying the proposed shadow detection
modules, it reaches an accurate level of discrimination over the tested areas (see the second
column in Figure 5). From visually comparing the obtained binary masks (second column in Figure
5) against the pansharpened image (first column in Figure 5), one can conclude that the proposed
methodology has detected almost all the shadow portions, including cast shadows from buildings
and cars as well as from trees, a complex structure not trivial to be discriminated due to the
multilevel nature of the shadows formation.
Figure 5(c) (last column) displays the results obtained by the current inpainting module
when it is applied to reconstruct shadows pixels as previously detected in Figure 5(b). The shadow
mask is dilated using morphological operator in order to ensure a buffer zone around the detected
pixels. By inspecting the original images (Figure 5-a) and the shadow-mitigated images (Figure 5-
c), it can be observed a good level of visual coherence for the restored images. Notice that our
framework leads to restoration of different image targets such as highway, cars, building rooftops,
trees, among other relevant patterns. The challenge for those images is to precisely reconstruct
shadow regions which share distinct objects, as some artifacts were generated during the
inpainting process such as the crosswalk on the road (Area 2 first row) and the building rooftop
Deshadowing of High Spatial Resolution Imagery Applied to Urban Area detection 12
Bulletin of Geodetic Sciences, 25(spe): e20190s003, 2019
continuity (Area 3 second row). Although some inconsistencies were observed in the block
replication result, it is also easy to check that our approach has substantially improved several
useful areas of the image which were initially contaminated by shadows.
Figure 5: Visual results obtained from the proposed methodology when applied to Area 2 (top
row), Area 3 (middle row), and Area 4 (bottom row). (a) True color composite of the
pansharpened WV2 images; (b) Binary shadow masks detected; (d) Shadow-free images
obtained by the inpainting module.
Quantitative evaluations were also performed by comparing the binary output against a
reference image (ground truth (GT) image as manually generated by human annotation). From
the GT image and the obtained shadow binaries, the values for producer's accuracy, user's
accuracy and the overall accuracy (see Adeline et al., 2013 for details) were computed for each
area tested, as listed in Table 1.
13 Azevedo et al.
Bulletin of Geodetic Sciences, 25(spe): e20190s003, 2019
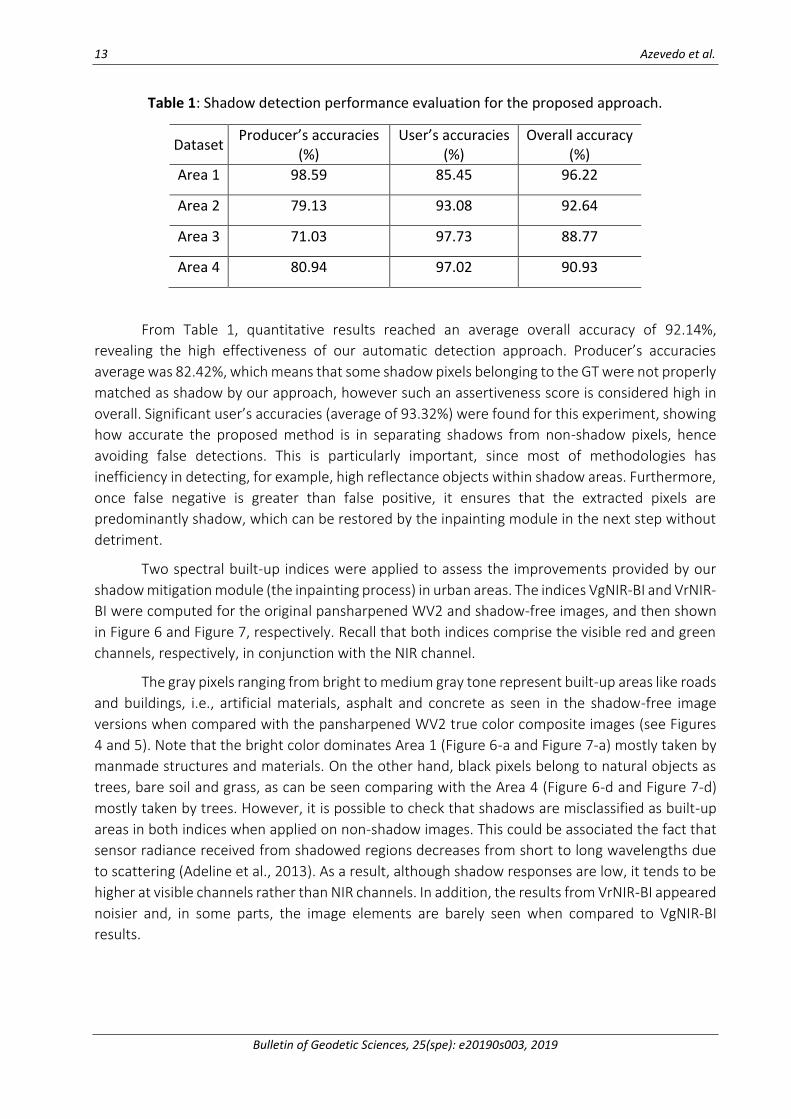
Table 1: Shadow detection performance evaluation for the proposed approach.
Dataset Producer’s accuracies
(%) User’s accuracies
(%) Overall accuracy
(%)
Area 1 98.59 85.45 96.22
Area 2 79.13 93.08 92.64
Area 3 71.03 97.73 88.77
Area 4 80.94 97.02 90.93
From Table 1, quantitative results reached an average overall accuracy of 92.14%,
revealing the high effectiveness of our automatic detection approach. Producer’s accuracies
average was 82.42%, which means that some shadow pixels belonging to the GT were not properly
matched as shadow by our approach, however such an assertiveness score is considered high in
overall. Significant user’s accuracies (average of 93.32%) were found for this experiment, showing
how accurate the proposed method is in separating shadows from non-shadow pixels, hence
avoiding false detections. This is particularly important, since most of methodologies has
inefficiency in detecting, for example, high reflectance objects within shadow areas. Furthermore,
once false negative is greater than false positive, it ensures that the extracted pixels are
predominantly shadow, which can be restored by the inpainting module in the next step without
detriment.
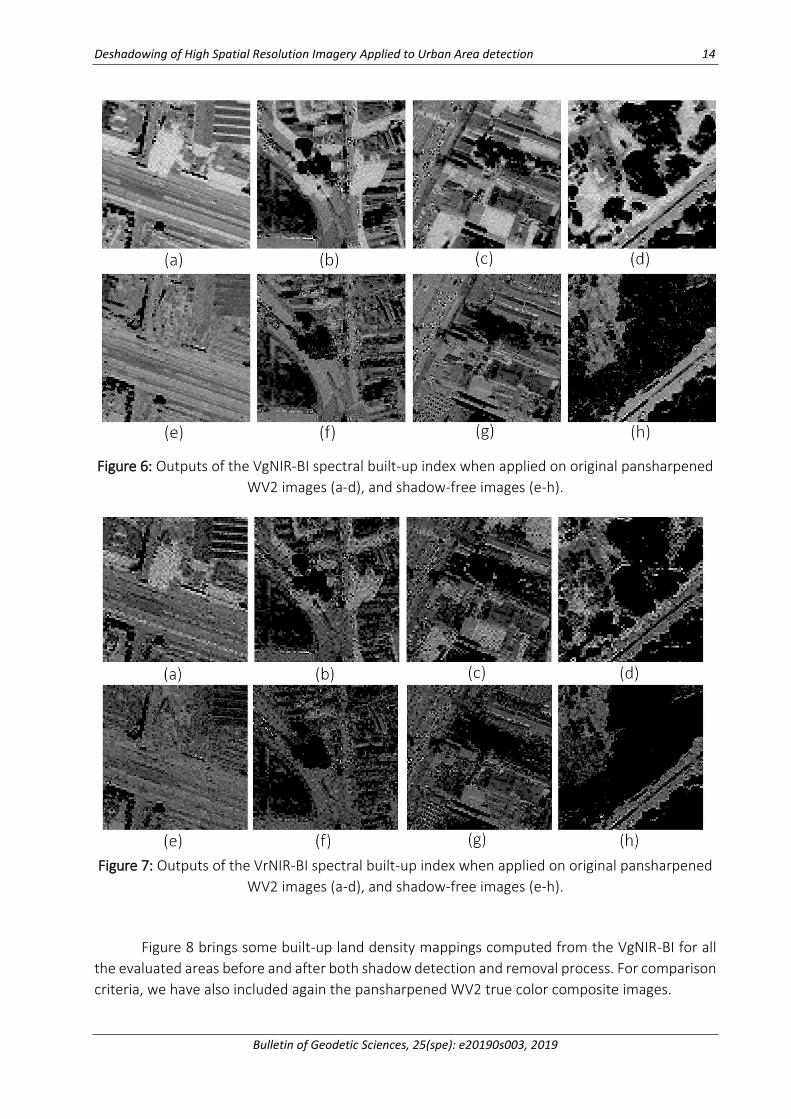
Two spectral built-up indices were applied to assess the improvements provided by our
shadow mitigation module (the inpainting process) in urban areas. The indices VgNIR-BI and VrNIR-
BI were computed for the original pansharpened WV2 and shadow-free images, and then shown
in Figure 6 and Figure 7, respectively. Recall that both indices comprise the visible red and green
channels, respectively, in conjunction with the NIR channel.
The gray pixels ranging from bright to medium gray tone represent built-up areas like roads
and buildings, i.e., artificial materials, asphalt and concrete as seen in the shadow-free image
versions when compared with the pansharpened WV2 true color composite images (see Figures
4 and 5). Note that the bright color dominates Area 1 (Figure 6-a and Figure 7-a) mostly taken by
manmade structures and materials. On the other hand, black pixels belong to natural objects as
trees, bare soil and grass, as can be seen comparing with the Area 4 (Figure 6-d and Figure 7-d)
mostly taken by trees. However, it is possible to check that shadows are misclassified as built-up
areas in both indices when applied on non-shadow images. This could be associated the fact that
sensor radiance received from shadowed regions decreases from short to long wavelengths due
to scattering (Adeline et al., 2013). As a result, although shadow responses are low, it tends to be
higher at visible channels rather than NIR channels. In addition, the results from VrNIR-BI appeared
noisier and, in some parts, the image elements are barely seen when compared to VgNIR-BI
results.
Deshadowing of High Spatial Resolution Imagery Applied to Urban Area detection 14
Bulletin of Geodetic Sciences, 25(spe): e20190s003, 2019
Figure 6: Outputs of the VgNIR-BI spectral built-up index when applied on original pansharpened
WV2 images (a-d), and shadow-free images (e-h).
Figure 7: Outputs of the VrNIR-BI spectral built-up index when applied on original pansharpened
WV2 images (a-d), and shadow-free images (e-h).
Figure 8 brings some built-up land density mappings computed from the VgNIR-BI for all
the evaluated areas before and after both shadow detection and removal process. For comparison
criteria, we have also included again the pansharpened WV2 true color composite images.
15 Azevedo et al.
Bulletin of Geodetic Sciences, 25(spe): e20190s003, 2019
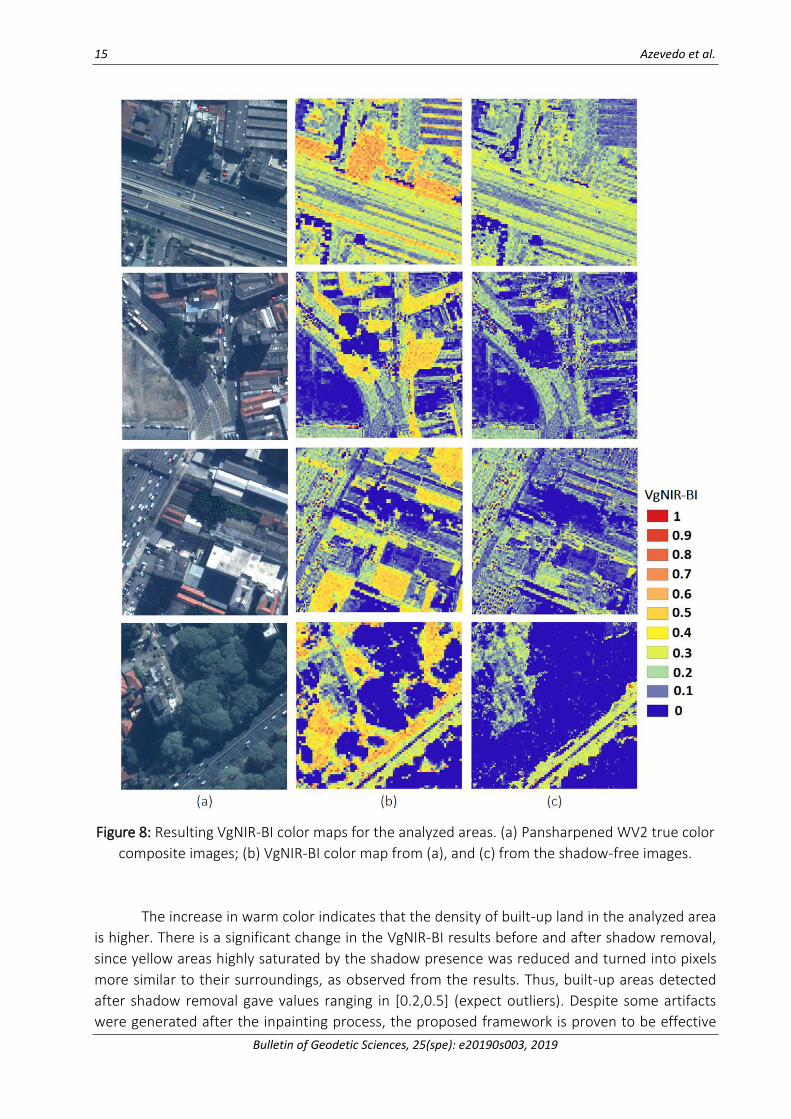
Figure 8: Resulting VgNIR-BI color maps for the analyzed areas. (a) Pansharpened WV2 true color
composite images; (b) VgNIR-BI color map from (a), and (c) from the shadow-free images.
The increase in warm color indicates that the density of built-up land in the analyzed area
is higher. There is a significant change in the VgNIR-BI results before and after shadow removal,
since yellow areas highly saturated by the shadow presence was reduced and turned into pixels
more similar to their surroundings, as observed from the results. Thus, built-up areas detected
after shadow removal gave values ranging in [0.2,0.5] (expect outliers). Despite some artifacts
were generated after the inpainting process, the proposed framework is proven to be effective
Deshadowing of High Spatial Resolution Imagery Applied to Urban Area detection 16
Bulletin of Geodetic Sciences, 25(spe): e20190s003, 2019
for the task of shadow elimination as, for instance, observed from the roads network correctly
detected by VgNIR-BI.
4. Conclusions
Built-up areas are important segments of any city, especially in urban areas. Their
identification and mapping provide useful geospatial information for several applications. In view
of this, shadows formed by manmade objects clearly can hamper the use of valid information from
urban areas. To deal with this issue, this paper proposes a new framework capable of detecting
and removing shadows in high spatial resolution WV2 data representing dense urban areas, by
handling both contextual and spectral data. The designed method achieved an average of overall
accuracy up to 92% for the examined areas, besides providing very accurate outputs in terms of
segmenting shadow and non-shadow pixels, as given by a low rate of false detection (~7%).
Although some shadow pixels belonging to GT were not identified correctly by our approach, a
high number of extracted pixels were classified as shadows. The preprocessing steps also
contributed to the insertion of spatial details into the evaluated images, removing haze effects
while still enhancing the distinction of individual elements.
The shadow removal module designed in terms of anisotropic diffusion, inner product-
based priority measure and exemplar-based completion proved to be effective to deal with
shadows under different perspectives and contamination degrees, reconstructing relevant objects
in a coherent and satisfactory manner. Large shadow areas were reconstructed by the method,
attesting that roads, cars, trees, rooftops, and other particular manmade structures can be
successfully recovered in urban areas.
To measure the coverage of built-up areas, spectral indices were computed after the
complete shadow removal process. The use of both VrNIR-BI and VgNIR-BI indices resulted in a
simple and effective strategy for assessing built-up areas using only the visible spectrum,
particularly the red, green and the NIR channels. Despite the existence of some discontinuous
patches after applying the shadow removal scheme, built-up indices provided more coherent
patterns in the resulting outputs than the original shadow images. Another valid aspect of our
framework is that both detection and restoration tasks occur only based on information coming
from a single scene, leading to a good trade-off between visual quality and low computational
cost.
Acknowledgement
The authors would like to acknowledge the financial support from FAPESP (São Paulo
Research Foundation), grant #2013/25257-4.
Author´s contribution
Both authors contribute equally.
17 Azevedo et al.
Bulletin of Geodetic Sciences, 25(spe): e20190s003, 2019
References
Adeline, K. R. M., Chen, M., Briottet, X., Pang, S. K., Paparoditis, N. 2013. Shadow detection in very
high spatial resolution aerial images: A comparative study. ISPRS Journal of Photogrammetry and
Remote Sensing, 80, pp. 21-38.
Al-najdawi, N., Bez, H. E., Singhai, J., Edirisinghe, E. A. 2012. A survey of cast shadow detection
algorithms. Pattern Recognition Letters, 33(6), pp. 752-764.
Asaidi, H., Aarab B, A., Bellouki, M. 2014. Shadow elimination and vehicles classification
approaches in traffic video surveillance context. Journal of Visual Languages and Computing, 25,
pp. 333–345.
Barcelos, C.A.Z., Boaventura, M., Silva, E.C. 2003. A well-balanced flow equation for noise removal
and edge detection. IEEE Transactions on image processing, 12(7), pp. 751-763.
Bertalmio, M., Sapiro, G., Caselles, V., Ballester, C. 2000. Image Inpainting. In: Proceedings of the
27th annual conference on Computer graphics and interactive techniques (SIGGRAPH), pp. 417-
424. New Orleans, USA, July 2000.
Casaca, W. C. O. 2010. Restauração de Imagens Digitais com Texturas utilizando Técnicas de
Decomposição e Equações Diferenciais Parciais. Dissertação de mestrado. UNESP –IBILCE. São José
do Rio Preto, SP, Brasil. 192 f.
Chung, K.L., Lin, Y.R., Huang, Y.H. 2009. Efficient shadow detection of color aerial images based on
successive thresholding scheme. IEEE Transactions on Geoscience and Remote Sensing, 47(2), pp.
671–682.
Criminisi, A., Perez, P., Toyama, K. 2004. Region filling and object removal by exemplar-based
image inpainting. IEEE Transactions on Image Processing, 13(9), pp. 1200-1212.
Dare, P. M. 2005. Shadow Analysis in High-Resolution Satellite Imagery of Urban Areas.
Photogrammetric Engineering & Remote Sensing, 71(2), pp. 169–177.
Estoque, R. C., Murayama, Y. 2015. Classification and change detection of built-up lands from
Landsat-7 ETM+ and Landsat-8 OLI/TIRS imageries: A comparative assessment of various spectral
indices. Ecological Indicators, 56, pp. 205-217.
Gao, G., Gu, Y. 2017. Multitemporal Landsat missing data recovery based on tempo-spectral angle
model. IEEE Transactions on Geoscience and Remote Sensing, 55(70), pp. 3656-3668.
Li, M., Stein, A., Bijker, W., Zhan, Q. 2016. Region-based urban road extraction from VHR satellite
images using Binary Partition Tree. International Journal of Applied Earth Observation and
Geoinformation, 44, pp. 217–225.
Liasis, G., Stavrou, S. 2016. Satellite images analysis for shadow detection and building height
estimation. ISPRS Journal of Photogrammetry and Remote Sensing, 119, pp. 437–450.
Lorenzi, L., Melgani, F., Mercier, G. 2011. Inpainting strategies for reconstruction of missing data
in VHR images. IEEE Geoscience and remote sensing letters, 8(5), pp. 914-918.
Deshadowing of High Spatial Resolution Imagery Applied to Urban Area detection 18
Bulletin of Geodetic Sciences, 25(spe): e20190s003, 2019
Ma, H., Qin, Q., Shen, X. 2008. Shadow segmentation and compensation in high resolution satellite
images. In: 27th IGARSS (International Geosciences and Remote Sensing Symposium, Boston, USA.
6-11 July 2008, 2, pp. 1036–1039.
Maalouf, A., Carre, P., Augereau, B., Fernandez-maloigne, C. 2009. A bandelet-based inpainting
technique for clouds removal from remotely sensed images. IEEE Transactions on Geoscience and
Remote Sensing, 47(7), pp. 2363–2371.
Maurer, T. 2013. How to pan-sharpen images using the gram-schmidt pan-sharpen method – a
recipe. In: International Archives of the Photogrammetry, Remote Sensing and Spatial Information
Sciences (ISPRS) Hannover Workshop, Germany, 2013.
Mura, M. D., Benediktsson, J. A., Wask, B., Bovolo, F.; Bruzzone, L. 2010. Morphological attribute
profiles for the analysis of very high resolution images. IEEE Transactions on Geoscience and
Remote Sensing, 48(10), pp. 3747 – 3762.
Ok, A. O. 2013. Automated detection of buildings from single VHR multispectral images using
shadow information and graph cuts. ISPRS Journal of Photogrammetry and Remote Sensing, 86,
pp. 21–40.
Otsu, N. 1979. A threshold Selection Method from Gray-Level Histograms. IEEE Transactions on
Systems, Man and Cybernetics, 9(1), pp. 62-69.
Polidorio, A.M., Flores, F.C., Imai, N.N., Tommaselli, A.M.G, Franco, C. 2003. Automatic Shadow
Segmentation in Aerial Color Images. In: XVI SIBGRAPI (Brazilian Symposium on Computer Graphics
and Image), 12–15 October 2003, Sao Carlos, Brazil.
Polydoros, A., Cartalis, C. 2015. Use of earth observation based indices for the monitoring of built-
up area features and dynamics in support of urban energy studies. Energy and Buildings, 98, pp.
92-99.
Sanin, A., Sanderson, C., Lovell, B. C. 2012. Shadow Detection: A Survey and Comparative
Evaluation of Recent Methods. Pattern Recognition, 45(4), pp. 1684–1695.
Sasi Remya K., Govindan, V. K. 2016. Shadow removal using sparse representation over local
dictionaries. Engineering Science and Technology, an International Journal, 19(2), pp. 1067-1075.
Soille, P. 2003. Morphological Image Analysis: Principles and Applications. 2nd ed. Berlin: Springer.
Song, W., Um, X., Yan, G., Huang, S. 2015. Extracting the green fractional vegetation cover from
digital images using a shadow-resistant algorithm (SHAR-LABFVC). Remote Sensing, 7, pp. 10425-
10443.
Tian, J., Qi, X., Qu, L., Tang, Y. 2016. New spectrum ratio properties and features for shadow
detection. Pattern Recognition, v. 51, p. 85-96.
Vuolo, F., Wai-tim, N. B., Atzberger, C. 2017. Smoothing and gap-filling of high resolution multi-
spectral time series: Example of Landsat data. International journal of applied earth observation
and Geoinformation, 57, pp. 202-213.

19 Azevedo et al.
Bulletin of Geodetic Sciences, 25(spe): e20190s003, 2019
Yuhendra, Y., Alimuddin, I., Sumantyo, J. T. S., Kuze, H. 2012. Assessment of pan-sharpening
methods applied to image fusion of remotely sensed multi-band data. International Journal
of Applied Earth Observation and Geoinformation, 18, pp. 165–175.
Zhang, P., Sun, Q., Liu, M., Li, J., Sun, D. 2017. A Strategy of Rapid Extraction of Built-Up Area Using
Multi-Seasonal Landsat-8 Thermal Infrared Band 10 Images. Remote Sensing, 9(11), pp.1126.