Embed Size (px)
Citation preview
Design & Optimization of a Rubber-Bitumen Blend in Preparation
for a Rubberized-Asphalt Road Trial in the State of Kuwait
Dr Salah Zoorob & Eng. Suad K. Al-Bahar
Construction & Building Materials Program
4th Int. Conf. on Rehabilitation &
Maintenance in Civil Eng. (ICRMCE)
Smart Rehabilitation & Maintenance in
Civil Eng. for Sustainable Construction
Solo, Indonesia, July 11-12, 2018

Total Area = 17,818 km2
Citizens = 1.38 million
Expatriates = 3.19 million
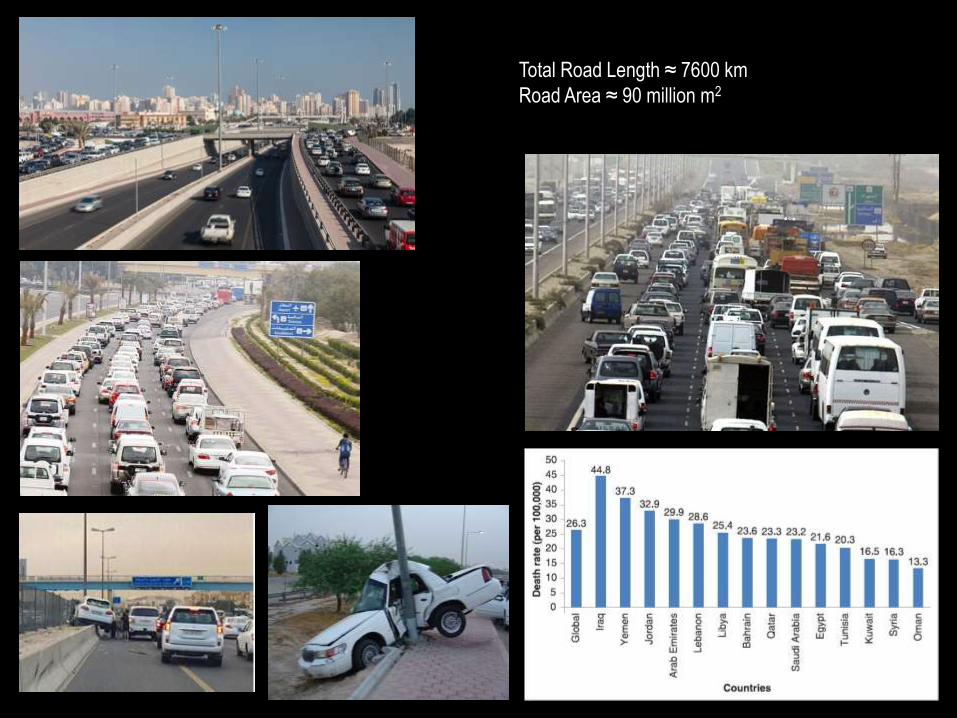
Total Road Length ≈ 7600 km
Road Area ≈ 90 million m2

World Meterological Organization
21 July 2016, Kuwait set a new record for the
Eastern hemisphere & Asia, with a reported
temp. of 54.0°C (129.2°F)
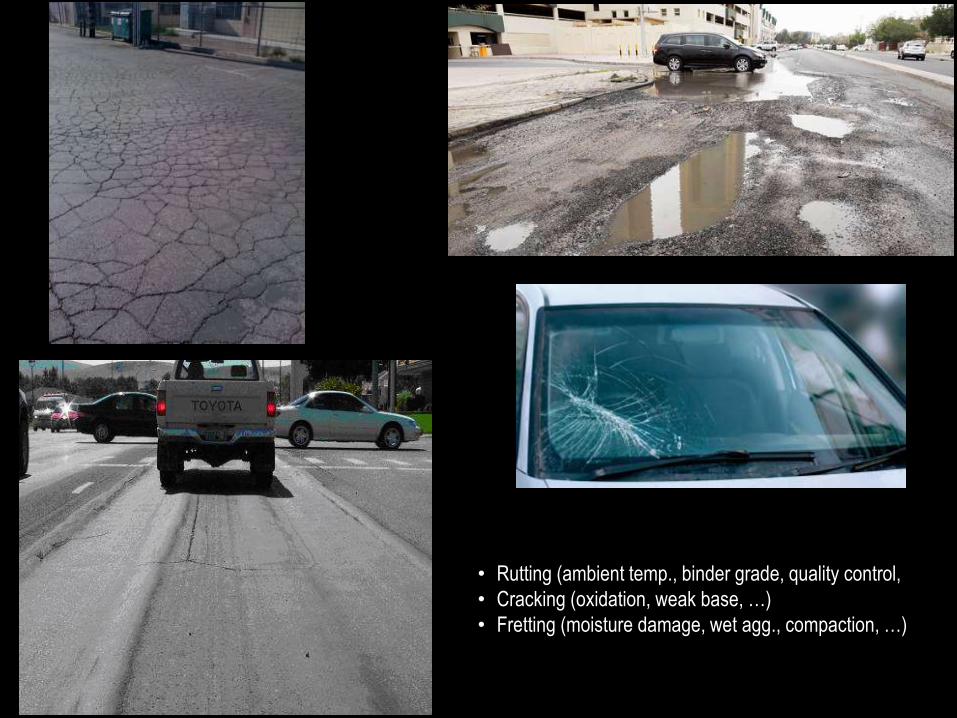
• Rutting (ambient temp., binder grade, quality control,
• Cracking (oxidation, weak base, …)
• Fretting (moisture damage, wet agg., compaction, …)
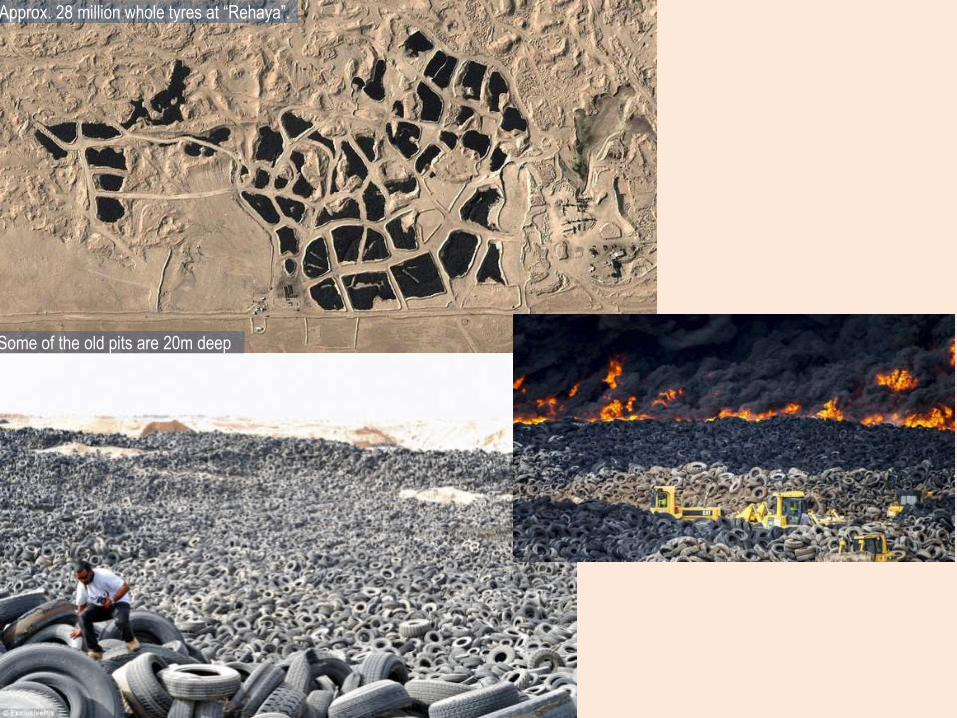
Some of the old pits are 20m deep
Approx. 28 million whole tyres at “Rehaya”.
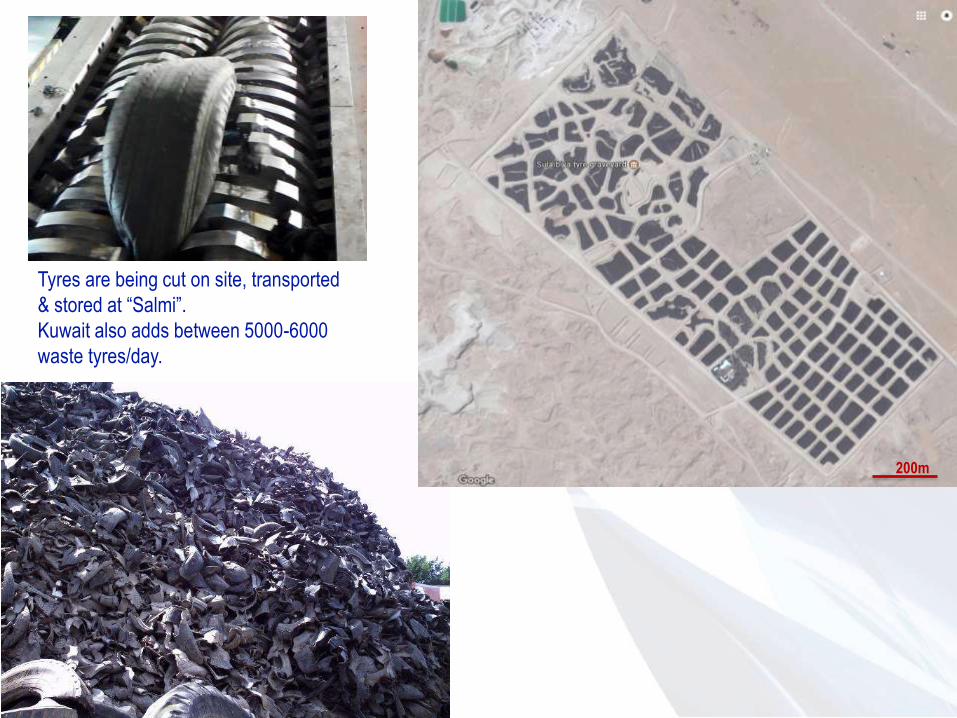
Tyres are being cut on site, transported
& stored at “Salmi”.
Kuwait also adds between 5000-6000
waste tyres/day.
200m
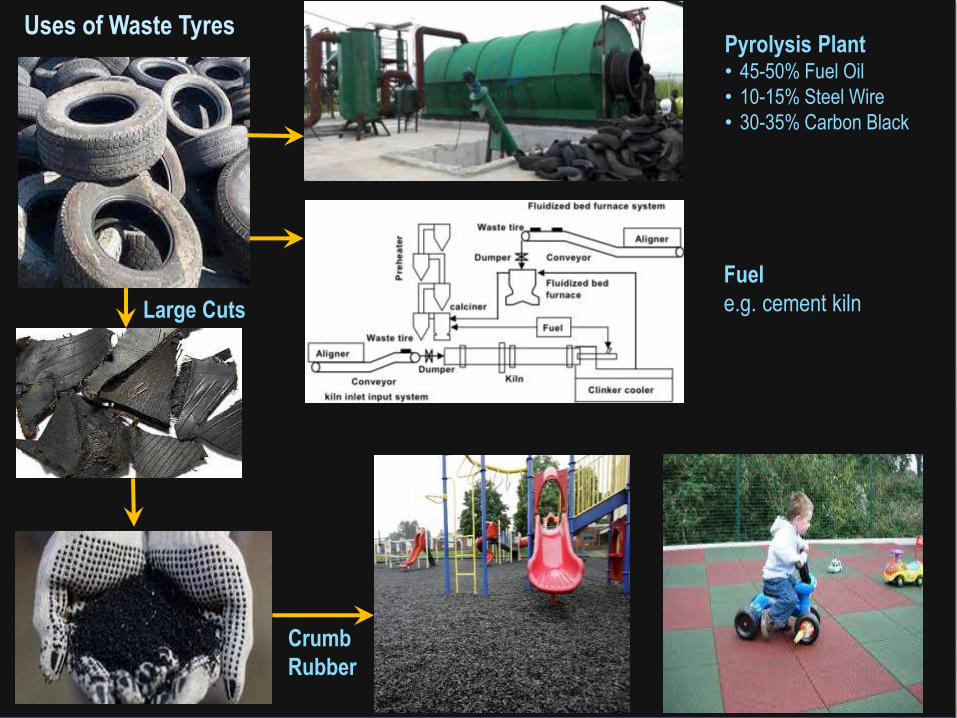
Fuel
e.g. cement kilnLarge Cuts
Uses of Waste Tyres
Crumb
Rubber
Pyrolysis Plant• 45-50% Fuel Oil
• 10-15% Steel Wire
• 30-35% Carbon Black
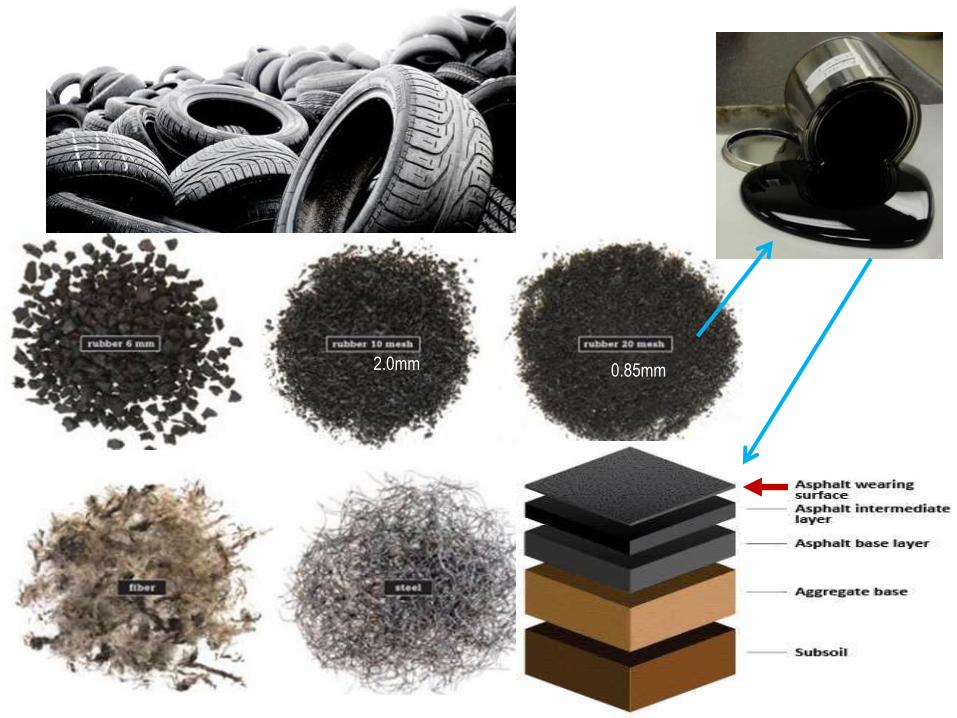
0.85mm2.0mm
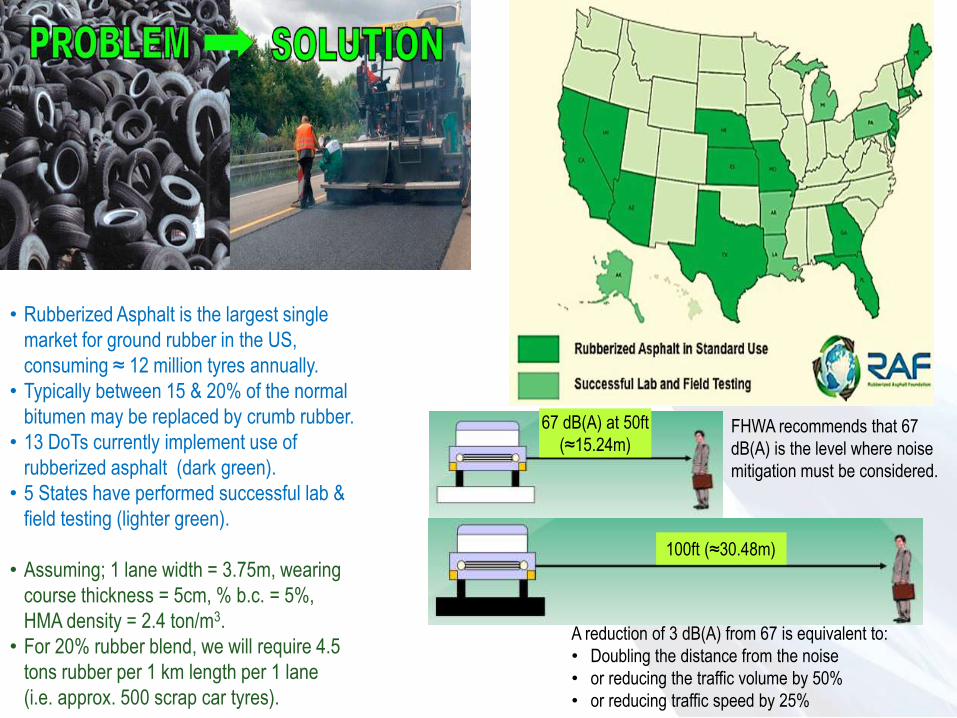
• Rubberized Asphalt is the largest single
market for ground rubber in the US,
consuming ≈ 12 million tyres annually.
• Typically between 15 & 20% of the normal
bitumen may be replaced by crumb rubber.
• 13 DoTs currently implement use of
rubberized asphalt (dark green).
• 5 States have performed successful lab &
field testing (lighter green).
• Assuming; 1 lane width = 3.75m, wearing
course thickness = 5cm, % b.c. = 5%,
HMA density = 2.4 ton/m3.
• For 20% rubber blend, we will require 4.5
tons rubber per 1 km length per 1 lane
(i.e. approx. 500 scrap car tyres).
FHWA recommends that 67
dB(A) is the level where noise
mitigation must be considered.
67 dB(A) at 50ft
(≈15.24m)
A reduction of 3 dB(A) from 67 is equivalent to:
• Doubling the distance from the noise
• or reducing the traffic volume by 50%
• or reducing traffic speed by 25%
100ft (≈30.48m)
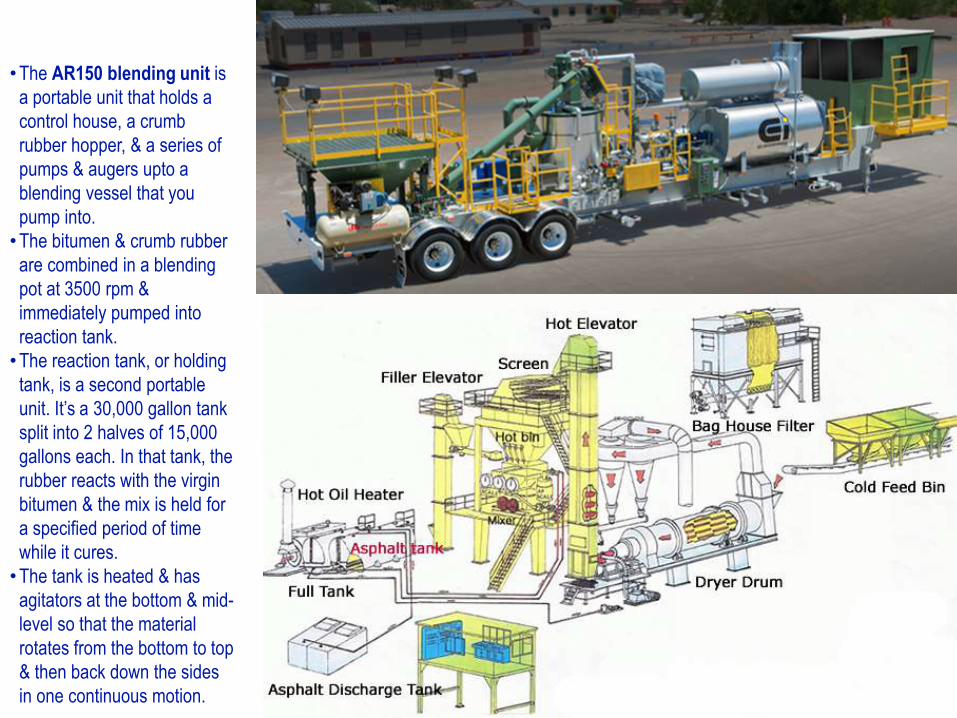
•The AR150 blending unit is
a portable unit that holds a
control house, a crumb
rubber hopper, & a series of
pumps & augers upto a
blending vessel that you
pump into.
•The bitumen & crumb rubber
are combined in a blending
pot at 3500 rpm &
immediately pumped into
reaction tank.
•The reaction tank, or holding
tank, is a second portable
unit. It’s a 30,000 gallon tank
split into 2 halves of 15,000
gallons each. In that tank, the
rubber reacts with the virgin
bitumen & the mix is held for
a specified period of time
while it cures.
•The tank is heated & has
agitators at the bottom & mid-
level so that the material
rotates from the bottom to top
& then back down the sides
in one continuous motion.ASPHALTPRO Jan 1, 2013. http://theasphaltpro.com/rubberized-asphalt-lowers-costs/
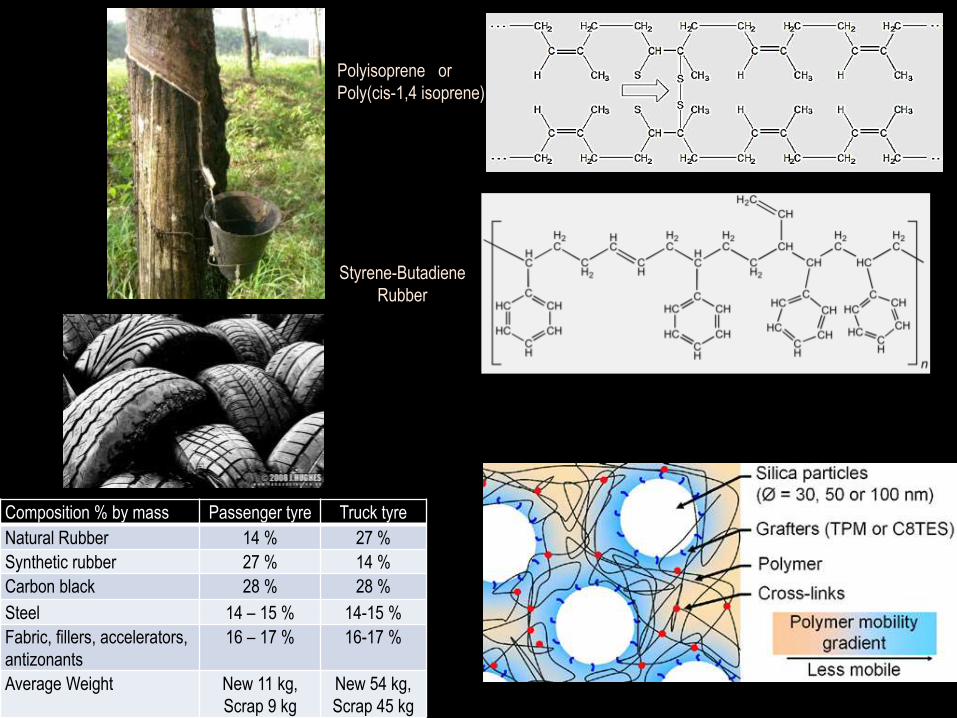
Polyisoprene or
Poly(cis-1,4 isoprene)
Styrene-Butadiene
Rubber
Composition % by mass Passenger tyre Truck tyre
Natural Rubber 14 % 27 %
Synthetic rubber 27 % 14 %
Carbon black 28 % 28 %
Steel 14 – 15 % 14-15 %
Fabric, fillers, accelerators,
antizonants
16 – 17 % 16-17 %
Average Weight New 11 kg,
Scrap 9 kg
New 54 kg,
Scrap 45 kg
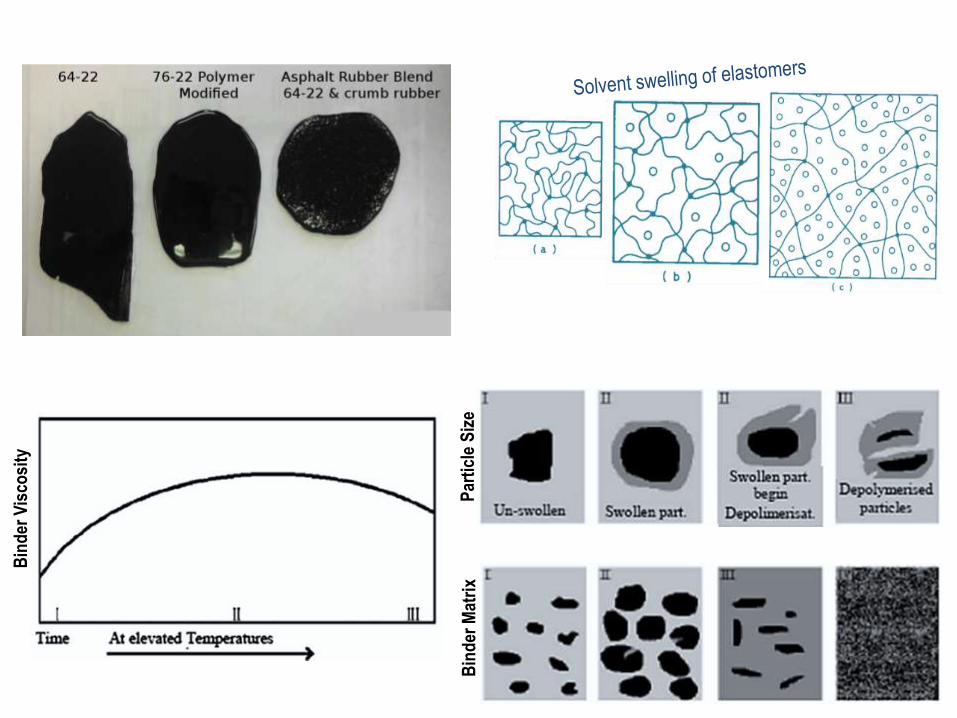
Bin
der
Vis
cosi
ty
Par
ticl
e S
ize
Bin
der
Mat
rix
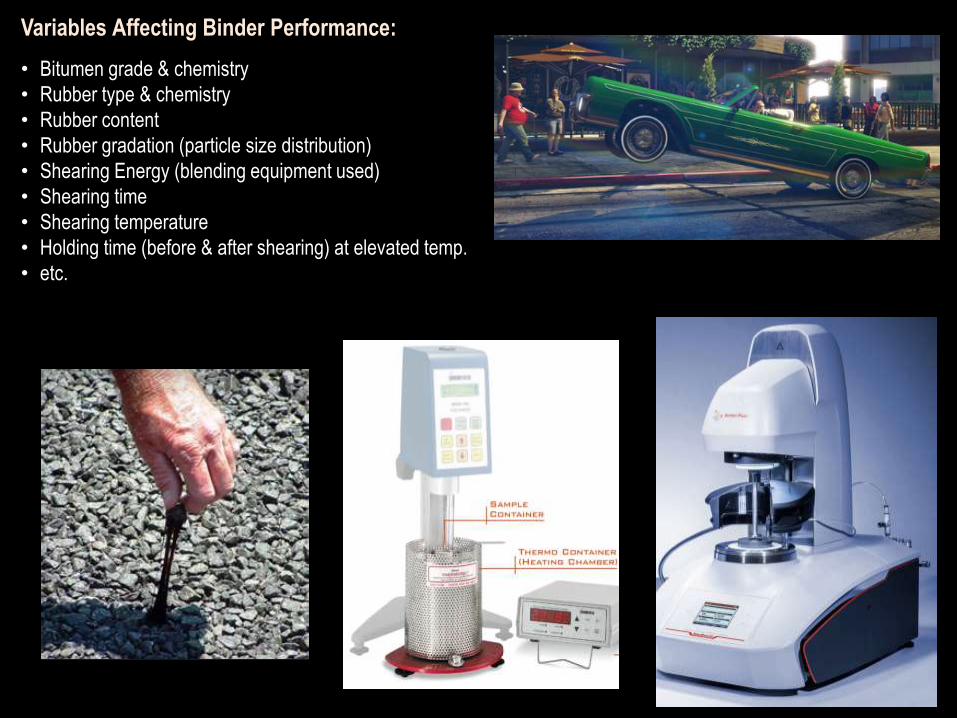
Variables Affecting Binder Performance:
• Bitumen grade & chemistry
• Rubber type & chemistry
• Rubber content
• Rubber gradation (particle size distribution)
• Shearing Energy (blending equipment used)
• Shearing time
• Shearing temperature
• Holding time (before & after shearing) at elevated temp.
• etc.
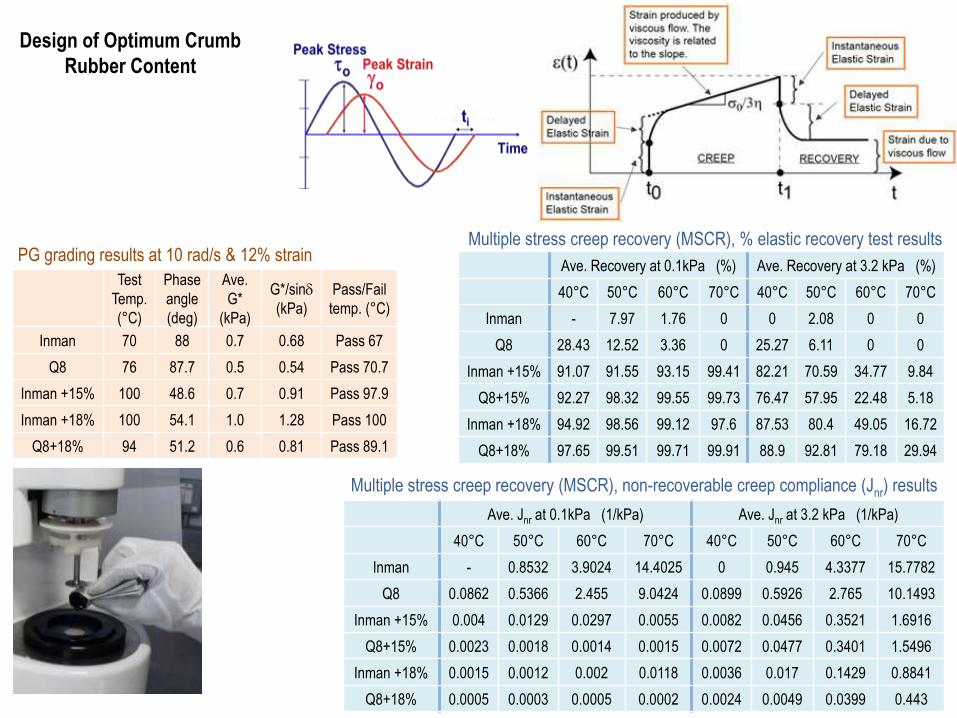
Ave. Jnr at 0.1kPa (1/kPa) Ave. Jnr at 3.2 kPa (1/kPa)
40°C 50°C 60°C 70°C 40°C 50°C 60°C 70°C
Inman - 0.8532 3.9024 14.4025 0 0.945 4.3377 15.7782
Q8 0.0862 0.5366 2.455 9.0424 0.0899 0.5926 2.765 10.1493
Inman +15% 0.004 0.0129 0.0297 0.0055 0.0082 0.0456 0.3521 1.6916
Q8+15% 0.0023 0.0018 0.0014 0.0015 0.0072 0.0477 0.3401 1.5496
Inman +18% 0.0015 0.0012 0.002 0.0118 0.0036 0.017 0.1429 0.8841
Q8+18% 0.0005 0.0003 0.0005 0.0002 0.0024 0.0049 0.0399 0.443
Multiple stress creep recovery (MSCR), non-recoverable creep compliance (Jnr) results
Test
Temp.
(°C)
Phase
angle
(deg)
Ave.
G*
(kPa)
G*/sin
(kPa)
Pass/Fail
temp. (°C)
Inman 70 88 0.7 0.68 Pass 67
Q8 76 87.7 0.5 0.54 Pass 70.7
Inman +15% 100 48.6 0.7 0.91 Pass 97.9
Inman +18% 100 54.1 1.0 1.28 Pass 100
Q8+18% 94 51.2 0.6 0.81 Pass 89.1
Ave. Recovery at 0.1kPa (%) Ave. Recovery at 3.2 kPa (%)
40°C 50°C 60°C 70°C 40°C 50°C 60°C 70°C
Inman - 7.97 1.76 0 0 2.08 0 0
Q8 28.43 12.52 3.36 0 25.27 6.11 0 0
Inman +15% 91.07 91.55 93.15 99.41 82.21 70.59 34.77 9.84
Q8+15% 92.27 98.32 99.55 99.73 76.47 57.95 22.48 5.18
Inman +18% 94.92 98.56 99.12 97.6 87.53 80.4 49.05 16.72
Q8+18% 97.65 99.51 99.71 99.91 88.9 92.81 79.18 29.94
Multiple stress creep recovery (MSCR), % elastic recovery test resultsPG grading results at 10 rad/s & 12% strain
Design of Optimum Crumb
Rubber Content
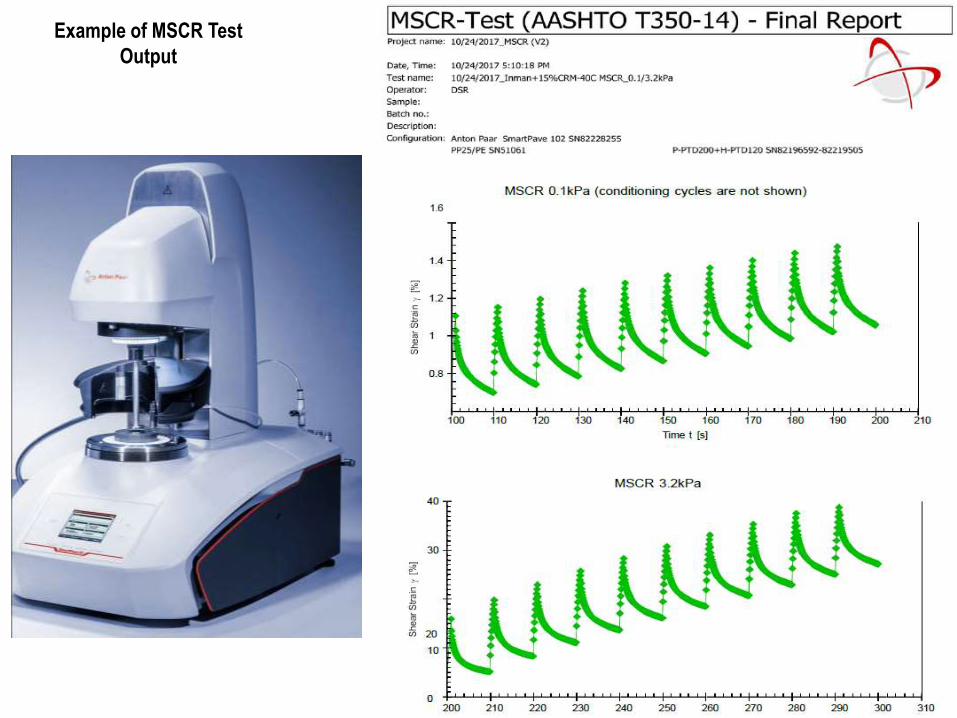
Example of MSCR Test
Output
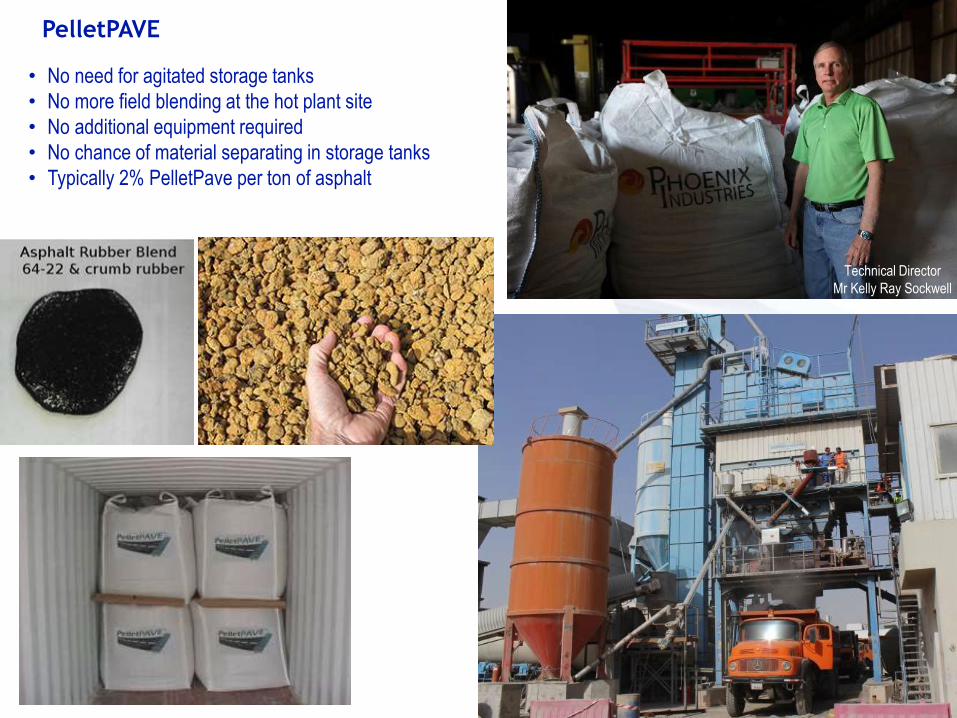
PelletPAVE
• No need for agitated storage tanks
• No more field blending at the hot plant site
• No additional equipment required
• No chance of material separating in storage tanks
• Typically 2% PelletPave per ton of asphalt
Technical Director
Mr Kelly Ray Sockwell
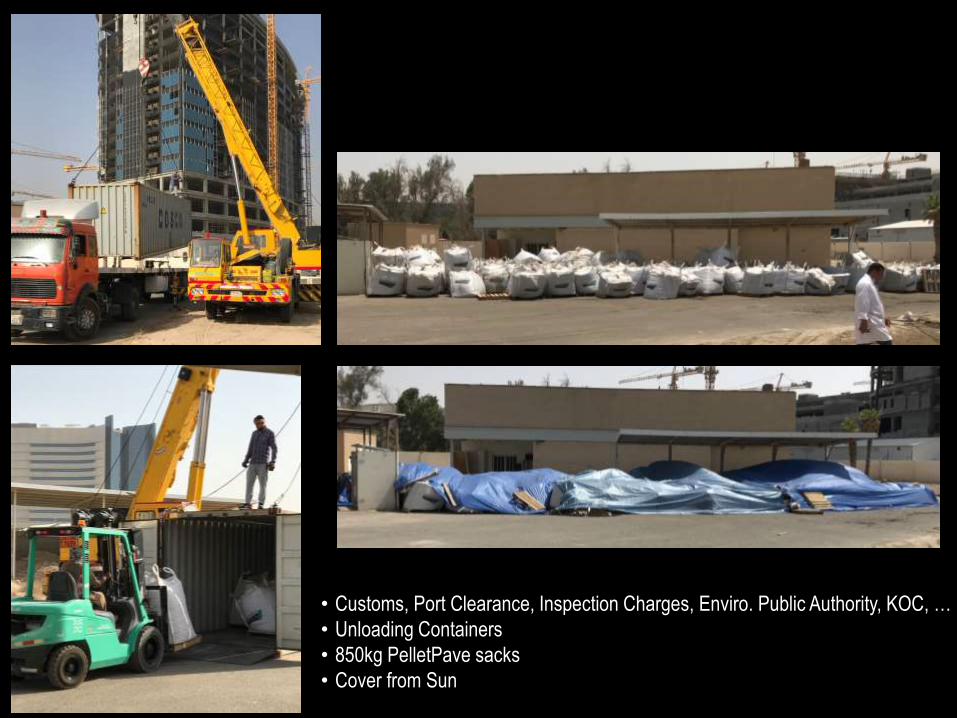
• Customs, Port Clearance, Inspection Charges, Enviro. Public Authority, KOC, …
• Unloading Containers
• 850kg PelletPave sacks
• Cover from Sun
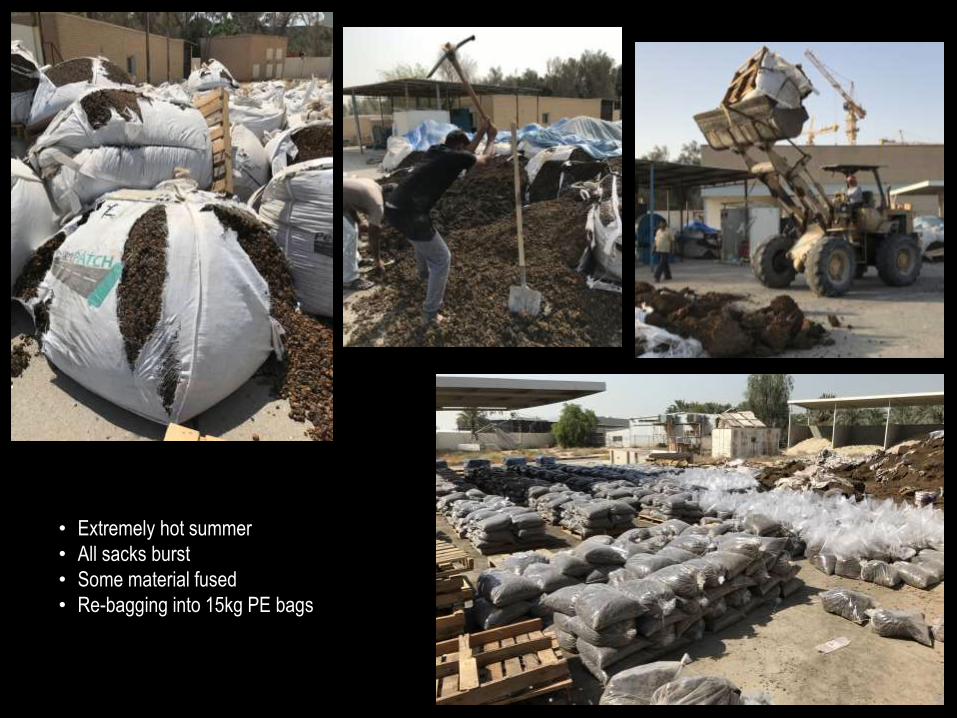
• Extremely hot summer
• All sacks burst
• Some material fused
• Re-bagging into 15kg PE bags
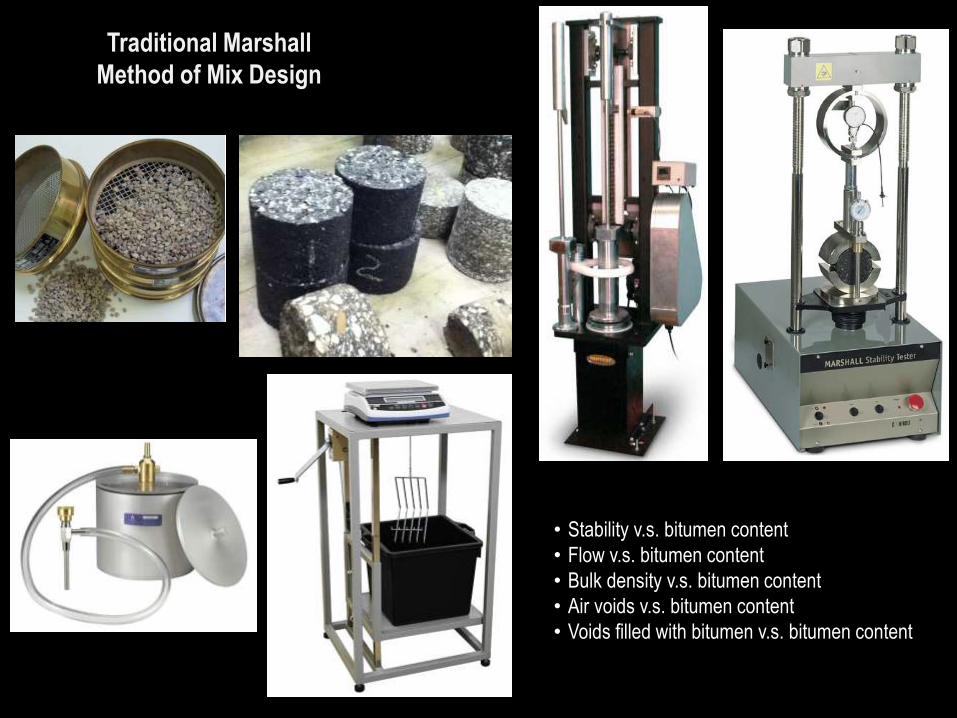
Traditional Marshall
Method of Mix Design
• Stability v.s. bitumen content
• Flow v.s. bitumen content
• Bulk density v.s. bitumen content
• Air voids v.s. bitumen content
• Voids filled with bitumen v.s. bitumen content
0
10
20
30
40
50
60
70
80
90
100
0 1 2 3 4
% p
assin
g
(d/D)^0.45
Max. Den. line
Superpave control
job mix
75m
2.36mm
12.5mm
19mm 25mm
0
1
2
3
4
5
6
7
8
4.5 5 5.5 6 6.5 7
Air
Vo
ids
(%)
Binder Content (%)
3.5% PelletPave
3.0% PelletPave
2.5% PelletPave
16
16.2
16.4
16.6
16.8
17
17.2
17.4
17.6
17.8
18
4.5 5 5.5 6 6.5 7
VM
A (%
)
Binder Content (%)
3.5% PelletPave
3.0% PelletPave
2.5% PelletPave
min. VMA = 14%
50
55
60
65
70
75
80
85
90
4.5 5 5.5 6 6.5 7
VF
B (
%)
Binder Content (%)
3.5% PelletPave3.0% PelletPave2.5% PelletPave
10000
11000
12000
13000
14000
15000
16000
4.5 5 5.5 6 6.5 7
Sta
bilit
y (N
)
Binder Content (%)
3.5% PelletPave
3.0% PelletPave
2.5% PelletPave
min. Stability = 18 kN !!
6
8
10
12
14
16
18
4.5 5 5.5 6 6.5 7
Flow
(0.
25 m
m)
Binder Content (%)
3.5% PelletPave3.0% PelletPave2.5% PelletPave
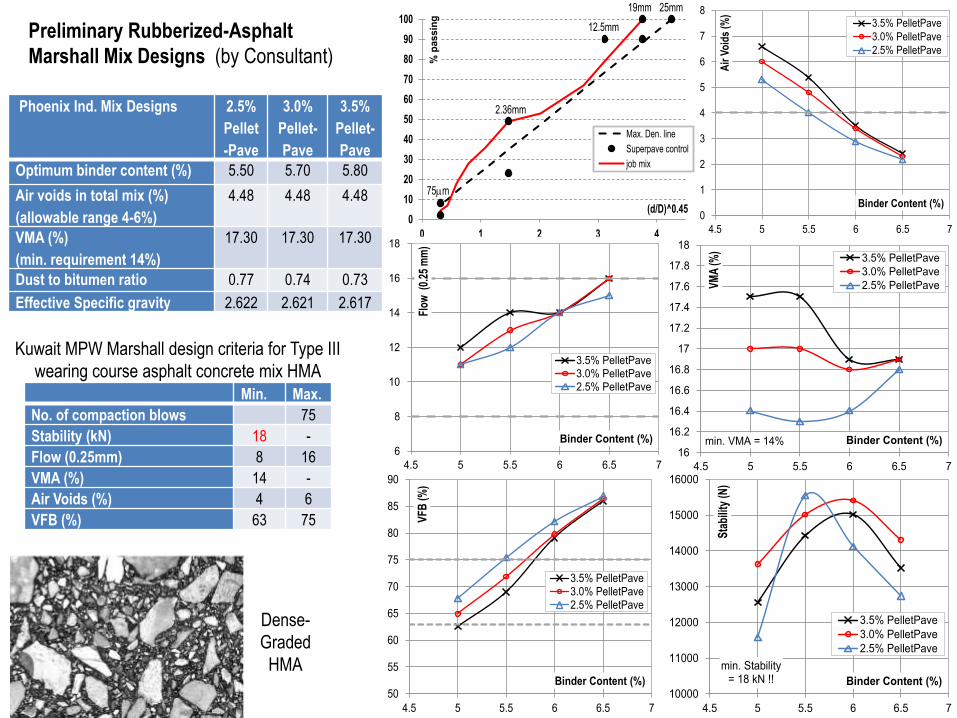
Kuwait MPW Marshall design criteria for Type III
wearing course asphalt concrete mix HMA
Preliminary Rubberized-Asphalt
Marshall Mix Designs (by Consultant)
Phoenix Ind. Mix Designs 2.5%
Pellet
-Pave
3.0%
Pellet-
Pave
3.5%
Pellet-
Pave
Optimum binder content (%) 5.50 5.70 5.80
Air voids in total mix (%)
(allowable range 4-6%)
4.48 4.48 4.48
VMA (%)
(min. requirement 14%)
17.30 17.30 17.30
Dust to bitumen ratio 0.77 0.74 0.73
Effective Specific gravity 2.622 2.621 2.617
Min. Max.
No. of compaction blows 75
Stability (kN) 18 -
Flow (0.25mm) 8 16
VMA (%) 14 -
Air Voids (%) 4 6
VFB (%) 63 75
Dense-
Graded
HMA
0.00
1.00
2.00
3.00
4.00
5.00
6.00
7.00
8.00
9.00
10.00
5.0 5.2 5.4 5.6 5.8 6.0%
Vo
ids
% binder content by mass of Mix
2.5% MOD Voids based on Wa, Ww, KCPC Gmm
3.0% MOD Voids based on Wa, Ww, KCPC Gmm
3.5% MOD Voids based on Wa, Ww, KCPC Gmm
2.5% KCPC Voids based on Wa, Ww, KCPC Gmm
3.0% KCPC Voids based on Wa, Ww, KCPC Gmm
3.5% KCPC Voids based on Wa, Ww, KCPC Gmm
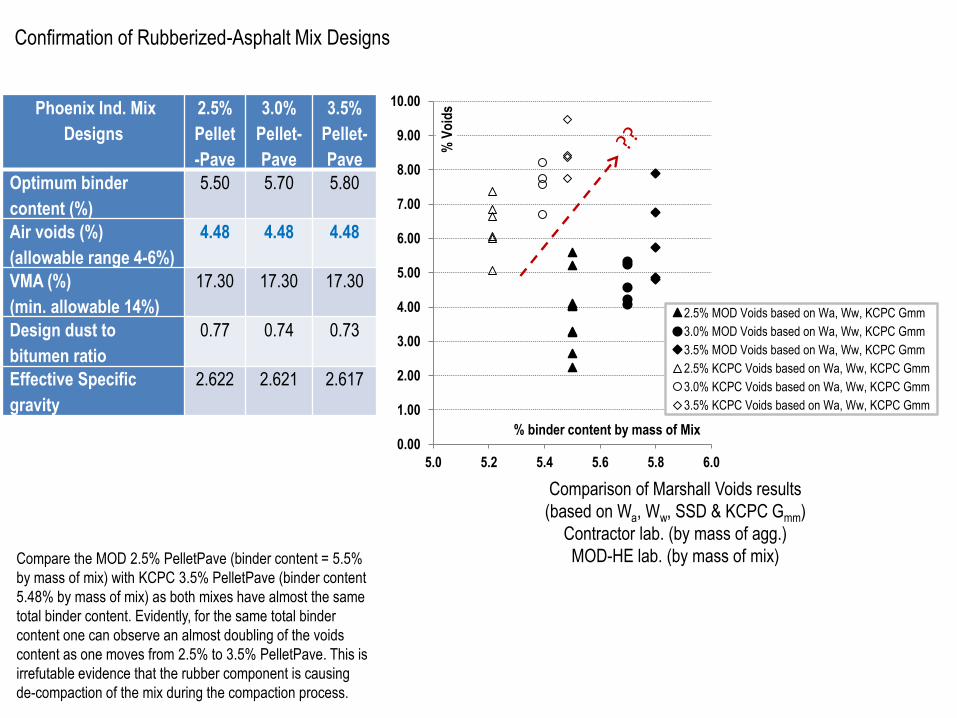
Comparison of Marshall Voids results
(based on Wa, Ww, SSD & KCPC Gmm)
Contractor lab. (by mass of agg.)
MOD-HE lab. (by mass of mix)
Confirmation of Rubberized-Asphalt Mix Designs
Phoenix Ind. Mix
Designs
2.5%
Pellet
-Pave
3.0%
Pellet-
Pave
3.5%
Pellet-
Pave
Optimum binder
content (%)
5.50 5.70 5.80
Air voids (%)
(allowable range 4-6%)
4.48 4.48 4.48
VMA (%)
(min. allowable 14%)
17.30 17.30 17.30
Design dust to
bitumen ratio
0.77 0.74 0.73
Effective Specific
gravity
2.622 2.621 2.617
Compare the MOD 2.5% PelletPave (binder content = 5.5%
by mass of mix) with KCPC 3.5% PelletPave (binder content
5.48% by mass of mix) as both mixes have almost the same
total binder content. Evidently, for the same total binder
content one can observe an almost doubling of the voids
content as one moves from 2.5% to 3.5% PelletPave. This is
irrefutable evidence that the rubber component is causing
de-compaction of the mix during the compaction process.
10.00
12.00
14.00
16.00
18.00
20.00
22.00
24.00
26.00
28.00
5.00 5.20 5.40 5.60 5.80 6.00
Sta
bili
ty (
kN)
% binder content by mass of Mix
2.5% KCPC Stability
3.0% KCPC Stability
3.5% KCPC Stability
2.5% MOD Stability
3.0% MOD Stability
3.5% MOD Stability
10000
11000
12000
13000
14000
15000
16000
4.5 5 5.5 6 6.5 7
Sta
bili
ty (
N)
Binder Content (%)
3.5% PelletPave
3.0% PelletPave
2.5% PelletPave
min. Stability = 18 kN !!
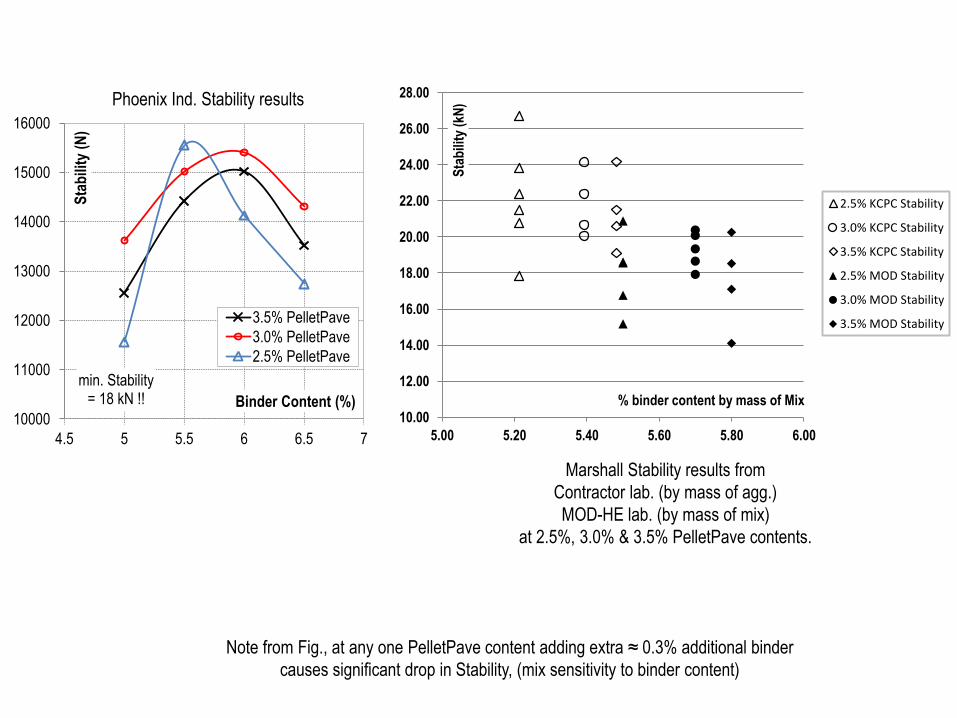
Marshall Stability results from
Contractor lab. (by mass of agg.)
MOD-HE lab. (by mass of mix)
at 2.5%, 3.0% & 3.5% PelletPave contents.
Phoenix Ind. Stability results
Note from Fig., at any one PelletPave content adding extra ≈ 0.3% additional binder
causes significant drop in Stability, (mix sensitivity to binder content)
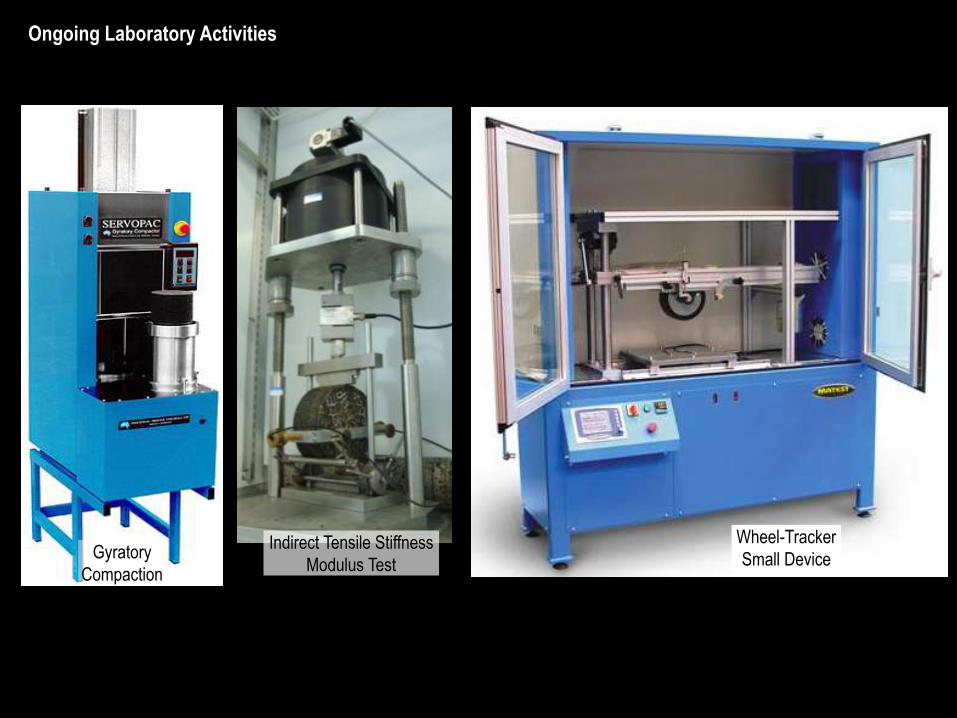
Indirect Tensile Stiffness
Modulus TestGyratory
Compaction
Wheel-Tracker
Small Device
Ongoing Laboratory Activities
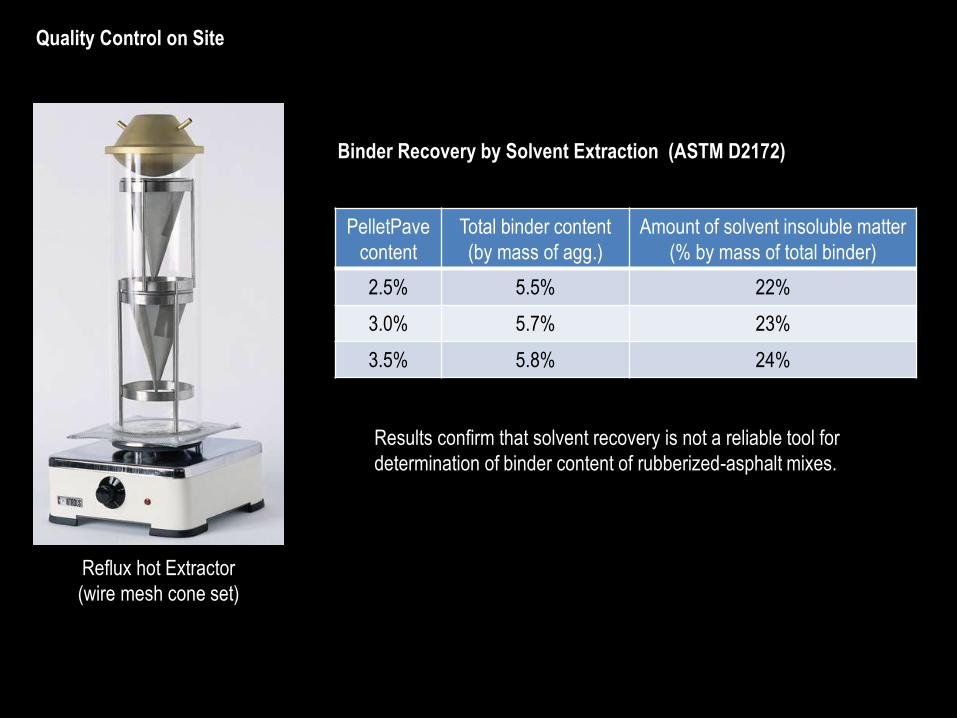
Reflux hot Extractor
(wire mesh cone set)
Binder Recovery by Solvent Extraction (ASTM D2172)
Results confirm that solvent recovery is not a reliable tool for
determination of binder content of rubberized-asphalt mixes.
PelletPave
content
Total binder content
(by mass of agg.)
Amount of solvent insoluble matter
(% by mass of total binder)
2.5% 5.5% 22%
3.0% 5.7% 23%
3.5% 5.8% 24%
Quality Control on Site

Asphalt content of Hot Mix
Asphalt by Ignition Method
ASTM D6307, 540°C, 1 hour
Rubberized-Asphalt Mix Mix after Furnace
5.1
5.6
6.1
6.6
7.1
7.6
5.1 5.2 5.3 5.4 5.5 5.6
Fu
rnac
e m
easu
red
bin
der
co
nte
nt
(%)
Lab. Design binder content (%)
KCPC samples
Equality line
≈19% more material
burnt than actual
mix binder content !!
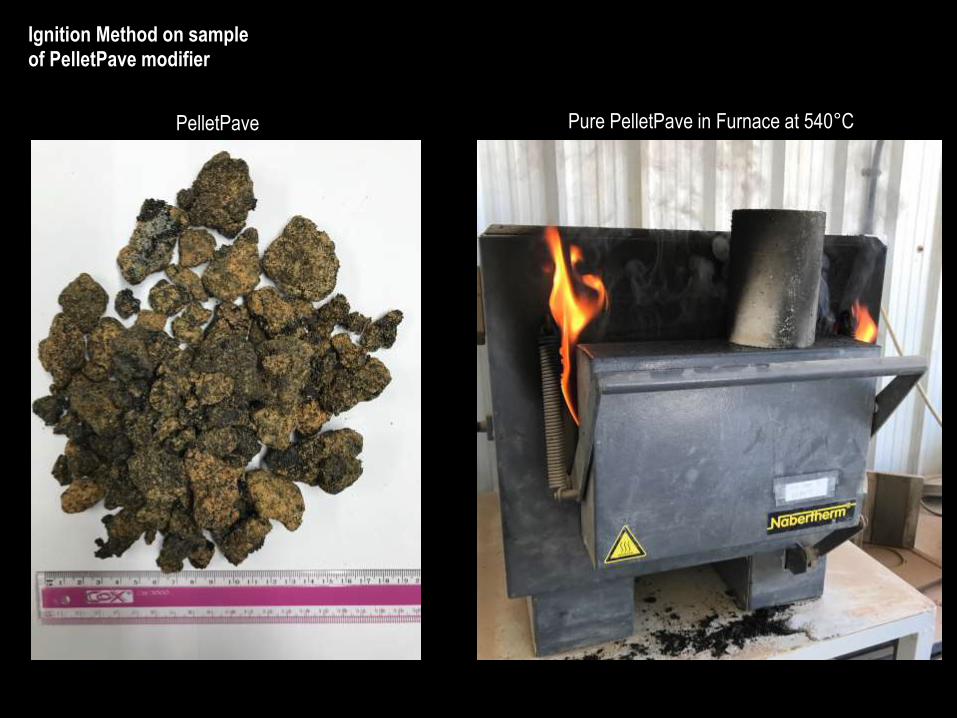
Pure PelletPave in Furnace at 540°CPelletPave
Ignition Method on sample of PelletPave modifier
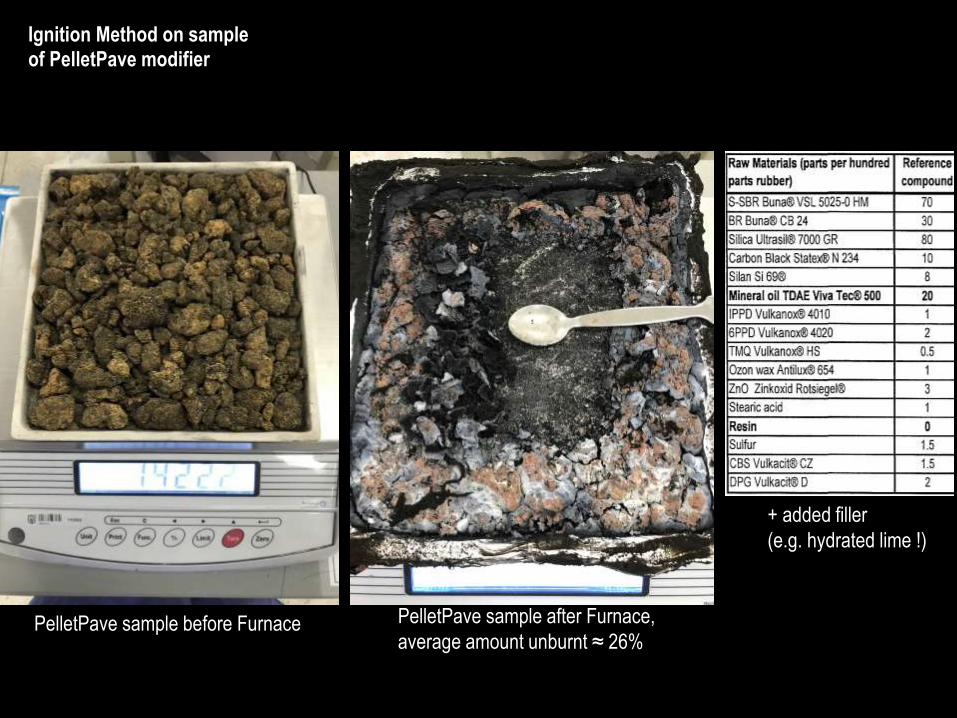
PelletPave sample before Furnace PelletPave sample after Furnace,
average amount unburnt ≈ 26%
+ added filler
(e.g. hydrated lime !)
Ignition Method on sample of PelletPave modifier

شكرا