Embed Size (px)
Citation preview
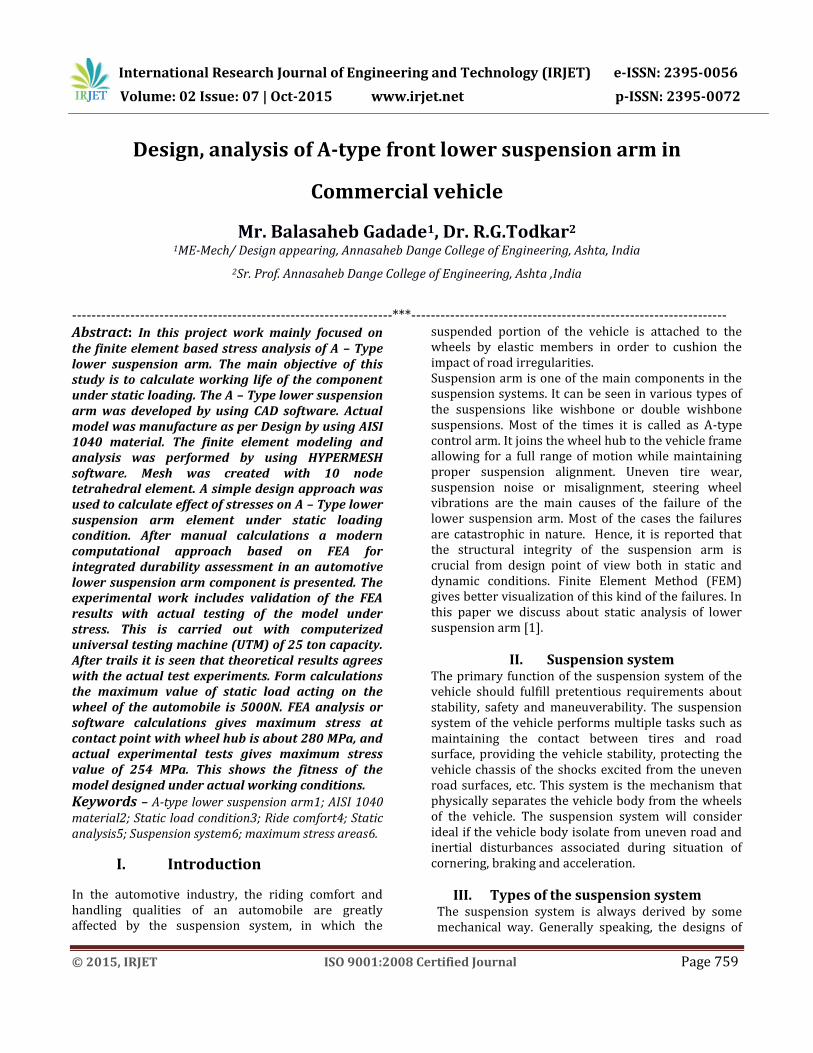
International Research Journal of Engineering and Technology (IRJET) e-ISSN: 2395-0056
Volume: 02 Issue: 07 | Oct-2015 www.irjet.net p-ISSN: 2395-0072
© 2015, IRJET ISO 9001:2008 Certified Journal Page 759
Design, analysis of A-type front lower suspension arm in
Commercial vehicle
Mr. Balasaheb Gadade1, Dr. R.G.Todkar2 1ME-Mech/ Design appearing, Annasaheb Dange College of Engineering, Ashta, India
2Sr. Prof. Annasaheb Dange College of Engineering, Ashta ,India
------------------------------------------------------------------***-----------------------------------------------------------------Abstract: In this project work mainly focused on the finite element based stress analysis of A – Type lower suspension arm. The main objective of this study is to calculate working life of the component under static loading. The A – Type lower suspension arm was developed by using CAD software. Actual model was manufacture as per Design by using AISI 1040 material. The finite element modeling and analysis was performed by using HYPERMESH software. Mesh was created with 10 node tetrahedral element. A simple design approach was used to calculate effect of stresses on A – Type lower suspension arm element under static loading condition. After manual calculations a modern computational approach based on FEA for integrated durability assessment in an automotive lower suspension arm component is presented. The experimental work includes validation of the FEA results with actual testing of the model under stress. This is carried out with computerized universal testing machine (UTM) of 25 ton capacity. After trails it is seen that theoretical results agrees with the actual test experiments. Form calculations the maximum value of static load acting on the wheel of the automobile is 5000N. FEA analysis or software calculations gives maximum stress at contact point with wheel hub is about 280 MPa, and actual experimental tests gives maximum stress value of 254 MPa. This shows the fitness of the model designed under actual working conditions. Keywords – A-type lower suspension arm1; AISI 1040 material2; Static load condition3; Ride comfort4; Static analysis5; Suspension system6; maximum stress areas6.
I. Introduction
In the automotive industry, the riding comfort and handling qualities of an automobile are greatly affected by the suspension system, in which the
suspended portion of the vehicle is attached to the wheels by elastic members in order to cushion the impact of road irregularities. Suspension arm is one of the main components in the suspension systems. It can be seen in various types of the suspensions like wishbone or double wishbone suspensions. Most of the times it is called as A-type control arm. It joins the wheel hub to the vehicle frame allowing for a full range of motion while maintaining proper suspension alignment. Uneven tire wear, suspension noise or misalignment, steering wheel vibrations are the main causes of the failure of the lower suspension arm. Most of the cases the failures are catastrophic in nature. Hence, it is reported that the structural integrity of the suspension arm is crucial from design point of view both in static and dynamic conditions. Finite Element Method (FEM) gives better visualization of this kind of the failures. In this paper we discuss about static analysis of lower suspension arm [1].
II. Suspension system The primary function of the suspension system of the vehicle should fulfill pretentious requirements about stability, safety and maneuverability. The suspension system of the vehicle performs multiple tasks such as maintaining the contact between tires and road surface, providing the vehicle stability, protecting the vehicle chassis of the shocks excited from the uneven road surfaces, etc. This system is the mechanism that physically separates the vehicle body from the wheels of the vehicle. The suspension system will consider ideal if the vehicle body isolate from uneven road and inertial disturbances associated during situation of cornering, braking and acceleration.
III. Types of the suspension system The suspension system is always derived by some mechanical way. Generally speaking, the designs of
International Research Journal of Engineering and Technology (IRJET) e-ISSN: 2395-0056
Volume: 02 Issue: 07 | Oct-2015 www.irjet.net p-ISSN: 2395-0072
© 2015, IRJET ISO 9001:2008 Certified Journal Page 760
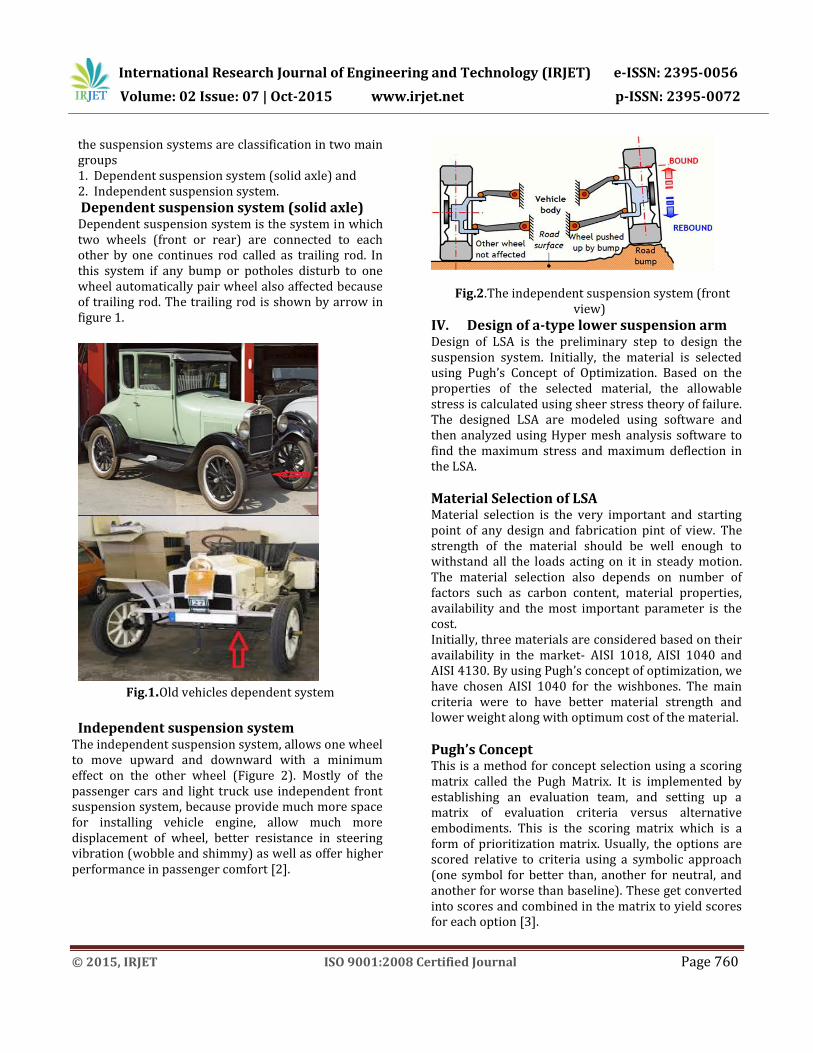
the suspension systems are classification in two main groups 1. Dependent suspension system (solid axle) and 2. Independent suspension system.
Dependent suspension system (solid axle) Dependent suspension system is the system in which two wheels (front or rear) are connected to each other by one continues rod called as trailing rod. In this system if any bump or potholes disturb to one wheel automatically pair wheel also affected because of trailing rod. The trailing rod is shown by arrow in figure 1.
Fig.1.Old vehicles dependent system
Independent suspension system
The independent suspension system, allows one wheel to move upward and downward with a minimum effect on the other wheel (Figure 2). Mostly of the passenger cars and light truck use independent front suspension system, because provide much more space for installing vehicle engine, allow much more displacement of wheel, better resistance in steering vibration (wobble and shimmy) as well as offer higher performance in passenger comfort [2].
Fig.2.The independent suspension system (front view)
IV. Design of a-type lower suspension arm Design of LSA is the preliminary step to design the suspension system. Initially, the material is selected using Pugh’s Concept of Optimization. Based on the properties of the selected material, the allowable stress is calculated using sheer stress theory of failure. The designed LSA are modeled using software and then analyzed using Hyper mesh analysis software to find the maximum stress and maximum deflection in the LSA.
Material Selection of LSA Material selection is the very important and starting point of any design and fabrication pint of view. The strength of the material should be well enough to withstand all the loads acting on it in steady motion. The material selection also depends on number of factors such as carbon content, material properties, availability and the most important parameter is the cost. Initially, three materials are considered based on their availability in the market- AISI 1018, AISI 1040 and AISI 4130. By using Pugh’s concept of optimization, we have chosen AISI 1040 for the wishbones. The main criteria were to have better material strength and lower weight along with optimum cost of the material.
Pugh’s Concept This is a method for concept selection using a scoring matrix called the Pugh Matrix. It is implemented by establishing an evaluation team, and setting up a matrix of evaluation criteria versus alternative embodiments. This is the scoring matrix which is a form of prioritization matrix. Usually, the options are scored relative to criteria using a symbolic approach (one symbol for better than, another for neutral, and another for worse than baseline). These get converted into scores and combined in the matrix to yield scores for each option [3].
International Research Journal of Engineering and Technology (IRJET) e-ISSN: 2395-0056
Volume: 02 Issue: 07 | Oct-2015 www.irjet.net p-ISSN: 2395-0072
© 2015, IRJET ISO 9001:2008 Certified Journal Page 761
Comparison of Materials The properties of the above mentioned materials which were considered for A-type lower suspension are as follows, Table1 Properties of Materials
Properties AISI 1018
AISI 1040
AISI 4130
Carbon Content (%) 0.18 0.40 0.30 Tensile Strength (MPa) 440 620 560 Yield Strength (MPa) 370 415 460 Hardness(BHN) 126 201 217 Cost (Rs./metre) 325 425 725
Table2 Pugh’s concept selection chart
Description Criteria
AISI 1018
AISI 1040
AISI 4130
Total Weight -2 0 +1
Yield Strength
-1 0 +1
Tensile Strength
-2 +2 0
Cost +1 0 -2
Elongation at break
-2 +1 0
Net Score -6 +3 0 Hence, AISI 1040 is selected for LSA because the net score is highest for AISI 1040.
Stress Calculation For ductile materials, allowable stress is obtained by the following relationship
6 = Syt / fs
Assume factor of safety, fs = 1.2 (as is a ductile material).
6 = 415/1.2
6 = 345.83MPa This is the value of allowable stress value in the wishbones. The designed wishbone is safe when the
induced stress is lesser than the allowable stress value. The allowable stress is determined using Ansys analysis software.
V. Analysis of A-type Lower suspension arm
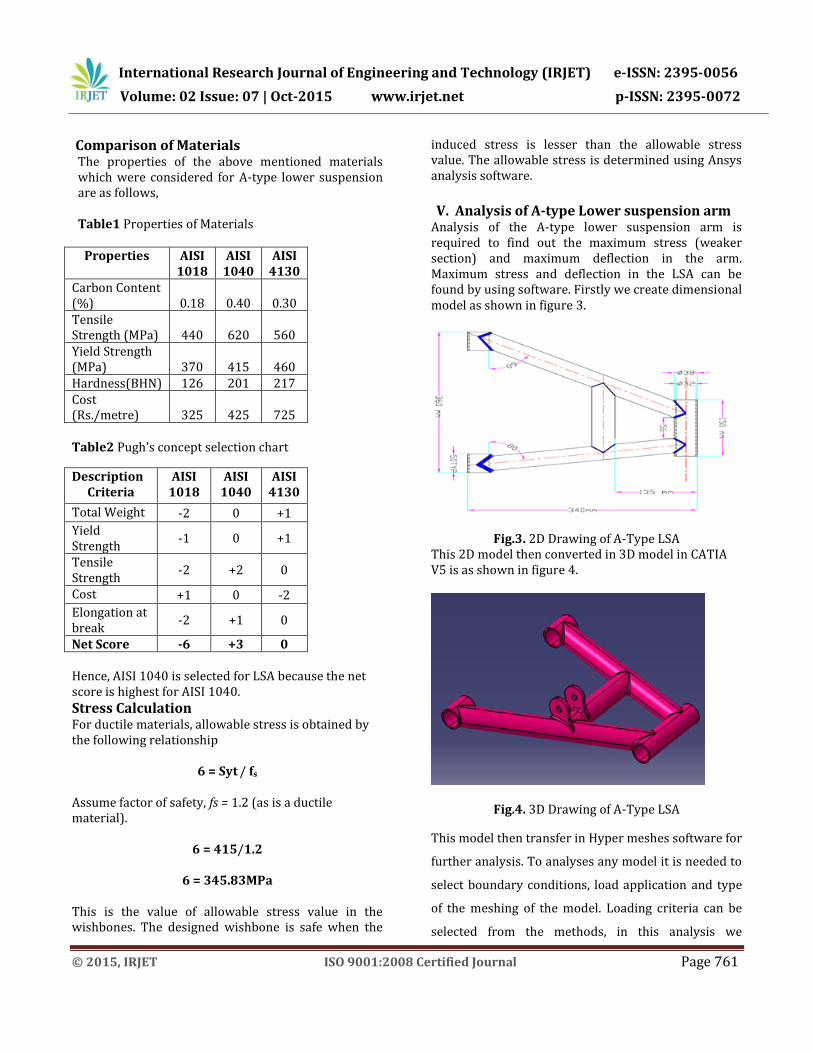
Analysis of the A-type lower suspension arm is required to find out the maximum stress (weaker section) and maximum deflection in the arm. Maximum stress and deflection in the LSA can be found by using software. Firstly we create dimensional model as shown in figure 3.
Fig.3. 2D Drawing of A-Type LSA This 2D model then converted in 3D model in CATIA V5 is as shown in figure 4.
Fig.4. 3D Drawing of A-Type LSA
This model then transfer in Hyper meshes software for
further analysis. To analyses any model it is needed to
select boundary conditions, load application and type
of the meshing of the model. Loading criteria can be
selected from the methods, in this analysis we
International Research Journal of Engineering and Technology (IRJET) e-ISSN: 2395-0056
Volume: 02 Issue: 07 | Oct-2015 www.irjet.net p-ISSN: 2395-0072
© 2015, IRJET ISO 9001:2008 Certified Journal Page 762
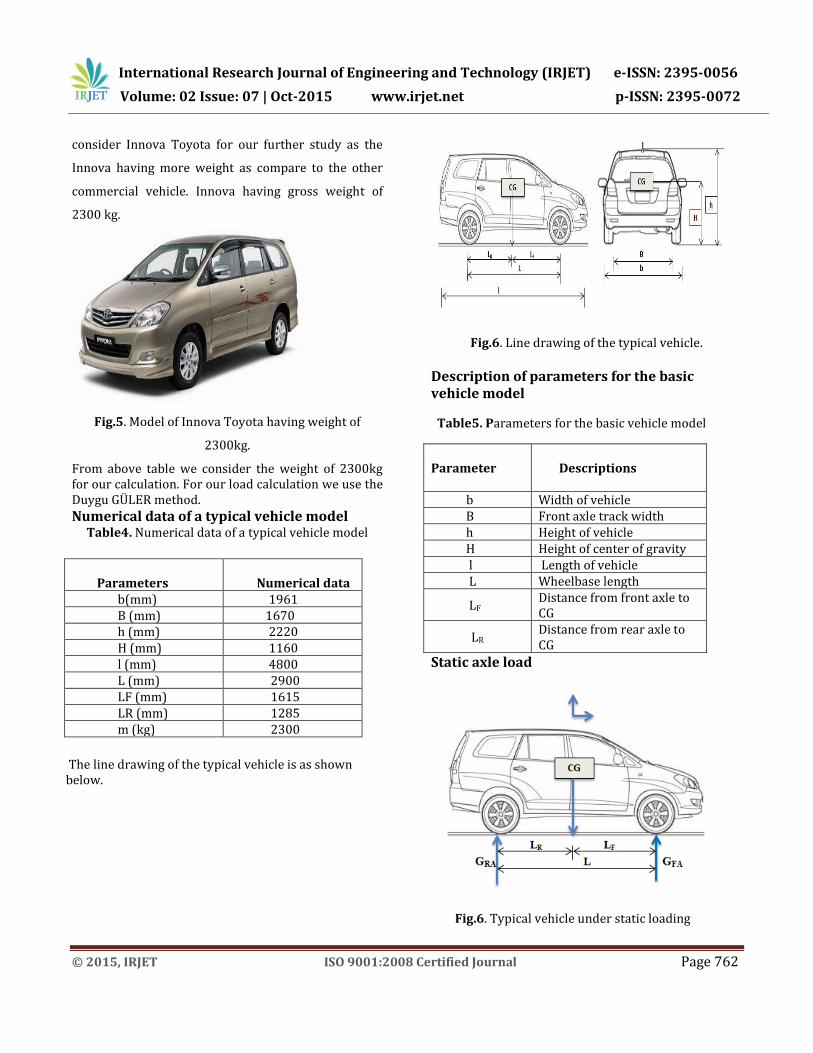
consider Innova Toyota for our further study as the
Innova having more weight as compare to the other
commercial vehicle. Innova having gross weight of
2300 kg.
Fig.5. Model of Innova Toyota having weight of
2300kg.
From above table we consider the weight of 2300kg for our calculation. For our load calculation we use the Duygu GÜLER method.
Numerical data of a typical vehicle model Table4. Numerical data of a typical vehicle model
Parameters
Numerical data b(mm) 1961 B (mm) 1670 h (mm) 2220 H (mm) 1160 l (mm) 4800 L (mm) 2900 LF (mm) 1615 LR (mm) 1285 m (kg) 2300
The line drawing of the typical vehicle is as shown below.
Fig.6. Line drawing of the typical vehicle.
Description of parameters for the basic vehicle model
Table5. Parameters for the basic vehicle model
Parameter
Descriptions
b Width of vehicle B Front axle track width h Height of vehicle H Height of center of gravity l Length of vehicle L Wheelbase length
LF Distance from front axle to CG
LR Distance from rear axle to CG
Static axle load
Fig.6. Typical vehicle under static loading
International Research Journal of Engineering and Technology (IRJET) e-ISSN: 2395-0056
Volume: 02 Issue: 07 | Oct-2015 www.irjet.net p-ISSN: 2395-0072
© 2015, IRJET ISO 9001:2008 Certified Journal Page 763
Consider the vehicle shown in Figure 5.2. The weight of vehicle acting at its center of gravity is:
G = m X g …………… (1)
The loads on the front and rear axles are found by using the equilibrium Equations;
G FA= G (LR/L) …………. (2)
G RA = G (LF/L) …………. (3)
Static load on one wheel of the front axle is:
G FAw =G FA /2 ………… (4)
G RAw= GRA/2 ………… (5)
By using above formulae for the vehicle of total mass 2300 kg and at constant speed of 30 km/hr., we can calculate load on one wheel of the vehicle which will be the weight on lower suspension arm of front wheel. If m=2300kg, from Equation no. (1)
G= 2300 x 9.81 N G = 22563 N
The loads on front axle can be calculate using equation no. (2)
GFA=22563x (1285/2900) GFA= 9997.7431 N
Load on the rear axle is by using equation (3) G RA =22563x (1615/2900) G RA = 12565.2569 N Load on the front wheel and rear wheel can be found by using equation no.(4) and (5)
G FAw= 9997.7431/2
G FAw= 4998.8715 N Similarly,
G RAw= 6282.6284 N
From above result of load for typical vehicle we found load on the front wheel is 4997.8715 N and for rear wheel it is 6282.6284 N. Our interest is in front wheel so, for further analysis we consider load on lower
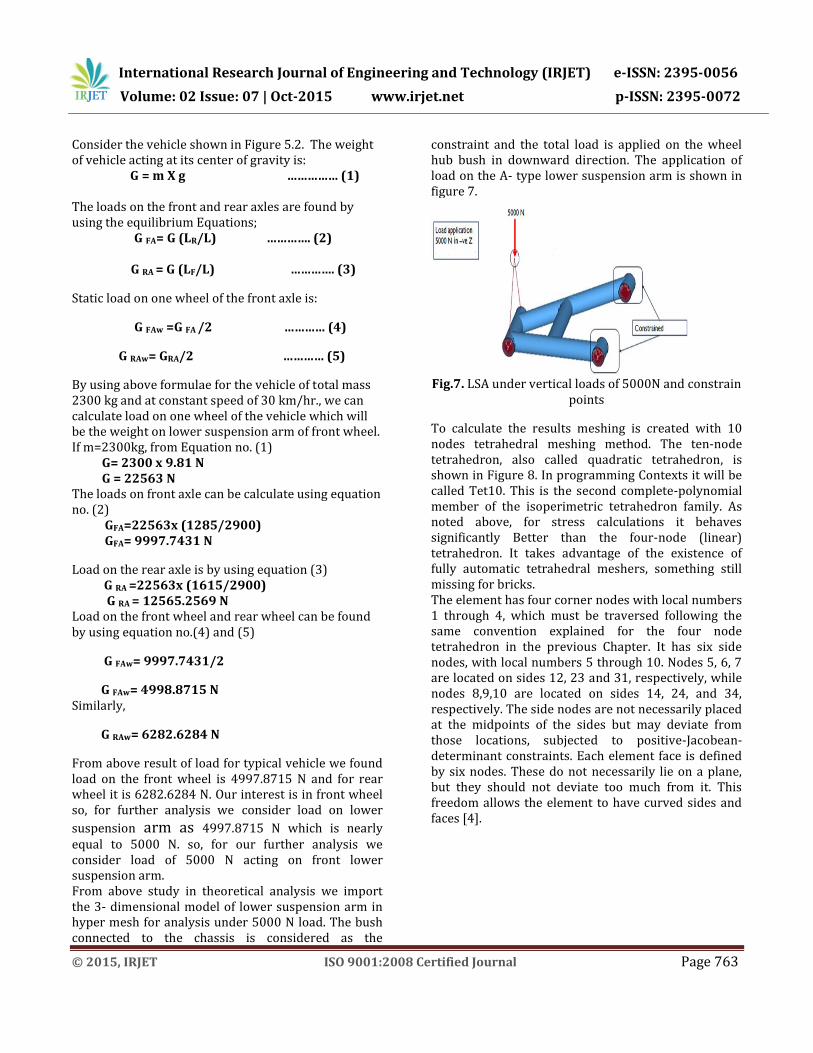
suspension arm as 4997.8715 N which is nearly equal to 5000 N. so, for our further analysis we consider load of 5000 N acting on front lower suspension arm. From above study in theoretical analysis we import the 3- dimensional model of lower suspension arm in hyper mesh for analysis under 5000 N load. The bush connected to the chassis is considered as the
constraint and the total load is applied on the wheel hub bush in downward direction. The application of load on the A- type lower suspension arm is shown in figure 7.
Fig.7. LSA under vertical loads of 5000N and constrain
points
To calculate the results meshing is created with 10 nodes tetrahedral meshing method. The ten-node tetrahedron, also called quadratic tetrahedron, is shown in Figure 8. In programming Contexts it will be called Tet10. This is the second complete-polynomial member of the isoperimetric tetrahedron family. As noted above, for stress calculations it behaves significantly Better than the four-node (linear) tetrahedron. It takes advantage of the existence of fully automatic tetrahedral meshers, something still missing for bricks. The element has four corner nodes with local numbers 1 through 4, which must be traversed following the same convention explained for the four node tetrahedron in the previous Chapter. It has six side nodes, with local numbers 5 through 10. Nodes 5, 6, 7 are located on sides 12, 23 and 31, respectively, while nodes 8,9,10 are located on sides 14, 24, and 34, respectively. The side nodes are not necessarily placed at the midpoints of the sides but may deviate from those locations, subjected to positive-Jacobean-determinant constraints. Each element face is defined by six nodes. These do not necessarily lie on a plane, but they should not deviate too much from it. This freedom allows the element to have curved sides and faces [4].
International Research Journal of Engineering and Technology (IRJET) e-ISSN: 2395-0056
Volume: 02 Issue: 07 | Oct-2015 www.irjet.net p-ISSN: 2395-0072
© 2015, IRJET ISO 9001:2008 Certified Journal Page 764
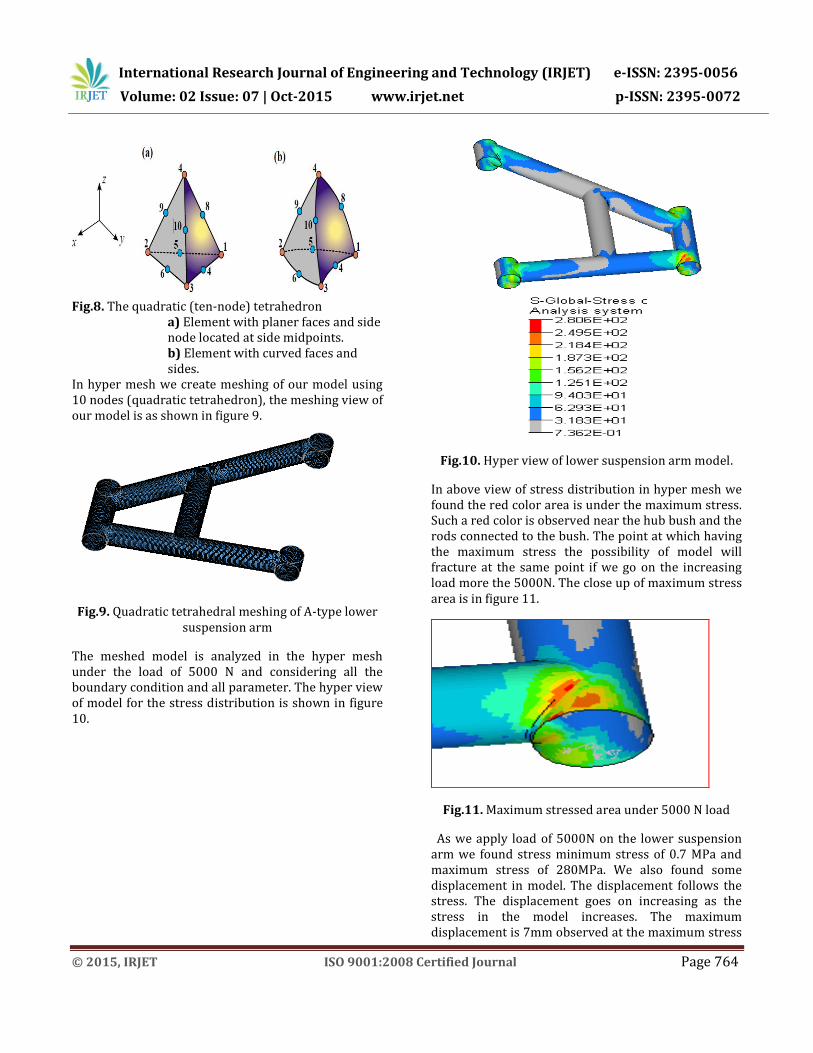
Fig.8. The quadratic (ten-node) tetrahedron
a) Element with planer faces and side node located at side midpoints. b) Element with curved faces and sides.
In hyper mesh we create meshing of our model using 10 nodes (quadratic tetrahedron), the meshing view of our model is as shown in figure 9.
Fig.9. Quadratic tetrahedral meshing of A-type lower
suspension arm
The meshed model is analyzed in the hyper mesh under the load of 5000 N and considering all the boundary condition and all parameter. The hyper view of model for the stress distribution is shown in figure 10.
Fig.10. Hyper view of lower suspension arm model.
In above view of stress distribution in hyper mesh we found the red color area is under the maximum stress. Such a red color is observed near the hub bush and the rods connected to the bush. The point at which having the maximum stress the possibility of model will fracture at the same point if we go on the increasing load more the 5000N. The close up of maximum stress area is in figure 11.
Fig.11. Maximum stressed area under 5000 N load
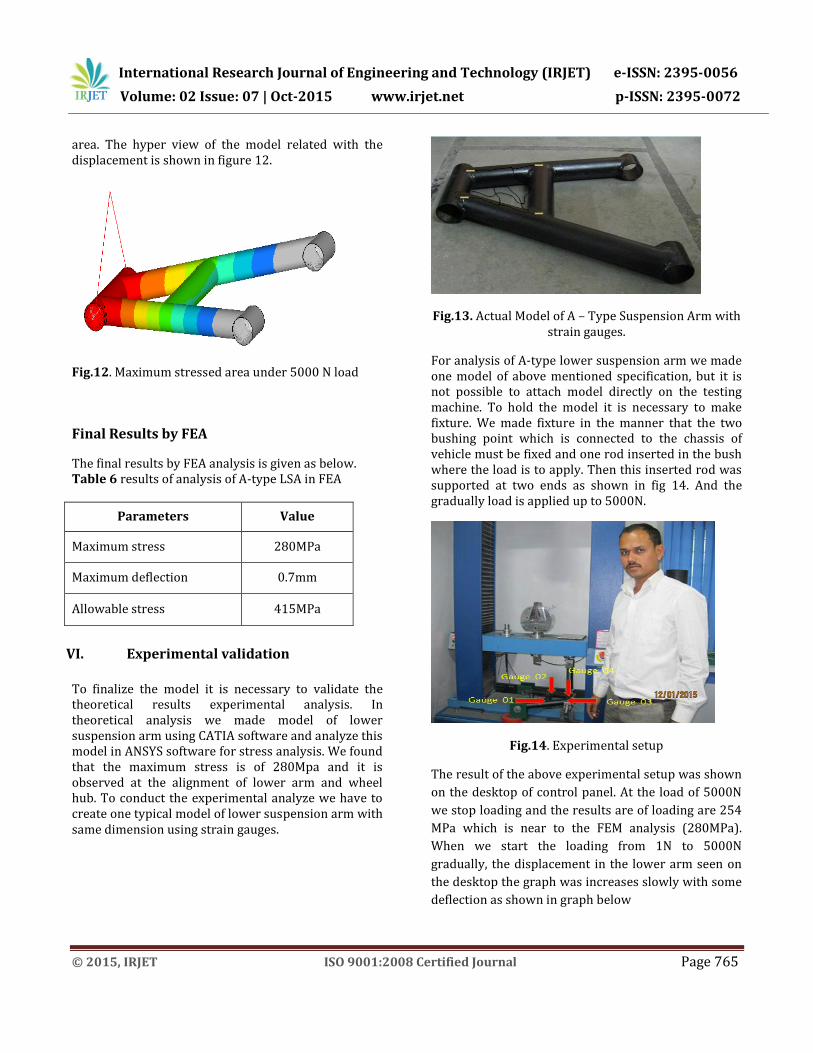
As we apply load of 5000N on the lower suspension arm we found stress minimum stress of 0.7 MPa and maximum stress of 280MPa. We also found some displacement in model. The displacement follows the stress. The displacement goes on increasing as the stress in the model increases. The maximum displacement is 7mm observed at the maximum stress
International Research Journal of Engineering and Technology (IRJET) e-ISSN: 2395-0056
Volume: 02 Issue: 07 | Oct-2015 www.irjet.net p-ISSN: 2395-0072
© 2015, IRJET ISO 9001:2008 Certified Journal Page 765
area. The hyper view of the model related with the displacement is shown in figure 12.
Fig.12. Maximum stressed area under 5000 N load
Final Results by FEA
The final results by FEA analysis is given as below. Table 6 results of analysis of A-type LSA in FEA
Parameters Value
Maximum stress 280MPa
Maximum deflection 0.7mm
Allowable stress 415MPa
VI. Experimental validation
To finalize the model it is necessary to validate the theoretical results experimental analysis. In theoretical analysis we made model of lower suspension arm using CATIA software and analyze this model in ANSYS software for stress analysis. We found that the maximum stress is of 280Mpa and it is observed at the alignment of lower arm and wheel hub. To conduct the experimental analyze we have to create one typical model of lower suspension arm with same dimension using strain gauges.
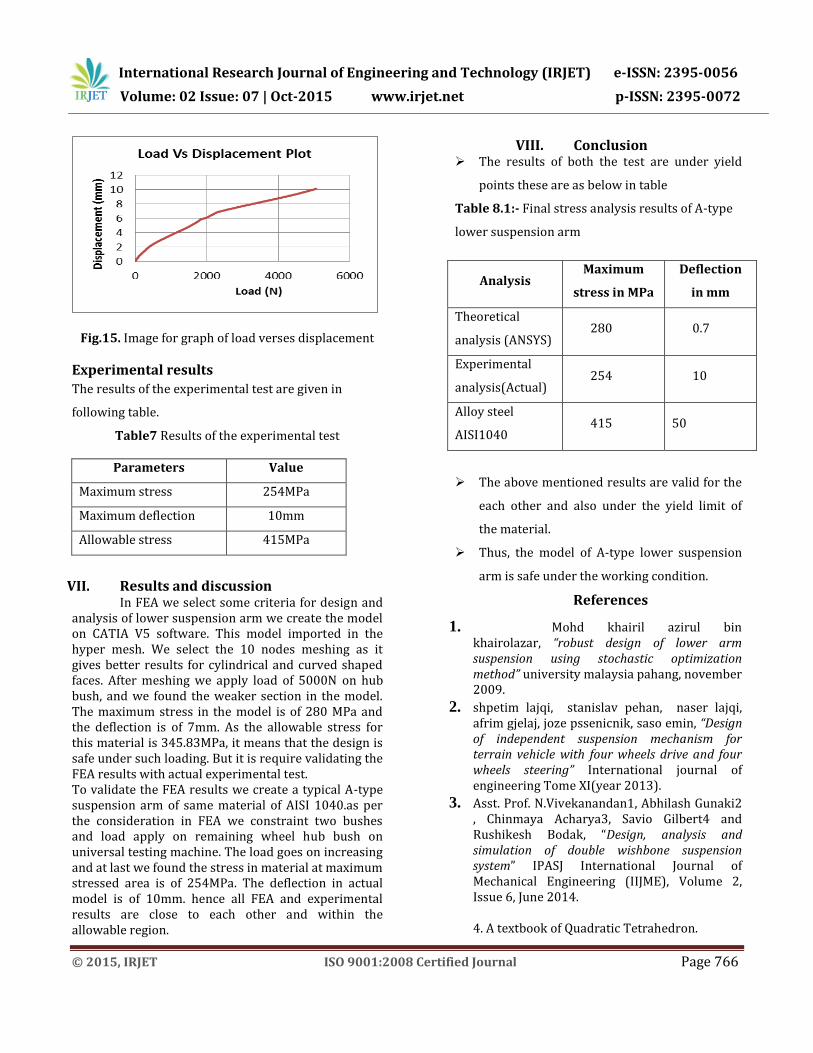
Fig.13. Actual Model of A – Type Suspension Arm with strain gauges.
For analysis of A-type lower suspension arm we made one model of above mentioned specification, but it is not possible to attach model directly on the testing machine. To hold the model it is necessary to make fixture. We made fixture in the manner that the two bushing point which is connected to the chassis of vehicle must be fixed and one rod inserted in the bush where the load is to apply. Then this inserted rod was supported at two ends as shown in fig 14. And the gradually load is applied up to 5000N.
Fig.14. Experimental setup
The result of the above experimental setup was shown
on the desktop of control panel. At the load of 5000N
we stop loading and the results are of loading are 254
MPa which is near to the FEM analysis (280MPa).
When we start the loading from 1N to 5000N
gradually, the displacement in the lower arm seen on
the desktop the graph was increases slowly with some
deflection as shown in graph below
International Research Journal of Engineering and Technology (IRJET) e-ISSN: 2395-0056
Volume: 02 Issue: 07 | Oct-2015 www.irjet.net p-ISSN: 2395-0072
© 2015, IRJET ISO 9001:2008 Certified Journal Page 766
Fig.15. Image for graph of load verses displacement
Experimental results
The results of the experimental test are given in
following table.
Table7 Results of the experimental test
Parameters Value
Maximum stress 254MPa
Maximum deflection 10mm
Allowable stress 415MPa
VII. Results and discussion In FEA we select some criteria for design and
analysis of lower suspension arm we create the model on CATIA V5 software. This model imported in the hyper mesh. We select the 10 nodes meshing as it gives better results for cylindrical and curved shaped faces. After meshing we apply load of 5000N on hub bush, and we found the weaker section in the model. The maximum stress in the model is of 280 MPa and the deflection is of 7mm. As the allowable stress for this material is 345.83MPa, it means that the design is safe under such loading. But it is require validating the FEA results with actual experimental test. To validate the FEA results we create a typical A-type suspension arm of same material of AISI 1040.as per the consideration in FEA we constraint two bushes and load apply on remaining wheel hub bush on universal testing machine. The load goes on increasing and at last we found the stress in material at maximum stressed area is of 254MPa. The deflection in actual model is of 10mm. hence all FEA and experimental results are close to each other and within the allowable region.
VIII. Conclusion The results of both the test are under yield
points these are as below in table
Table 8.1:- Final stress analysis results of A-type
lower suspension arm
Analysis Maximum
stress in MPa
Deflection
in mm
Theoretical
analysis (ANSYS) 280 0.7
Experimental
analysis(Actual) 254 10
Alloy steel
AISI1040 415 50
The above mentioned results are valid for the
each other and also under the yield limit of
the material.
Thus, the model of A-type lower suspension
arm is safe under the working condition.
References
1. Mohd khairil azirul bin khairolazar, “robust design of lower arm suspension using stochastic optimization method” university malaysia pahang, november 2009.
2. shpetim lajqi, stanislav pehan, naser lajqi, afrim gjelaj, joze pssenicnik, saso emin, “Design of independent suspension mechanism for terrain vehicle with four wheels drive and four wheels steering” International journal of engineering Tome XI(year 2013).
3. Asst. Prof. N.Vivekanandan1, Abhilash Gunaki2 , Chinmaya Acharya3, Savio Gilbert4 and Rushikesh Bodak, “Design, analysis and simulation of double wishbone suspension system” IPASJ International Journal of Mechanical Engineering (IIJME), Volume 2, Issue 6, June 2014. 4. A textbook of Quadratic Tetrahedron.

![The Parameters Optimizing Design of Double Suspension Arm ...downloads.hindawi.com/journals/sv/2017/8153756.pdf · between suspension and steering system. Sun et al. [12] designed](https://img.pdfslide.net/doc/110x75/603f2239b108b802da6e7210/the-parameters-optimizing-design-of-double-suspension-arm-between-suspension.jpg)