Embed Size (px)
Citation preview

Design and Analysis of Case-Control Studies
Kyoungmi Kim, Ph.D.Nov 9 & 16, 2016
This seminar is jointly supported by the following NIH-funded centers:

We are video recording this seminar so please hold questions until the end.
Thanks

Seminar Objectives
Introduce basic concepts, application, and issues of case-control studies
Understand key considerations in designing a case-control study, such as confounding and matching
How to determine sample size for a prospective case-control study

Case-Control Studies
Are used to retrospectively determine if there is an association between an exposure and a specific health outcome.
Proceed from effect (e.g. health outcome, condition, disease) to cause (exposure).
Collect data on exposure retrospectively.
Are observational studies because no intervention is attempted and no attempt is made to alter the course of the disease.

When is a Case-Control Study Warranted?
A case-control study is usually conducted before a cohort or an experimental study to identify the possible etiology of the disease.– It costs relatively less and can be conducted in a shorter time.
For a given disease, a case-control study can investigate multiple exposures (when the real exposure is not known).
A case-control study is preferred when the disease is rare because investigators can intentionally search for the cases.– A cohort study of rare disease would need to start with a large
number of exposed people to get adequate number of cases at the end.

Basic Case-Control Study Design
(Look back in time) Assess prior exposure status at some specified time point before disease onset
(Present) Selection of cases and controls based on health outcome or disease status
Selected by inclusion and exclusion criteria
A subset of the target population, randomly selected from the population
StudyPopulation
Study Participants
Case Group
Exposed Unexposed
Control Group
Exposed Unexposed
Non Participants

Determine Association
After the investigator determines the exposure, a table can be formed from the study data:
Assess whether exposure is disproportionately distributed between the cases and controls, which may indicate that the exposure is a risk factor for the health outcome under study.
Cases Controls
Exposed a b
Unexposed c d

Issues in the Design of Case-Control Studies
Formulation of a clearly defined hypothesis– As with all epidemiological or observational investigations the
beginning of a case-control study should begin with the formulation of a clearly defined hypothesis.
Case definition– It is essential that the case definition is clearly defined at the
outset of the investigation to ensure that all cases included in the study are based on the same diagnostic criteria.
Source of cases– The source of cases needs to be clearly defined.

Selection of Cases
Cases should be homogenous– Criteria or definition of cases must be well formulated and
documented – If diagnostic tests are used to identify cases:
• High-sensitivity tests (same as broad criteria or definition) will yield a higher number of false positives
• Low-sensitivity tests (same as restrictive criteria or case definition), and thus high specificity, will result in a lower number of false positives
• A mild form of disease may also include higher false positives than a severe form of disease
– If cases are misclassified (include false positives), the association may be false.

Source of Cases
Cases may be recruited from a number of sources– Can be recruited from a hospital, clinic, GP registers or may be
population bases.– Population based case-control studies are generally more
expensive and difficult to conduct.

Selection of Controls
Conceptually, controls should come from the same population at risk of disease from which cases develop.
But practically, controls are often selected to be similar to cases on key factors but without the disease- because it is difficult to define the population at risk of disease.
Different types of controls may be used, and they have different limitations.

Types of Controls
Hospital controls– Have similar quality of information and are convenient to
select, but they may have characteristics or diseases that led to hospitalization
Dead controls– If cases are dead, information of past exposures will be given
by surrogates, such as spouse or children Best friend or neighbor controls
– May share similar characteristics Population controls
– Random digit dialing (RDD) is often used

Multiple Control Groups
Because of the several limitations in the selection of controls, the use of multiple control groups may address some of the concerns– Use both living controls and dead controls
• The use of surrogates to provide data– Hospital controls and community controls
• Hospital controls may have some conditions that lead to frequent hospital visits
– Non-disease controls and cancer controls• Recall of past exposure differs with outcome
If findings are in agreement between groups, then they are likely to be valid
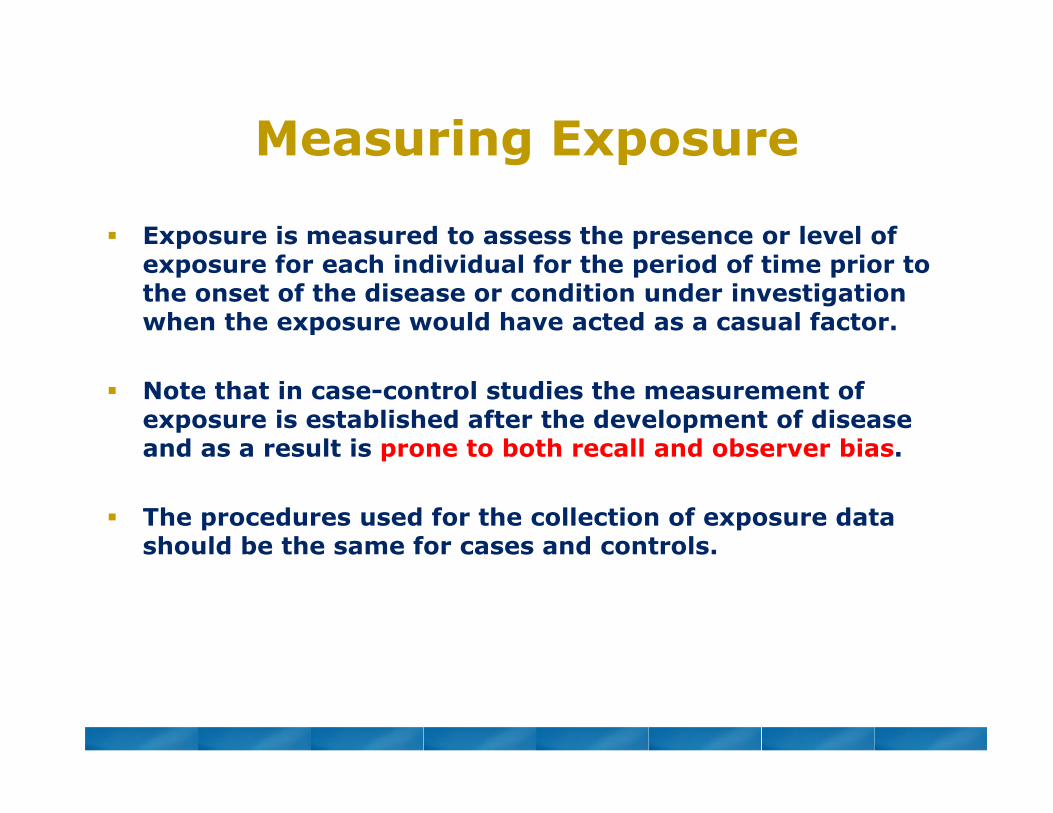
Measuring Exposure
Exposure is measured to assess the presence or level of exposure for each individual for the period of time prior to the onset of the disease or condition under investigation when the exposure would have acted as a casual factor.
Note that in case-control studies the measurement of exposure is established after the development of disease and as a result is prone to both recall and observer bias.
The procedures used for the collection of exposure data should be the same for cases and controls.
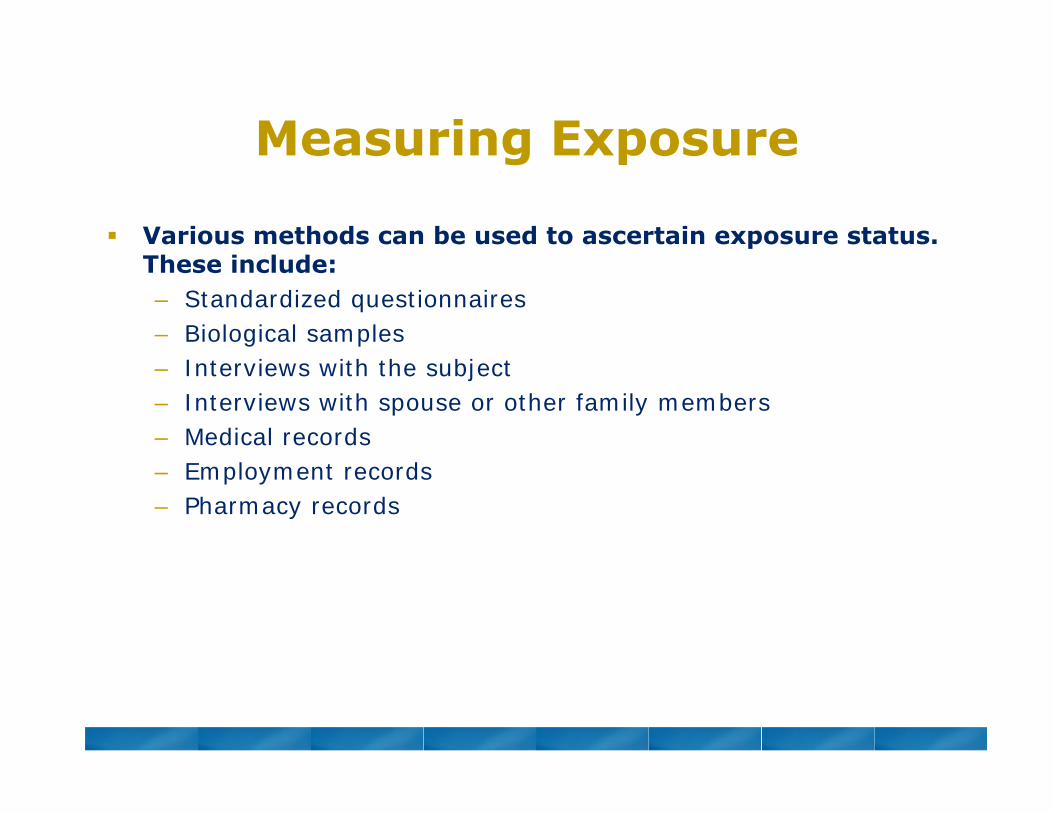
Measuring Exposure
Various methods can be used to ascertain exposure status. These include:– Standardized questionnaires– Biological samples– Interviews with the subject– Interviews with spouse or other family members– Medical records– Employment records– Pharmacy records

Sources of Bias in Case-Control Studies
Recall Bias– Occurs when the recall is better among cases than controls
because of the presence of the disease.
Selection bias – Controls are used to provide an estimate of the exposure rate
in the population. Therefore, selection bias may occur when those individuals selected as controls are unrepresentative of the population that produced the cases.
– Selection bias may also be introduced when exposed cases are more likely to be selected than unexposed cases.

Analysis of Case-Control Studies
The odds ratio (OR) is used in case-control studies to estimate the strength of the association between exposure and outcome.
Note that it is not possible to estimate the incidence of disease from a case-control study unless the study is population based and all cases in a defined population are obtained.
The results of a case-control study can be presented in a 2x2 table (next slide).

Measure of Incidence in Case-Control Studies
Odds ratio (OR) =
=
=
Cases Controls
Exposed a b
Unexposed c d
Interpreting the odds ratio:• OR = 1 Odds of disease is the same
for exposed and unexposed• OR > 1 Exposure increases odds of
disease• OR < 1 Exposure reduces odds of
disease

Example Conducted a case-control study to determine if there is an
association between colon cancer and diet (high fat diet, coffee).– Cases were all confirmed colon cancer cases in CA in 2011.– Controls were a sample of CA residents without colon cancer.
– OR= 4 in the study of high fat diet:• Individuals who consumed a high fat diet have 4 times the
odds of colon cancer than individuals who do not consume a high fat diet.
– OR= 0.6 in the study of coffee consumption:• The odds of colon cancer among coffee drinkers is only 0.6
times the odds among individuals who do not consume coffee- thus coffee consumption seems to be protective against colon cancer.

Case-Control Studies: Strengths
Strengths– Cost effective relative to other analytical studies such as
cohort studies– Case-control studies are retrospective, and cases are identified
at the beginning of the study; therefore, there is no long follow-up period (as compared to cohort studies)
– Efficient for the study of diseases with long latency periods– Allow to look at multiple exposures simultaneously– Useful as initial studies to establish an association

Case-Control Studies: Weaknesses
Weaknesses– Particularly prone to bias, especially selection, recall and
observer bias because they rely on memory and people with a condition will be more motivated to recall risk factors
– Case-control studies are limited to examining one outcome– Unable to estimate incidence rates of diseases (unless study is
population based)– Poor choice for the study of rare exposures– The temporal sequence between exposure and disease may be
difficult to establish– It can be difficult to find a suitable control group

Design Pitfalls to Look out for
Care should be taken to avoid confounding, which arises when an exposure and an outcome are both strongly associated with a third variable.
Controls should be subjects which might have been cases in the study but are selected independent of the exposure.
Cases and controls should also not be “over-matched”.
Questions to ask yourself:– In the control group appropriate for the population?– Does the study use matching or pairing appropriately to avoid
the effects of a confounding variable?– Does it use appropriate inclusion and exclusion criteria?
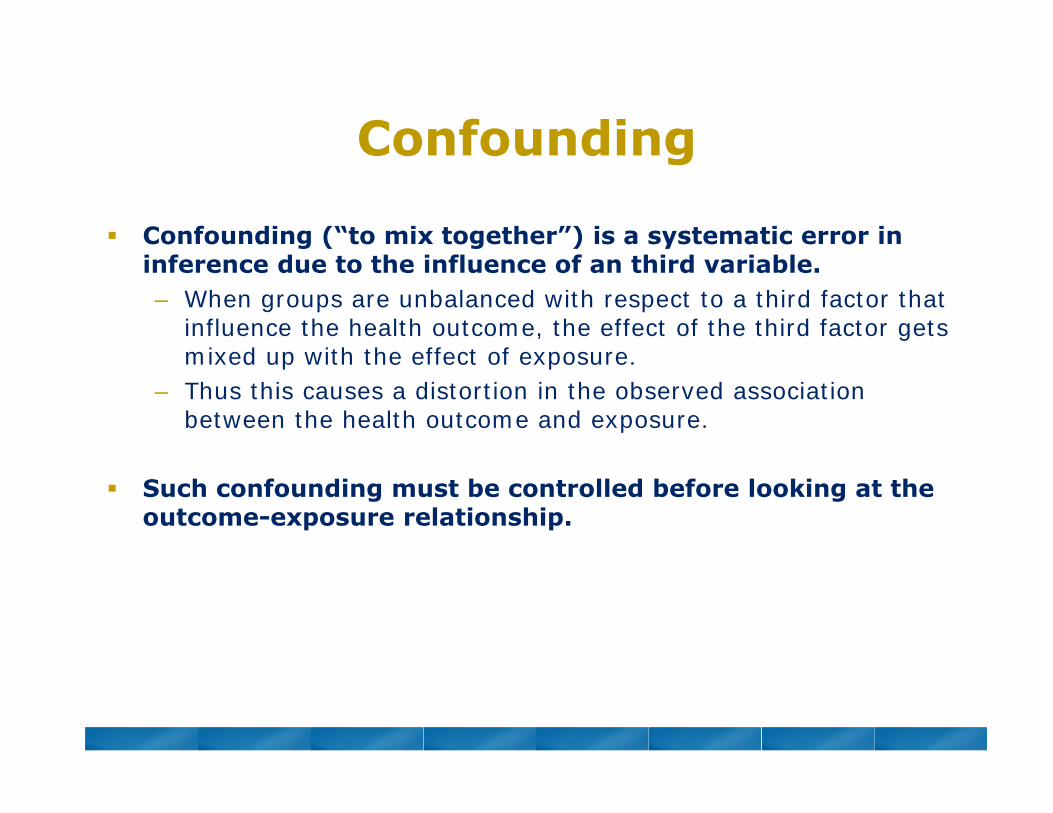
Confounding
Confounding (“to mix together”) is a systematic error in inference due to the influence of an third variable.– When groups are unbalanced with respect to a third factor that
influence the health outcome, the effect of the third factor gets mixed up with the effect of exposure.
– Thus this causes a distortion in the observed association between the health outcome and exposure.
Such confounding must be controlled before looking at the outcome-exposure relationship.

Example: Relationship between lung cancer incidence and drinking status
Suppose we were interested in the relationship between lung cancer incidence and heavy drinking (defined as ≥ 2 drinks per day)
We conducted a retrospective study for past 10 years where drinking status was determined at the baseline and cancer endpoints
The 2x2 table is constructed relating lung cancer incidence to initial drinking status:
OR =1.67, suggesting that heavy drinking is a risk factor for lung cancer.

What if smoking is a confounder? Hypothesis: Smokers are more likely to both develop lung
cancer and to be heavy drinkers than non-smokers.
80% of smokers vs. 30% of non-smokers are heavy drinkers-thus smoking is related to drinking habit.
3% of smokers vs. 1% of non-smokers developed lung cancer-thus smoking is also likely related to lung cancer.
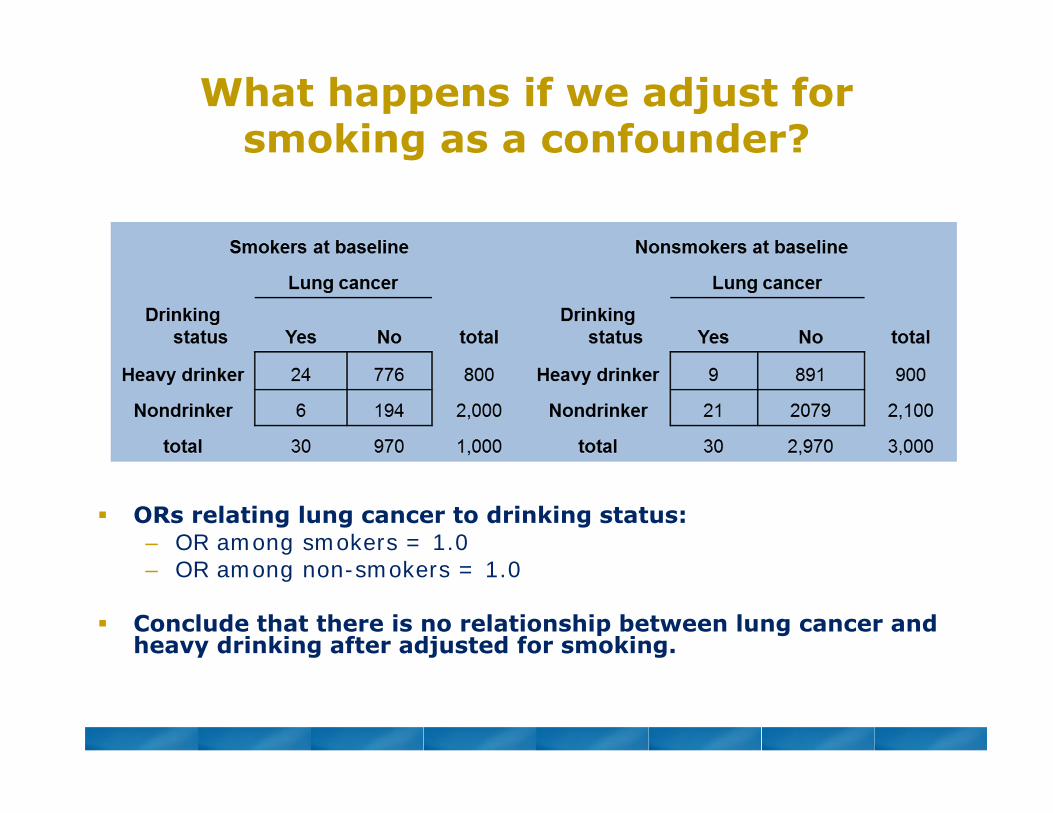
What happens if we adjust for smoking as a confounder?
ORs relating lung cancer to drinking status:– OR among smokers = 1.0– OR among non-smokers = 1.0
Conclude that there is no relationship between lung cancer and heavy drinking after adjusted for smoking.

Preventing Confounding
Several statistical techniques can be used to prevent or mitigate the effects of confounders. Methods include:– Randomization: works by balancing the factors that can
confound results between cases and controls.– Restriction: is a method that imposes uniformity in the study
base by limiting the type of individuals who may participate in the study; able to effectively define a source population that is homogenous with respect to the potential confounders.
– Matching: adjusts for factors by making like-to-like comparisons.
– Regression methods: adjusts for potential confounders through mathematical modeling (e.g., logistic regression).
– Stratification: divides the dataset into homogenous subgroups and do subset analyses (as illustrated in previous example).

Matching
Matching is the process of selecting controls in a case-control study so that controls are similar to the cases with regard to certain key characteristics- such as age, sex, and race
Matching can be performed at an individual or group level– Individual matching (matched pairs)– Group matching (frequency matching)
• In a study of breast cancer and reproductive risk factors from the Women’s Health Study, controls were matched using random digit dialing with frequency matching on ethnicity, the three age groups (30-39, 40-64, and 65-74), and the seven health planning districts.

Problems with Matching
Matching on many variables may make it difficult to find an appropriate control
We cannot explore the possible association of the disease with any variable on which the cases and controls have been matched.

Statistical Power and Sample Size
Statistical power is the probability of finding an effect (or association) if it’s real.
Factors affecting statistical power:– Size of effect – Standard deviation (variability of the population)– Sample size– Significance level desired
Sample size calculation:– Based on these elements, you can calculate a sample size or
do power analysis for a prospective study.

Calculating Sample Size for a Case-Control Study
221
2/2
)(p)Z)(1)((
)1(p
Zppr
rn
Sample size in Case group
β = desired power(typically 80% or 90%)
α = desired level of significance (typically 0.05)Variability
(standard deviation)
Effect Size (the difference in proportions)
r = ratio of controls to cases

Example
How many cases and controls do I need for this scenario?
– 80% power – 0.05 significance level– Equal number of cases and controls– Want to detect an odds ratio (OR) of 2.0 or greater– The proportion of exposed in the control group is 20%
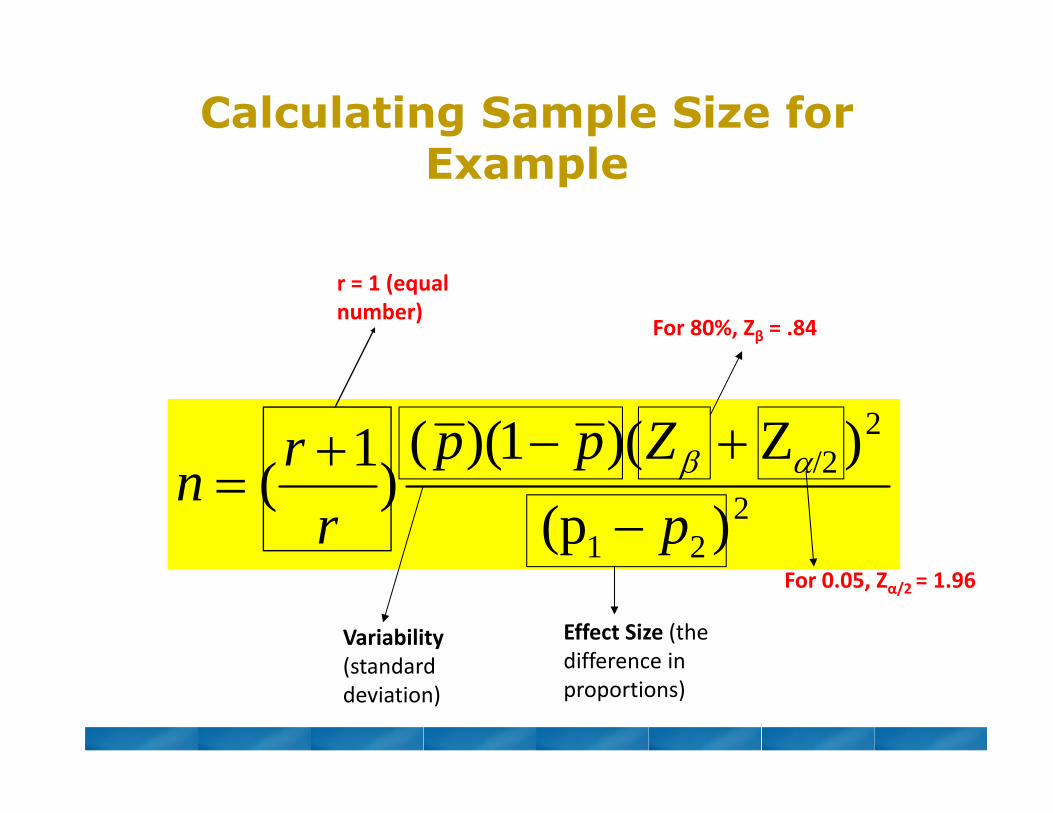
Calculating Sample Size for Example
221
2/2
)(p)Z)(1)((
)1(p
Zppr
rn
For 80%, Zβ = .84
For 0.05, Zα/2 = 1.96
Variability(standard deviation)
Effect Size (the difference in proportions)
r = 1 (equal number)

How to get proportions?
– Want to detect an odds ratio (OR) of 2.0 or greater– The proportion of exposed in the control group is 20% (p2=0.2)
1)1(2
21
ORpORpp
33.20.140.
1)10.2)(20(.)20(.0.2
1
p
Average proportion of exposed for the entire pool = (p1 + p2)/2= (.33+.20)/2 = .265

Calculating Sample Size for Example
– Therefore, n= 181 per group (181 cases and 181 controls)
181)20.33.(
)96.184)(.265.1)(265(.2 2
2
n

Summary Case-Control study is a “retrospective” study that works
backwards, beginning with the health endpoint outcome and then hunting back for possible causes that might have caused the outcome.
Things to keep in mind:– Potential bias:
• Recall• Selection
– Defining control groups • who are appropriate controls in your study?• Don’t use convenient controls (should be well defined)
– Avoid known confounding during study design if possible– A study should be statistically powered

Help is Available CTSC Biostatistics Office Hours
– Every Tuesday from 12 – 1:30pm in Sacramento– Sign-up through the CTSC Biostatistics Website
MIND IDDRC Biostatistics Office Hours– Monday-Friday at MIND– Provide full stat support for the IDDRC projects
EHS Biostatistics Office Hours– Every Monday from 2-4pm in Davis
Request Biostatistics Consultations– CTSC - www.ucdmc.ucdavis.edu/ctsc/– MIND IDDRC –
www.ucdmc.ucdavis.edu/mindinstitute/centers/iddrc/cores/bbrd.html
– Cancer Center and EHS Center websites

![16: Odds Ratios [from case- control studies] Case-control studies get around several limitations of cohort studies](https://img.pdfslide.net/doc/110x75/56649db05503460f94a9e4fb/16-odds-ratios-from-case-control-studies-case-control-studies-get-around.jpg)