Embed Size (px)
Citation preview
Rizza Ardiyanti
Graduated in Environmental Engineering
Design and Characterization of Chitin-
Glucan Polymeric Structures for Wound
Dressing Materials
Dissertation for obtaining the Master degree in Membrane Engineering
Erasmus Mundus Master in Membrane Engineering
Advisor : Luísa Neves, Post-Doctoral Researcher, FCT-UNL
Co-advisors : Isabel Coelhoso, Professor, FCT-UNL
João Crespo, Professor, FCT-UNL
Jury:
President : João Crespo, Professor, FCT-UNL
Members : Vitor Alves, Associate Professor, ISA-Universidade de Lisboa
Damien Quemener, Associate Professor, Montpellier University II
Vlastimil Fila, Associate Professor, ICT-Prague
July 2014
Page | ii
Rizza Ardiyanti
Graduated in Environmental Engineering
Design and Characterization of Chitin-
Glucan Polymeric Structures for Wound
Dressing Materials
Dissertation presented to Faculdade de
Ciências e Tecnologia, Universidade Nova
de Lisboa for obtaining the master degree in
Membrane Engineering
July 2014

Page | iii
Design and Characterization of Chitin-Glucan Polymeric Structures for Wound
Dressing Materials
The EM3E Master is an Education Programme supported by the European Commission,
the European Membrane Society (EMS), the European Membrane House (EMH), and a large
international network of industrial companies, research centers and universities
(http://www.em3e.eu).
Copyright @ Rizza Ardiyanti, FCT/UNL
A Faculdade de Ciências e Tecnologia e a Universidade Nova de Lisboa têm o direito, perpétuo
e sem limites geográficos, de arquivar e publicar esta dissertação através de exemplares
impressos reproduzidos em papel ou de forma digital, ou por qualquer outro meio conhecido ou
que venha a ser inventado, e de a divulgar através de repositórios científicos e de admitir a sua
cópia e distribuição com objectivos educacionais ou de investigação, não comerciais, desde que
seja dado crédito ao autor e editor.
Projecto financiado com o apoio da Comissão Europeia. A informação contida nesta publicação
vincula exclusivamente o autor, não sendo a Comissão responsável pela utilização que dela
possa ser feita.
Acknowledgments
This report is the outcome of my master thesis work, and conducted to finalize my master program of
Membrane Engineering. The research work is supported and executed in the lab of Chemical and
Biochemical Engineering Department at Faculdade de Ciências e Tecnologia, Universidade Nova de
Lisboa.
During this thesis, I have acquired precious experience as a researcher but also I had the opportunity
to deepen in the knowledge I got during my studies. These accomplishments could not have been
completed without the support of my supervisor: Dr. Luisa Neves for her motivation, encouragement,
critical judgement and moral support throughout this project.
I would like to express my sincere thanks to my co - supervisors, Prof. Isabel Coelhoso and Prof. João
Crespo for the opportunity they have provided me to be part of this project and this group. Thank you
very much for for your keen observations and invaluable advice.
I would like to thank Carla Rodrigues, for teaching me to use the DSC equipment and helping me
doing the DSC analysis. Also, Nuno Costa, for all the work in HPLC analyzes.
For Vitor Alves, I sincerely want to thank you for teaching me and for your assistance during the
rheology measurement. You even did the last measurement of my two samples during weekend.
Thank you very much.
I am thankful to Diana Araujo and Ines Farinha for having supervised me during the laboratory tests,
performed the CGC characterization and for all the help and kindliness shown in the clarification of
my very common questions. Special thanks also to all people in the BPEG group that welcome me
with open arms, always available to help me in whatever way I need. I want to highlight; Usman
Syed, Hugo Andrade, Rita Ferreira, Carla Martins, Carla Daniel and Silvia Antunes for helping me
with the experiments and giving me useful practical advice and on the whole making my work highly
enjoyable.
I would like to sincerely thank Dr. Elena Vallejo, Chargée de Projets, UM2, France for being so kind
and helping us above and beyond her capacity on many occasions, and to the coordinator of the
EM3E Program, Prof. André Ayral, for his support and guidance throughout the entire master course.
I am also very grateful to all the professors in the EM3E program, research and administrative staff of
UM2-France, ICT-Prague and UNL-Portugal for the support and guidance throughout the entire
master course.
I would like to thank the European Union and the European Commission for organizing the Erasmus
Mundus scholarship program.
Lastly, I would like to thank my family for their patience and everlasting support throughout the
duration of this course. It would not have been possible without their love, consideration and
understanding.
Rizza Ardiyanti
Lisbon, Portugal
July 2014
Page | 5
Abstract
The main objective of this work was the development of polymeric structures, gel and films,
generated from the dissolution of the Chitin-Glucan Complex (CGC) in biocompatible ionic liquids
for biomedical applications. Similar as chitin, CGC is only soluble in some special solvents which are
toxic and corrosive. Due to this fact and the urgent development of biomedical applications, the need
to use biocompatible ionic liquids to dissolve the CGC is indispensable. For the dissolution of CGC,
the biocompatible ionic liquid used was Choline acetate.
Two different CGC’s, KiOnutrime from KitoZyme and biologically produced CGC from Faculdade
de Ciencias e Tecnologia (FCT) - Universidade Nova de Lisboa, were characterized in order to
develop biocompatible wound dressing materials. The similar result is shown in term of the ratio of
chitin:glucan, which is 1:1.72 for CGC-FCT and 1:1.69 for CGC-Commercial. For the analysis of
metal element content, water and inorganic salts content and protein content, both polymers showed
some discrepancies, where the content in CGC-FCT is always higher compared to the commercial
one. The different characterization results between CGC-FCT and CGC-Commercial could be
addressed to differences in the purification method, and the difference of its original strain yeast,
whereas CGC-FCT is derived from P.pastoris and the commercial CGC is from A.niger.
This work also investigated the effect of biopolymers, temperature dissolution, non-solvent
composition on the characteristics of generated polymeric structure with biocompatible ionic liquid.
The films were prepared by casting a polymer mixture, immersion in a non-solvent, followed by
drying at ambient temperature. Three different non-solvents were tested in phase inversion method,
i.e. water, methanol, and glycerol. The results indicate that the composition of non-solvent in the
coagulation bath has great influence in generated polymeric structure. Water was found to be the best
coagulant for producing a CGC polymeric film structure.
The characterizations that have been done include the analysis of viscosity and viscoelasticity
measurement, as well as sugar composition in the membrane and total sugar that was released during
the phase inversion method. The rheology test showed that both polymer mixtures exhibit a non-
Newtonian shear thinning behaviour. Where the viscosity and viscoelasticity test reveal that CGC-
FCT mixture has a typical behaviour of a viscous solution with entangled polymer chains and CGC-
Commercial mixture has true gel behaviour. The experimental results show us that the generated
CGC solution from choline acetate could be used to develop both polymeric film structure and gel.
The generated structures are thermally stable at 100° C, and are hydrophilic. The produced films have
dense structure and mechanical stabilities against puncture up to 60 kPa.
Keywords: biopolymer, chitin-glucan complex, biocompatible ionic liquid, wound dressing
Page | 6
Table of contents
Acknowledgments .................................................................................................................................. 4
Abstract .................................................................................................................................................. 5
Table of contents .................................................................................................................................... 6
List of Tables .......................................................................................................................................... 8
List of Figures ........................................................................................................................................ 9
Abbreviations ....................................................................................................................................... 10
1. Introduction .................................................................................................................................. 11
1.1. Chitin .................................................................................................................................... 11
1.2. Chitin and Chitosan .............................................................................................................. 12
1.3. Chitin Glucan Complex (CGC) ............................................................................................ 13
1.4. Biocompatible Ionic Liquid .................................................................................................. 15
1.5. Dissolution of CGC in Ionic Liquid ..................................................................................... 16
1.6. Wound Dressing Materials ................................................................................................... 17
1.7. Objective of this thesis ......................................................................................................... 18
2. Material and Methods ................................................................................................................... 19
2.1. CGC-Commercial (KiOnutrime) data .................................................................................. 19
2.2. CGC Extraction from P. pastoris biomass ........................................................................... 20
2.3. CGC chemical analysis ........................................................................................................ 21
2.3.1. Metal element analysis ................................................................................................. 21
2.3.2. Water and Inorganic salts ............................................................................................. 22
2.3.3. Sugar constituents ......................................................................................................... 22
2.3.4. Protein content .............................................................................................................. 23
2.4. Thermal Properties ............................................................................................................... 24
2.5. Film preparation ................................................................................................................... 25
2.6. Rheology Test....................................................................................................................... 26
2.7. Sugar content in coagulation bath ........................................................................................ 27
2.8. Membrane Characterization ................................................................................................. 27
Page | 7
2.8.1. Puncture Test ................................................................................................................ 27
2.8.2. Contact Angle Analysis ................................................................................................ 28
2.8.3. Scanning Electron Microscopy (SEM) Analysis .......................................................... 29
3. Results and Discussion ................................................................................................................. 31
3.1. CGC Polymer ....................................................................................................................... 31
3.1.1. Metal element analysis ................................................................................................. 31
3.1.2. Water and inorganic salts content in CGC ................................................................... 32
3.1.3. Sugar constituents in CGC ........................................................................................... 32
3.1.4. Protein content in CGC ................................................................................................ 33
3.1.5. Thermal properties of CGC polymer ............................................................................ 34
3.2. Polymeric structures produced from CGC ........................................................................... 35
3.2.1. Rheology of CGC Mixtures.......................................................................................... 39
3.2.2. Thermal properties of polymer mixtures and films ...................................................... 41
3.2.3. Sugar constituents in CGC films .................................................................................. 44
3.2.4. Total sugar analysis in coagulation bath....................................................................... 45
3.2.5. Contact Angle Analysis ................................................................................................ 46
3.2.6. Puncture Test ................................................................................................................ 47
3.2.7. SEM Analysis ............................................................................................................... 49
4. Conclusions ................................................................................................................................... 51
5. Future Work .................................................................................................................................. 52
6. References .................................................................................................................................... 53
7. Appendices ................................................................................................................................... 57
Page | 8
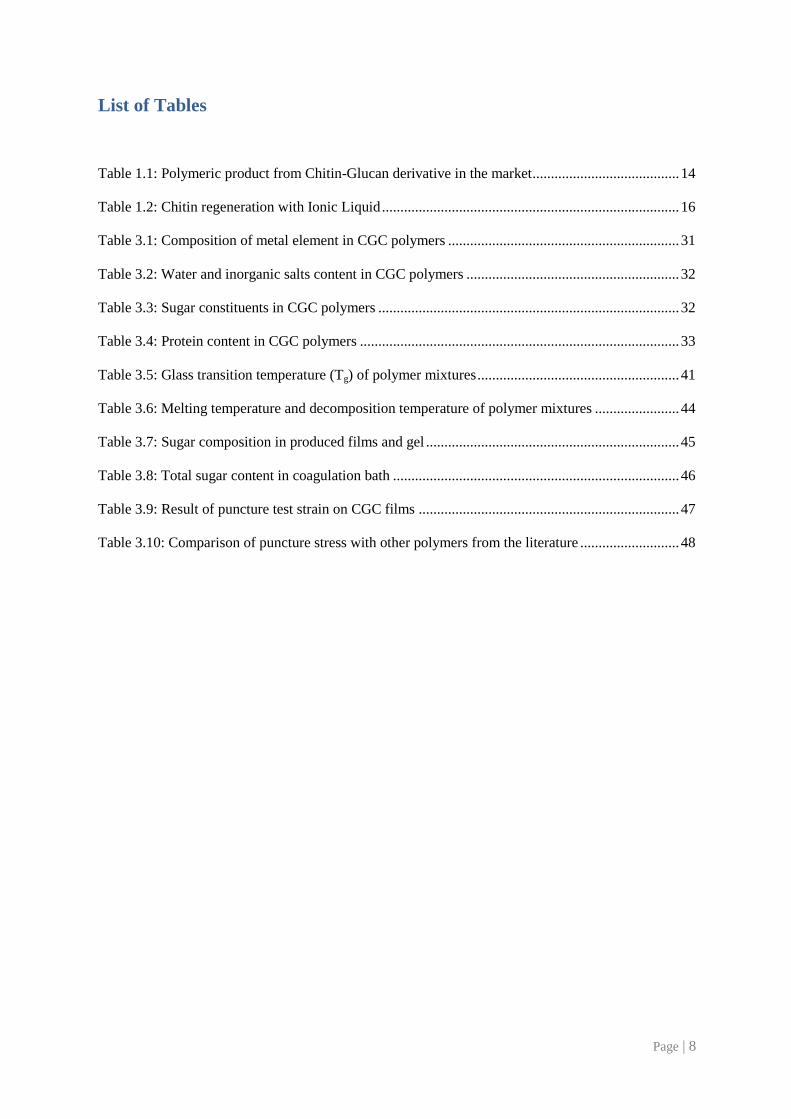
List of Tables
Table 1.1: Polymeric product from Chitin-Glucan derivative in the market ........................................ 14
Table 1.2: Chitin regeneration with Ionic Liquid ................................................................................. 16
Table 3.1: Composition of metal element in CGC polymers ............................................................... 31
Table 3.2: Water and inorganic salts content in CGC polymers .......................................................... 32
Table 3.3: Sugar constituents in CGC polymers .................................................................................. 32
Table 3.4: Protein content in CGC polymers ....................................................................................... 33
Table 3.5: Glass transition temperature (Tg) of polymer mixtures ....................................................... 41
Table 3.6: Melting temperature and decomposition temperature of polymer mixtures ....................... 44
Table 3.7: Sugar composition in produced films and gel ..................................................................... 45
Table 3.8: Total sugar content in coagulation bath .............................................................................. 46
Table 3.9: Result of puncture test strain on CGC films ....................................................................... 47
Table 3.10: Comparison of puncture stress with other polymers from the literature ........................... 48
Page | 9
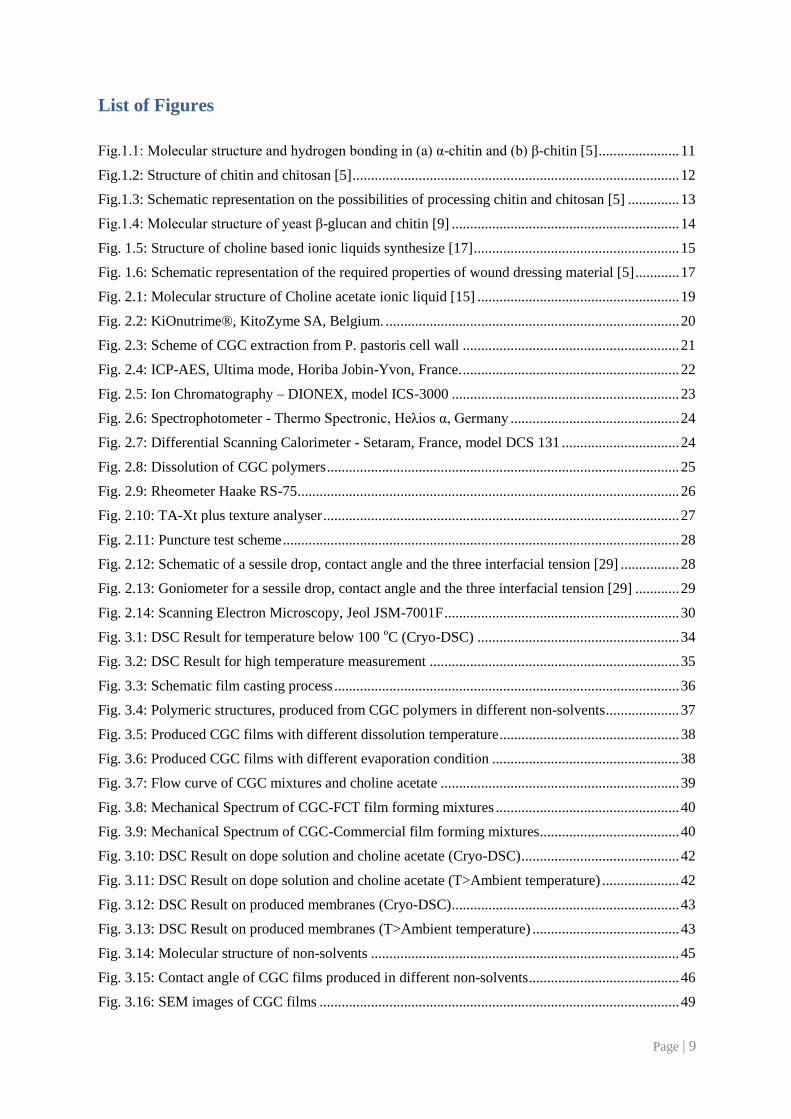
List of Figures
Fig.1.1: Molecular structure and hydrogen bonding in (a) α-chitin and (b) β-chitin [5] ...................... 11
Fig.1.2: Structure of chitin and chitosan [5] ......................................................................................... 12
Fig.1.3: Schematic representation on the possibilities of processing chitin and chitosan [5] .............. 13
Fig.1.4: Molecular structure of yeast β-glucan and chitin [9] .............................................................. 14
Fig. 1.5: Structure of choline based ionic liquids synthesize [17] ........................................................ 15
Fig. 1.6: Schematic representation of the required properties of wound dressing material [5] ............ 17
Fig. 2.1: Molecular structure of Choline acetate ionic liquid [15] ....................................................... 19
Fig. 2.2: KiOnutrime®, KitoZyme SA, Belgium. ................................................................................ 20
Fig. 2.3: Scheme of CGC extraction from P. pastoris cell wall ........................................................... 21
Fig. 2.4: ICP-AES, Ultima mode, Horiba Jobin-Yvon, France. ........................................................... 22
Fig. 2.5: Ion Chromatography – DIONEX, model ICS-3000 .............................................................. 23
Fig. 2.6: Spectrophotometer - Thermo Spectronic, Heλios α, Germany .............................................. 24
Fig. 2.7: Differential Scanning Calorimeter - Setaram, France, model DCS 131 ................................ 24
Fig. 2.8: Dissolution of CGC polymers ................................................................................................ 25
Fig. 2.9: Rheometer Haake RS-75 ........................................................................................................ 26
Fig. 2.10: TA-Xt plus texture analyser ................................................................................................. 27
Fig. 2.11: Puncture test scheme ............................................................................................................ 28
Fig. 2.12: Schematic of a sessile drop, contact angle and the three interfacial tension [29] ................ 28
Fig. 2.13: Goniometer for a sessile drop, contact angle and the three interfacial tension [29] ............ 29
Fig. 2.14: Scanning Electron Microscopy, Jeol JSM-7001F ................................................................ 30
Fig. 3.1: DSC Result for temperature below 100 oC (Cryo-DSC) ....................................................... 34
Fig. 3.2: DSC Result for high temperature measurement .................................................................... 35
Fig. 3.3: Schematic film casting process .............................................................................................. 36
Fig. 3.4: Polymeric structures, produced from CGC polymers in different non-solvents .................... 37
Fig. 3.5: Produced CGC films with different dissolution temperature ................................................. 38
Fig. 3.6: Produced CGC films with different evaporation condition ................................................... 38
Fig. 3.7: Flow curve of CGC mixtures and choline acetate ................................................................. 39
Fig. 3.8: Mechanical Spectrum of CGC-FCT film forming mixtures .................................................. 40
Fig. 3.9: Mechanical Spectrum of CGC-Commercial film forming mixtures ...................................... 40
Fig. 3.10: DSC Result on dope solution and choline acetate (Cryo-DSC) ........................................... 42
Fig. 3.11: DSC Result on dope solution and choline acetate (T>Ambient temperature) ..................... 42
Fig. 3.12: DSC Result on produced membranes (Cryo-DSC) .............................................................. 43
Fig. 3.13: DSC Result on produced membranes (T>Ambient temperature) ........................................ 43
Fig. 3.14: Molecular structure of non-solvents .................................................................................... 45
Fig. 3.15: Contact angle of CGC films produced in different non-solvents ......................................... 46
Fig. 3.16: SEM images of CGC films .................................................................................................. 49
Page | 10
Abbreviations
AIM Alkali Insoluble Material
BDL Below Detection Limit
BPEG Biochemical and Process Engineering Group
BSM Basal Salts Medium
CA Choline Acetate
CGC Chitin Glucan Complex
CMA Concomitant Metals Analyser
Comm. Commercial
DA Degree of Acetylation
DSC Differential Scanning Colorimetry
DO Dissolved Oxygen
EFSA European Food Safety Authority
EPS Exopolysaccharide
f Frequency
FCT Faculdade de Ciências e Tecnologia
G’ Elastic modulus
G’’ Viscosity modulus
HPLC High Performance Liquid Chromatography
Hz Hertz
ICP-AES Inductively Coupled Plasma-Atomic Emission Spectroscopy
ICP-MS Inductively Coupled Plasma-Mass Spectrometry
IL Ionic Liquid
ILs Ionic Liquids
MeOH Methanol
ND Not Determined
Pa Pascal
RH Relative Humidity
rpm Rotation per minute
SEM Scanning Electron Microscopy
s Second
TGA Thermogravimetry
Tg Glass transition Temperature
Tc Crystallisation Temperature
Tm Melting Temperature
UNL Universidade Nova de Lisboa
wt. Weight
Page | 11
1. Introduction
1.1. Chitin
Chitin is a non-toxic, biodegradable and biocompatible polysaccharide. It is the second most
abundant polysaccharide in nature after cellulose [1], found mainly as the exoskeleton material of
arthropods and crustaceans, and the cell wall of fungi. Chitin is a homopolymer of 1-4 linked 2-
acetamido-2-deoxy-β-D-glucopyranose [2]. It presents a wide diversity of structures and properties
that allows several possible chemical and mechanical modifications in order to create novel materials
with specific functionalities and properties.
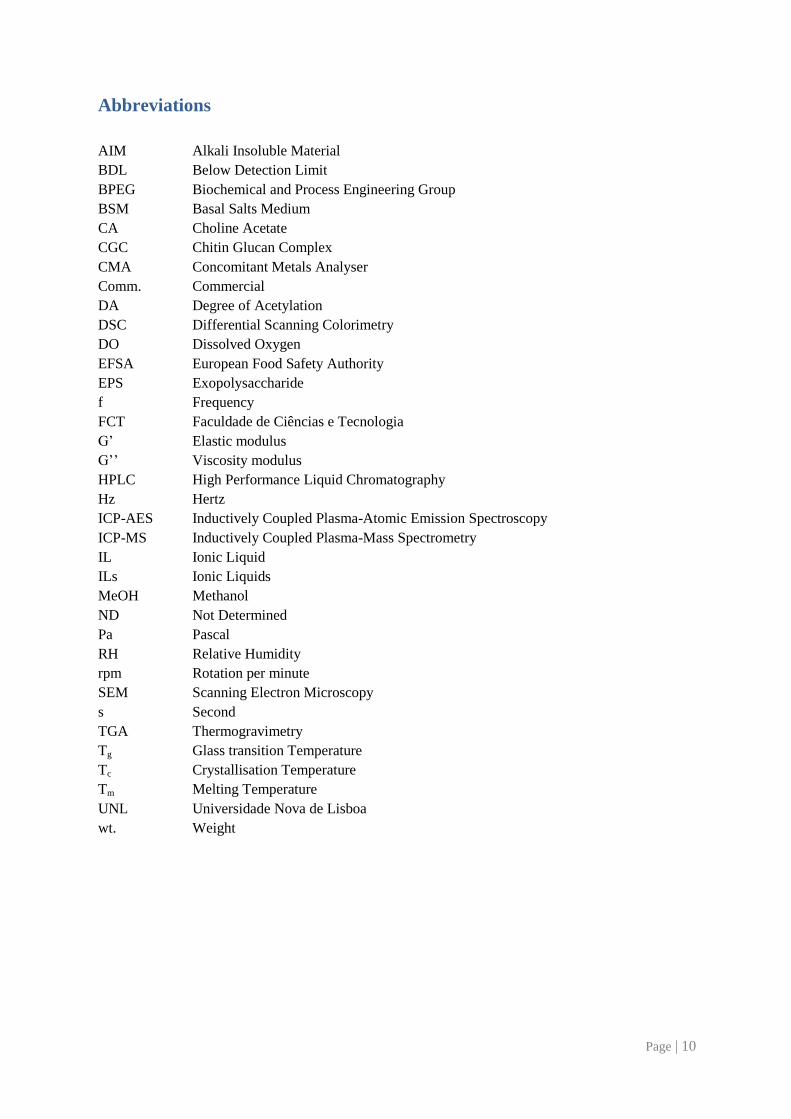
Chitin exists in three different polymorphic forms (α, β and γ). The polymorphic forms of chitin differ
in the packing and polarities of adjacent chains in successive sheets; in the β-form, all chains are
arranged in a parallel way, which is not the case in α-chitin [4]. The molecular structure of α-chitin
and β-chitin is presented in Fig. 1.1.
Fig.1.1: Molecular structure and hydrogen bonding in (a) α-chitin and (b) β-chitin [5]
β-chitin is proclaimed to be more reactive than the α-form, an important property in regard to
enzymatic and chemical transformations of chitin [4]. Pillai et al reported that a simple treatment with
20% NaOH followed by washing with water is one possible method to convert α-chitin to β-chitin
[4]. In both structures, the chitin chains are organized in sheets where they are tightly held by a
number of intra-sheet hydrogen bonds with α and β chains packed in antiparallel arrangements. This
tight network is dominated by the rather strong C-O-NH hydrogen bonds. The same feature is not
found in the structure of β-chitin, which is therefore more susceptible than α-chitin to intra-crystalline
swelling [4]. The current model for the crystalline structure of α-chitin indicates that the inter-sheet
Page | 12
hydrogen bonds are distributed in two sets with half occupancy in each set. These aspects make
evident the insolubility and intractability of chitin.
1.2. Chitin and Chitosan
Basically, chitin and chitosan are two points on a continuum of materials that share the same basic
structure and differ only in their degree of acetylation. Chitin and Chitosan are interesting
polysaccharides because of the presence of the amino functionality, which could be suitably modified
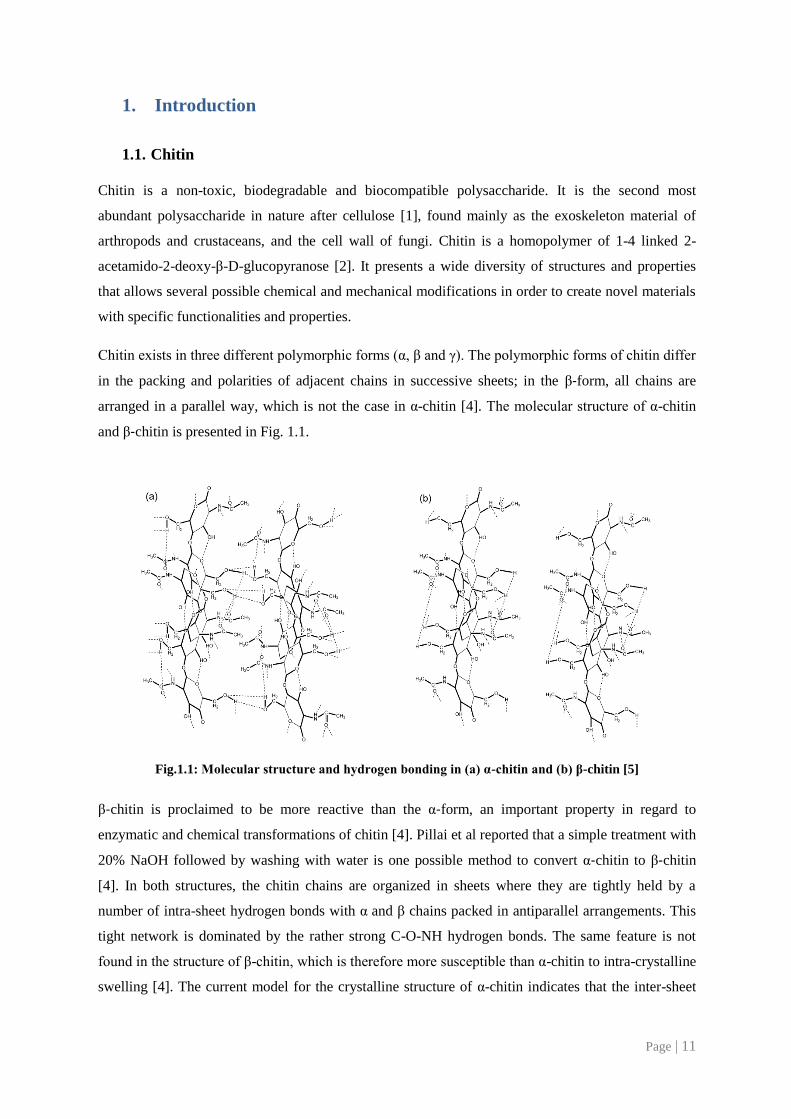
to convey desired properties and distinctive biological functions including solubility. Apart from the
amino groups, they have two hydroxyl functionalities for effecting appropriate chemical
modifications to enhance solubility. The structure of chitin and chitosan is shown in Fig.1.2.
Fig.1.2: Structure of chitin and chitosan [5]
The availability of amino groups on water-soluble chitin allows it to undergo polyelectrolyte
complexation with other polyanionic molecules, although the relatively lower charge density (in
comparison to chitosan) would affect its complexation properties [6]. It is also reported that the
amino functionality gives rise to chemical reactions such as grafting, quaternization, acetylation,
chelation of metals, reactions with aldehydes and ketones (to give Schiff’s base) alkylation, etc. to
grant a variety of products with properties such as such as anti-fungal, antibacterial, anti-acid, anti-
viral, non-allergenic, non-toxic, total biodegradability and biocompatibility [4]. The hydroxyl
functional groups also give various reactions such as H-bonding with polar atoms, o-acetylation,
grafting, etc. Owing to the semi-crystalline structure of chitin with extensive hydrogen bonding, the
cohesive energy density and the solubility parameter will be very high and so it will be insoluble in
all the usual solvents.
Page | 13
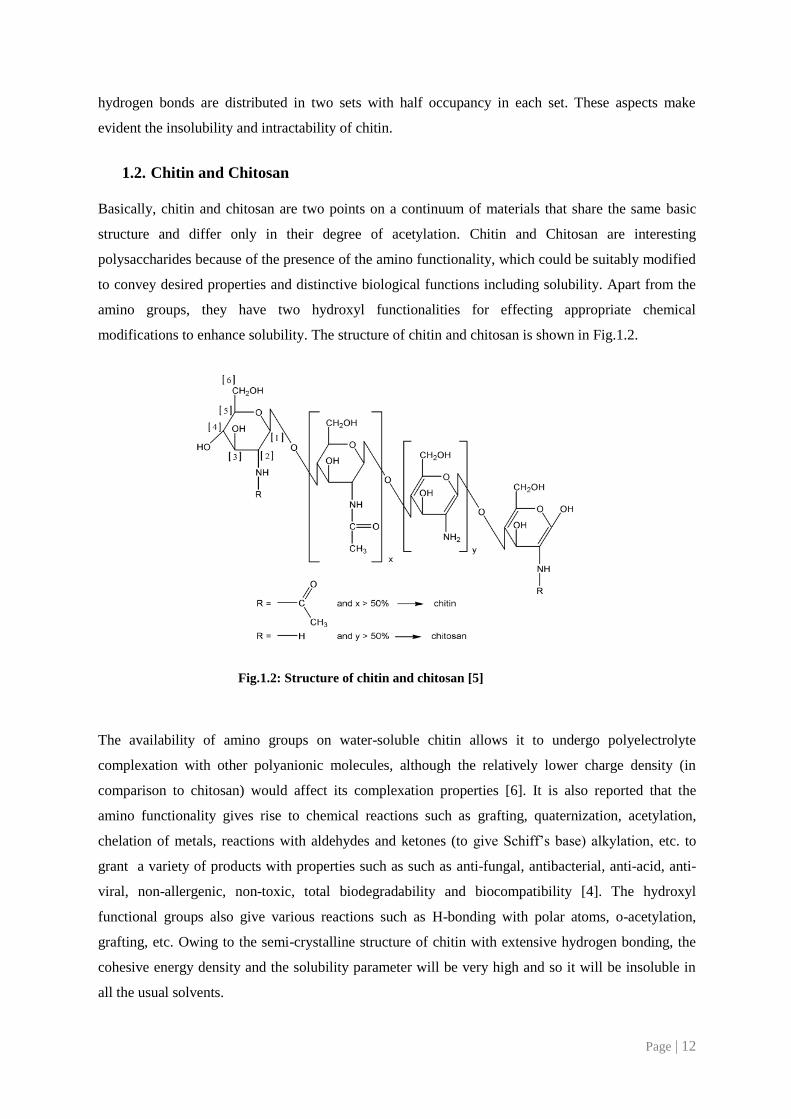
Fig.1.3: Schematic representation on the possibilities of processing chitin and chitosan [5]
Derived from chitin, chitosan is a unique biopolymer that exhibits preeminent properties, beside
biocompatibility and biodegradability [32]. These particular properties arise from the presence of
primary amines along the chitosan backbone. As a result, this polysaccharide can be a relevant
candidate in the field of biomaterials for tissue engineering. The possibilities usage of processing
chitin and chitosan is depicted in Fig.1.3.
1.3. Chitin Glucan Complex (CGC)
One material that has shown promise as a component of wound dressings is β-glucan, a
polysaccharide comprised of β-linked D-glucose molecules. A variety of β-glucans have been isolated
from various sources, such as fungi, baker’s yeast, barley, and seaweed. The physicochemical
properties of β-glucans differ depending on characteristics of their primary structure, as well as the
linkage type, degree of branching, molecular weight, and conformation. β-glucans have been reported
to be biocompatible, biodegradable and bio-absorbable, and also expected to promote the therapeutic
efficacy of the dressing by increasing the wound healing response [7].
On the other hand, Chitin-glucan is a copolymer composed of metabolites of D-glucosamine, N-
acetyl-D-glucosamine and glucose. The polysaccharides related to chitin-glucan, and on which most
of the available data, are based on chitin (of crustacean origin), chitosan (derived from chitin, of
crustacean origin), β-glucans (of vegetable and fungal origin) and oligomers of chitosan [8].
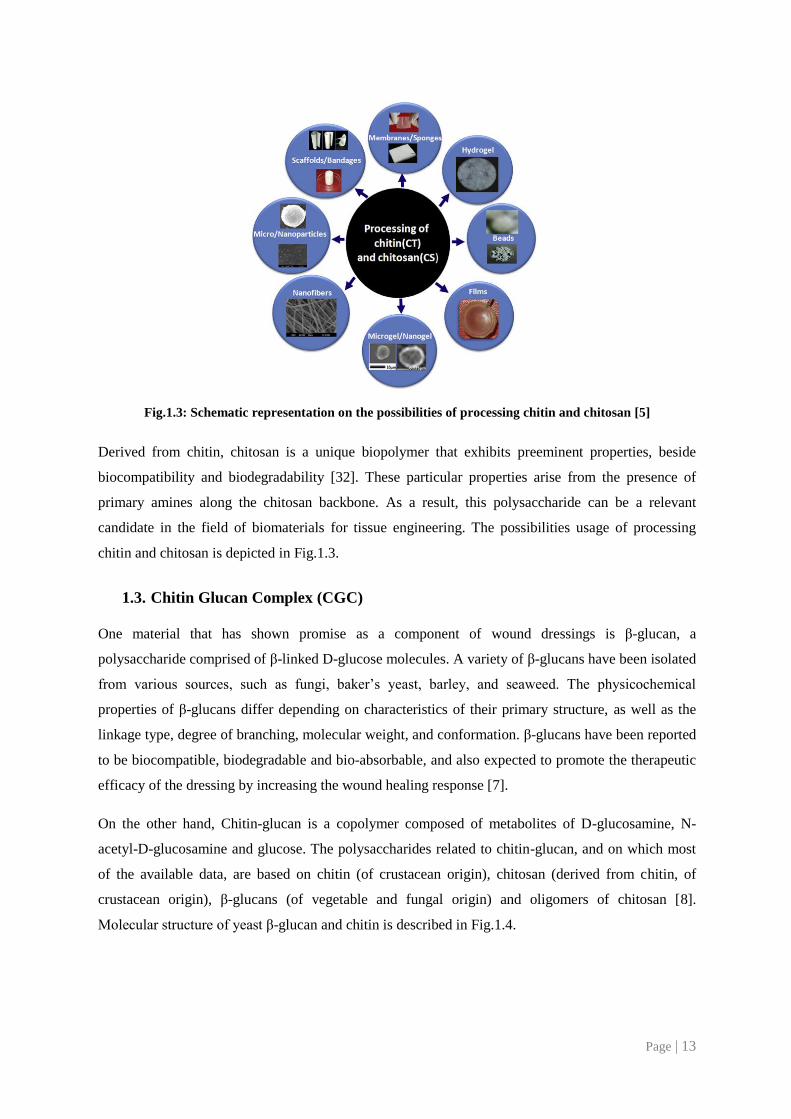
Molecular structure of yeast β-glucan and chitin is described in Fig.1.4.
Page | 14
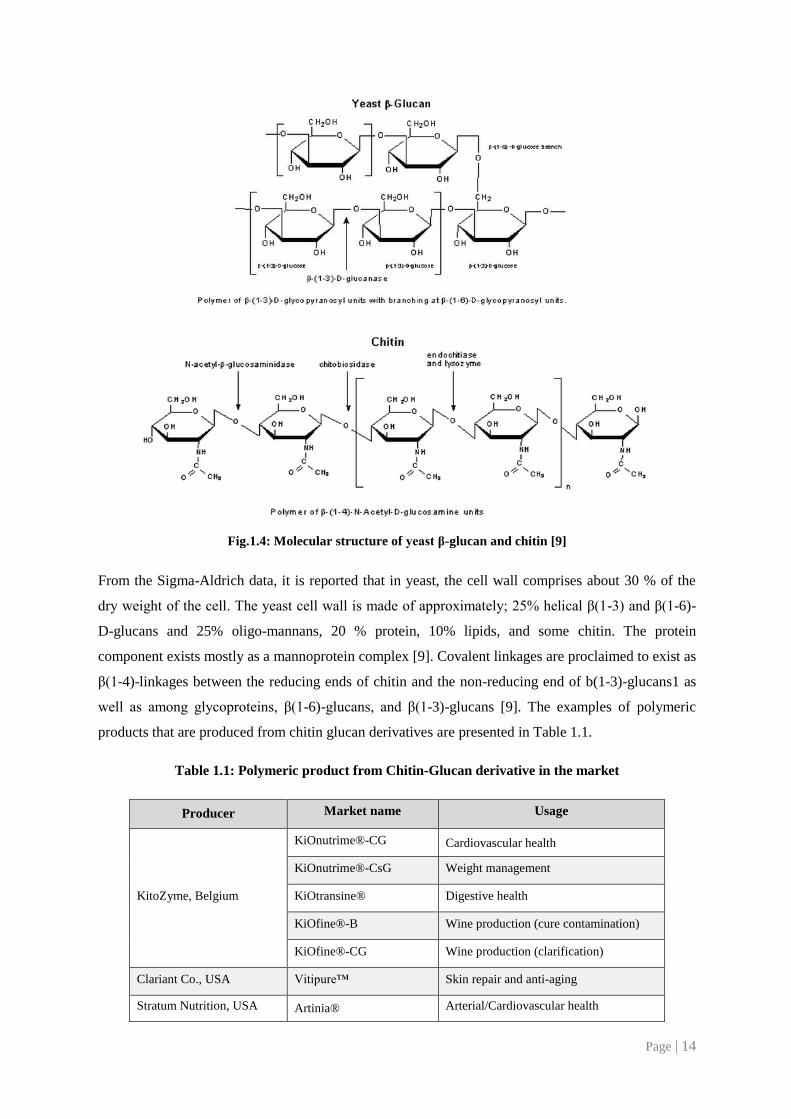
Fig.1.4: Molecular structure of yeast β-glucan and chitin [9]
From the Sigma-Aldrich data, it is reported that in yeast, the cell wall comprises about 30 % of the
dry weight of the cell. The yeast cell wall is made of approximately; 25% helical β(1-3) and β(1-6)-
D-glucans and 25% oligo-mannans, 20 % protein, 10% lipids, and some chitin. The protein
component exists mostly as a mannoprotein complex [9]. Covalent linkages are proclaimed to exist as
β(1-4)-linkages between the reducing ends of chitin and the non-reducing end of b(1-3)-glucans1 as
well as among glycoproteins, β(1-6)-glucans, and β(1-3)-glucans [9]. The examples of polymeric
products that are produced from chitin glucan derivatives are presented in Table 1.1.
Table 1.1: Polymeric product from Chitin-Glucan derivative in the market
Producer Market name Usage
KitoZyme, Belgium
KiOnutrime®-CG Cardiovascular health
KiOnutrime®-CsG Weight management
KiOtransine® Digestive health
KiOfine®-B Wine production (cure contamination)
KiOfine®-CG Wine production (clarification)
Clariant Co., USA Vitipure™ Skin repair and anti-aging
Stratum Nutrition, USA Artinia® Arterial/Cardiovascular health
Page | 15
1.4. Biocompatible Ionic Liquid
In recent years, natural renewable resources have been successfully used to produce biomaterials that
are biodegradable under certain temperature and humidity conditions. Unfortunately, most
biodegradable materials are synthesized by chemical processes using volatile organic solvents, and
their emissions and disposal are a large source of pollution worldwide. Alternative solvents such as
ionic liquids (ILs) have emerged as a solvents that can be used as templates for porous polymers,
components of polymeric matrices and solvents for a wide variety of organic and inorganic
compounds [3].
Ionic liquids (ILs) are structurally similar to salts that are a relatively new class of solvents, with
potential applications in various fields such as; synthesis, catalysis and electrochemistry, protein
stability, polymers conformation and gas separation [13]. Besides, these ILs gained honour as
neoteric solvents due to their unique chemical and physical properties such as stability on exposure to
air and moisture, extremely low vapour pressure, and high solubility power [11]. The key attraction
of ILs is their possibility to be tuned by varying the nature of cations and anions present in their
structure.
Recently, ILs have also provided a new processing platform for the dissolution of some natural
macromolecules (e.g. cellulose, chitin, starch and lignin) that are otherwise difficult to dissolve due to
their inter- and intramolecular hydrogen bonds [1]. In the IL platform, macromolecules can be
dissolved, regenerated, derived and functionalized, increasing their potential for exploitation [3].
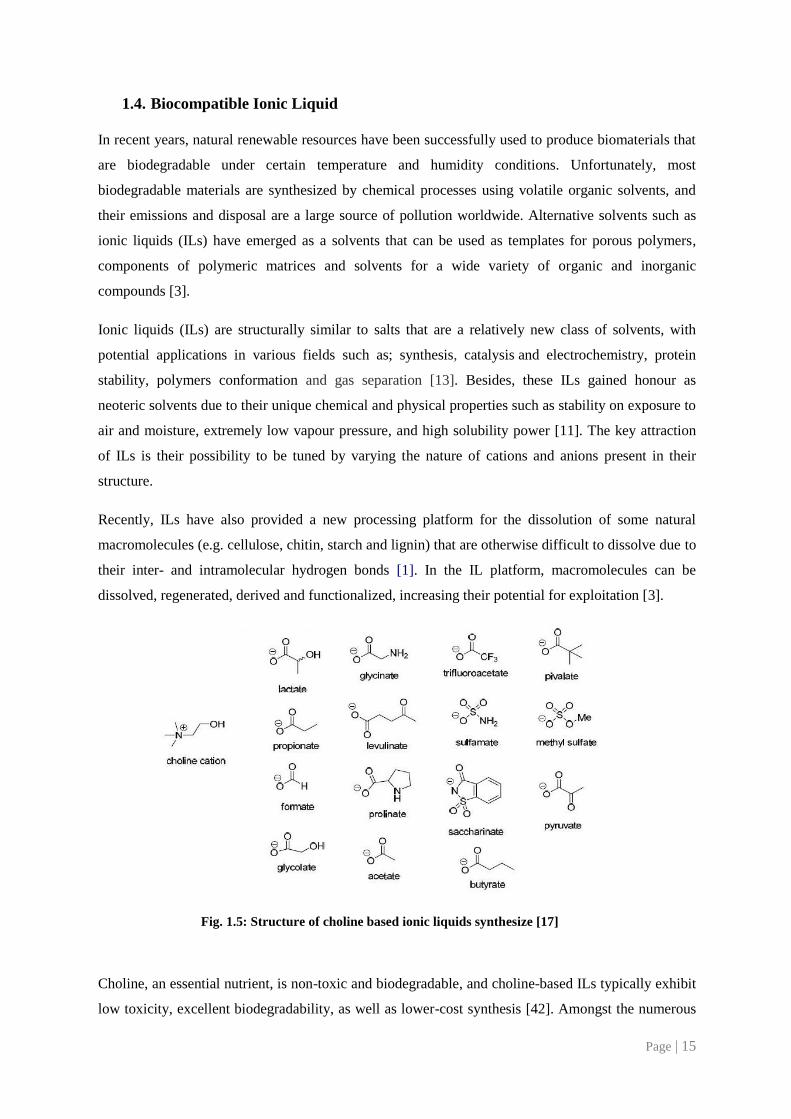
Fig. 1.5: Structure of choline based ionic liquids synthesize [17]
Choline, an essential nutrient, is non-toxic and biodegradable, and choline-based ILs typically exhibit
low toxicity, excellent biodegradability, as well as lower-cost synthesis [42]. Amongst the numerous
Page | 16
possibilities of ionic liquids, we selected the choline acetate due to its biocompatibility which allows
it to be the best candidate for biomedical application, where acetate anions were known due to its
ability in disrupting the inter- and intramolecular hydrogen bonding in the biopolymer [37]. Choline
acetate is also recognized to be much more biodegradable than dialkylimidazolium-based ILs [14].
1.5. Dissolution of CGC in Ionic Liquid
Chitin is relatively difficult to process, and due to its insolubility in aqueous solution, has become less
accessible to biological laboratories. The use of chitin has been limited due its intractability and
insolubility in water and common organic solvents [2] due to its rigid crystalline structure. The
structural similarity of chitin to cellulose has induced many authors to try the solvents used for
cellulose [12]. As in the case of cellulose, the existence of both intra- and intermolecular hydrogen
bonds for chitin in the solid state strongly resists dissolution. But, many of these solvents are
corrosive, degradative and toxic. Hence, they cannot be used in medical application and also rise
difficulties in scaling up for industrial production.
On the other hand, ILs emerged as a good solvent and can dissolve various substances including
biomass i.e. cellulose, lignin and directly wood as well as other renewable polymers such as starch
and chitin [12]. Therefore, the dissolution of chitin in ILs has significantly broadened the number of
tailored derivatives from this polysaccharide, and consequently enhances its potential use in a number
of applications, including in the biomedical field [3]. Using these hydrogels it is possible to develop
scaffolds and membranes for the variety of biomedical applications such as tissue engineering and
wound dressing. During the last few years vigorous research effort in processing chitin utilizing IL’s
has been carried out, summarized in Table 1.2.
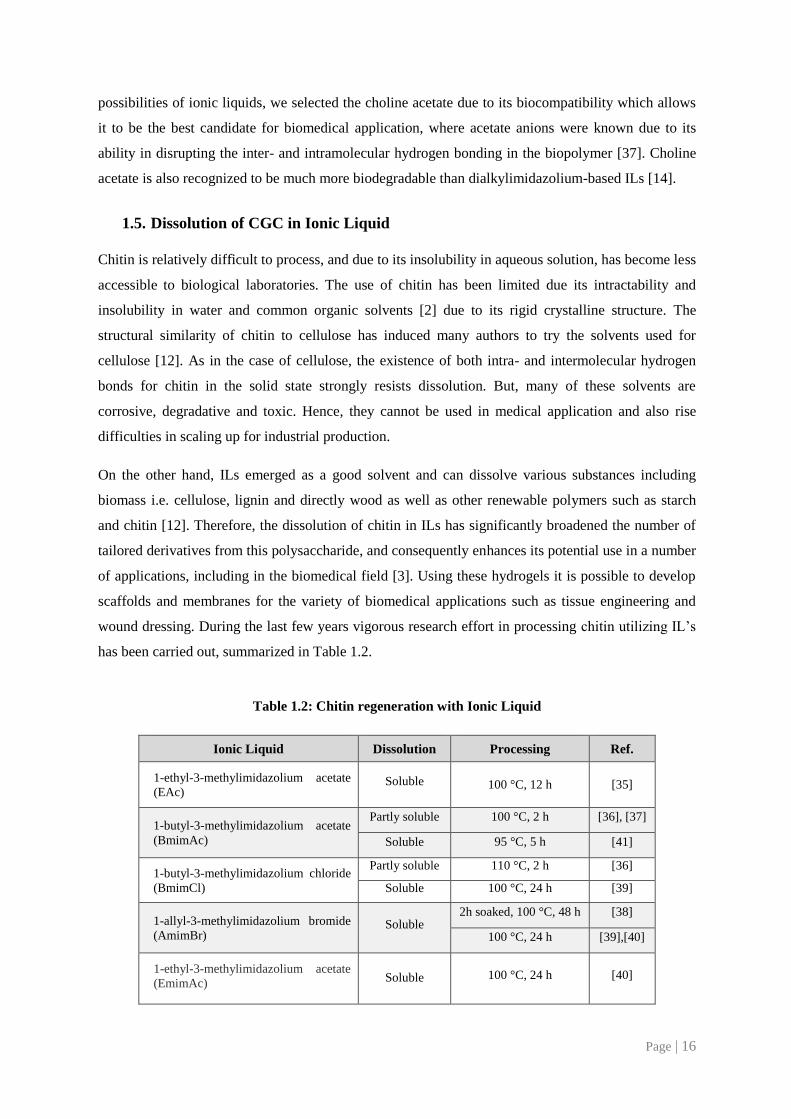
Table 1.2: Chitin regeneration with Ionic Liquid
Ionic Liquid Dissolution Processing Ref.
1-ethyl-3-methylimidazolium acetate
(EAc) Soluble 100 °C, 12 h [35]
1-butyl-3-methylimidazolium acetate
(BmimAc)
Partly soluble 100 °C, 2 h [36], [37]
Soluble 95 °C, 5 h [41]
1-butyl-3-methylimidazolium chloride
(BmimCl)
Partly soluble 110 °C, 2 h [36]
Soluble 100 °C, 24 h [39]
1-allyl-3-methylimidazolium bromide
(AmimBr) Soluble
2h soaked, 100 °C, 48 h [38]
100 °C, 24 h [39],[40]
1-ethyl-3-methylimidazolium acetate
(EmimAc) Soluble 100 °C, 24 h [40]
Page | 17
From Table 1.2, it can be seen that several works for dissolution chitin in IL have been carried out
before. This fact motivates us to develop a research on the dissolution of chitin derivative polymer,
CGC, to use more biocompatible IL such as Choline acetate.
Dissolution of CGC with ionic liquids allows the comprehensive utilization of CGC by combining
two major green chemistry principles: using environmentally preferable solvents and bio-renewable
feed-stocks. Having the same behaviour as chitin, CGC is not easily dissolved in common un-toxic
solvent, e.g. water. No research concerning the influence of IL traces in CGC membranes has been
reported yet.
1.6. Wound Dressing Materials
Wound management and skin repair are an important area of biomedicine and tissue engineering,
wherein intensive research is carried out for the development of advanced wound care systems and
promoting satisfying skin regeneration. Chitin and chitosan polymers are amongst the most promising
materials for wound dressing materials [5]. They are not antigenic and are perfectly biocompatible.
Furthermore, they are biodegradable by enzymatic hydrolysis, for instance in the presence of
lysozymes. Due to their anti-thrombogenic and haemostatic character they can be used in all fields of
medicine [28]. They might be used to prevent the fibrin bits formation in wounds, to support cell
regeneration and to prevent the scar formation.
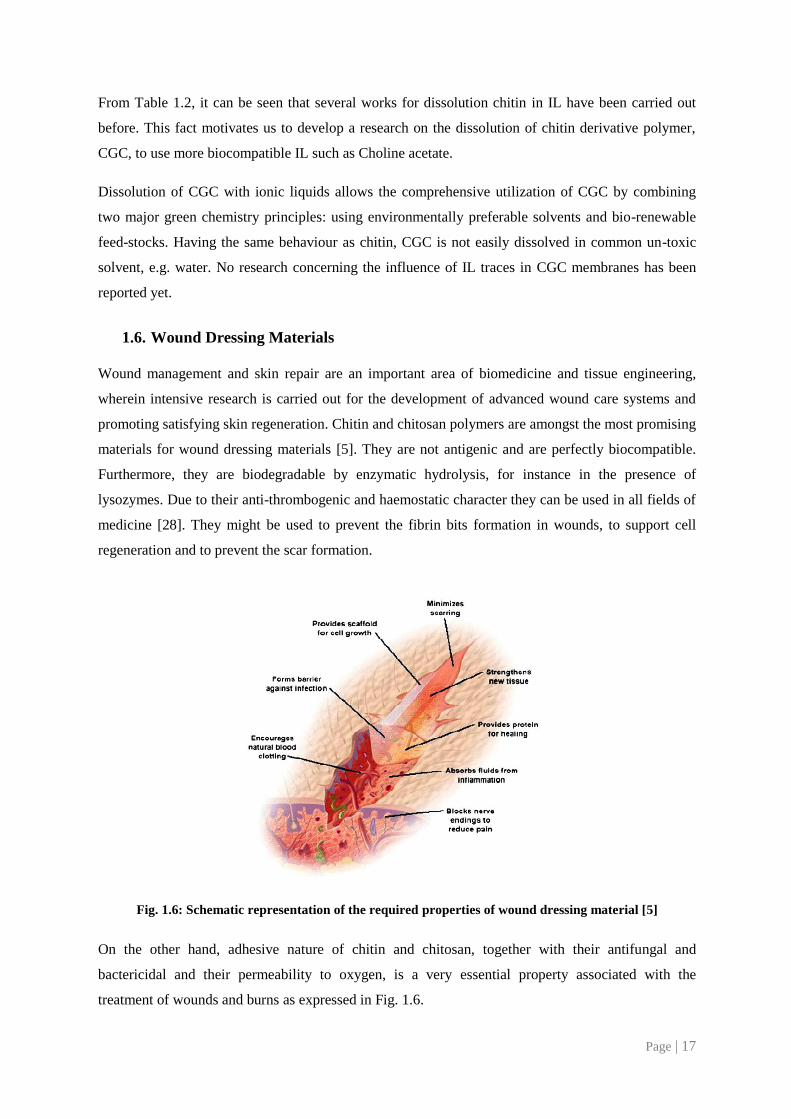
Fig. 1.6: Schematic representation of the required properties of wound dressing material [5]
On the other hand, adhesive nature of chitin and chitosan, together with their antifungal and
bactericidal and their permeability to oxygen, is a very essential property associated with the
treatment of wounds and burns as expressed in Fig. 1.6.
Page | 18
They can support cellular regeneration while protecting tissues from microbial aggressions. Different
derivatives of chitin and chitosan have been prepared for this purpose in the form of fibers, hydrogels,
membranes, sponges and scaffolds [5]. One of promising biomaterials based on chitin is Chitin
Glucan Complex (CGC).
The high biocompatibility of chitin-based films has been demonstrated for human, chick and mouse
fibroblasts by various methods [5, 22].
1.7. Objective of this thesis
This thesis focuses on the development of polymeric structures, namely, hydrogels and films, based
on chitin-glucan complex (CGC) for wound dressing materials. Two different CGC, the commercial
one from KitoZyme and biologically produced CGC from FCT - Universidade Nova de Lisboa, were
characterized in order to develop biocompatible wound dressing materials. The characterization of
these biopolymers would include; metal element content, water and inorganic salts content, sugar
constituents, protein content and thermal properties analysis.
The CGC dissolution in the biocompatible ionic liquid would be studied in term of viscosity and
viscoelasticity in order to understand its influence in the development of the polymeric structure, and
also its thermal stability.
The effect of several non-solvents used during phase inversion method would be investigated directly
by examining the physical and chemical properties of produced films and gels. The analysis would
comprise the thermal stability and sugar composition study of films and gels, and the analysis of total
sugar released during the immersion precipitation.
The best film produced by varying non-solvents, i.e. water, methanol and glycerol, in term of
physical examination would be subjected to further analysis. The characterization in this phase would
involve the mechanical properties in term of puncture resistance and morphological study by SEM
(Scanning Electron Microscopy).
Page | 19
2. Material and Methods
In this work, two different CGC polymers were studied. One is produced by BPEG (Biochemical and
Process Engineering Group) team of FCT-UNL, Portugal, using P. pastoris and the commercial one
is KiOnutrime from KitoZyme SA, Belgium.
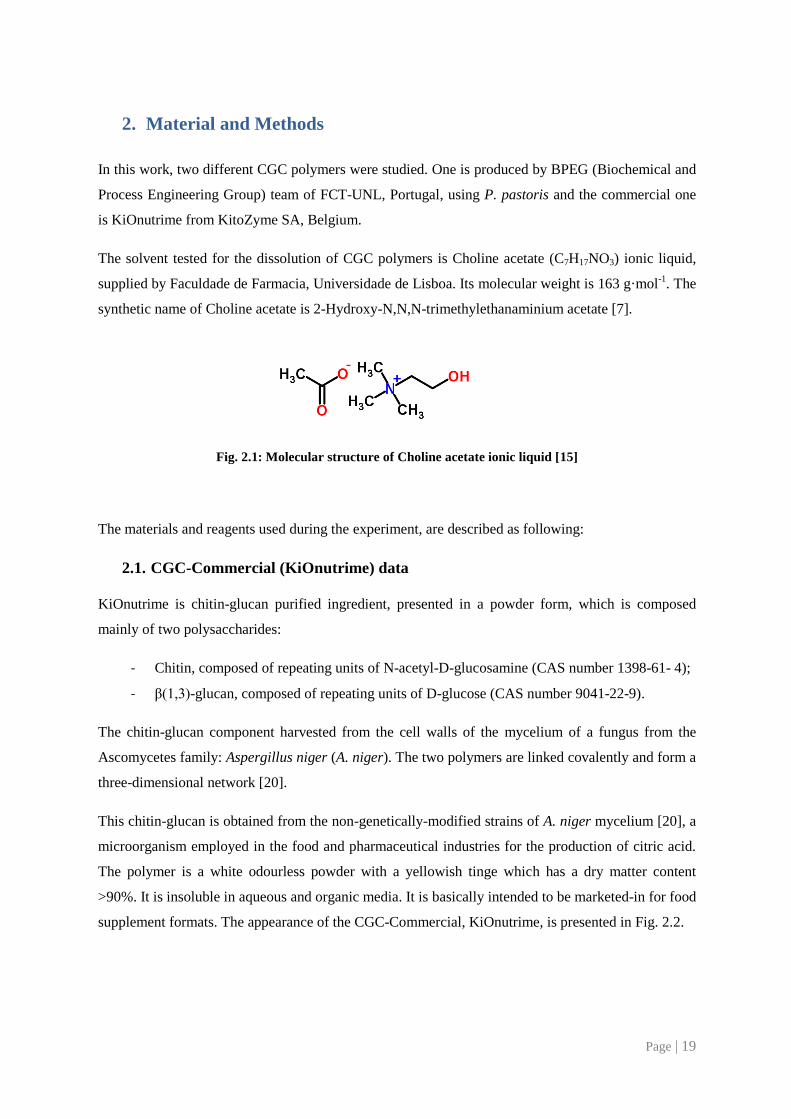
The solvent tested for the dissolution of CGC polymers is Choline acetate (C7H17NO3) ionic liquid,
supplied by Faculdade de Farmacia, Universidade de Lisboa. Its molecular weight is 163 g·mol-1
. The
synthetic name of Choline acetate is 2-Hydroxy-N,N,N-trimethylethanaminium acetate [7].
Fig. 2.1: Molecular structure of Choline acetate ionic liquid [15]
The materials and reagents used during the experiment, are described as following:
2.1. CGC-Commercial (KiOnutrime) data
KiOnutrime is chitin-glucan purified ingredient, presented in a powder form, which is composed
mainly of two polysaccharides:
- Chitin, composed of repeating units of N-acetyl-D-glucosamine (CAS number 1398-61- 4);
- β(1,3)-glucan, composed of repeating units of D-glucose (CAS number 9041-22-9).
The chitin-glucan component harvested from the cell walls of the mycelium of a fungus from the
Ascomycetes family: Aspergillus niger (A. niger). The two polymers are linked covalently and form a
three-dimensional network [20].
This chitin-glucan is obtained from the non-genetically-modified strains of A. niger mycelium [20], a
microorganism employed in the food and pharmaceutical industries for the production of citric acid.
The polymer is a white odourless powder with a yellowish tinge which has a dry matter content
>90%. It is insoluble in aqueous and organic media. It is basically intended to be marketed-in for food
supplement formats. The appearance of the CGC-Commercial, KiOnutrime, is presented in Fig. 2.2.

Page | 20
Fig. 2.2: KiOnutrime®, KitoZyme SA, Belgium.
The brief specification of KiOnutrime® is presented in Appendix I.
2.2. CGC Extraction from P. pastoris biomass
The production of CGC is attained by cultivating P. pastoris yeast in a bioreactor containing crude
glycerol as carbon source. P. pastoris is a methylotrophic yeast commonly used in the pharmaceutical
industry as a host for the production of various recombinant heterologous proteins [8]. CGC is
developed in P. pastoris cell walls to maintain its integrity and, therefore, relatively high amount of
CGC can be extracted after biomass production to directly harvest CGC from the cell biomass.
Inoculum for bioreactor experiments were prepared by incubating P. pastoris strain DSM 70877 in
basal salts medium (BSM) [8], containing crude glycerol. Cultivation was carried out in a 2 L
bioreactor with an initial working volume of 1.4 L. The bioreactor was operated with controlled
temperature and pH of 30°C and 5, respectively. The DO concentration was controlled by the
automatic variation of a stirring rate and supplementation of an air stream with pure oxygen. CGC
content in P. pastoris cells was evaluated along the cultivation assay. Chitin–glucan content in yeast
cells is an indication of its cell age.
For extraction of CGC from the yeast biomass, 1200 mL of culture broth was centrifuged at 8,000
rpm for 15 minutes and the supernatant was discarded. The biomass was washed with water to
remove the sodium azide present in culture broth. CGC was recovered from the yeast cell wall by hot
alkaline extraction. The wet cell pellet was treated with 1000 mL NaOH (EKA, Portugal ) 5 M at
65oC for 2 hours for solubilisation and deproteinization of cell wall components. The alkali-soluble
material was separated and discarded from the alkali-insoluble material (AIM) by centrifugation at
8,000 rpm for 15 minutes. The alkaline extraction was followed by repeated washing steps in
deionized water. Afterwards, the AIM pellet was re-suspended with minimum amount of water and
neutralize with HCl (Sharlau, Spain) 6 M until reach a value of pH 5-6. The AIM was washed several
times again with deionized water to remove residual salts until the conductivity is lower than
Page | 21
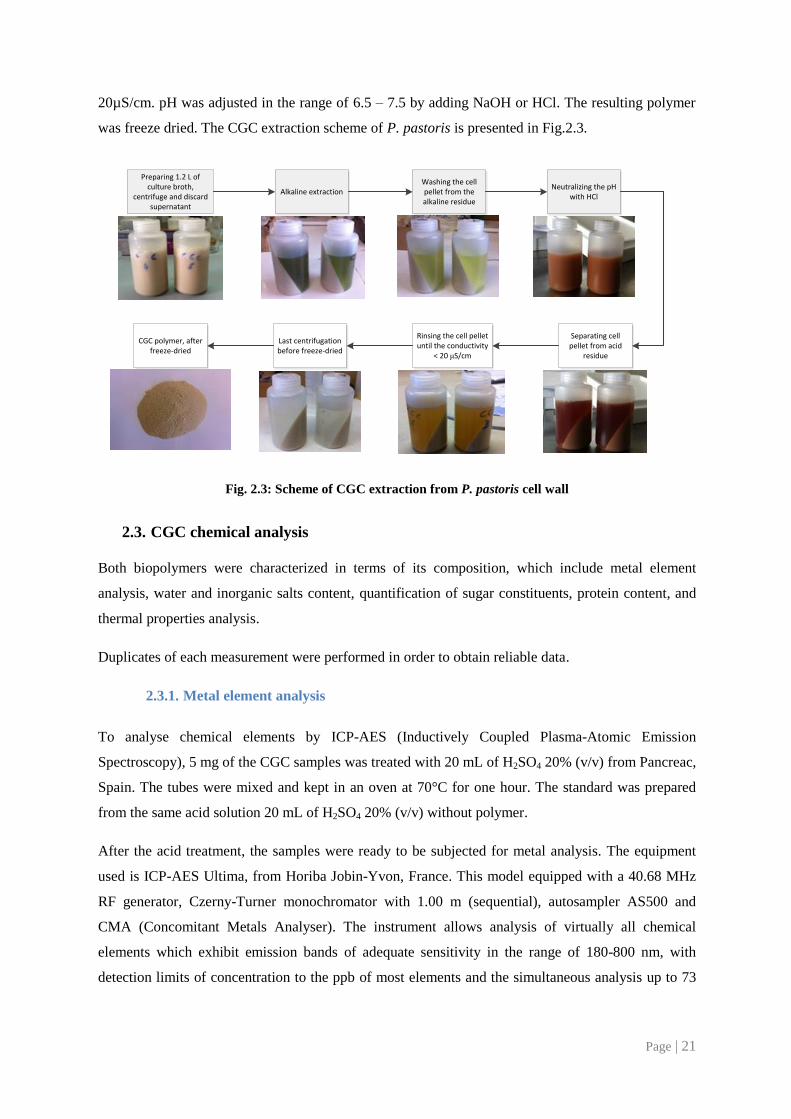
20µS/cm. pH was adjusted in the range of 6.5 – 7.5 by adding NaOH or HCl. The resulting polymer
was freeze dried. The CGC extraction scheme of P. pastoris is presented in Fig.2.3.
Preparing 1.2 L of culture broth,
centrifuge and discard supernatant
Alkaline extractionWashing the cell pellet from the alkaline residue
Neutralizing the pH with HCl
Separating cell pellet from acid
residue
Rinsing the cell pellet until the conductivity
< 20 μS/cm
Last centrifugation before freeze-dried
CGC polymer, after freeze-dried
Fig. 2.3: Scheme of CGC extraction from P. pastoris cell wall
2.3. CGC chemical analysis
Both biopolymers were characterized in terms of its composition, which include metal element
analysis, water and inorganic salts content, quantification of sugar constituents, protein content, and
thermal properties analysis.
Duplicates of each measurement were performed in order to obtain reliable data.
2.3.1. Metal element analysis
To analyse chemical elements by ICP-AES (Inductively Coupled Plasma-Atomic Emission
Spectroscopy), 5 mg of the CGC samples was treated with 20 mL of H2SO4 20% (v/v) from Pancreac,
Spain. The tubes were mixed and kept in an oven at 70°C for one hour. The standard was prepared
from the same acid solution 20 mL of H2SO4 20% (v/v) without polymer.
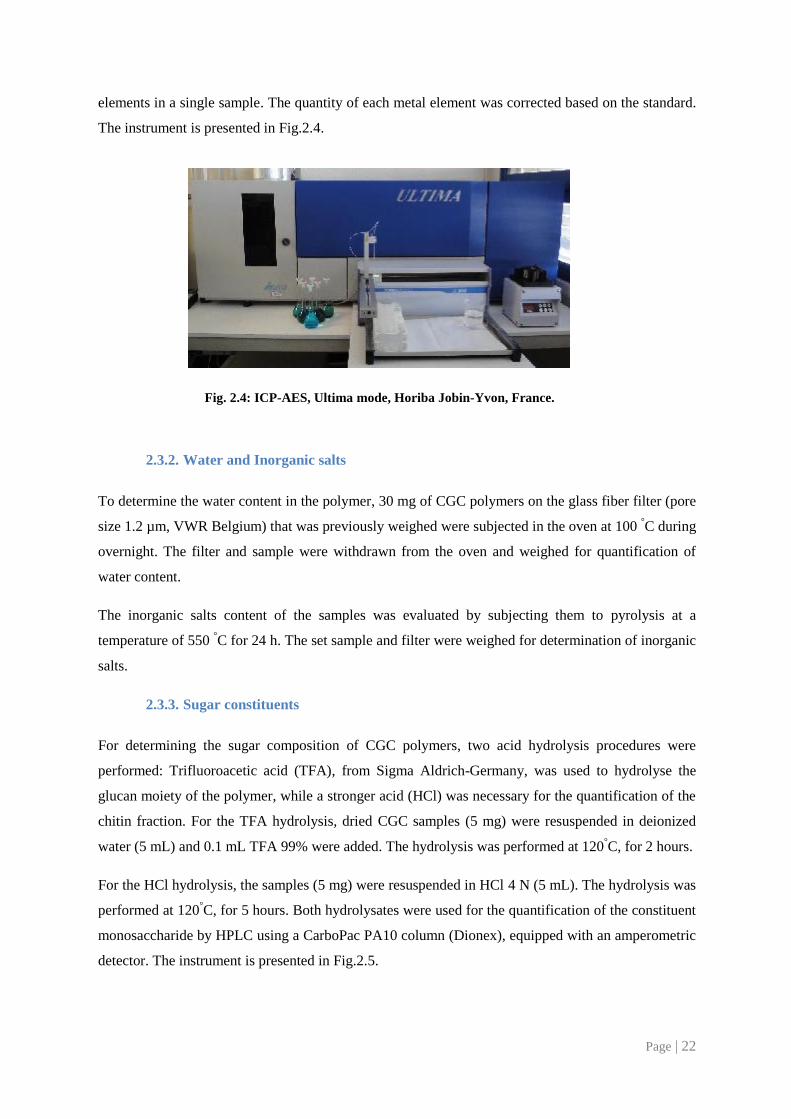
After the acid treatment, the samples were ready to be subjected for metal analysis. The equipment
used is ICP-AES Ultima, from Horiba Jobin-Yvon, France. This model equipped with a 40.68 MHz
RF generator, Czerny-Turner monochromator with 1.00 m (sequential), autosampler AS500 and
CMA (Concomitant Metals Analyser). The instrument allows analysis of virtually all chemical
elements which exhibit emission bands of adequate sensitivity in the range of 180-800 nm, with
detection limits of concentration to the ppb of most elements and the simultaneous analysis up to 73
Page | 22
elements in a single sample. The quantity of each metal element was corrected based on the standard.
The instrument is presented in Fig.2.4.
Fig. 2.4: ICP-AES, Ultima mode, Horiba Jobin-Yvon, France.
2.3.2. Water and Inorganic salts
To determine the water content in the polymer, 30 mg of CGC polymers on the glass fiber filter (pore
size 1.2 µm, VWR Belgium) that was previously weighed were subjected in the oven at 100 °C during
overnight. The filter and sample were withdrawn from the oven and weighed for quantification of
water content.
The inorganic salts content of the samples was evaluated by subjecting them to pyrolysis at a
temperature of 550 °C for 24 h. The set sample and filter were weighed for determination of inorganic
salts.
2.3.3. Sugar constituents
For determining the sugar composition of CGC polymers, two acid hydrolysis procedures were
performed: Trifluoroacetic acid (TFA), from Sigma Aldrich-Germany, was used to hydrolyse the
glucan moiety of the polymer, while a stronger acid (HCl) was necessary for the quantification of the
chitin fraction. For the TFA hydrolysis, dried CGC samples (5 mg) were resuspended in deionized
water (5 mL) and 0.1 mL TFA 99% were added. The hydrolysis was performed at 120°C, for 2 hours.
For the HCl hydrolysis, the samples (5 mg) were resuspended in HCl 4 N (5 mL). The hydrolysis was
performed at 120°C, for 5 hours. Both hydrolysates were used for the quantification of the constituent
monosaccharide by HPLC using a CarboPac PA10 column (Dionex), equipped with an amperometric
detector. The instrument is presented in Fig.2.5.
Page | 23
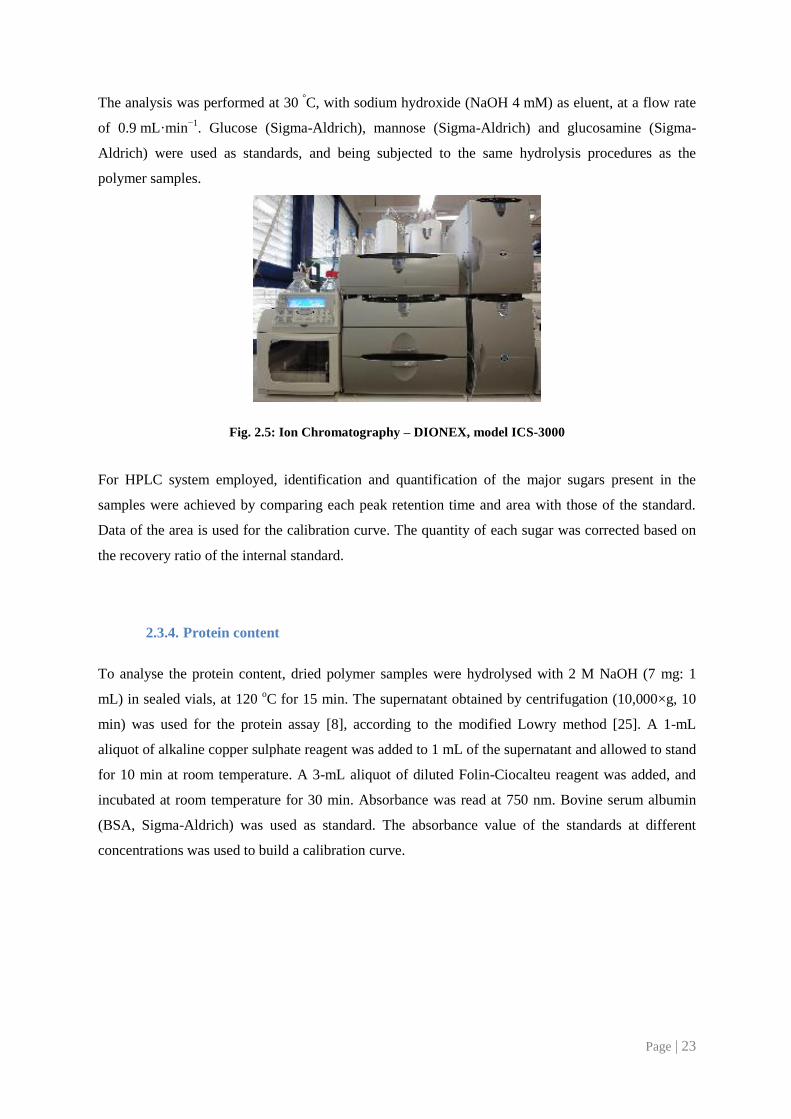
The analysis was performed at 30 °C, with sodium hydroxide (NaOH 4 mM) as eluent, at a flow rate
of 0.9 mL·min−1
. Glucose (Sigma-Aldrich), mannose (Sigma-Aldrich) and glucosamine (Sigma-
Aldrich) were used as standards, and being subjected to the same hydrolysis procedures as the
polymer samples.
Fig. 2.5: Ion Chromatography – DIONEX, model ICS-3000
For HPLC system employed, identification and quantification of the major sugars present in the
samples were achieved by comparing each peak retention time and area with those of the standard.
Data of the area is used for the calibration curve. The quantity of each sugar was corrected based on
the recovery ratio of the internal standard.
2.3.4. Protein content
To analyse the protein content, dried polymer samples were hydrolysed with 2 M NaOH (7 mg: 1
mL) in sealed vials, at 120 oC for 15 min. The supernatant obtained by centrifugation (10,000×g, 10
min) was used for the protein assay [8], according to the modified Lowry method [25]. A 1-mL
aliquot of alkaline copper sulphate reagent was added to 1 mL of the supernatant and allowed to stand
for 10 min at room temperature. A 3-mL aliquot of diluted Folin-Ciocalteu reagent was added, and
incubated at room temperature for 30 min. Absorbance was read at 750 nm. Bovine serum albumin
(BSA, Sigma-Aldrich) was used as standard. The absorbance value of the standards at different
concentrations was used to build a calibration curve.
Page | 24
Fig. 2.6: Spectrophotometer - Thermo Spectronic, Heλios α, Germany
The spectrophotometer used is Thermo Spectronic, Heλios α, Germany. Fig.2.6 represents the
spectrophotometer utilized for the measurements of absorbance.
2.4. Thermal Properties
To understand the thermal properties and stability of CGC polymers, a differential scanning
calorimeter (Setaram, model DSC 131, France) is utilized at a scanning rate for both heating and
cooling of 10°C·min−1
in the temperature range -130°C to 100°C and 30°C to 400°C. The sample was
placed and hermetically sealed in an aluminium crucible while an empty crucible was used as the
reference. The sample was heated under a nitrogen stream.
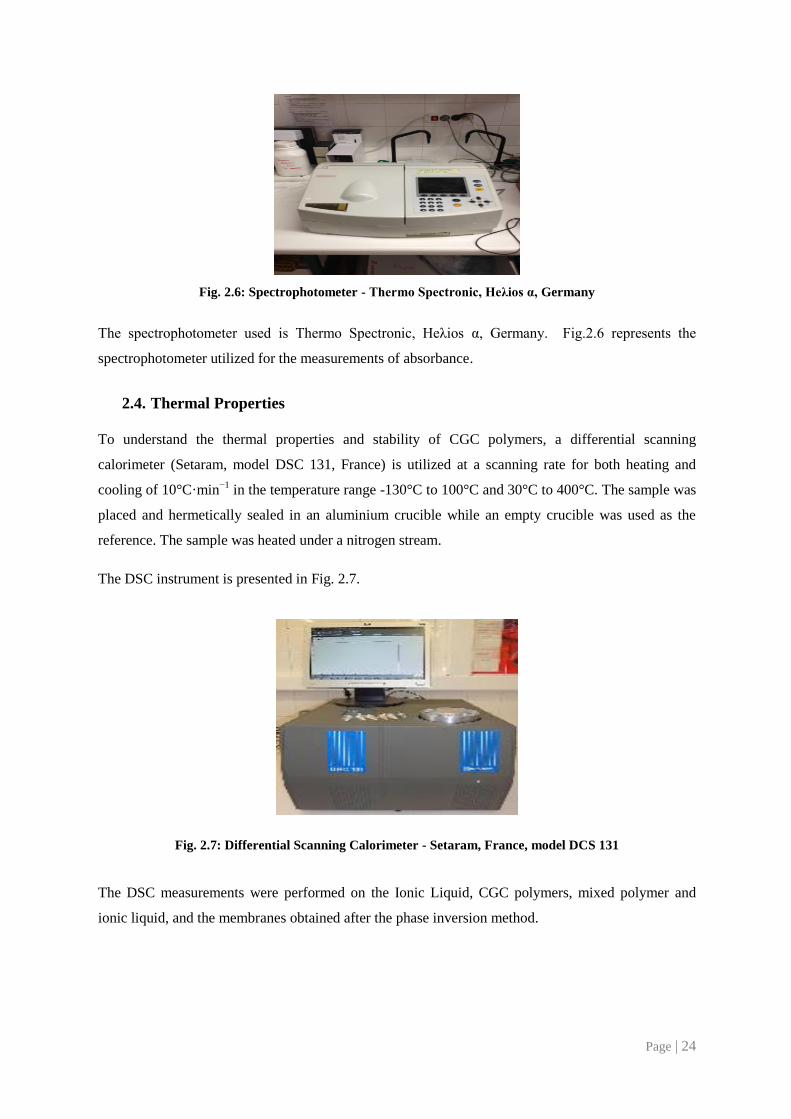
The DSC instrument is presented in Fig. 2.7.
Fig. 2.7: Differential Scanning Calorimeter - Setaram, France, model DCS 131
The DSC measurements were performed on the Ionic Liquid, CGC polymers, mixed polymer and
ionic liquid, and the membranes obtained after the phase inversion method.

Page | 25
2.5. Film preparation
To dissolve the polymer for film preparation, CGC powder (5 wt. %) was added in Choline Acetate in
a 50 mL beaker glass under continuous agitation (200 rpm) using a magnetic stirrer. During
dissolution, the temperature of the solution was well controlled in the oil bath at 80 oC for FCT-CGC
and 110 oC for the commercial CGC for 24 h.
The beaker glass was placed in the thermostat oil bath. The sample was heated very slowly with
continuous stirring. The temperature control of the water bath was governed by using a digital
thermo-regulator connected to the heating magnetic stirrer from Velp Scientific, Italy. The dissolution
process is depicted in Fig. 2.8.
Fig. 2.8: Dissolution of CGC polymers
The CGC solution was later casted onto a metal plate and instantly immersed in a coagulation bath at
room temperature for 24 h. The compositions of non-solvent used in coagulation bath were;
1. Demineralized water
2. 50% (v/v) Methanol (MeOH) solution
3. 30% (v/v) Glycerol solution
The membranes were dried in an open space at an ambient room temperature 26±2°C and relative
humidity of 35±1% for 72 h, and 5-7 days if desiccator was used.
Controlled evaporation was done by using an empty desiccator. The controlled evaporation and
humidity was done by using 200 g of NaBr salt and 80 g of H2O (demineralised water) at the
temperature of 25°C, in order to create 57.7% of relative humidity inside the desiccator.
Page | 26
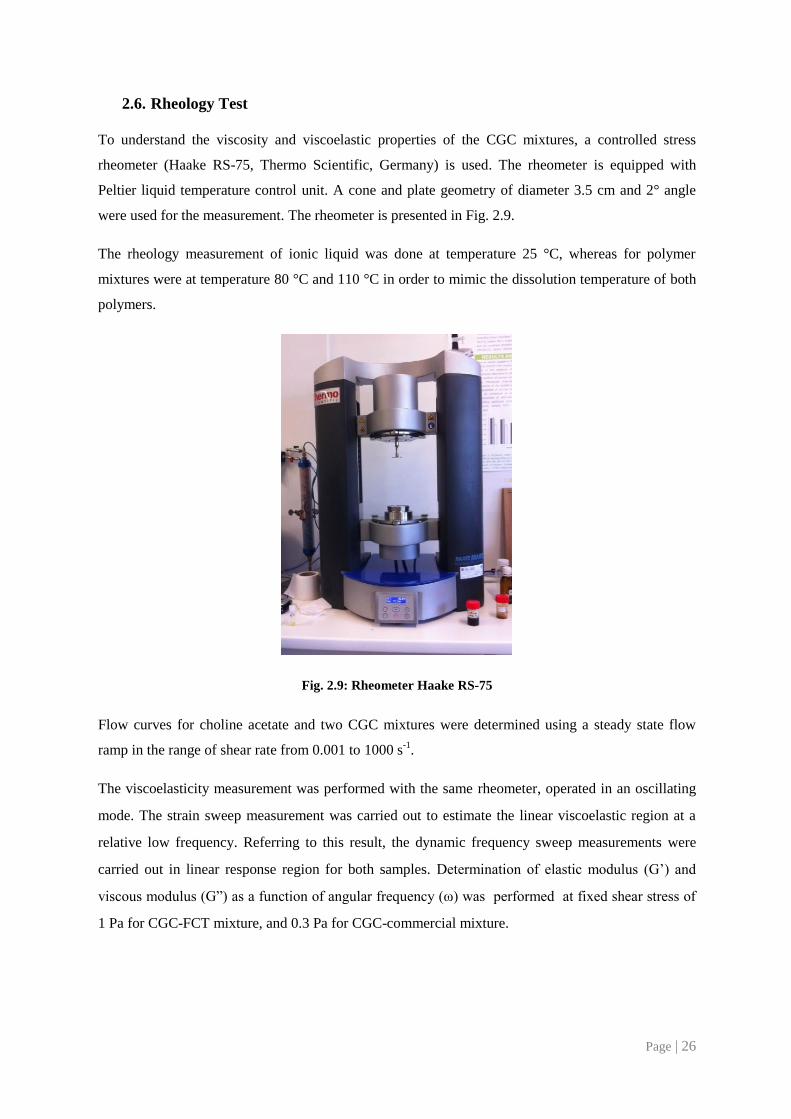
2.6. Rheology Test
To understand the viscosity and viscoelastic properties of the CGC mixtures, a controlled stress
rheometer (Haake RS-75, Thermo Scientific, Germany) is used. The rheometer is equipped with
Peltier liquid temperature control unit. A cone and plate geometry of diameter 3.5 cm and 2° angle
were used for the measurement. The rheometer is presented in Fig. 2.9.
The rheology measurement of ionic liquid was done at temperature 25 °C, whereas for polymer
mixtures were at temperature 80 °C and 110 °C in order to mimic the dissolution temperature of both
polymers.
Fig. 2.9: Rheometer Haake RS-75
Flow curves for choline acetate and two CGC mixtures were determined using a steady state flow
ramp in the range of shear rate from 0.001 to 1000 s-1
.
The viscoelasticity measurement was performed with the same rheometer, operated in an oscillating
mode. The strain sweep measurement was carried out to estimate the linear viscoelastic region at a
relative low frequency. Referring to this result, the dynamic frequency sweep measurements were
carried out in linear response region for both samples. Determination of elastic modulus (G’) and
viscous modulus (G”) as a function of angular frequency (ω) was performed at fixed shear stress of
1 Pa for CGC-FCT mixture, and 0.3 Pa for CGC-commercial mixture.
Page | 27
2.7. Sugar content in coagulation bath
For the analysis of total sugar in the coagulation bath, Dubois method was employed. This method is
mainly useful for the determination of small quantities of sugars.
Total sugar content (CHO) was analysed using the phenol-sulphuric method modified to be measured
at 490 nm using an absorbance spectrophotometer (Thermo Spectronic, Heλios α, Germany) as
presented in Fig. 2.6. Simple sugars, oligosaccharides, polysaccharides, and their derivatives,
including the methyl ethers with free or potentially free reducing groups, give an orange-yellow
colour when treated with phenol and concentrated sulphuric acid [18]. The reaction is sensitive and
the colour is stable.
0.5 mL of sample was mixed with 0.5 mL Phenol (5% wt.) and 2.5 mL of concentrated H2SO4. After
10 minutes, each samples were mix in a cortex-mixer for few seconds. The samples were placed in a
dark place for 30 minutes prior to measurement at 490 nm using an absorbance spectrophotometer.
Glucose (Sigma Aldrich) was used as standard. The absorbance value of the standards at different
concentrations was used to build a calibration curve.
2.8. Membrane Characterization
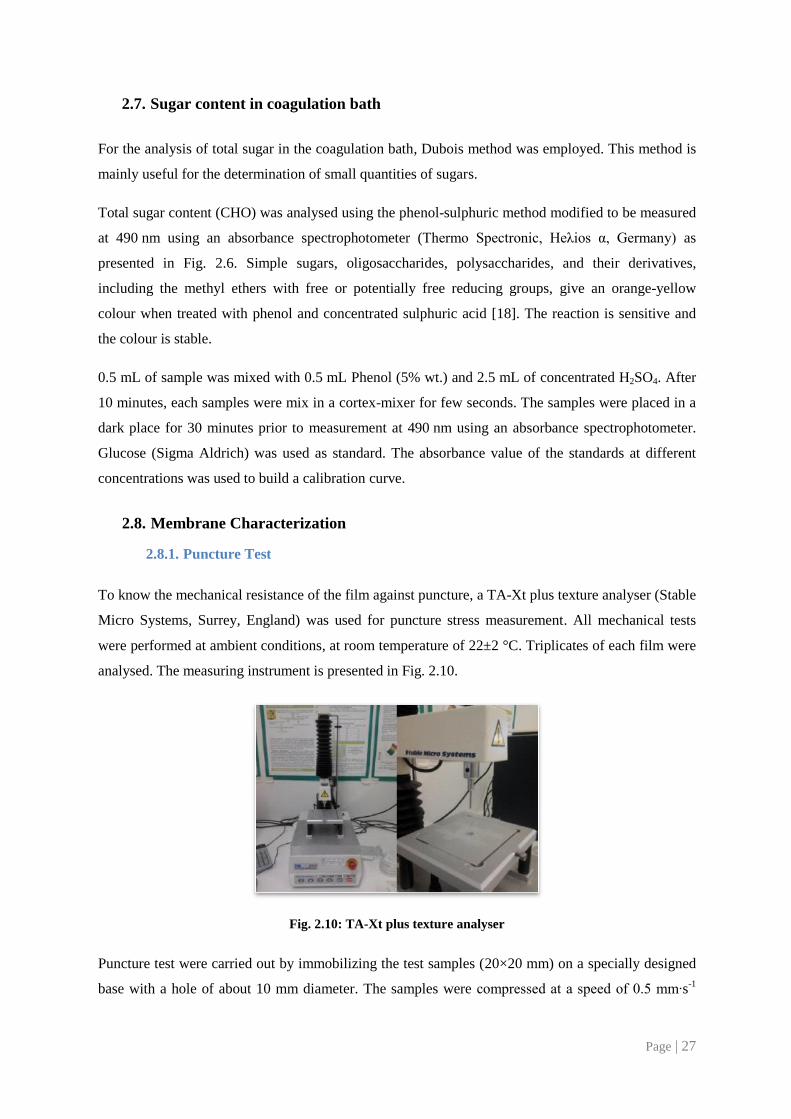
2.8.1. Puncture Test
To know the mechanical resistance of the film against puncture, a TA-Xt plus texture analyser (Stable
Micro Systems, Surrey, England) was used for puncture stress measurement. All mechanical tests
were performed at ambient conditions, at room temperature of 22±2 °C. Triplicates of each film were
analysed. The measuring instrument is presented in Fig. 2.10.
Fig. 2.10: TA-Xt plus texture analyser
Puncture test were carried out by immobilizing the test samples (20×20 mm) on a specially designed
base with a hole of about 10 mm diameter. The samples were compressed at a speed of 0.5 mm∙s-1
Page | 28
and punctured through the hole with a cylindrical probe (2 mm diameter). The puncture stress (τP)
was expressed as the ratio of the puncture force and the probe contact area as per equation below (Eq.
2.1).
(Eq. 2.1)
Where τP is a puncture stress in Pa; FP is the force to the films in N; and AP is the probe cross
sectional area in m2. This test allows the determination of the strain by the following equation;
(Eq. 2.2)
Where εP is a puncture elongation; Lf is the final length in meter; and Li is the initial length in meter.
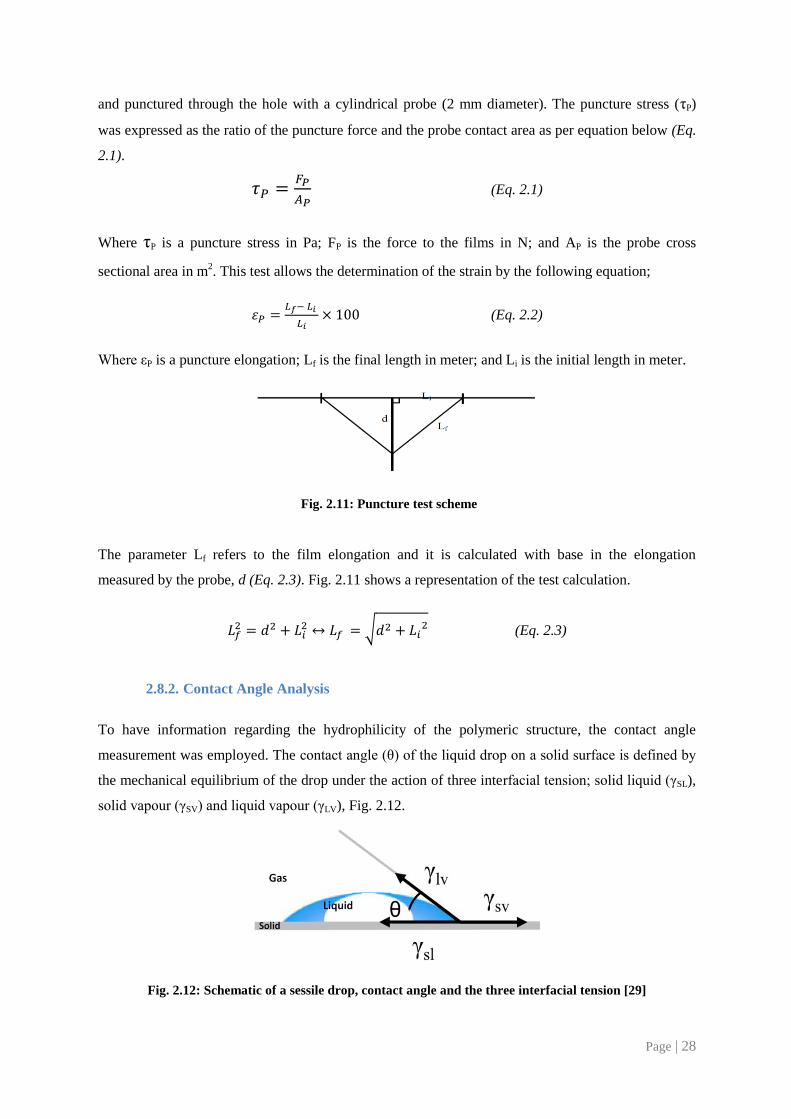
Fig. 2.11: Puncture test scheme
The parameter Lf refers to the film elongation and it is calculated with base in the elongation
measured by the probe, d (Eq. 2.3). Fig. 2.11 shows a representation of the test calculation.
√
(Eq. 2.3)
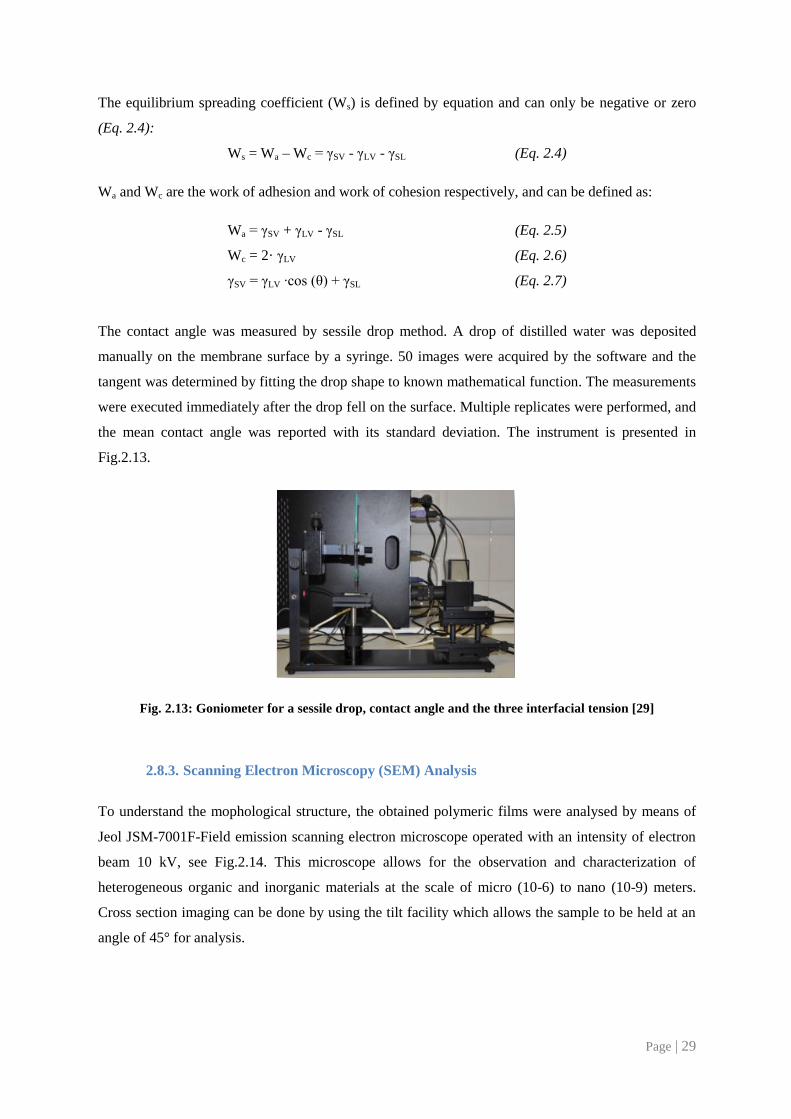
2.8.2. Contact Angle Analysis
To have information regarding the hydrophilicity of the polymeric structure, the contact angle
measurement was employed. The contact angle (θ) of the liquid drop on a solid surface is defined by
the mechanical equilibrium of the drop under the action of three interfacial tension; solid liquid (γSL),
solid vapour (γSV) and liquid vapour (γLV), Fig. 2.12.
Fig. 2.12: Schematic of a sessile drop, contact angle and the three interfacial tension [29]
Page | 29
The equilibrium spreading coefficient (Ws) is defined by equation and can only be negative or zero
(Eq. 2.4):
Ws = Wa – Wc = γSV - γLV - γSL (Eq. 2.4)
Wa and Wc are the work of adhesion and work of cohesion respectively, and can be defined as:
Wa = γSV + γLV - γSL (Eq. 2.5)
Wc = 2· γLV (Eq. 2.6)
γSV = γLV ∙cos (θ) + γSL (Eq. 2.7)
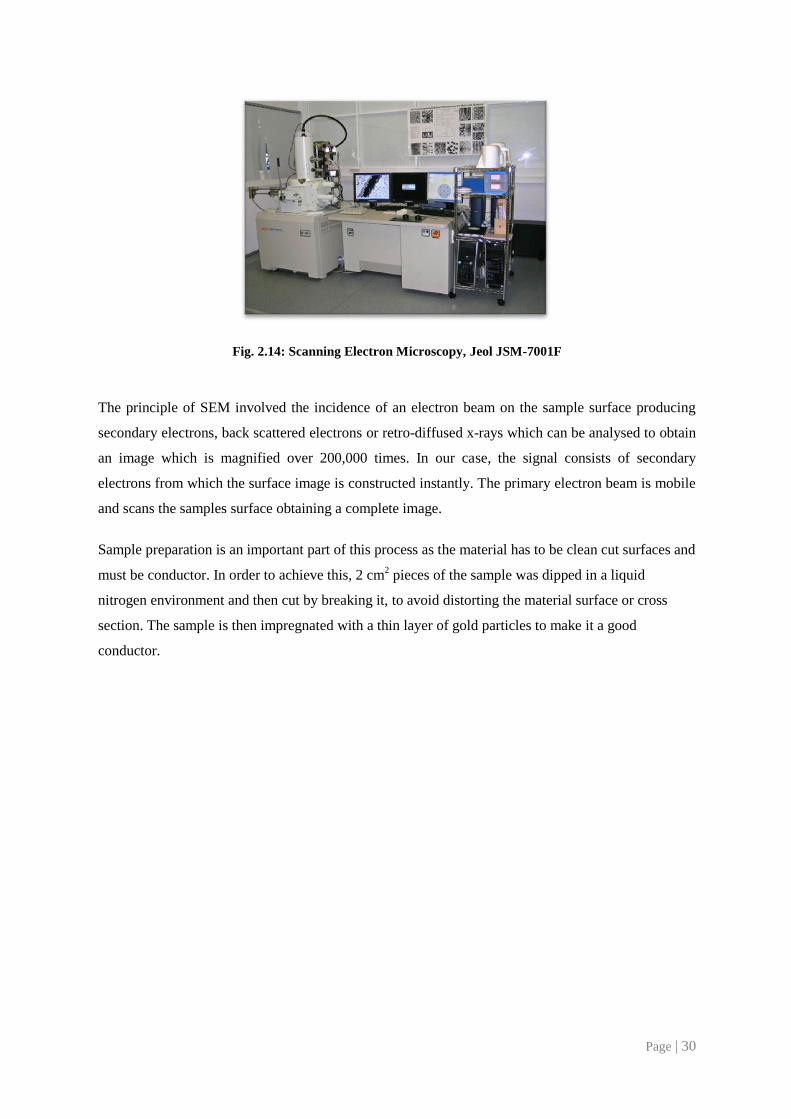
The contact angle was measured by sessile drop method. A drop of distilled water was deposited
manually on the membrane surface by a syringe. 50 images were acquired by the software and the
tangent was determined by fitting the drop shape to known mathematical function. The measurements
were executed immediately after the drop fell on the surface. Multiple replicates were performed, and
the mean contact angle was reported with its standard deviation. The instrument is presented in
Fig.2.13.
Fig. 2.13: Goniometer for a sessile drop, contact angle and the three interfacial tension [29]
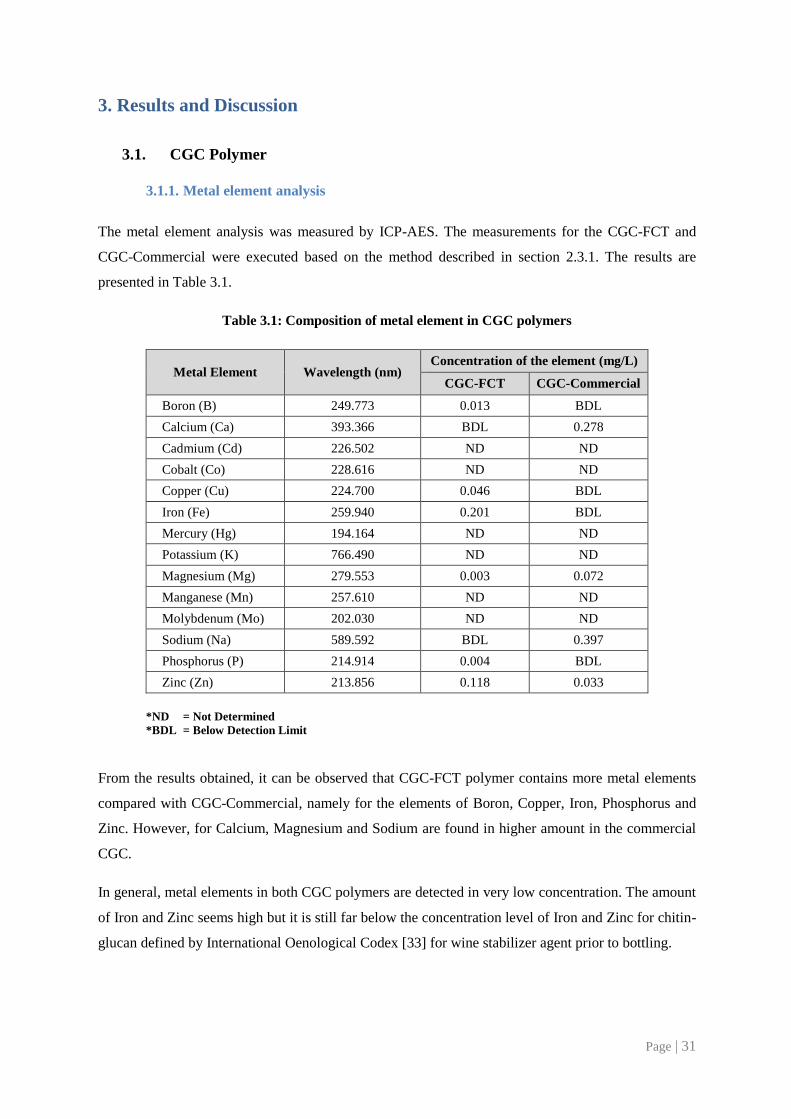
2.8.3. Scanning Electron Microscopy (SEM) Analysis
To understand the mophological structure, the obtained polymeric films were analysed by means of
Jeol JSM-7001F-Field emission scanning electron microscope operated with an intensity of electron
beam 10 kV, see Fig.2.14. This microscope allows for the observation and characterization of
heterogeneous organic and inorganic materials at the scale of micro (10-6) to nano (10-9) meters.
Cross section imaging can be done by using the tilt facility which allows the sample to be held at an
angle of 45° for analysis.
Page | 30
Fig. 2.14: Scanning Electron Microscopy, Jeol JSM-7001F
The principle of SEM involved the incidence of an electron beam on the sample surface producing
secondary electrons, back scattered electrons or retro-diffused x-rays which can be analysed to obtain
an image which is magnified over 200,000 times. In our case, the signal consists of secondary
electrons from which the surface image is constructed instantly. The primary electron beam is mobile
and scans the samples surface obtaining a complete image.
Sample preparation is an important part of this process as the material has to be clean cut surfaces and
must be conductor. In order to achieve this, 2 cm2 pieces of the sample was dipped in a liquid
nitrogen environment and then cut by breaking it, to avoid distorting the material surface or cross
section. The sample is then impregnated with a thin layer of gold particles to make it a good
conductor.
Page | 31
3. Results and Discussion
3.1. CGC Polymer
3.1.1. Metal element analysis
The metal element analysis was measured by ICP-AES. The measurements for the CGC-FCT and
CGC-Commercial were executed based on the method described in section 2.3.1. The results are
presented in Table 3.1.
Table 3.1: Composition of metal element in CGC polymers
Metal Element Wavelength (nm) Concentration of the element (mg/L)
CGC-FCT CGC-Commercial
Boron (B) 249.773 0.013 BDL
Calcium (Ca) 393.366 BDL 0.278
Cadmium (Cd) 226.502 ND ND
Cobalt (Co) 228.616 ND ND
Copper (Cu) 224.700 0.046 BDL
Iron (Fe) 259.940 0.201 BDL
Mercury (Hg) 194.164 ND ND
Potassium (K) 766.490 ND ND
Magnesium (Mg) 279.553 0.003 0.072
Manganese (Mn) 257.610 ND ND
Molybdenum (Mo) 202.030 ND ND
Sodium (Na) 589.592 BDL 0.397
Phosphorus (P) 214.914 0.004 BDL
Zinc (Zn) 213.856 0.118 0.033
*ND = Not Determined
*BDL = Below Detection Limit
From the results obtained, it can be observed that CGC-FCT polymer contains more metal elements
compared with CGC-Commercial, namely for the elements of Boron, Copper, Iron, Phosphorus and
Zinc. However, for Calcium, Magnesium and Sodium are found in higher amount in the commercial
CGC.
In general, metal elements in both CGC polymers are detected in very low concentration. The amount
of Iron and Zinc seems high but it is still far below the concentration level of Iron and Zinc for chitin-
glucan defined by International Oenological Codex [33] for wine stabilizer agent prior to bottling.
Page | 32
The result of our measurement is below the reported value by European Food Safety Authority
(EFSA) in literature [20] and in the specification product from Kitozyme (Appendix I). This
discrepancy could be addressed to the sensitivity and detection limit of the instruments. It is known
that the ICP-MS is more sensitive and accurate compared to ICP-AES [26].
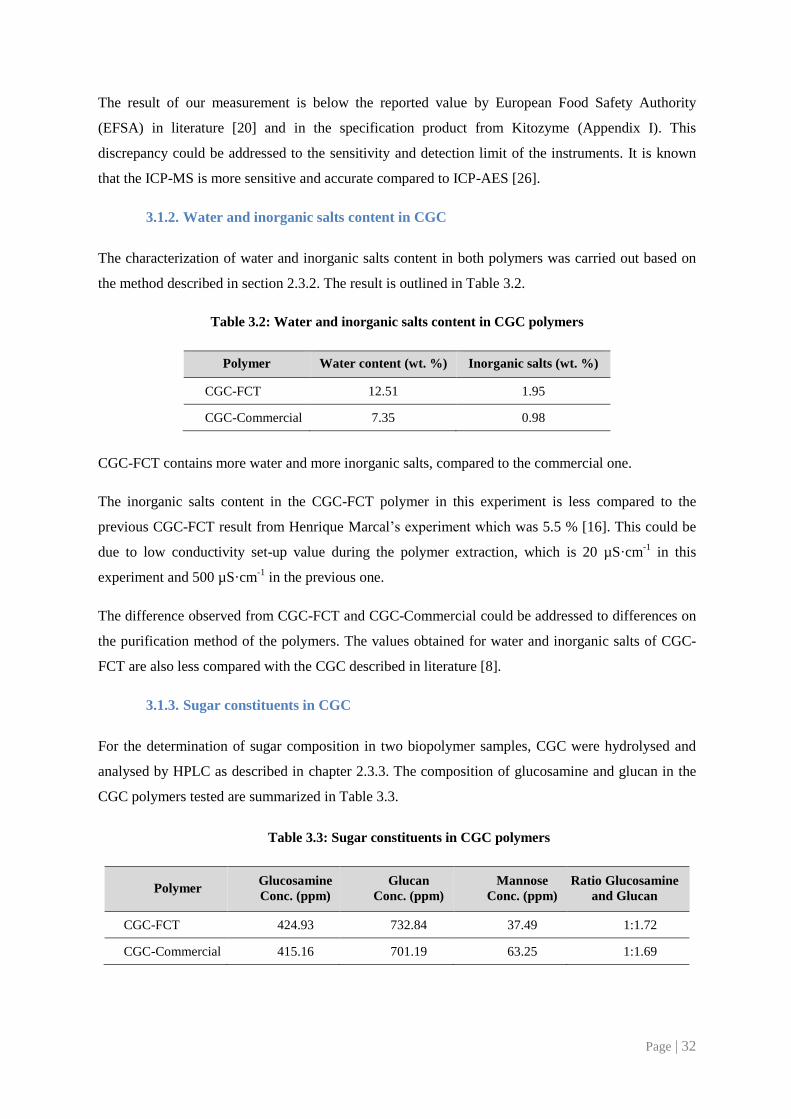
3.1.2. Water and inorganic salts content in CGC
The characterization of water and inorganic salts content in both polymers was carried out based on
the method described in section 2.3.2. The result is outlined in Table 3.2.
Table 3.2: Water and inorganic salts content in CGC polymers
Polymer Water content (wt. %) Inorganic salts (wt. %)
CGC-FCT 12.51 1.95
CGC-Commercial 7.35 0.98
CGC-FCT contains more water and more inorganic salts, compared to the commercial one.
The inorganic salts content in the CGC-FCT polymer in this experiment is less compared to the
previous CGC-FCT result from Henrique Marcal’s experiment which was 5.5 % [16]. This could be
due to low conductivity set-up value during the polymer extraction, which is 20 µS·cm-1
in this
experiment and 500 µS·cm-1
in the previous one.
The difference observed from CGC-FCT and CGC-Commercial could be addressed to differences on
the purification method of the polymers. The values obtained for water and inorganic salts of CGC-
FCT are also less compared with the CGC described in literature [8].
3.1.3. Sugar constituents in CGC
For the determination of sugar composition in two biopolymer samples, CGC were hydrolysed and
analysed by HPLC as described in chapter 2.3.3. The composition of glucosamine and glucan in the
CGC polymers tested are summarized in Table 3.3.
Table 3.3: Sugar constituents in CGC polymers
Polymer Glucosamine
Conc. (ppm)
Glucan
Conc. (ppm)
Mannose
Conc. (ppm)
Ratio Glucosamine
and Glucan
CGC-FCT 424.93 732.84 37.49 1:1.72
CGC-Commercial 415.16 701.19 63.25 1:1.69
Page | 33
The ratio of chitin and glucan amount in the polymers is represented by the ratio of glucosamine and
glucan. The result shows that there is a concurrency between two polymers in term of the ratio of
chitin and glucan which is 1:1.72 for CGC-FCT and 1:1.69 for CGC-Commercial. The result of
CGC-FCT is different with literature [8]. This difference could be addressed to the dissimilarity in
feeding and operating strategy of the bioreactor during the P. pastoris production.
The result of sugar constituents in CGC-Commercial also shows a congruity with the result obtained
by the literature [20]. The amount of chitin in chitin-glucan copolymers is defined by the organism
from which it is extracted. In the case of mycelium of Aspergillus niger used in the method according
to the invention by Kitozyme, and chitin-glucan copolymers extracted from the mycelium of A. niger
comprise between 30 and 50% (w/w) of chitin and between 50 to 70% of β-glucan [20].
The calibration curve of the concentration of sugar as a function of absorbance of the standards by
HPLC is presented in Appendix II.
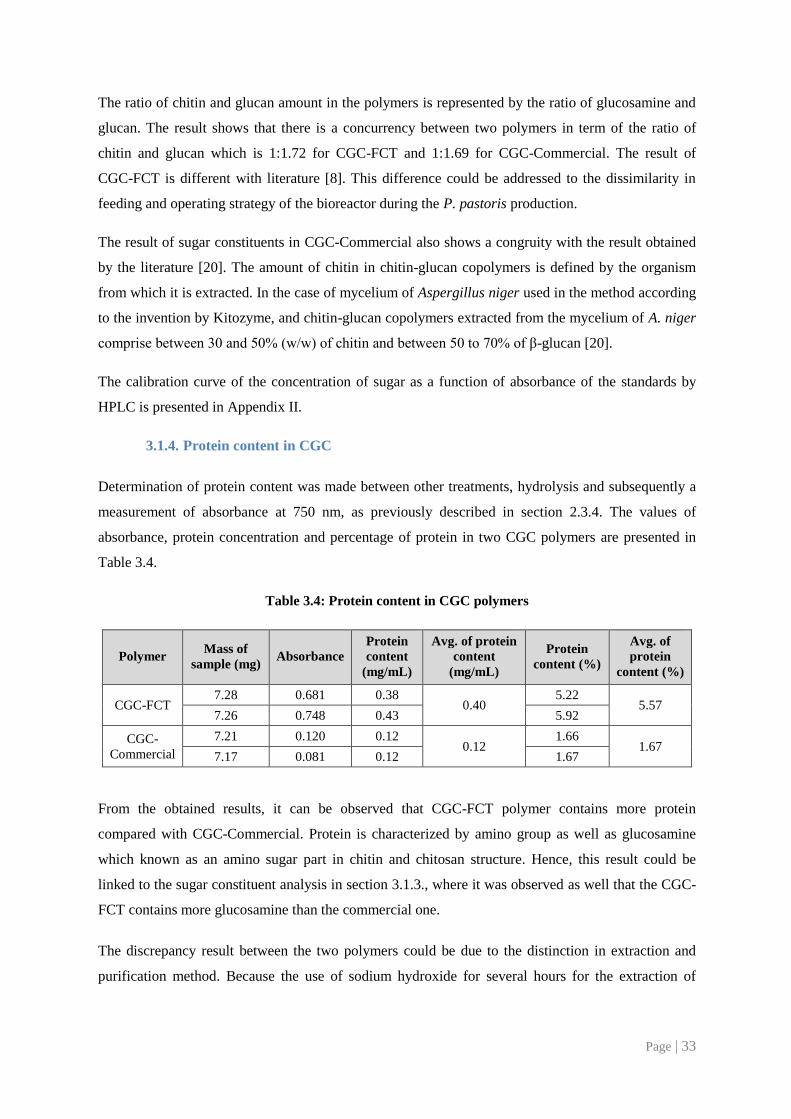
3.1.4. Protein content in CGC
Determination of protein content was made between other treatments, hydrolysis and subsequently a
measurement of absorbance at 750 nm, as previously described in section 2.3.4. The values of
absorbance, protein concentration and percentage of protein in two CGC polymers are presented in
Table 3.4.
Table 3.4: Protein content in CGC polymers
Polymer Mass of
sample (mg) Absorbance
Protein
content
(mg/mL)
Avg. of protein
content
(mg/mL)
Protein
content (%)
Avg. of
protein
content (%)
CGC-FCT 7.28 0.681 0.38
0.40 5.22
5.57 7.26 0.748 0.43 5.92
CGC-
Commercial
7.21 0.120 0.12 0.12
1.66 1.67
7.17 0.081 0.12 1.67
From the obtained results, it can be observed that CGC-FCT polymer contains more protein
compared with CGC-Commercial. Protein is characterized by amino group as well as glucosamine
which known as an amino sugar part in chitin and chitosan structure. Hence, this result could be
linked to the sugar constituent analysis in section 3.1.3., where it was observed as well that the CGC-
FCT contains more glucosamine than the commercial one.
The discrepancy result between the two polymers could be due to the distinction in extraction and
purification method. Because the use of sodium hydroxide for several hours for the extraction of
Page | 34
chitin-glucan from the mycelium is expected to denature or partly hydrolyse any protein component
from the source, as it stated in the literature [20].
As additional information, it is reported by European Food Safety Authority (EFSA) that protein
content in KiOnutrime is ≤ 6% [20]. The method used for protein determination was based on
colorimetry after reaction with ninhydrin and UV-absorption at 564 nm.
The calibration curve depicting the concentration of protein as a function of absorbance of the
standards is presented in Appendix III.
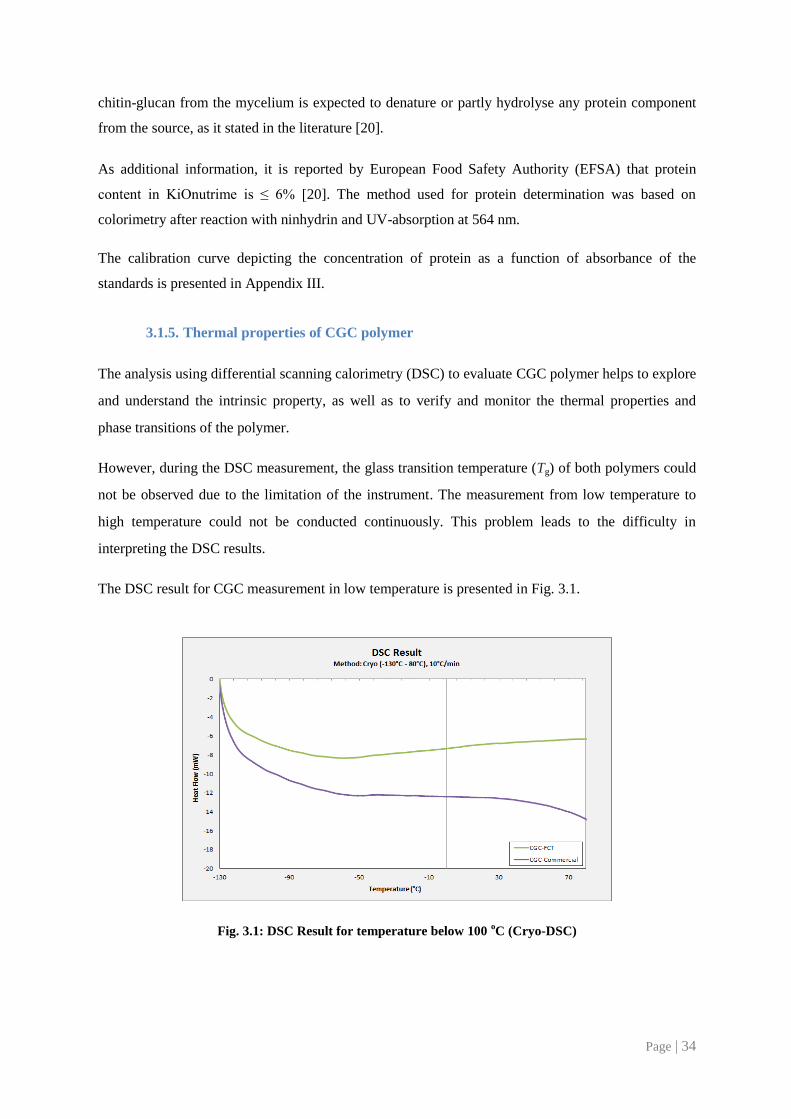
3.1.5. Thermal properties of CGC polymer
The analysis using differential scanning calorimetry (DSC) to evaluate CGC polymer helps to explore
and understand the intrinsic property, as well as to verify and monitor the thermal properties and
phase transitions of the polymer.
However, during the DSC measurement, the glass transition temperature (Tg) of both polymers could
not be observed due to the limitation of the instrument. The measurement from low temperature to
high temperature could not be conducted continuously. This problem leads to the difficulty in
interpreting the DSC results.
The DSC result for CGC measurement in low temperature is presented in Fig. 3.1.
Fig. 3.1: DSC Result for temperature below 100 oC (Cryo-DSC)
Page | 35
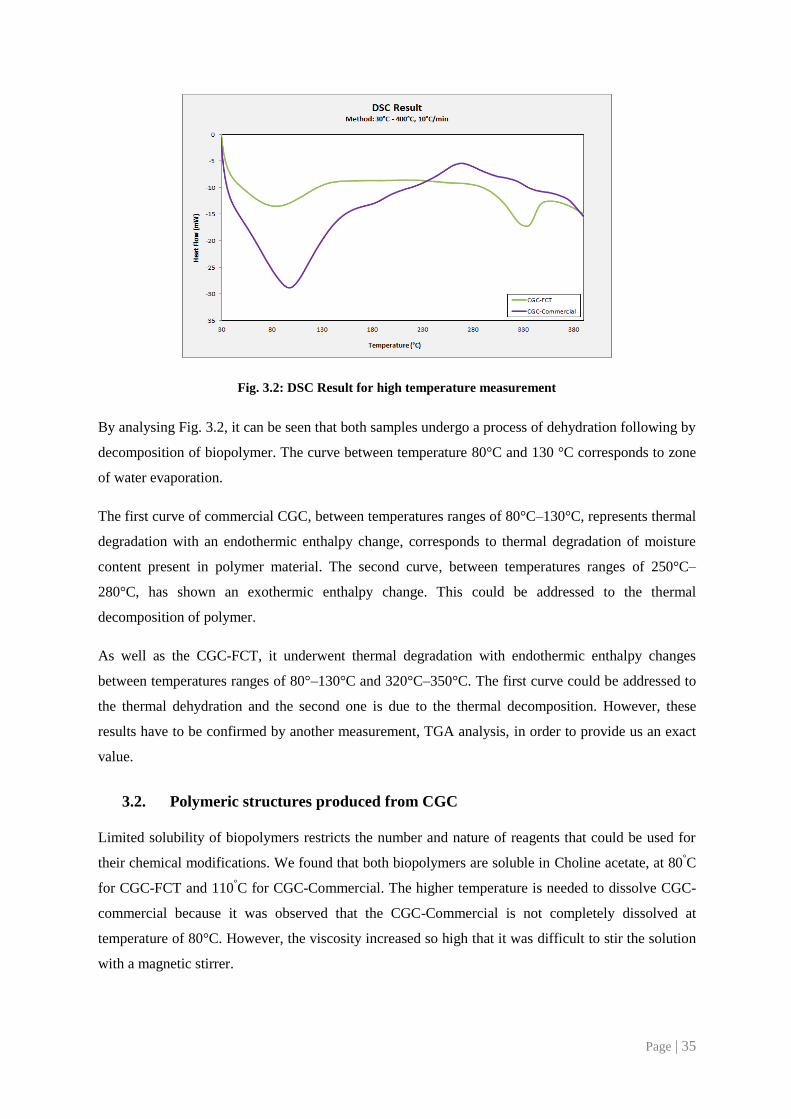
Fig. 3.2: DSC Result for high temperature measurement
By analysing Fig. 3.2, it can be seen that both samples undergo a process of dehydration following by
decomposition of biopolymer. The curve between temperature 80°C and 130 °C corresponds to zone
of water evaporation.
The first curve of commercial CGC, between temperatures ranges of 80°C–130°C, represents thermal
degradation with an endothermic enthalpy change, corresponds to thermal degradation of moisture
content present in polymer material. The second curve, between temperatures ranges of 250°C–
280°C, has shown an exothermic enthalpy change. This could be addressed to the thermal
decomposition of polymer.
As well as the CGC-FCT, it underwent thermal degradation with endothermic enthalpy changes
between temperatures ranges of 80°–130°C and 320°C–350°C. The first curve could be addressed to
the thermal dehydration and the second one is due to the thermal decomposition. However, these
results have to be confirmed by another measurement, TGA analysis, in order to provide us an exact
value.
3.2. Polymeric structures produced from CGC
Limited solubility of biopolymers restricts the number and nature of reagents that could be used for
their chemical modifications. We found that both biopolymers are soluble in Choline acetate, at 80°C
for CGC-FCT and 110°C for CGC-Commercial. The higher temperature is needed to dissolve CGC-
commercial because it was observed that the CGC-Commercial is not completely dissolved at
temperature of 80°C. However, the viscosity increased so high that it was difficult to stir the solution
with a magnetic stirrer.
Page | 36
As mentioned previously, choline acetate was selected for this work due to its CH3COO- anion. These
anions tend to create more stable bond with the hemiacetal group from CGC. The hydrogen bonds are
disrupted by seizing proton from hydroxyl group or amino group from the polymer. The cleavage of
the hydrogen bond will demolish the compact crystalline structure of chitin and lead to the dissolution
of CGC. Previous studies on dissolving cellulose by ILs have suggested that the solvation mainly
involved the interaction of the hydroxyl protons of the CGC polymer with the strong hydrogen
bonding and coordinating anions, in particular CH3COO- [35].
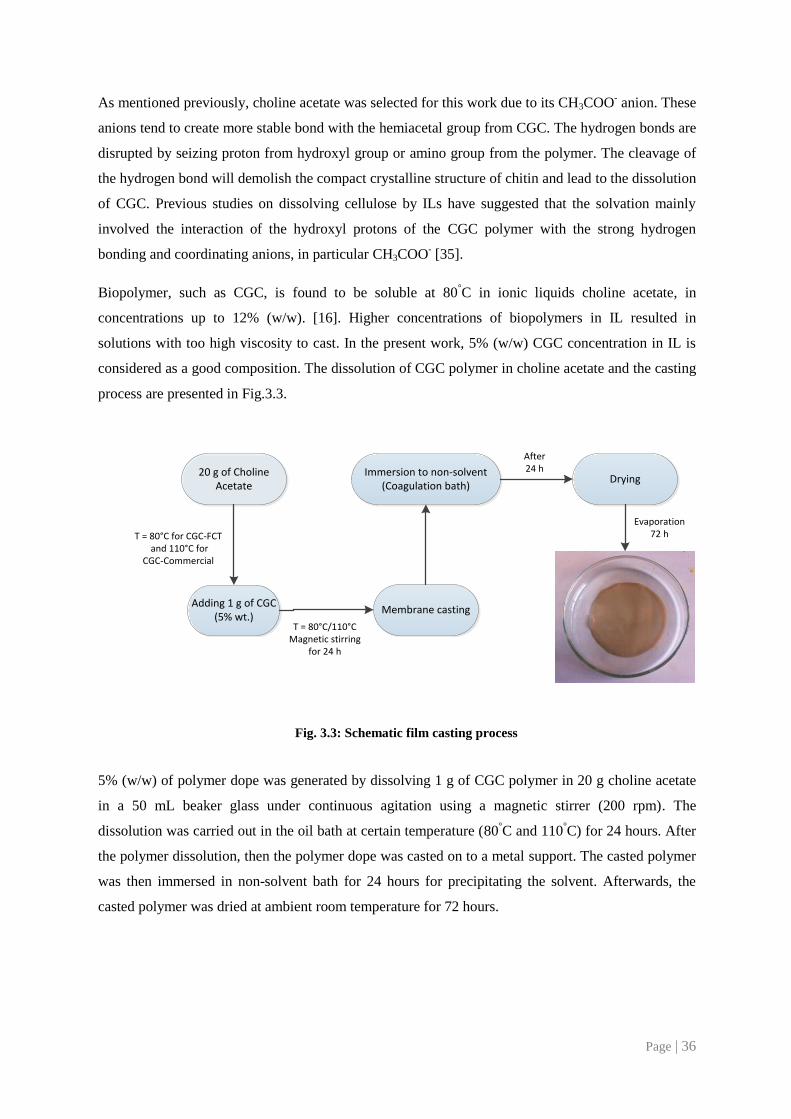
Biopolymer, such as CGC, is found to be soluble at 80°C in ionic liquids choline acetate, in
concentrations up to 12% (w/w). [16]. Higher concentrations of biopolymers in IL resulted in
solutions with too high viscosity to cast. In the present work, 5% (w/w) CGC concentration in IL is
considered as a good composition. The dissolution of CGC polymer in choline acetate and the casting
process are presented in Fig.3.3.
20 g of Choline Acetate
Adding 1 g of CGC(5% wt.)
Membrane casting
T = 80°C for CGC-FCT and 110°C for
CGC-Commercial
T = 80°C/110°CMagnetic stirring
for 24 h
Immersion to non-solvent (Coagulation bath)
Drying
Evaporation72 h
After24 h
Fig. 3.3: Schematic film casting process
5% (w/w) of polymer dope was generated by dissolving 1 g of CGC polymer in 20 g choline acetate
in a 50 mL beaker glass under continuous agitation using a magnetic stirrer (200 rpm). The
dissolution was carried out in the oil bath at certain temperature (80°C and 110
°C) for 24 hours. After
the polymer dissolution, then the polymer dope was casted on to a metal support. The casted polymer
was then immersed in non-solvent bath for 24 hours for precipitating the solvent. Afterwards, the
casted polymer was dried at ambient room temperature for 72 hours.
Page | 37
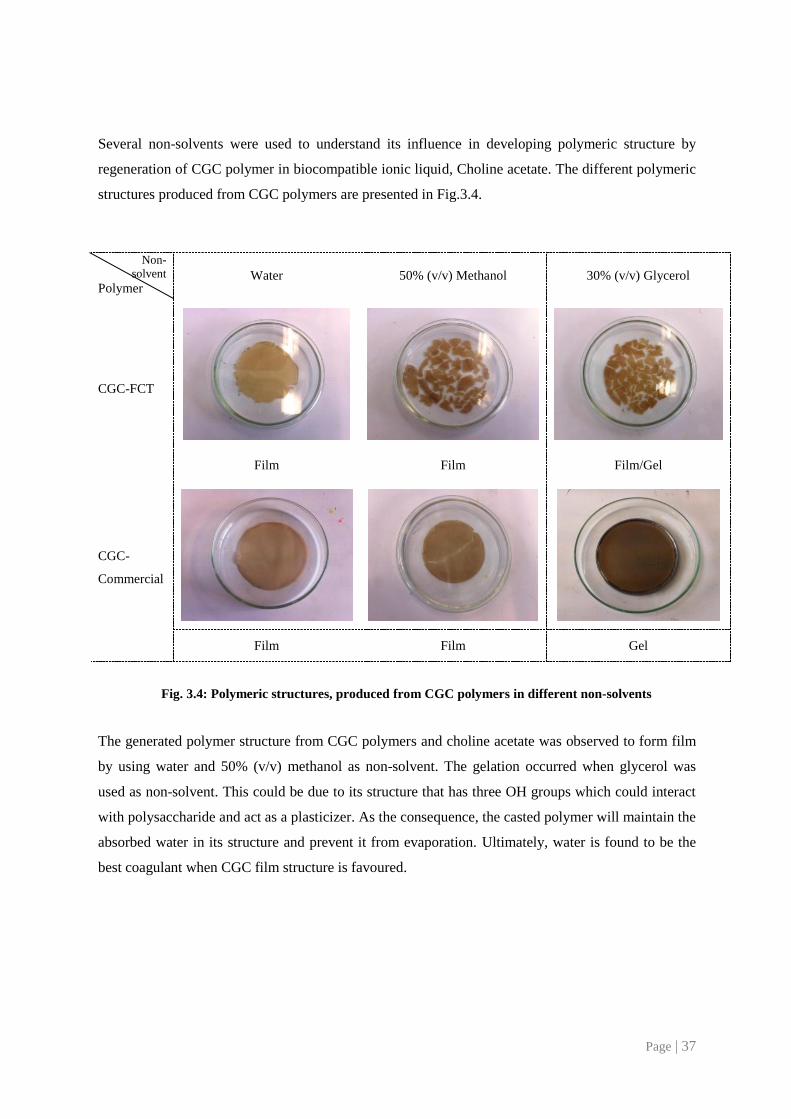
Several non-solvents were used to understand its influence in developing polymeric structure by
regeneration of CGC polymer in biocompatible ionic liquid, Choline acetate. The different polymeric
structures produced from CGC polymers are presented in Fig.3.4.
Non-
solvent Polymer
Water 50% (v/v) Methanol 30% (v/v) Glycerol
CGC-FCT
Film Film Film/Gel
CGC-
Commercial
Film Film Gel
Fig. 3.4: Polymeric structures, produced from CGC polymers in different non-solvents
The generated polymer structure from CGC polymers and choline acetate was observed to form film
by using water and 50% (v/v) methanol as non-solvent. The gelation occurred when glycerol was
used as non-solvent. This could be due to its structure that has three OH groups which could interact
with polysaccharide and act as a plasticizer. As the consequence, the casted polymer will maintain the
absorbed water in its structure and prevent it from evaporation. Ultimately, water is found to be the
best coagulant when CGC film structure is favoured.

Page | 38
Effect of dissolution temperature
Fig. 3.5: Produced CGC films with different dissolution temperature
The commercial CGC polymer is difficult to be dissolved in temperature below 100°C. When the
polymer is not completely dissolved in the solvent, it leads to faster demixing of solvent and non-
solvent. The required higher temperature for dissolving the commercial CGC could be due to the fact
that CGC-Commercial contains more glucosamine, if we consider it in term of the ratio of
glucosamine and glucan as observed in chapter 3.1.3, whereas hydrogen bond in glucosamine is more
difficult to be disrupted by IL. The images of CGC films generated from different dissolution
temperature are presented in Fig.3.5.
Effect of evaporation condition
Fig. 3.6: Produced CGC films with different evaporation condition
During the experiment, it was confirmed that the evaporation process is one of the most important
parameters in developing CGC film structure. It can be observed from Fig. 3.6. that the crack creation
upon drying occurred on the CGC-FCT dried in an open space (35±1% RH at 24°C). This problem
can be prevented by smooth solidification process. This can be done by controlling the evaporation
condition by means of a desiccator.
CGC-FCT, 50% MeOH, 57.7% RH at 25°C CGC-FCT, 50% MeOH, Normal drying
CGC-Commercial, water, 80°C dissolution CGC-Commercial, water, 110°C dissolution
Page | 39
The characterizations, after the dissolution of CGC polymer and generation of polymeric structure,
comprise the viscosity and viscoelasticity test followed by thermal property analysis. Sugar
composition study of films and gels, and the analysis of total sugar released during the immersion
precipitation were also analysed.
3.2.1. Rheology of CGC Mixtures
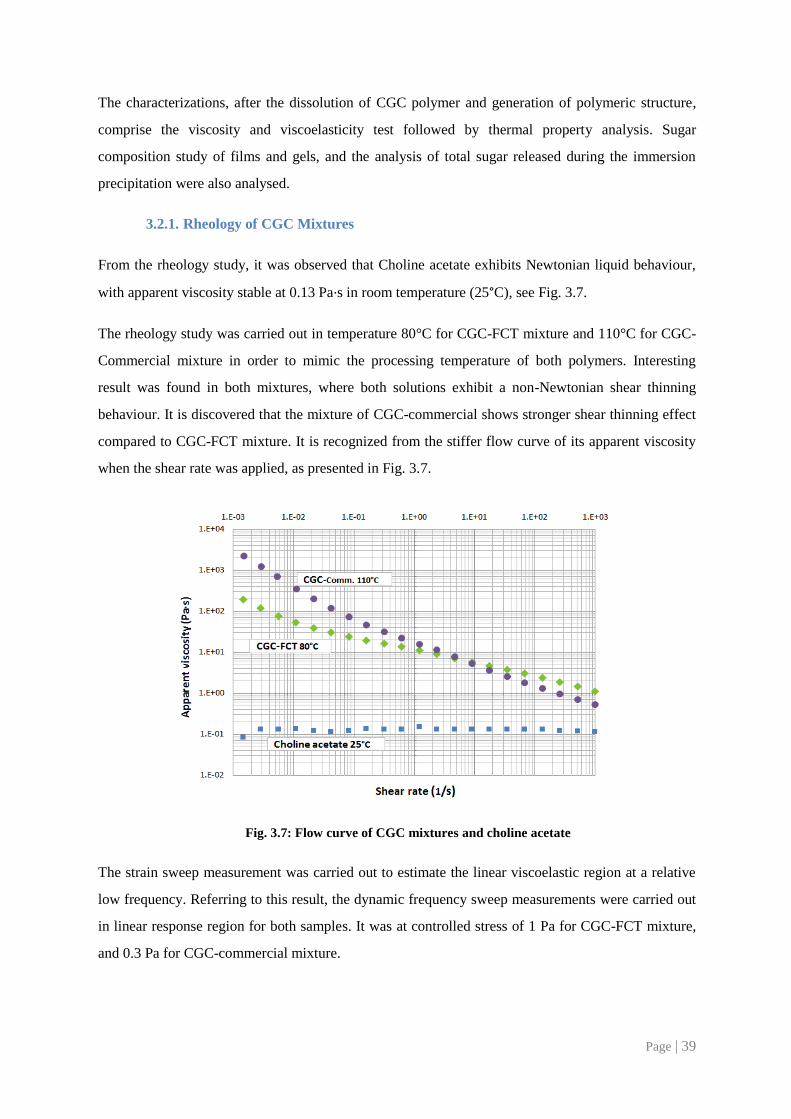
From the rheology study, it was observed that Choline acetate exhibits Newtonian liquid behaviour,
with apparent viscosity stable at 0.13 Pa·s in room temperature (25°C), see Fig. 3.7.
The rheology study was carried out in temperature 80°C for CGC-FCT mixture and 110°C for CGC-
Commercial mixture in order to mimic the processing temperature of both polymers. Interesting
result was found in both mixtures, where both solutions exhibit a non-Newtonian shear thinning
behaviour. It is discovered that the mixture of CGC-commercial shows stronger shear thinning effect
compared to CGC-FCT mixture. It is recognized from the stiffer flow curve of its apparent viscosity
when the shear rate was applied, as presented in Fig. 3.7.
Fig. 3.7: Flow curve of CGC mixtures and choline acetate
The strain sweep measurement was carried out to estimate the linear viscoelastic region at a relative
low frequency. Referring to this result, the dynamic frequency sweep measurements were carried out
in linear response region for both samples. It was at controlled stress of 1 Pa for CGC-FCT mixture,
and 0.3 Pa for CGC-commercial mixture.
Page | 40
Fig. 3.8: Mechanical Spectrum of CGC-FCT film forming mixtures
Regarding the viscoelastic property, it can be observed from Fig.3.8 that the viscous modulus (G’’)
higher than the elastic modulus (G’). Both G’ and G’’ values gradually increase but they do not
crossover in the entire frequency range. Such frequency dependence nature in this measurement is the
signature of the typical behaviour of a viscous solution with entangled polymer chains.
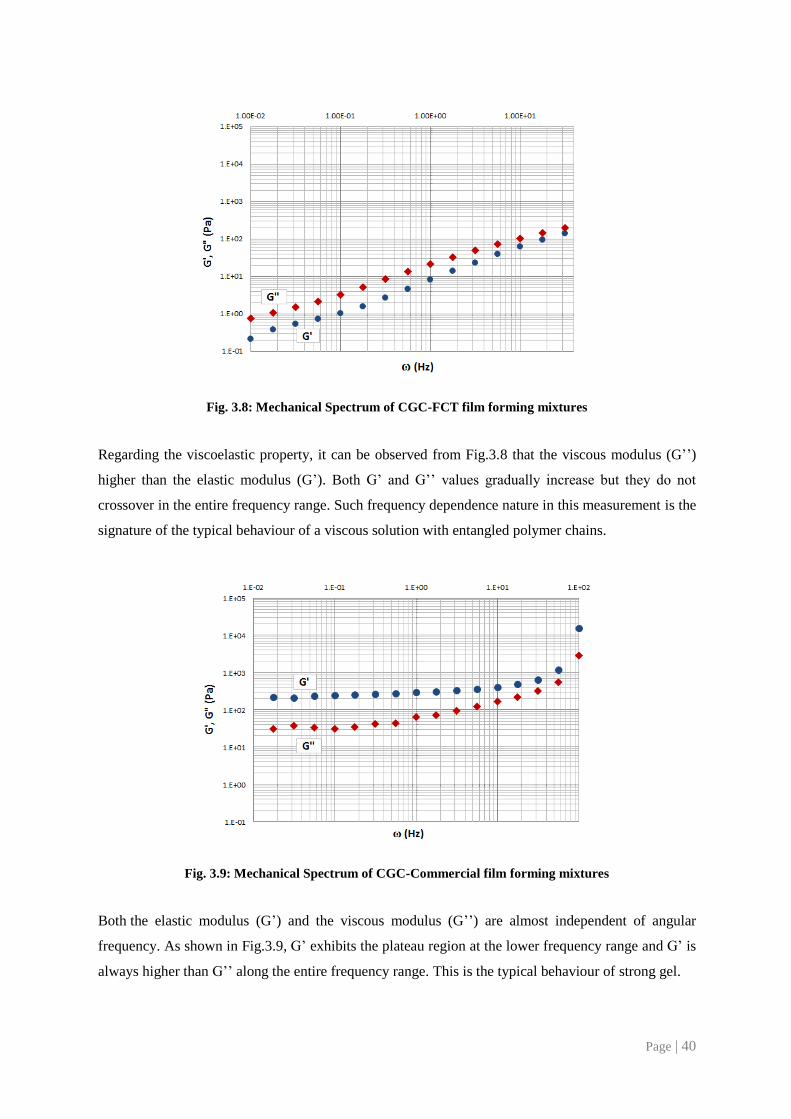
Fig. 3.9: Mechanical Spectrum of CGC-Commercial film forming mixtures
Both the elastic modulus (G’) and the viscous modulus (G’’) are almost independent of angular
frequency. As shown in Fig.3.9, G’ exhibits the plateau region at the lower frequency range and G’ is
always higher than G’’ along the entire frequency range. This is the typical behaviour of strong gel.
Page | 41
Additionally, for a strong gel, elastic modulus (G’) is typically 10 times larger than the viscous
modulus (G’’) in plateau region. However, for a soft gel or a physical gel, G’ is often almost the same
or less than G’’. As shown in Fig.3.8, G’’ is 3-4 times higher than G’ which also reveals that this
sample behaves as soft gel.
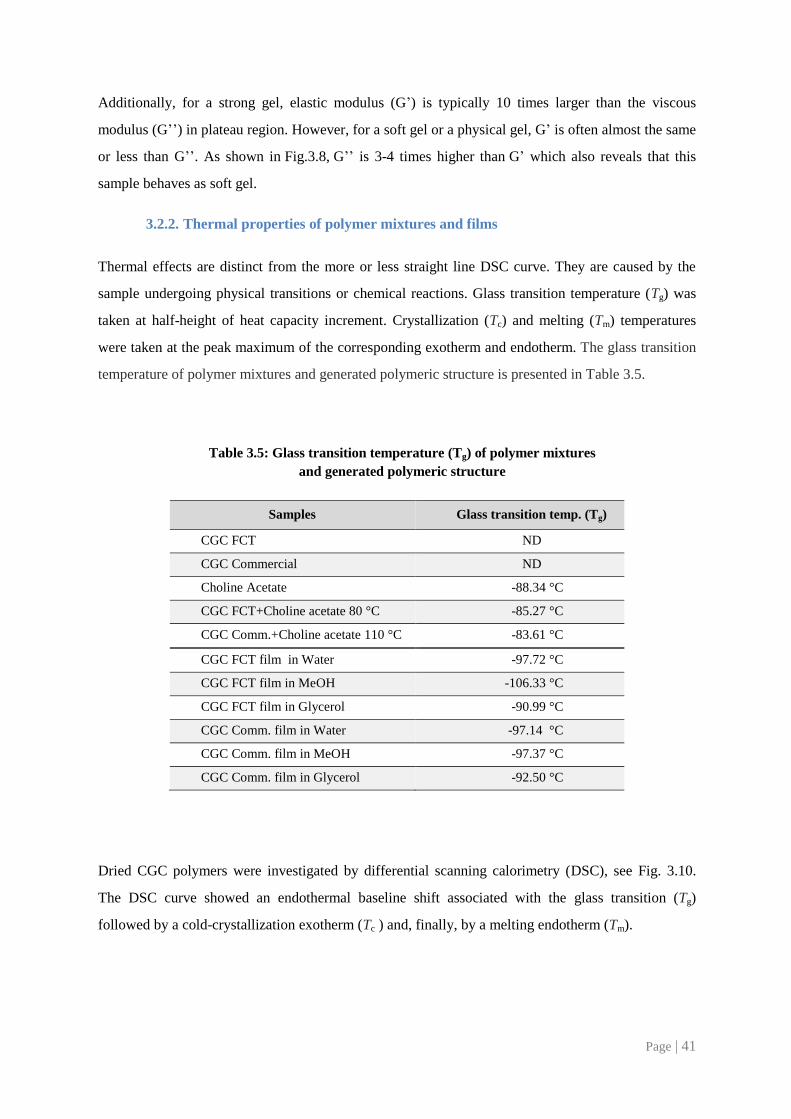
3.2.2. Thermal properties of polymer mixtures and films
Thermal effects are distinct from the more or less straight line DSC curve. They are caused by the
sample undergoing physical transitions or chemical reactions. Glass transition temperature (Tg) was
taken at half-height of heat capacity increment. Crystallization (Tc) and melting (Tm) temperatures
were taken at the peak maximum of the corresponding exotherm and endotherm. The glass transition
temperature of polymer mixtures and generated polymeric structure is presented in Table 3.5.
Table 3.5: Glass transition temperature (Tg) of polymer mixtures
and generated polymeric structure
Samples Glass transition temp. (Tg)
CGC FCT ND
CGC Commercial ND
Choline Acetate -88.34 °C
CGC FCT+Choline acetate 80 °C -85.27 °C
CGC Comm.+Choline acetate 110 °C -83.61 °C
CGC FCT film in Water -97.72 °C
CGC FCT film in MeOH -106.33 °C
CGC FCT film in Glycerol -90.99 °C
CGC Comm. film in Water -97.14 °C
CGC Comm. film in MeOH -97.37 °C
CGC Comm. film in Glycerol -92.50 °C
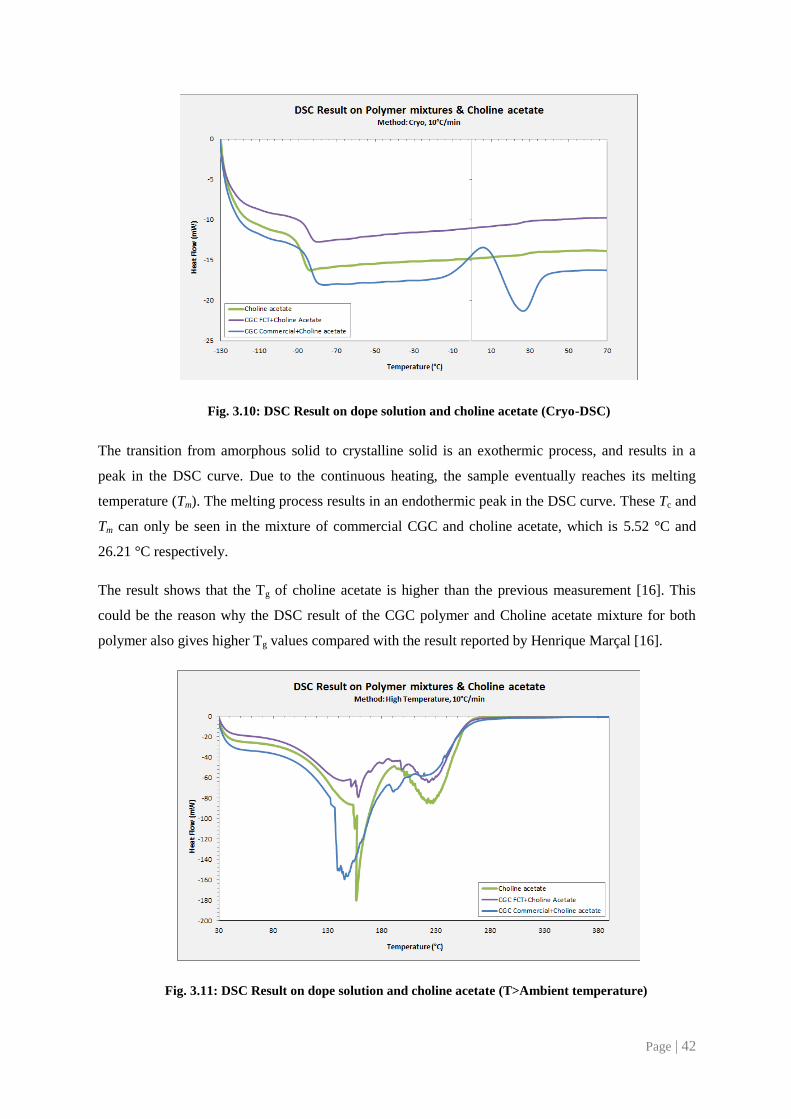
Dried CGC polymers were investigated by differential scanning calorimetry (DSC), see Fig. 3.10.
The DSC curve showed an endothermal baseline shift associated with the glass transition (Tg)
followed by a cold-crystallization exotherm (Tc ) and, finally, by a melting endotherm (Tm).
Page | 42
Fig. 3.10: DSC Result on dope solution and choline acetate (Cryo-DSC)
The transition from amorphous solid to crystalline solid is an exothermic process, and results in a
peak in the DSC curve. Due to the continuous heating, the sample eventually reaches its melting
temperature (Tm). The melting process results in an endothermic peak in the DSC curve. These Tc and
Tm can only be seen in the mixture of commercial CGC and choline acetate, which is 5.52 °C and
26.21 °C respectively.
The result shows that the Tg of choline acetate is higher than the previous measurement [16]. This
could be the reason why the DSC result of the CGC polymer and Choline acetate mixture for both
polymer also gives higher Tg values compared with the result reported by Henrique Marçal [16].
Fig. 3.11: DSC Result on dope solution and choline acetate (T>Ambient temperature)
Page | 43
From Fig. 3.11, it can be noticed as well that both polymer mixtures have similar thermogram
behaviours as Choline acetate. This could be addressed to the fact that Choline acetate is the used
solvent in both mixtures. Even though the chemical reaction might be happened during the
dissolution, however it can be identified that its composition is still dominating the mixture
properties.
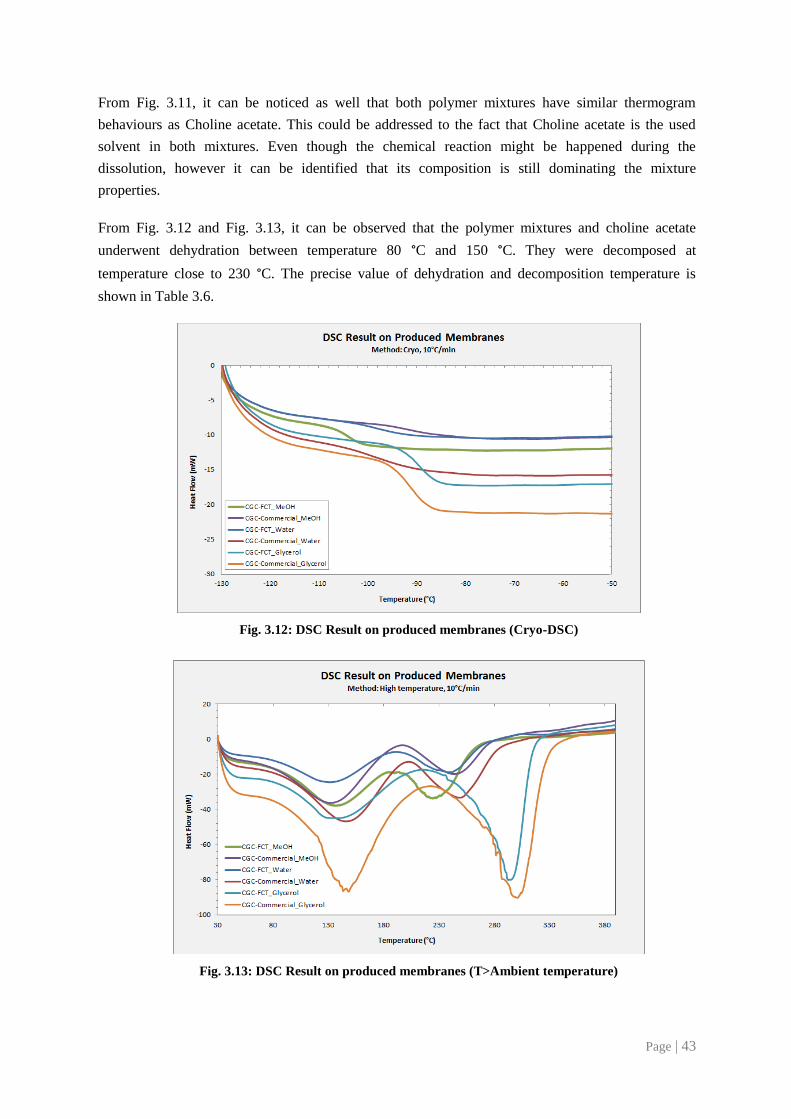
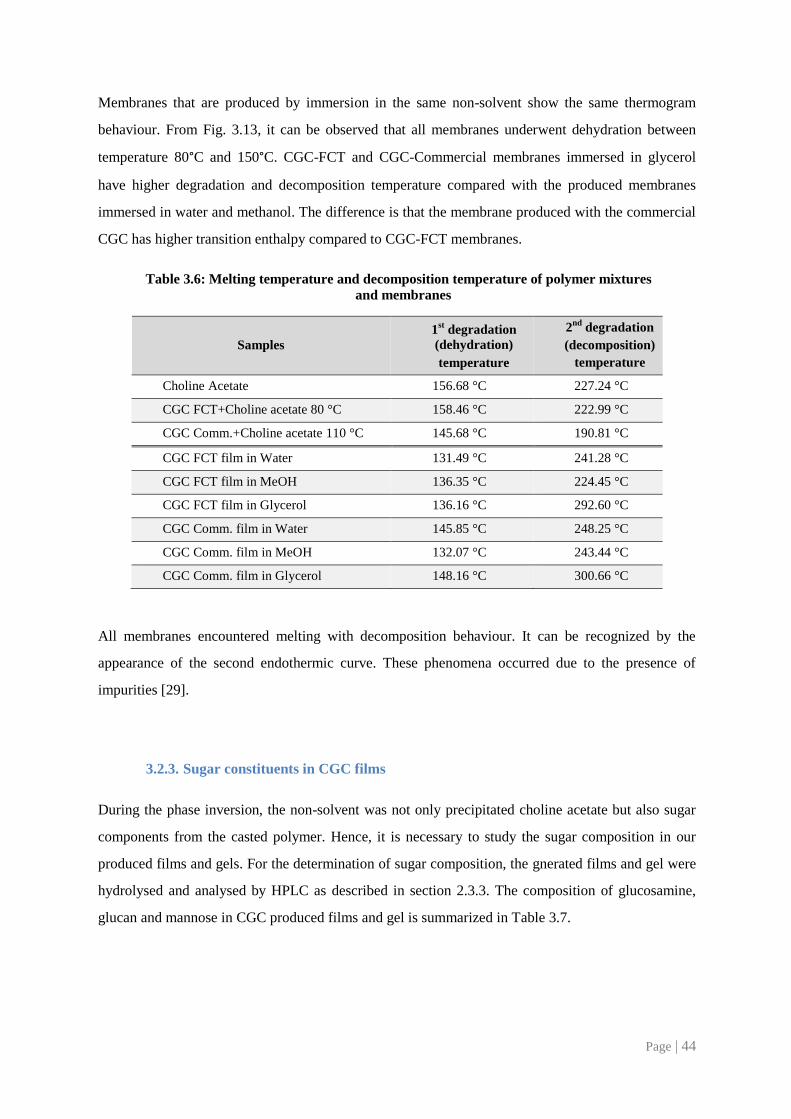
From Fig. 3.12 and Fig. 3.13, it can be observed that the polymer mixtures and choline acetate
underwent dehydration between temperature 80 °C and 150 °C. They were decomposed at
temperature close to 230 °C. The precise value of dehydration and decomposition temperature is
shown in Table 3.6.
Fig. 3.12: DSC Result on produced membranes (Cryo-DSC)
Fig. 3.13: DSC Result on produced membranes (T>Ambient temperature)
Page | 44
Membranes that are produced by immersion in the same non-solvent show the same thermogram
behaviour. From Fig. 3.13, it can be observed that all membranes underwent dehydration between
temperature 80°C and 150°C. CGC-FCT and CGC-Commercial membranes immersed in glycerol
have higher degradation and decomposition temperature compared with the produced membranes
immersed in water and methanol. The difference is that the membrane produced with the commercial
CGC has higher transition enthalpy compared to CGC-FCT membranes.
Table 3.6: Melting temperature and decomposition temperature of polymer mixtures
and membranes
Samples 1
st degradation
(dehydration)
temperature
2nd
degradation
(decomposition)
temperature
Choline Acetate 156.68 °C 227.24 °C
CGC FCT+Choline acetate 80 °C 158.46 °C 222.99 °C
CGC Comm.+Choline acetate 110 °C 145.68 °C 190.81 °C
CGC FCT film in Water 131.49 °C 241.28 °C
CGC FCT film in MeOH 136.35 °C 224.45 °C
CGC FCT film in Glycerol 136.16 °C 292.60 °C
CGC Comm. film in Water 145.85 °C 248.25 °C
CGC Comm. film in MeOH 132.07 °C 243.44 °C
CGC Comm. film in Glycerol 148.16 °C 300.66 °C
All membranes encountered melting with decomposition behaviour. It can be recognized by the
appearance of the second endothermic curve. These phenomena occurred due to the presence of
impurities [29].
3.2.3. Sugar constituents in CGC films
During the phase inversion, the non-solvent was not only precipitated choline acetate but also sugar
components from the casted polymer. Hence, it is necessary to study the sugar composition in our
produced films and gels. For the determination of sugar composition, the gnerated films and gel were
hydrolysed and analysed by HPLC as described in section 2.3.3. The composition of glucosamine,
glucan and mannose in CGC produced films and gel is summarized in Table 3.7.
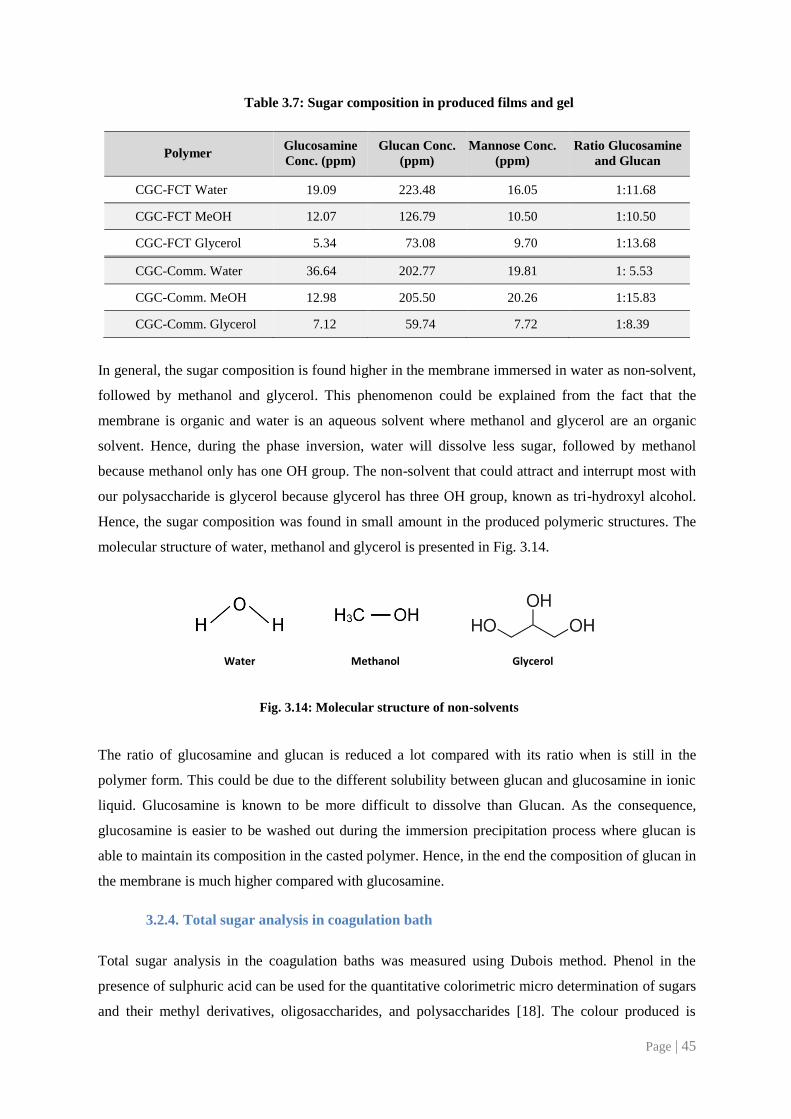
Page | 45
Table 3.7: Sugar composition in produced films and gel
Polymer Glucosamine
Conc. (ppm)
Glucan Conc.
(ppm)
Mannose Conc.
(ppm)
Ratio Glucosamine
and Glucan
CGC-FCT Water 19.09 223.48 16.05 1:11.68
CGC-FCT MeOH 12.07 126.79 10.50 1:10.50
CGC-FCT Glycerol 5.34 73.08 9.70 1:13.68
CGC-Comm. Water 36.64 202.77 19.81 1: 5.53
CGC-Comm. MeOH 12.98 205.50 20.26 1:15.83
CGC-Comm. Glycerol 7.12 59.74 7.72 1:8.39
In general, the sugar composition is found higher in the membrane immersed in water as non-solvent,
followed by methanol and glycerol. This phenomenon could be explained from the fact that the
membrane is organic and water is an aqueous solvent where methanol and glycerol are an organic
solvent. Hence, during the phase inversion, water will dissolve less sugar, followed by methanol
because methanol only has one OH group. The non-solvent that could attract and interrupt most with
our polysaccharide is glycerol because glycerol has three OH group, known as tri-hydroxyl alcohol.
Hence, the sugar composition was found in small amount in the produced polymeric structures. The
molecular structure of water, methanol and glycerol is presented in Fig. 3.14.
Water Methanol Glycerol
Fig. 3.14: Molecular structure of non-solvents
The ratio of glucosamine and glucan is reduced a lot compared with its ratio when is still in the
polymer form. This could be due to the different solubility between glucan and glucosamine in ionic
liquid. Glucosamine is known to be more difficult to dissolve than Glucan. As the consequence,
glucosamine is easier to be washed out during the immersion precipitation process where glucan is
able to maintain its composition in the casted polymer. Hence, in the end the composition of glucan in
the membrane is much higher compared with glucosamine.
3.2.4. Total sugar analysis in coagulation bath
Total sugar analysis in the coagulation baths was measured using Dubois method. Phenol in the
presence of sulphuric acid can be used for the quantitative colorimetric micro determination of sugars
and their methyl derivatives, oligosaccharides, and polysaccharides [18]. The colour produced is
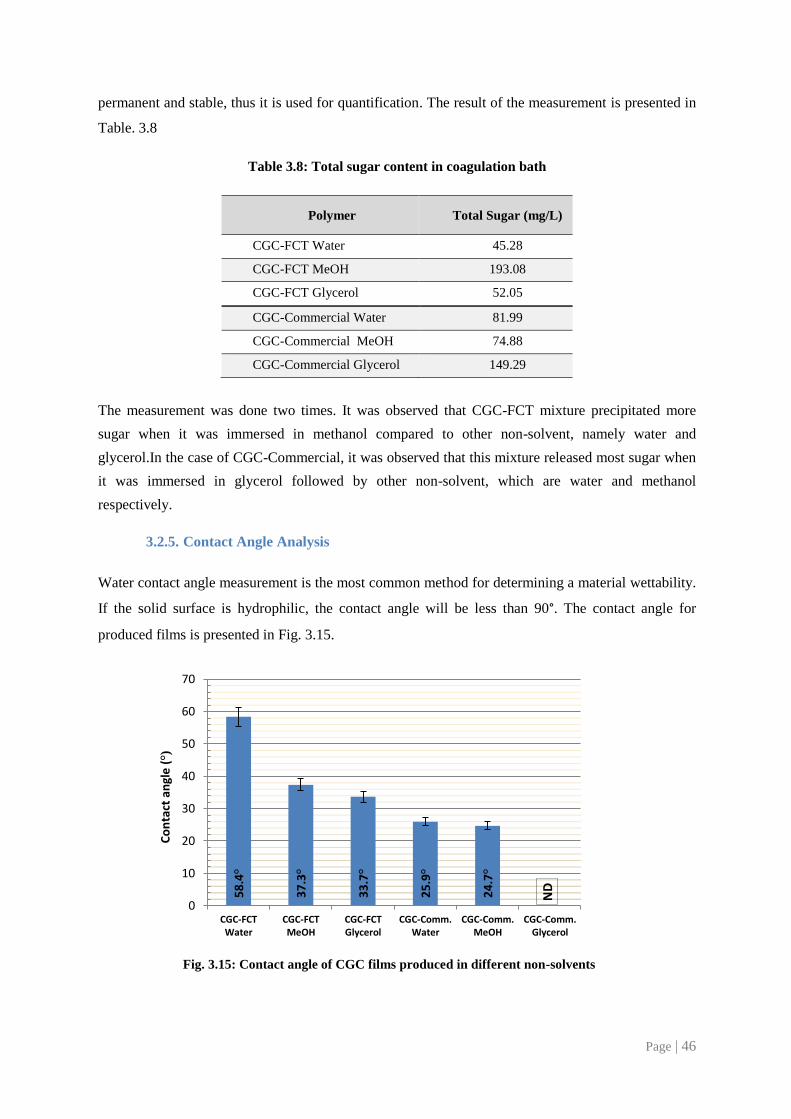
Page | 46
permanent and stable, thus it is used for quantification. The result of the measurement is presented in
Table. 3.8
Table 3.8: Total sugar content in coagulation bath
Polymer Total Sugar (mg/L)
CGC-FCT Water 45.28
CGC-FCT MeOH 193.08
CGC-FCT Glycerol 52.05
CGC-Commercial Water 81.99
CGC-Commercial MeOH 74.88
CGC-Commercial Glycerol 149.29
The measurement was done two times. It was observed that CGC-FCT mixture precipitated more
sugar when it was immersed in methanol compared to other non-solvent, namely water and
glycerol.In the case of CGC-Commercial, it was observed that this mixture released most sugar when
it was immersed in glycerol followed by other non-solvent, which are water and methanol
respectively.
3.2.5. Contact Angle Analysis
Water contact angle measurement is the most common method for determining a material wettability.
If the solid surface is hydrophilic, the contact angle will be less than 90°. The contact angle for
produced films is presented in Fig. 3.15.
Fig. 3.15: Contact angle of CGC films produced in different non-solvents
58
.4°
37
.3°
33
.7°
25
.9°
24
.7°
ND
0
10
20
30
40
50
60
70
CGC-FCTWater
CGC-FCTMeOH
CGC-FCTGlycerol
CGC-Comm.Water
CGC-Comm.MeOH
CGC-Comm.Glycerol
Co
nta
ct a
ngl
e (
°)
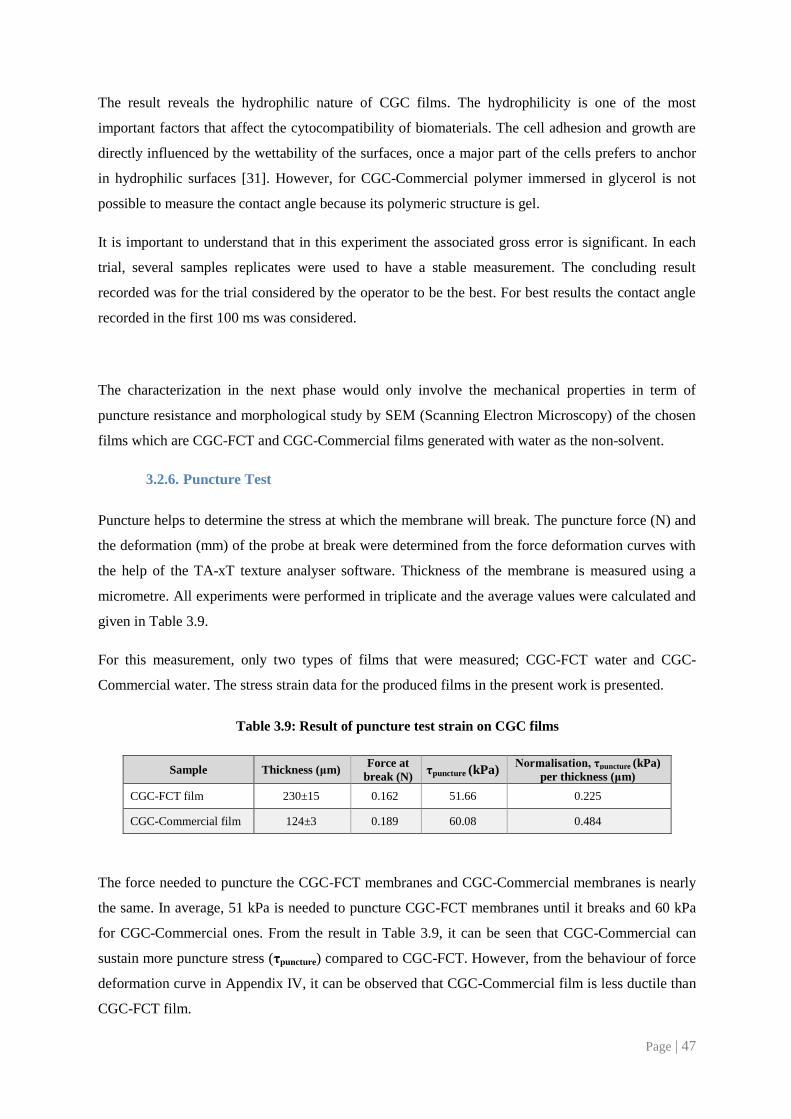
Page | 47
The result reveals the hydrophilic nature of CGC films. The hydrophilicity is one of the most
important factors that affect the cytocompatibility of biomaterials. The cell adhesion and growth are
directly influenced by the wettability of the surfaces, once a major part of the cells prefers to anchor
in hydrophilic surfaces [31]. However, for CGC-Commercial polymer immersed in glycerol is not
possible to measure the contact angle because its polymeric structure is gel.
It is important to understand that in this experiment the associated gross error is significant. In each
trial, several samples replicates were used to have a stable measurement. The concluding result
recorded was for the trial considered by the operator to be the best. For best results the contact angle
recorded in the first 100 ms was considered.
The characterization in the next phase would only involve the mechanical properties in term of
puncture resistance and morphological study by SEM (Scanning Electron Microscopy) of the chosen
films which are CGC-FCT and CGC-Commercial films generated with water as the non-solvent.
3.2.6. Puncture Test
Puncture helps to determine the stress at which the membrane will break. The puncture force (N) and
the deformation (mm) of the probe at break were determined from the force deformation curves with
the help of the TA-xT texture analyser software. Thickness of the membrane is measured using a
micrometre. All experiments were performed in triplicate and the average values were calculated and
given in Table 3.9.
For this measurement, only two types of films that were measured; CGC-FCT water and CGC-
Commercial water. The stress strain data for the produced films in the present work is presented.
Table 3.9: Result of puncture test strain on CGC films
Sample Thickness (μm) Force at
break (N) τpuncture (kPa)
Normalisation, τpuncture (kPa)
per thickness (μm)
CGC-FCT film 230±15 0.162 51.66 0.225
CGC-Commercial film 124±3 0.189 60.08 0.484
The force needed to puncture the CGC-FCT membranes and CGC-Commercial membranes is nearly
the same. In average, 51 kPa is needed to puncture CGC-FCT membranes until it breaks and 60 kPa
for CGC-Commercial ones. From the result in Table 3.9, it can be seen that CGC-Commercial can
sustain more puncture stress (τpuncture) compared to CGC-FCT. However, from the behaviour of force
deformation curve in Appendix IV, it can be observed that CGC-Commercial film is less ductile than
CGC-FCT film.
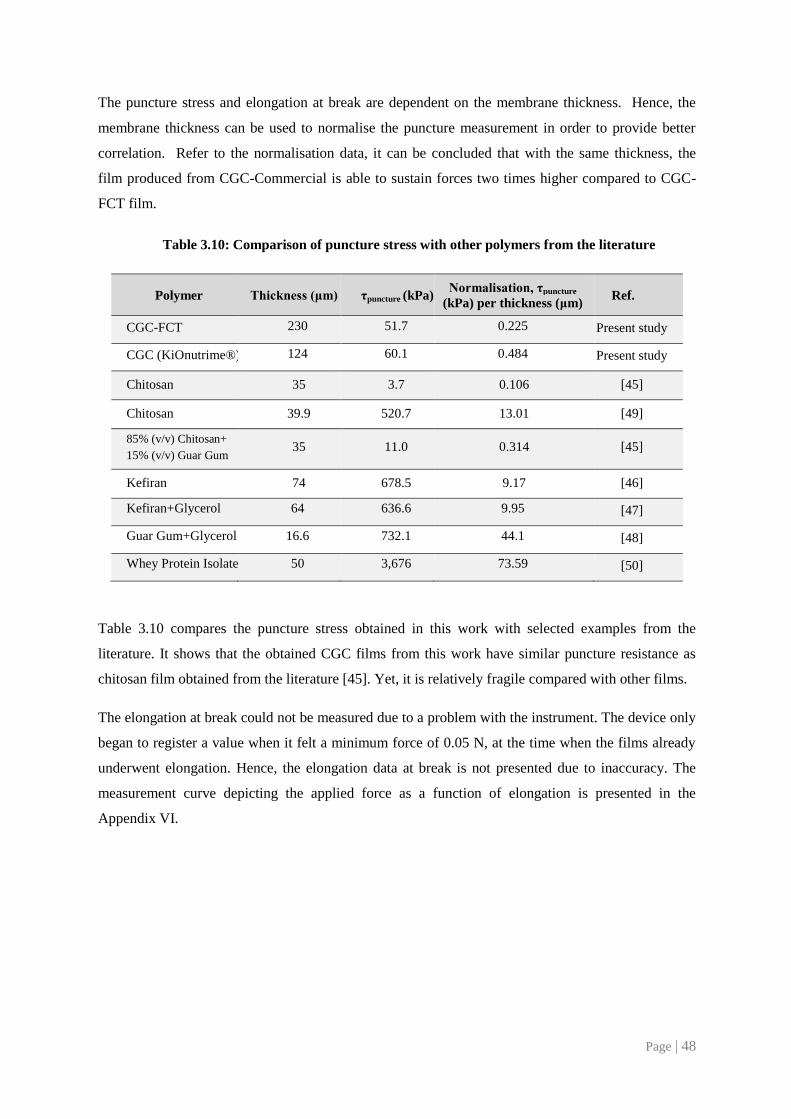
Page | 48
The puncture stress and elongation at break are dependent on the membrane thickness. Hence, the
membrane thickness can be used to normalise the puncture measurement in order to provide better
correlation. Refer to the normalisation data, it can be concluded that with the same thickness, the
film produced from CGC-Commercial is able to sustain forces two times higher compared to CGC-
FCT film.
Table 3.10: Comparison of puncture stress with other polymers from the literature
Polymer Thickness (μm) τpuncture (kPa) Normalisation, τpuncture
(kPa) per thickness (μm) Ref.
CGC-FCT 230 51.7 0.225 Present study
CGC (KiOnutrime®) 124 60.1 0.484 Present study
Chitosan 35 3.7 0.106 [45]
Chitosan 39.9 520.7 13.01 [49]
85% (v/v) Chitosan+
15% (v/v) Guar Gum 35 11.0 0.314 [45]
Kefiran 74 678.5 9.17 [46]
Kefiran+Glycerol 64 636.6 9.95 [47]
Guar Gum+Glycerol 16.6 732.1 44.1 [48]
Whey Protein Isolate 50 3,676 73.59 [50]
Table 3.10 compares the puncture stress obtained in this work with selected examples from the
literature. It shows that the obtained CGC films from this work have similar puncture resistance as
chitosan film obtained from the literature [45]. Yet, it is relatively fragile compared with other films.
The elongation at break could not be measured due to a problem with the instrument. The device only
began to register a value when it felt a minimum force of 0.05 N, at the time when the films already
underwent elongation. Hence, the elongation data at break is not presented due to inaccuracy. The
measurement curve depicting the applied force as a function of elongation is presented in the
Appendix VI.
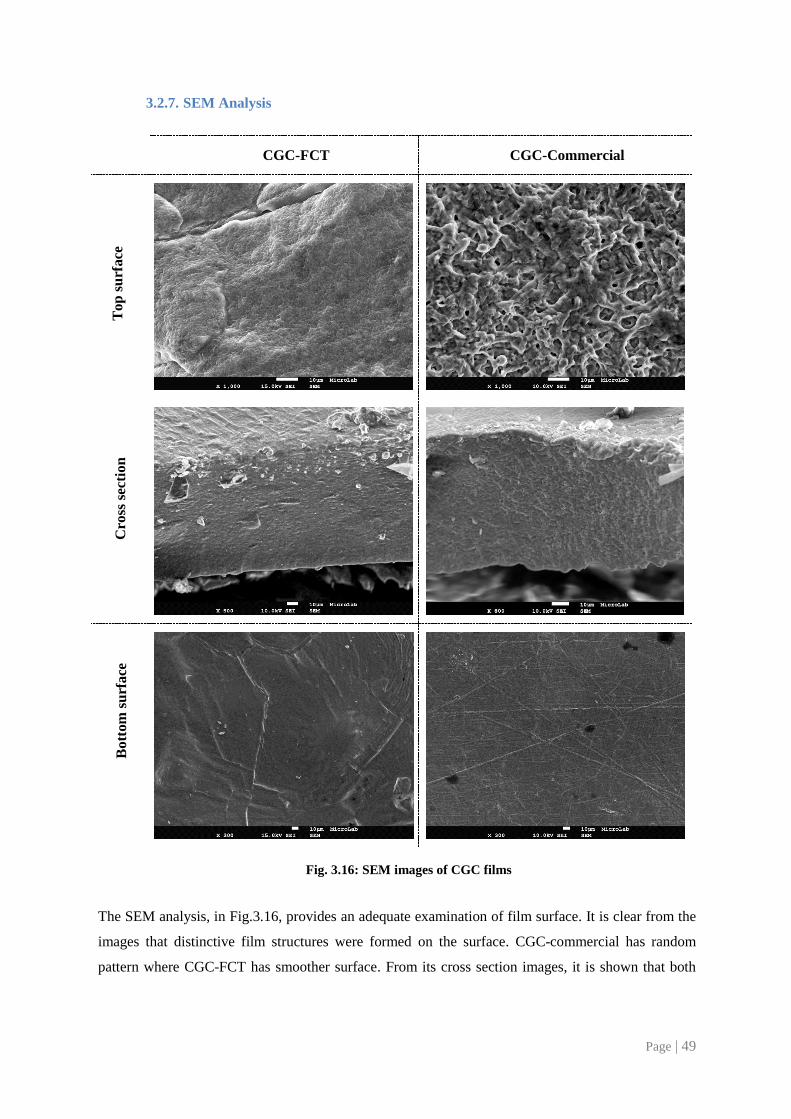
Page | 49
3.2.7. SEM Analysis
CGC-FCT CGC-Commercial
Fig. 3.16: SEM images of CGC films
The SEM analysis, in Fig.3.16, provides an adequate examination of film surface. It is clear from the
images that distinctive film structures were formed on the surface. CGC-commercial has random
pattern where CGC-FCT has smoother surface. From its cross section images, it is shown that both
To
p s
urf
ace
C
ross
sec
tion
B
ott
om
su
rface
Page | 50
membranes have dense polymeric structures. The bottom surface of both films seems more flat and
has fingerprint of the mould.
Having some roughness on the surface could be a positive influence to promote dermal fibroblast
adhesion as a strong basis for future healing on skin regeneration, whereas the dense structure could
prevent the wound from secondary infection [51]. However, small free volumes in polymeric
structure will be needed to enable gaseous exchange of O2 and CO2.
Refer to the result of viscoelasticity test in chapter 3.2.1, CGC-FCT mixture exhibits a typical
behaviour of a viscous solution with entangled polymer chains, where it is reported by Prasad et al.
that the entanglement of polymer chains in the case of casting solutions will result in dense resulting
membranes [38]. Hence, this rheology data shows a good agreement with the dense CGC-FCT film
structure observed by SEM.
During the phase inversion process, precipitation kinetics provides important fundamental
information regarding the membrane formation process. Delayed demixing is the term commonly
used in membrane preparation to refer to a low precipitation rate, whereas instantaneous demixing
refers to a high precipitation rate lead to film formation immediately after immersion.
In this experiment, when the cast polymer mixture was contacted with the non-solvent, liquid–liquid
demixing occurs in low precipitation rate. It was observed that the film structure was not formed
within finite period of time after immersion. Based on the literature [39], delayed demixing will result
in a relatively dense film as it is confirmed by the SEM analysis.
The discrepancy result between CGC-FCT water and CGC-Commercial water for the contact angle
measurement in chapter 3.2.5 could be explained from the SEM result. CGC-FCT water exhibits
higher contact angle (58.4°) compared to CGC-Commercial (25.9°) water because its top surface is
less rough. As it is known that hydrophilicity is highly influenced by surface roughness.
Page | 51
4. Conclusions
In this work, two different CGC, KiOnutrime from KitoZyme and biologically produced CGC from
Biochemical Engineering group in FCT-UNL, were characterized in order to develop biocompatible
wound dressing materials. The similarity of CGC-FCT and CGC-Commercial is shown in term of the
ratio of chitin:glucan, which are 1:1.72 and 1:1.69 respectively. However, the other measurement
showed different result. In general CGC-FCT contains more metal traces, water, inorganic salts and
protein compared with the commercial one. The different characterization results between CGC-FCT
and CGC-Commercial could be addressed to differences in the purification method, and its distinctive
original strain yeast.
During the membranes preparation, different non-solvents were used in phase inversion method. The
result indicates that composition of non-solvent in the coagulation bath has great influence in
generated polymeric structure. Water was found to be the best coagulant for producing a CGC
polymeric film structure. Intrinsic component of polymer mixtures and generated polymeric
structures were characterized and compared.
The characterizations that have been done include the analysis of viscosity and viscoelasticity
measurement, as well as sugar composition in the membrane and total sugar that was released during
precipitation. The rheology test shows that both polymer mixtures exhibit a non-Newtonian shear
thinning behaviour. Where the viscosity and viscoelasticity test reveal that CGC-FCT mixture has a
typical behaviour of a viscous solution with entangled polymer chains and CGC-Commercial mixture
exhibits true gel behaviour.
To the best of our knowledge, this is the first time that choline acetate was used to regenerate CGC
polymeric solution. This experiment result shows us that the generated CGC solution from choline
acetate could be used to develop film structure and gel. The generated polymeric structures are
thermally stable at 100°C, and are hydrophilic. The produced films have dense structure and
mechanical stabilities against puncture up to 62 kPa.
Page | 52
5. Future Work
To guarantee the potential use of generated CGC films as a wound dressing material, further
investigation are essential. One of the most important tests is a biocompatibility study. It can be done
in-vitro by using fibroblast cell in order to assure that the material is safe for medical usage and able
to promote the cell proliferation for new skin regeneration.
An ideal dressing should maintain evaporative water loss from the skin at an optimal rate to provide
an adequate level of moisture [22]. The vapour permeability through the film for wound dressing is
important to keep the wound comfortable and help in the healing process, where excessive
dehydration can result in scar formation. Thus, water vapour permeation is important to be studied.
Besides all other properties, a transfer efficacy of CO2 and O2 will be an important aspect for cell
growth. A dressing material has to possess adequate permeance for those gases. It is one of important
factor for cell seeding which affects distribution of cell suspension throughout the material.
It was observed during the experiment that the generated films from CGC dissolution in ionic liquid
are fragile. For that reason, the improvement of the mechanical properties of the produced film could
be considered in the future. This could be done by using cross-linker or combining CGC with another
biopolymer that could raise its mechanical properties.
Because this work related with introducing a new solvent for biopolymer dissolution, it will be
interesting to have FTIR and NMR analysis to confirm the dissolution of CGC in choline acetate.
Page | 53
6. References
[1] Kyoko Kofuji, Yuzhou Huang, Kazufumi Tsubaki, Fumihiko Kokido, Kazunori Nishikawa,
Takashi Isobe, Yoshifumi Murata. Preparation and evaluation of a novel wound dressing sheet
comprised of β-glucan–chitosan complex. Reactive & Functional Polymers 70 (2010) 784–789.
[2] Andrew C.A. Wan, Benjamin C.U. Tai. CHITIN - A promising biomaterial for tissue engineering
and stem cell technologies. Biotechnology Advances 31 (2013) 1776–1785.
[3] Simone S. Silva, Ana Rita C. Duarte, Ana Paula Carvalho, João F. Mano, Rui L. Reis. Green
processing of porous chitin structures for biomedical applications combining ionic liquids and
supercritical fluid technology. Acta Biomaterialia 7 (2011) 1166–1172.
[4] C.K.S. Pillai, Willi Paul, Chandra P. Sharma. Chitin and chitosan polymers: Chemistry, solubility
and fiber formation. Progress in Polymer Science 34 (2009) 641-678.
[5] R. Jayakumar, M. Prabaharan, P.T. Sudheesh Kumar, S.V. Nair, H. Tamura. Biomaterials based
on chitin and chitosan in wound dressing applications. Biotechnology Advances 29 (2011) 322–
337.
[6] Andrew C.A. Wan, Benjamin C.U. Tai. CHITIN - promising biomaterial for tissue engineering
and stem cell technologies. Biotechnology Advances 31 (2013) 1776-1785.
[7] Samuel M. Hudson, David W. Jenkins. Chitin and chitosan, Encyclopedia of Polymer Science and
Technology, John Wiley, 569–580.
[8] Christophe Roca, Bárbara Chagas, Inês Farinha, Filomena Freitas, Luís Mafra, Filipe Aguiar, Rui
Oliveira, Maria A.M. Reis. Production of yeast chitin-glucan complex from biodiesel industry by
product. Process Biochemistry 47 (2012) 1670-1675.
[9] Lysing Enzymes. Available:
http://www.sigmaaldrich.com/life-science/metabolomics/enzyme-explorer/learning-
center/lysing-enzymes.html#sthash.uvGHl7JY.dpuf . Accessed 04.06.2014.
[10] Stoscheck C. M. Quantitation of protein. Methods Enzymol 182 (1990) 50–69.
[11] Thi Phuong Thuy Pham, Chul-Woong Cho, Yeoung-Sang Yun. Environmental fate and toxicity
of ionic liquids: A review. Water research 44 (2010) 352–372.
[12] Fangchao Cheng, Hui Wang, Gregory Chatel, Gabriela Gurau, Robin D. Rogers. Facile pulping
of lignocellulosic biomass using choline acetate. Bioresource Technology 164 (2014) 394–401.
[13] Varadhi Govinda, P. Madhusudhana Reddy, Pankaj Attri, P. Venkatesu, P. Venkateswarlu.
Influence of anion on thermophysical properties of ionic liquids with polar solvent. The Journal
of Chemical Thermodynamics 58 (2013) 269–278.
[14] Joana M. Lopes, Ana B. Paninho, Marta F. Môlho, Ana V.M. Nunes, Angelo Rocha, Nuno M.T.
Lourenço, Vesna Najdanovic-Visak. Biocompatible choline based ionic salts: Solubility in short-
chain alcohols. The Journal of Chemical Thermodynamics 67 (2013) 99-105.
Page | 54
[15] Molecular structure of Choline acetate ionic liquid. Available:
http://www.chemspider.com/Chemical-Structure.9818719.html . Accessed 09.06.2014.
[16] Henrique Marçal. Master thesis: Producao de Filmes de Quitina com Liquidos Ionicos
Biocompativeis para Aplicacoes Biomedicas. FCT-UNL, Portugal. 2013.
[17] Matthew C. Davis. Final report: New ionic liquids from natural products for environmental
benign aircraft deicing and anti-icing. SERDP Project 2010.
[18] Michel Dubois, K.A.Gilles, J.K. Hamilton, P.A. Rebers, and Fred Smith. Colorimetric Method
for Determination of Sugars and Related Substances. Analytical Chemistry 28 (1956) 350–356.
[19 ] A Biswas, RL Shogren, DG Stevenson, JL Willett. Ionic liquids as solvents for biopolymers:
Acylation of starch and zein protein. Carbohydrate (2006) 546-550.
[20] EFSA (European Food Safety Authority) Panel on Dietetic Products, Nutrition and Allergies
(NDA); Scientific Opinion on the safety of “Chitin-Glucan” as a Novel Food ingredient. EFSA
Journal 8 (2010) 1687.
[21] Mulder, M. (2003). Basic Principles of Membrane Technology, 2nd edition. Kulwer Academic
Publishers, The Netherlands.
[22] R.A.A. Muzzarelli, P. Morganti, G. Morganti, P. Palombo, M. Palombo, G. Biagini, M.M.
Belmonte, F. Giantomassi, F. Orlandi, C. Muzzarelli. Chitin nanofibrils/chitosan glycolate
composites as wound medicaments. Carbohydrate Polymers 70 (2007) 274–284.
[23] Riccardo A.A. Muzzarelli. Chitins and chitosans for the repair of wounded skin, nerve, cartilage
and bone. Carbohydrate Polymers 76 (2009) 167–182.
[24] A. Anithaa, S. Sowmyaa, P.T. Sudheesh Kumara, S. Deepthia, K.P. Chennazhia, H. Ehrlichb, M.
Tsurkanc, R. Jayakumara. Chitin and chitosan in selected biomedical applications. Progress in
Polymer Science 83 (2014) 288-311.
[25] Lowry, O., Rosebrough, N., Fan, A., Randall, R. Protein measurement with the folin phenol
reagent. J Biol Chem 193 (1951) 265–75.
[26] Henk J van de Wiel. Determination of elements by ICP-AES and ICP-MS. National Institute of
Public Health and the Environment (RIVM) 2003. Bilthoven, The Netherlands.
[27] Geoffrey Tyler. Product Specification: ICP-MS, or ICP-AES and AAS? - A comparison. Varian
Australia Pty Ltd 1994. Australia.
[28] KitoZyme Patent: Cell wall derivatives from biomass and preparation thereof. Available:
http://www.lens.org/images/patent/WO/2003068824/A1/WO_2003_068824_A1.pdf . Accessed
22.06.2014.
[29] Differential Scanning Colorimetry. University of Bradford, 2006. Available:
http://www.mmsconferencing.com/pdf/eyp/c.rawlinson.pdf . Accessed 26.06.2014.
[30] Yuan, Y., and T. R. Lee. Surface Science Techniques. (Eds.2) G. Bracco, B. Holst.2013. ISBN:
978-3-642-34242-4
Page | 55
[31] D. Archana, Joydeep Dutta, P.K. Dutta. Evaluation of chitosan nano dressing for wound
healing: Characterization, in vitro and in vivo studies. International Journal of Biological
Macromolecules 57 (2013) 193–203.
[32] Florence Croisier, Christine Jérôme. Chitosan-based biomaterials for tissue engineering.
European Polymer Journal 49 (2013) 780–792.
[33] International Oenological Codex - COEI-1-CHITGL: 2009. Chitin-Glucan. Available:
http://www.oiv.int/oiv/info/enplubicationoiv#codex . Accessed 04.07.2014.
[34] Sigma Aldrich. ChemFiles: Ionic Liquids. Voume 6, Nomer 9, 2006. Available:
http://www.sigmaaldrich.com/content/dam/sigma-
aldrich/docs/Aldrich/Brochure/al_chemfile_v6_n9.pdf . Accessed 05.07.2014.
[35] Hongyang Ma, Benjamin S. Hsiao, Benjamin Chu. Thin-film nanofibrous composite membranes
containing cellulose or chitin barrier layers fabricated by ionic liquids. Polymer 52 (2011)
2594–2599.
[36] Jianmei Lua, Feng Yana, John Texter. Advanced applications of ionic liquids in polymer science.
Progress in Polymer Science 34 (2009) 431–448
[37] Yusong Wu, Takashi Sasaki, Satoshi Irie, Kensuke Sakurai. A novel biomass-ionic liquid
platform for the utilization of native chitin. Polymer 49 (2008) 2321–2327.
[38] Kamalesh Prasad, Masa-aki Murakami, Yoshiro Kaneko, Akihiko Takada, Yoshifumi
Nakamura, Jun-ichi Kadokawa. Weak gel of chitin with ionic liquid, 1-allyl-3-methylimidazolium
bromide. International Journal of Biological Macromolecules 45 (2009) 221–225.
[39] Akihiko Takegawa, Masa-aki Murakami, Yoshiro Kaneko, Jun-ichi Kadokawa. Preparation of
chitin/cellulose composite gels and films with ionic liquids. Carbohydrate Polymers 79 (2010)
85–90.
[40] S.S. Silva, T.C. Santos, M.T. Cerqueira, A.P. Marques, L.L. Reys, T.H. Silva, S.G. Caridade,
J.F. Manoa, and R.L. Reisa. The use of ionic liquids in the processing of chitosan/silk hydrogels
for biomedical applications. Green Chemistry 14 (2012) 1463-1470.
[41] Simone S. Silva, Ana Rita C. Duarte, Ana Paula Carvalho, João F. Mano, Rui L. Reis. Green
processing of porous chitin structures for biomedical applications combining ionic liquids and
supercritical fluid technology. Acta Biomaterialia 7 (2011) 1166–1172.
[42] Duan-Jian Tao, Zheng Cheng, Feng-Feng Chen, Zhang-Min Li, Na Hu, and Xiang-Shu Chen.
Synthesis and Thermophysical Properties of Biocompatible Cholinium-Based Amino Acid Ionic
Liquids. J. Chem. Eng. Data 58 (2013) 1542−1548.
[43] R. M. Vrikkis, K.J. Fraser, K. Fujita, D.R. MacFarlane and G.D. Elliott. Biocompatible Ionic
Liquids: A New Approach for Stabilizing Proteins in Liquid Formulation. Journal of
Biomechanical Engineering 131 (2009) 074514-1: 074514-4.
[44] Marija Petkovic, Jamie L. Ferguson, H. Q. Nimal Gunaratne, Rui Ferreira, Maria C. Leitao,
Kenneth R. Seddon, Luis Paulo N. Rebeloa. Novel biocompatible cholinium-based ionic liquids-
toxicity and biodegradability. Green Chem. 12 (2010) 643-649.
Page | 56
[45] M.S. Rao, S.R. Kanatt, S.P. Chawla, A. Sharma. Chitosan and guar gum composite films:
Preparation, physical, mechanical and antimicrobial properties. Carbohydrate Polymers 82
(2010) 1243–1247.
[46] Mohsen Zolfi, Faramarz Khodaiyan, Mohammad Mousavi, Maryam Hashemi. The improvement
of characteristics of biodegradable films made from kefiran–whey protein by nanoparticle
incorporation. Carbohydrate Polymers 109 (2014) 118–125.
[47] Mehran Ghasemlou, Faramarz Khodaiyan, Abdulrasoul Oromiehie. Physical, mechanical,
barrier, and thermal properties of polyol-plasticized biodegradable edible film made from
kefiran. Carbohydrate Polymers 84 (2011) 477–483.
[48] Chaturbhuj K. Saurabh, Sumit Gupta, Jitendra Bahadur, S. Mazumder, Prasad S. Variyar, Arun
Sharma. Radiation dose dependent change in physiochemical, mechanical and barrier
properties of guar gum based films. Carbohydrate Polymers 98 (2013) 1610–1617.
[49] J. Li, S. Zivanovic, P.M. Davidson, K. Kit. Characterization and comparison of chitosan/PVP
and chitosan/PEO blend films. Carbohydrate Polymers 79 (2010) 786–791.
[50] Lizhe Wang, Mark A.E. Auty, Joe P. Kerry. Physical assessment of composite biodegradable
films manufactured using whey protein isolate, gelatine and sodium alginate. Journal of Food
Engineering 96 (2010) 199–207.
[51] H.V. Pawar, J. Tetteh, J.S. Boateng. Preparation, optimisation and characterisation of novel
wound healing film dressings loaded with streptomycin and diclofenac. Colloids and Surfaces B:
Biointerfaces 102 (2013) 102–110.
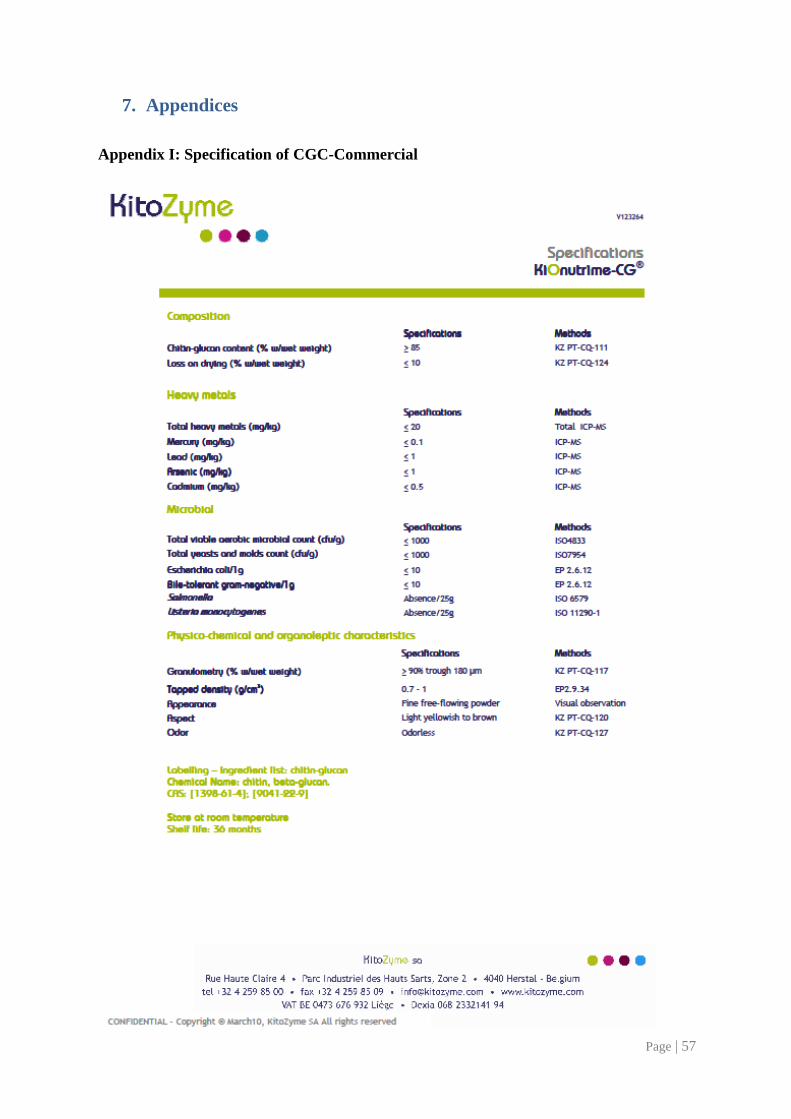
Page | 57
7. Appendices
Appendix I: Specification of CGC-Commercial

Appendix II: Sugar Constituents by HPLC
Fig. 7.1: Calibration curve represents Glucose concentration as a function of area
Fig. 7.2: Calibration curve represents Mannose concentration as a function of area
y = 0.0005x - 0.0126 R² = 0.9852
0.00
0.02
0.04
0.06
0.08
0.10
0.12
0 50 100 150 200 250 300
Co
nce
ntr
atio
n (
g/L)
Area
Calibration Curve for Glucose
Series1Linear (Series1)
y = 0.00073x + 0.00436 R² = 0.9988
0.00
0.02
0.04
0.06
0.08
0.10
0.12
0 20 40 60 80 100 120 140
Co
nce
ntr
atio
n (
g/L)
Area
Calibration Curve for Mannose
Series1Linear (Series1)
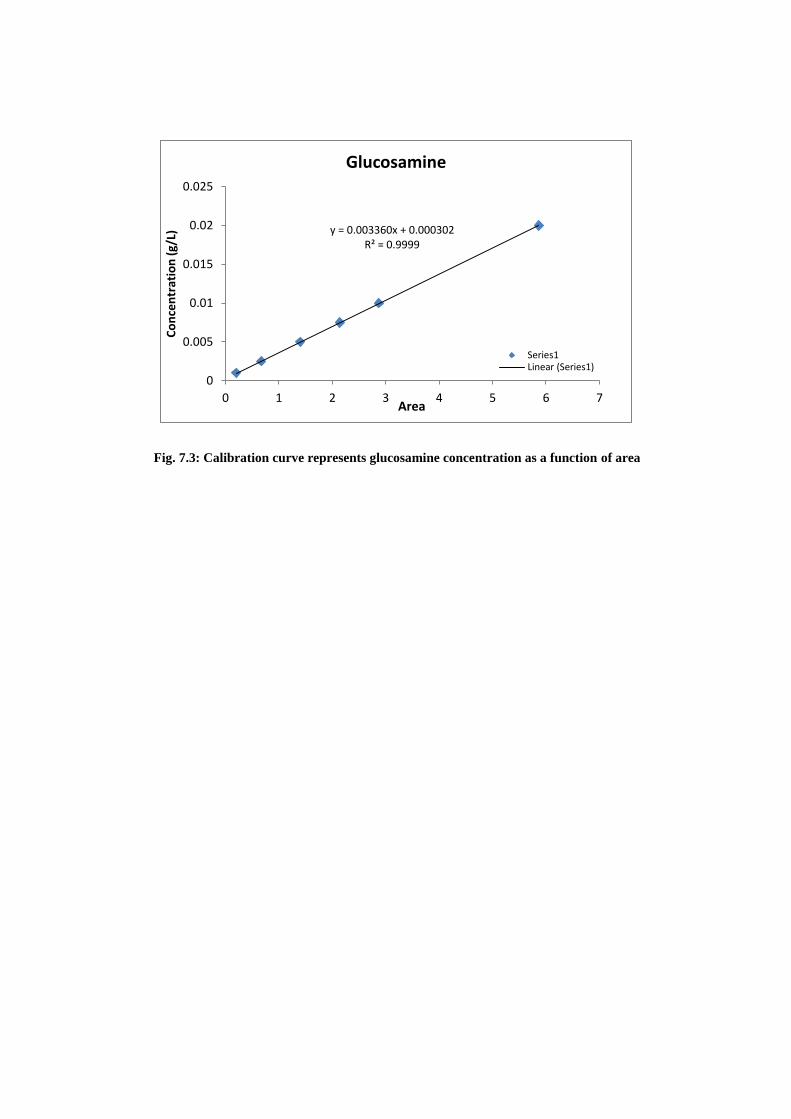
Fig. 7.3: Calibration curve represents glucosamine concentration as a function of area
y = 0.003360x + 0.000302 R² = 0.9999
0
0.005
0.01
0.015
0.02
0.025
0 1 2 3 4 5 6 7
Co
nce
ntr
atio
n (
g/L)
Area
Glucosamine
Series1Linear (Series1)
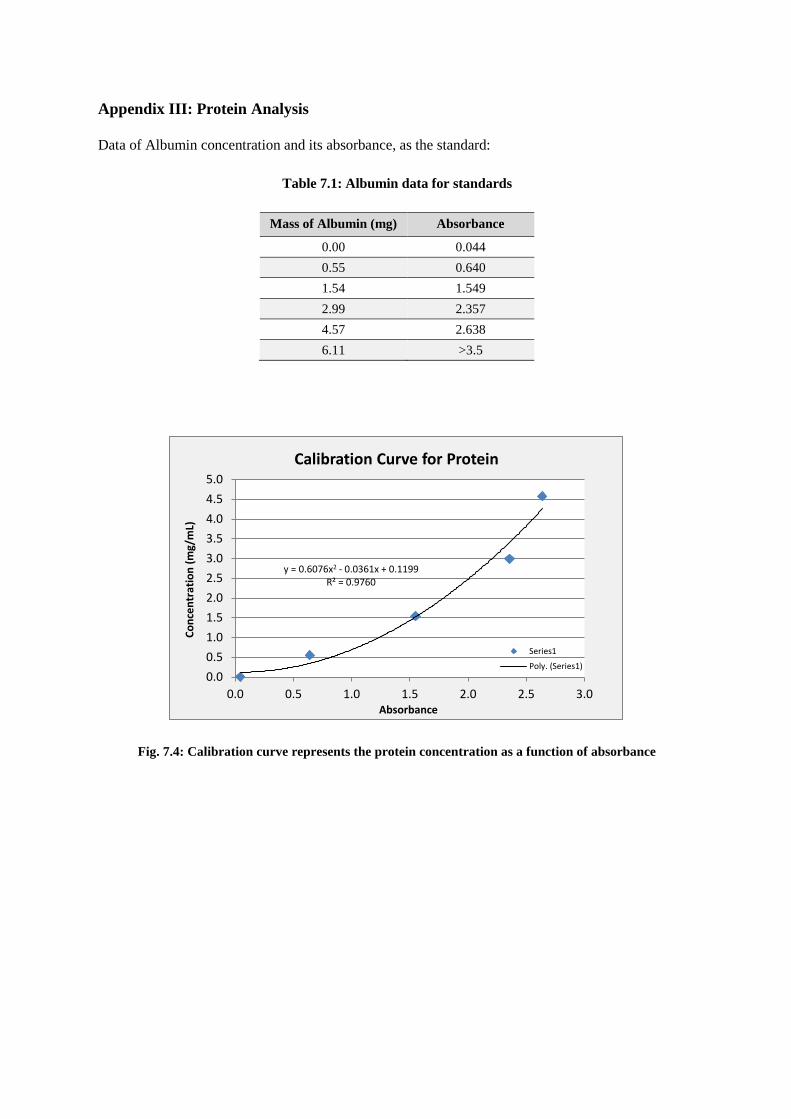
Appendix III: Protein Analysis
Data of Albumin concentration and its absorbance, as the standard:
Table 7.1: Albumin data for standards
Mass of Albumin (mg) Absorbance
0.00 0.044
0.55 0.640
1.54 1.549
2.99 2.357
4.57 2.638
6.11 >3.5
Fig. 7.4: Calibration curve represents the protein concentration as a function of absorbance
y = 0.6076x2 - 0.0361x + 0.1199 R² = 0.9760
0.0
0.5
1.0
1.5
2.0
2.5
3.0
3.5
4.0
4.5
5.0
0.0 0.5 1.0 1.5 2.0 2.5 3.0
Co
nce
ntr
atio
n (
mg/
mL)
Absorbance
Calibration Curve for Protein
Series1
Poly. (Series1)
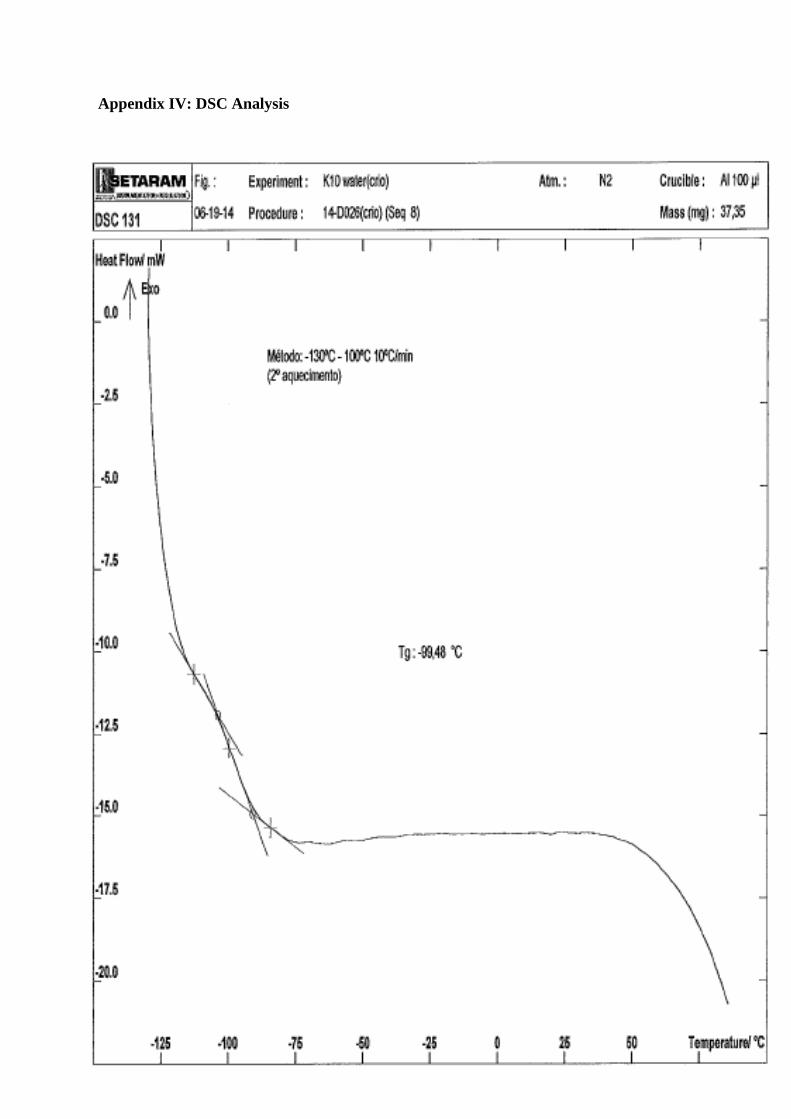
Appendix IV: DSC Analysis
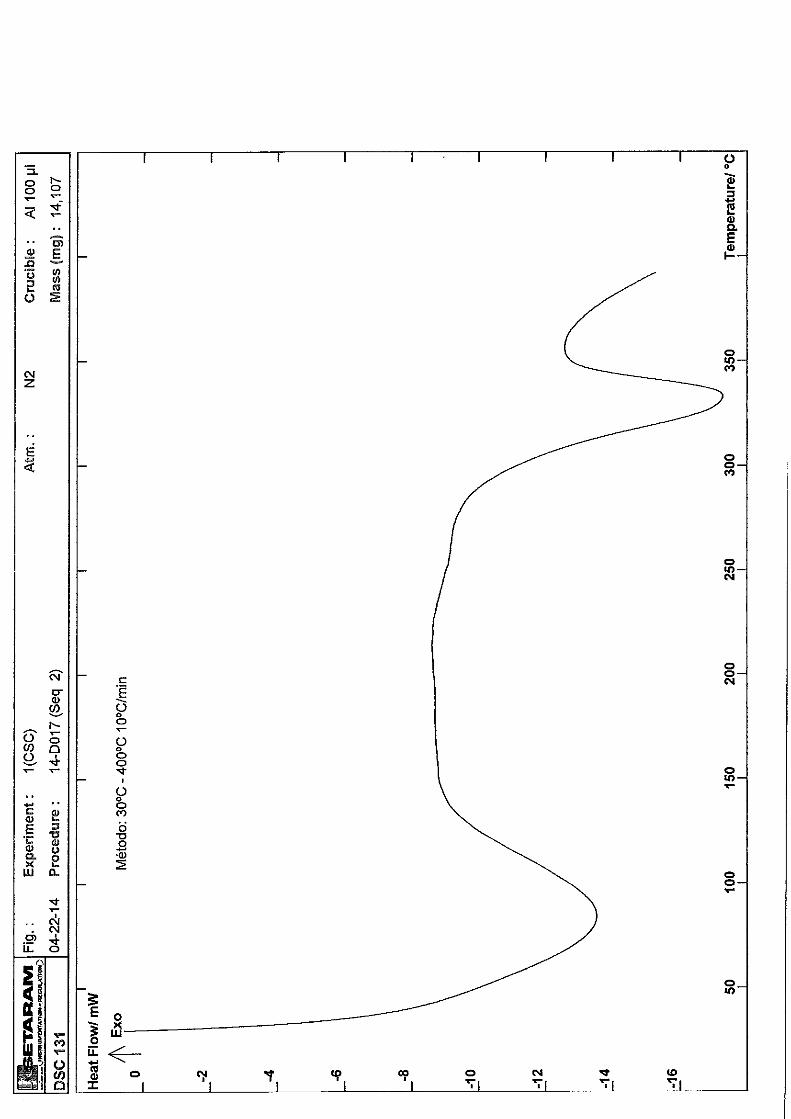
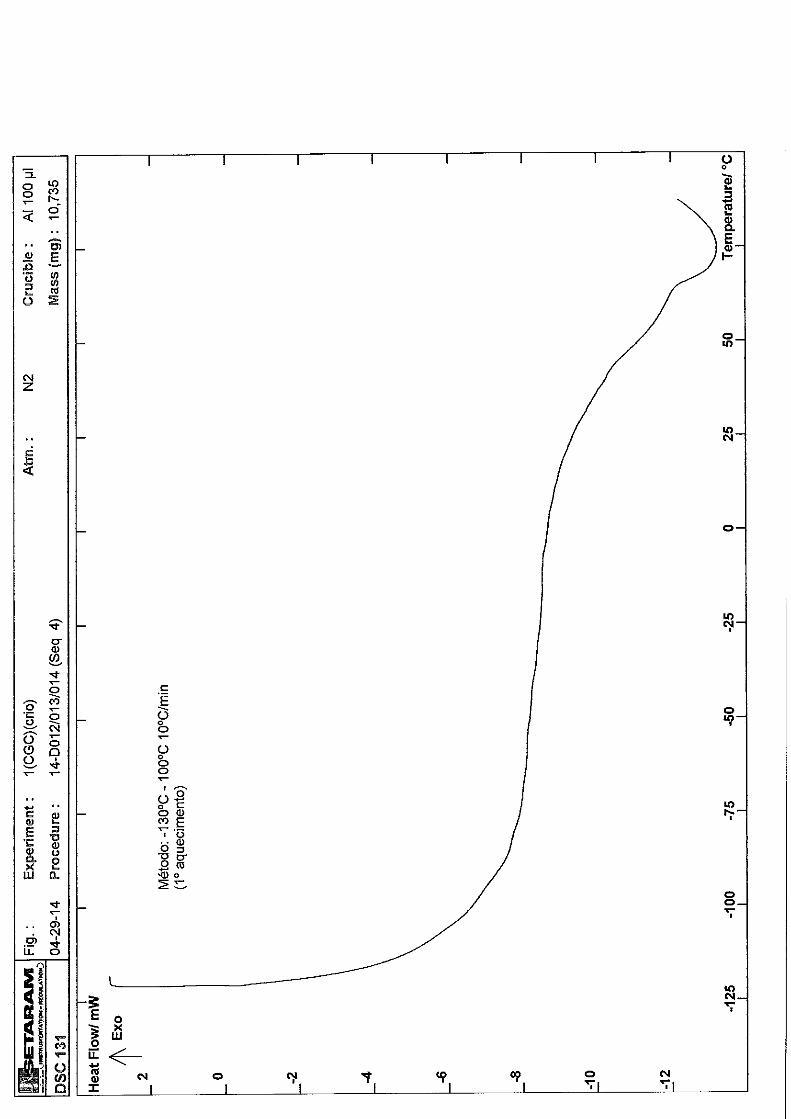
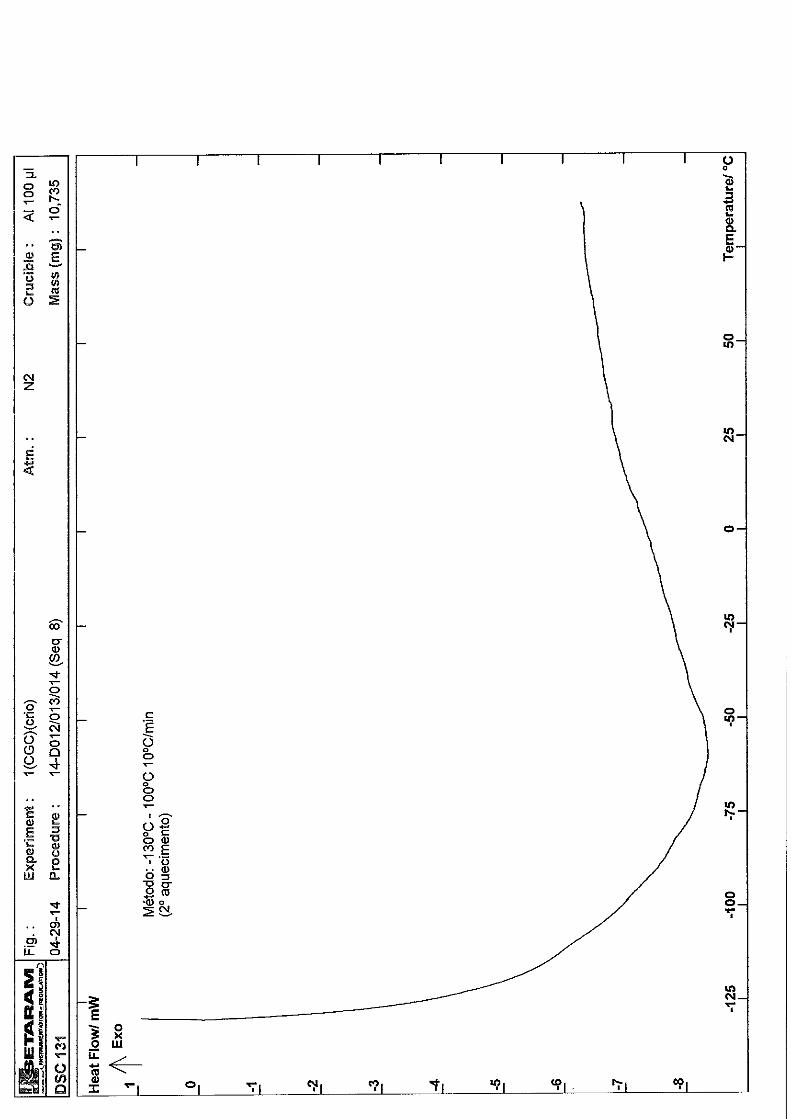
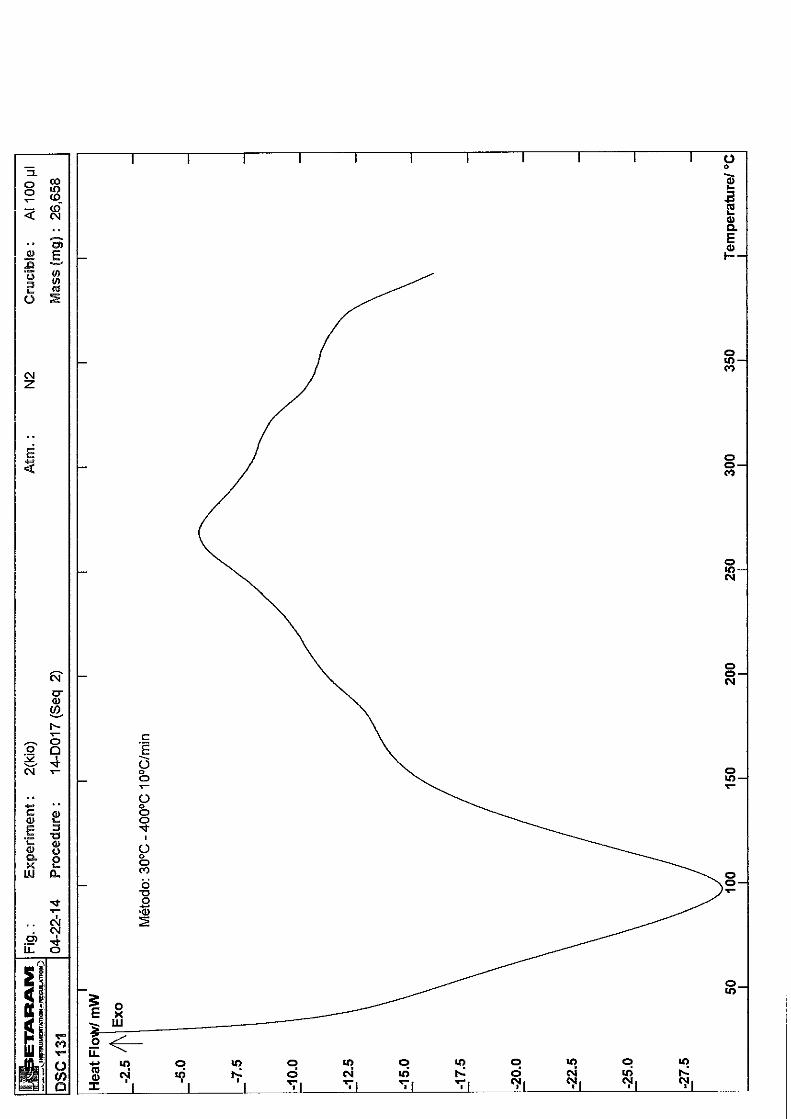

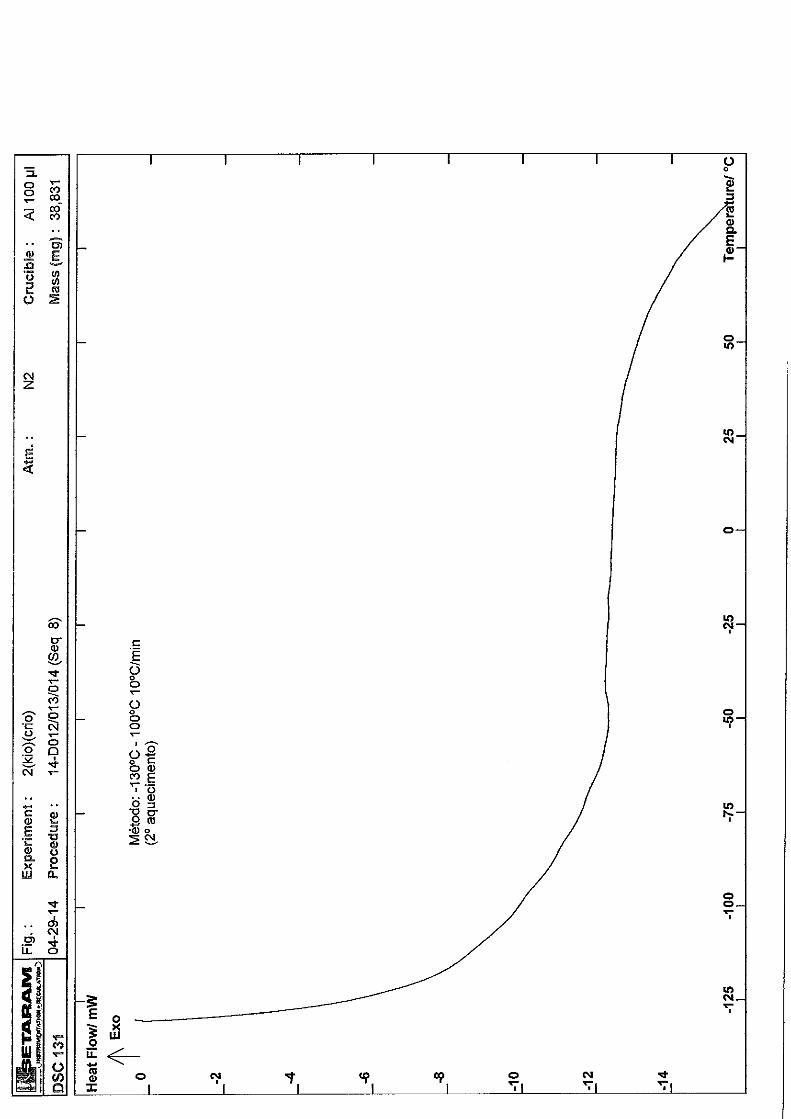
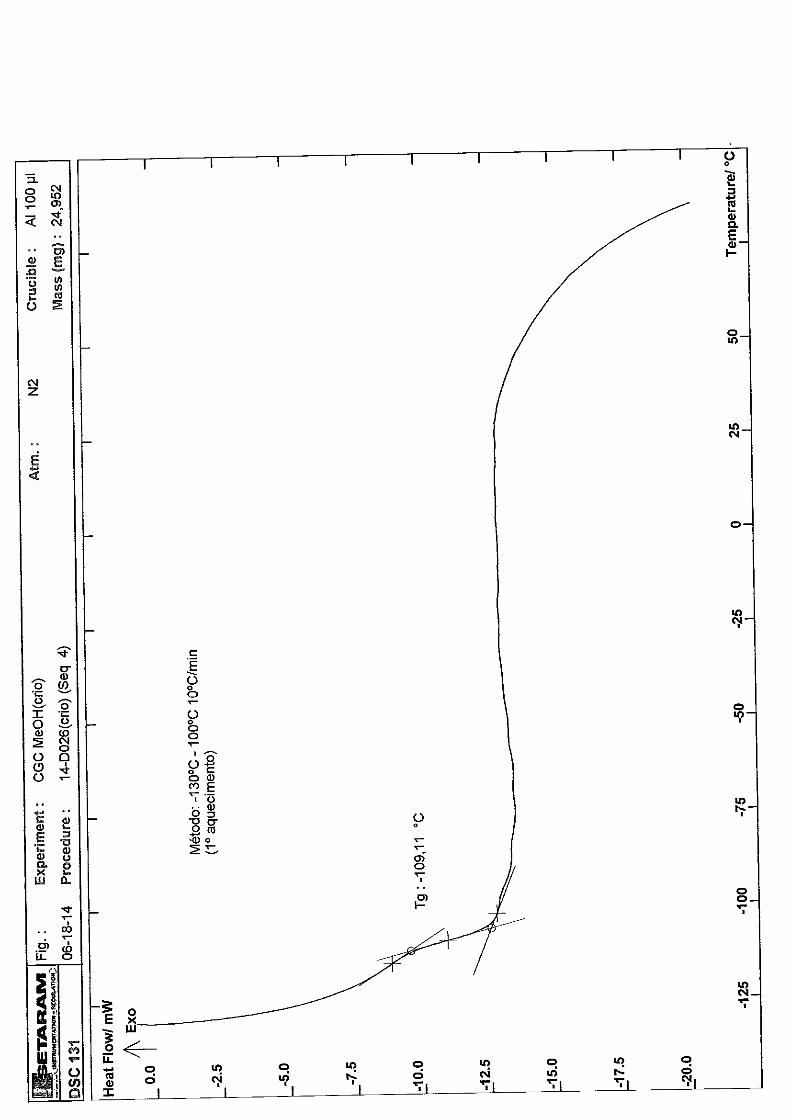
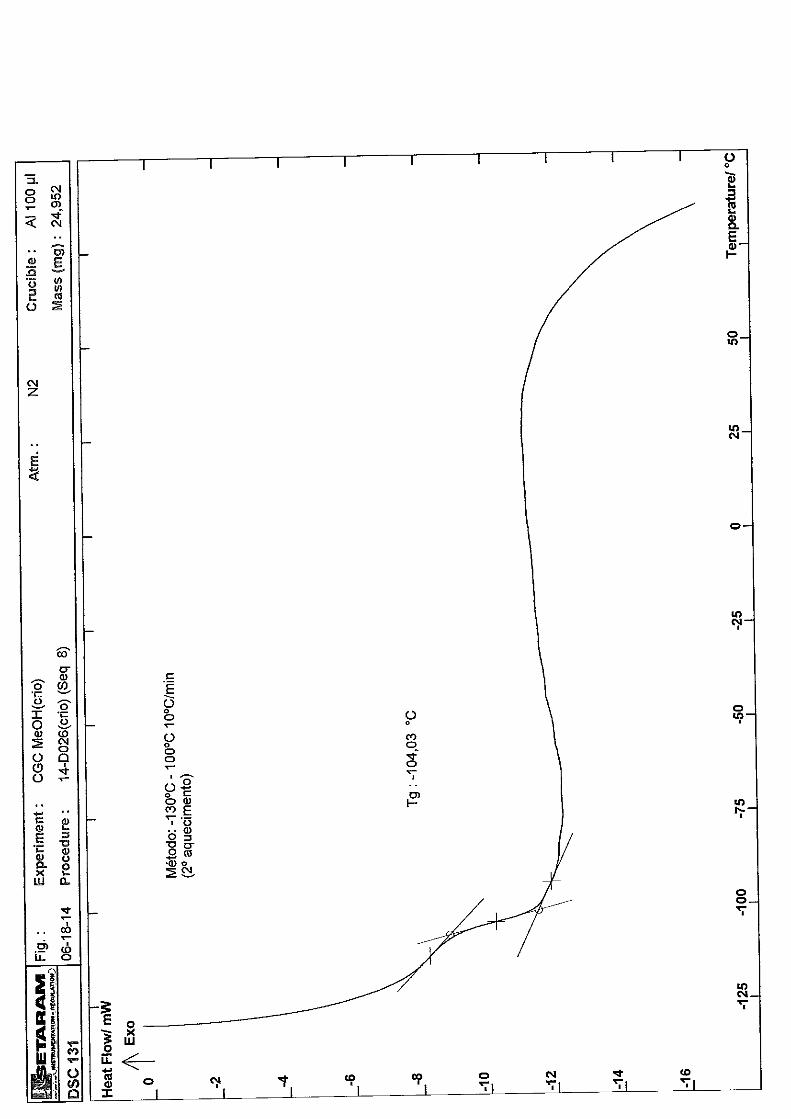
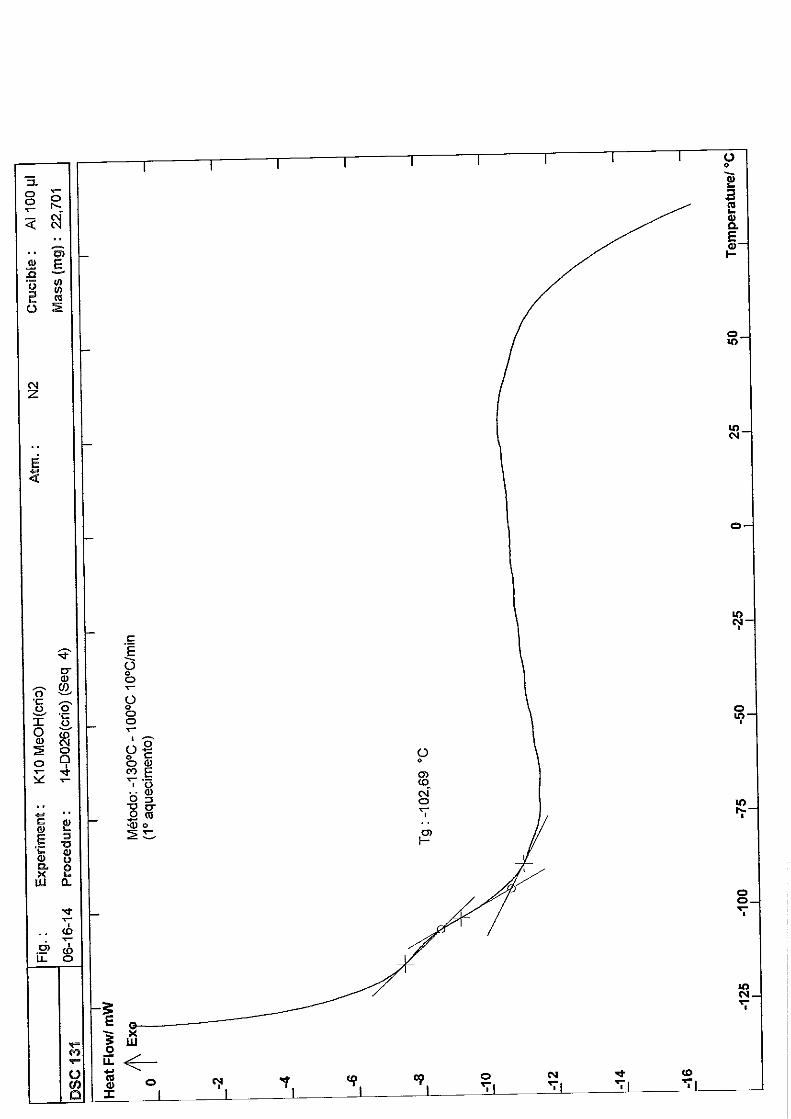
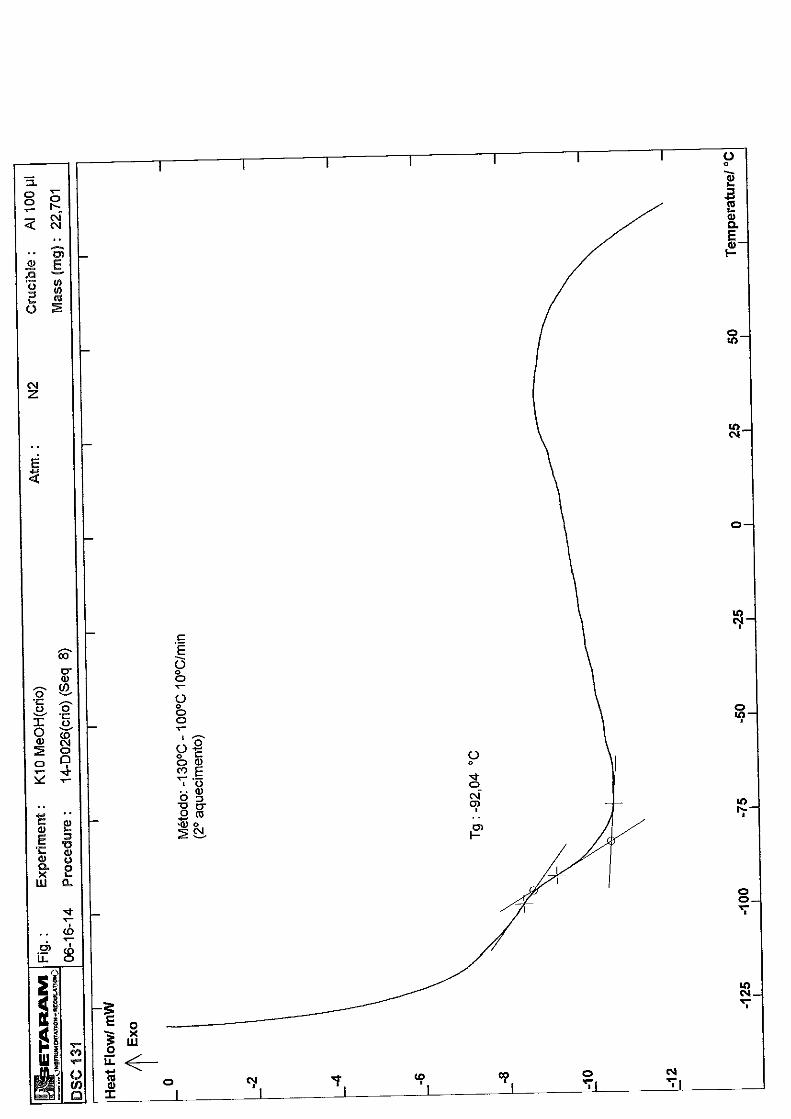
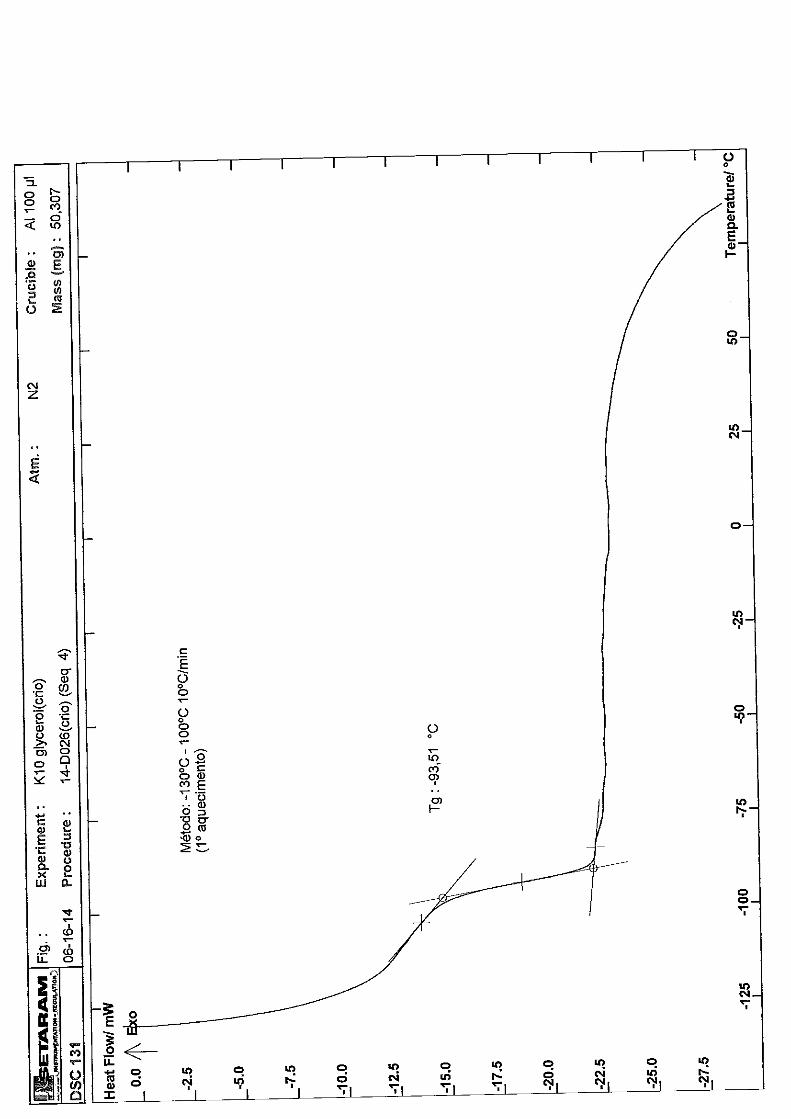
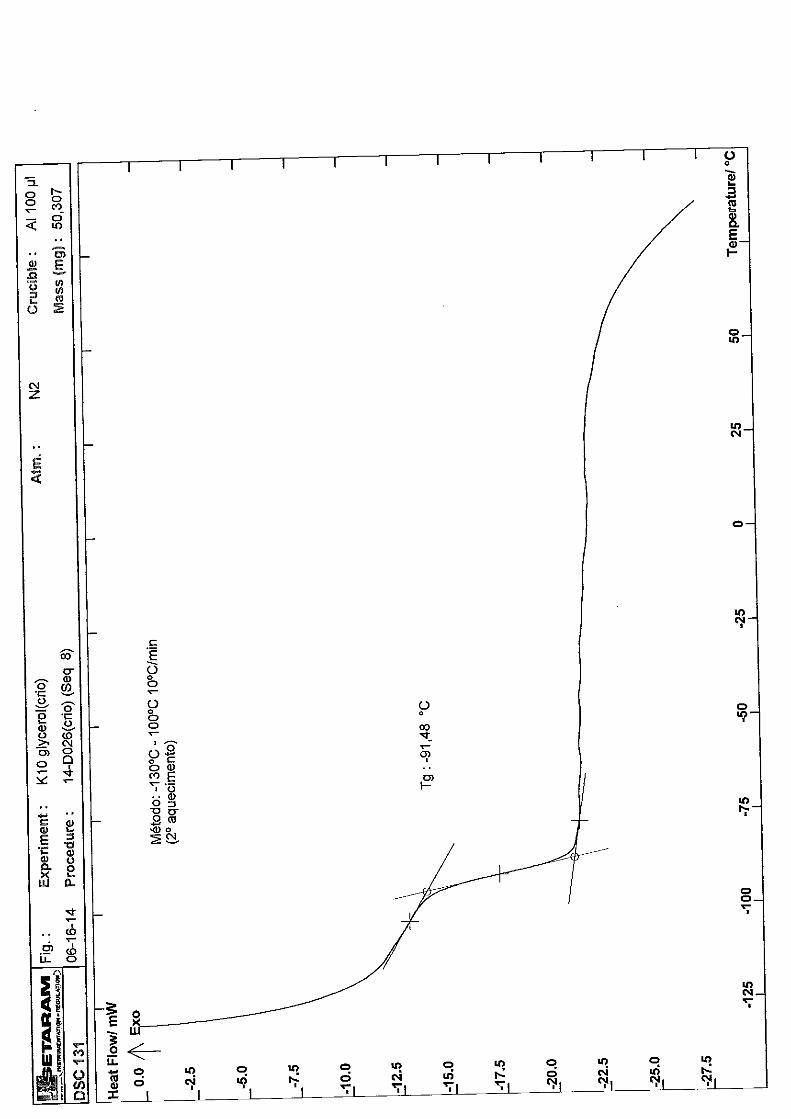
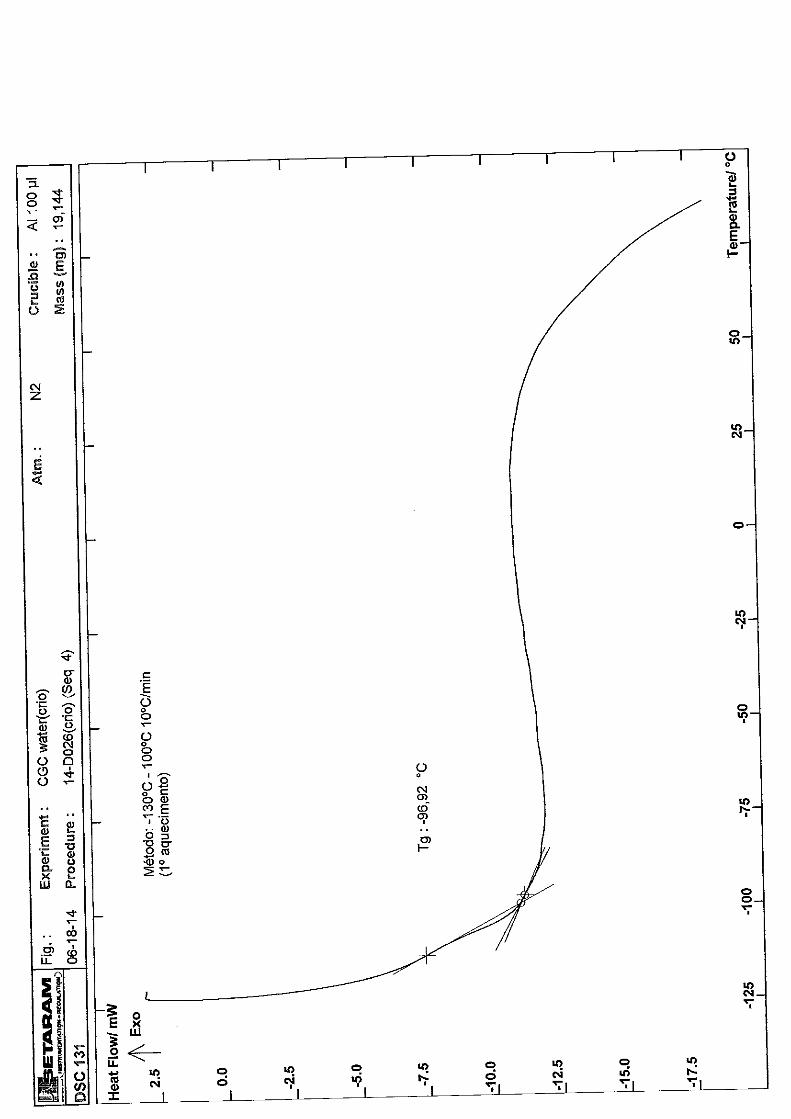

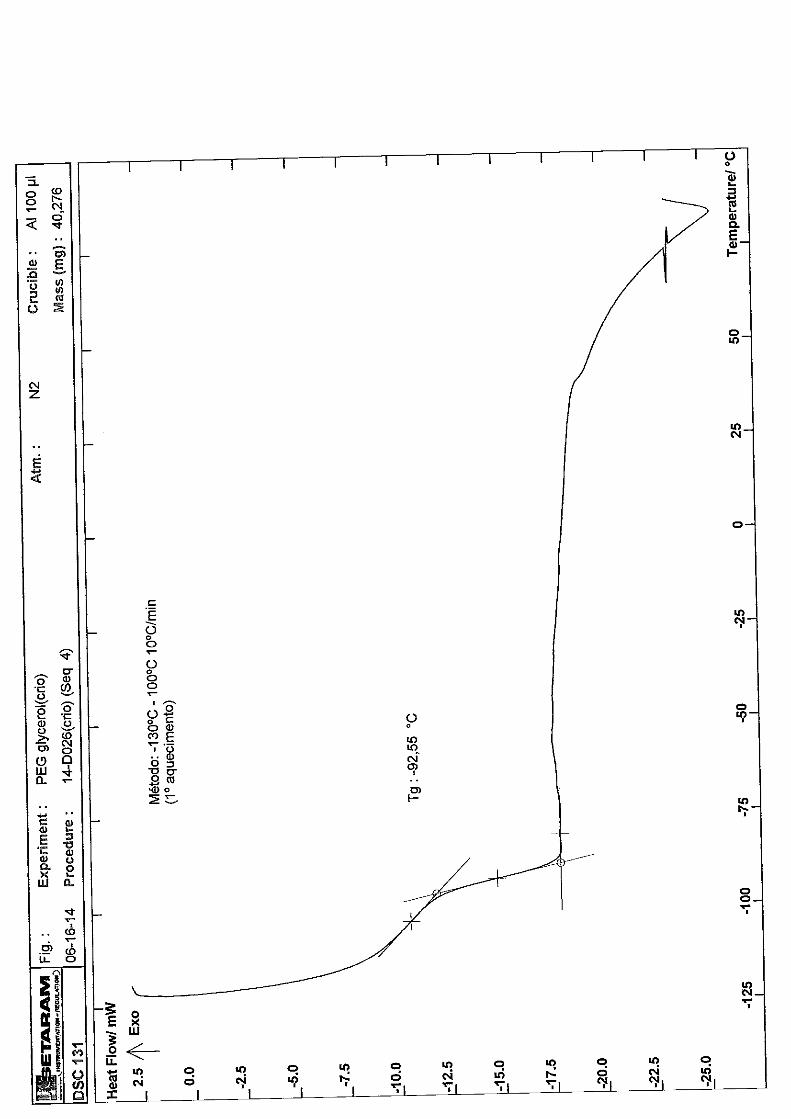
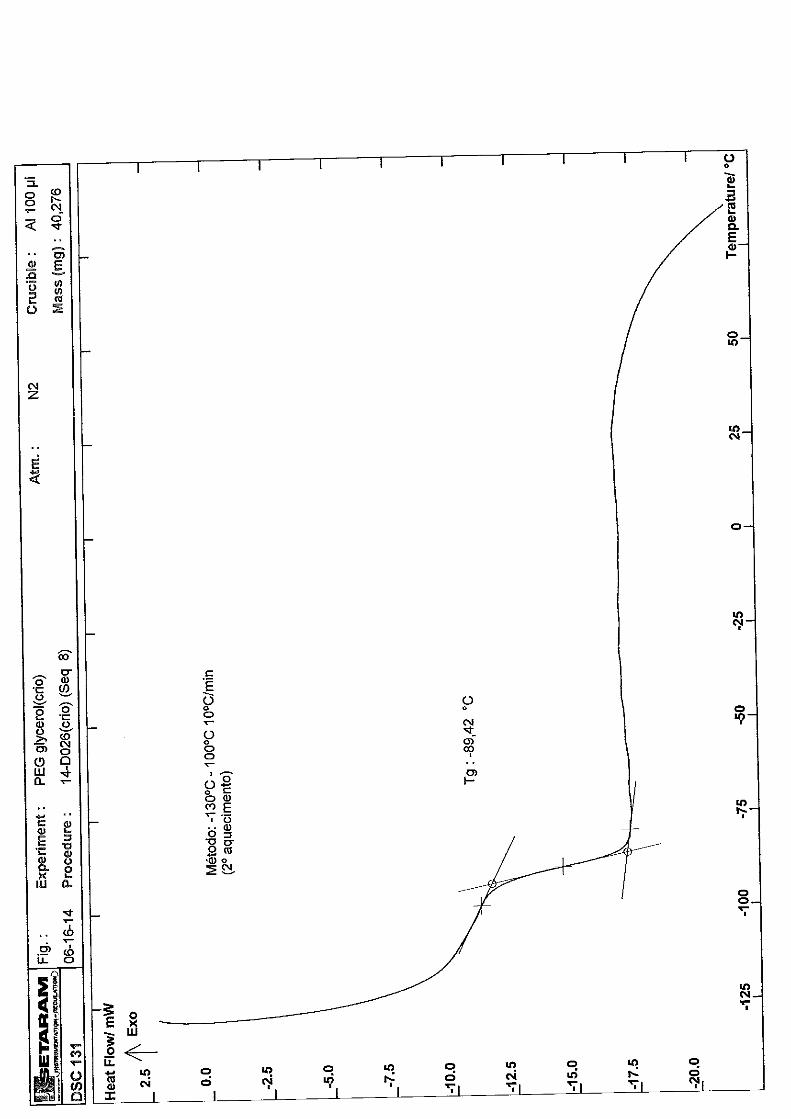
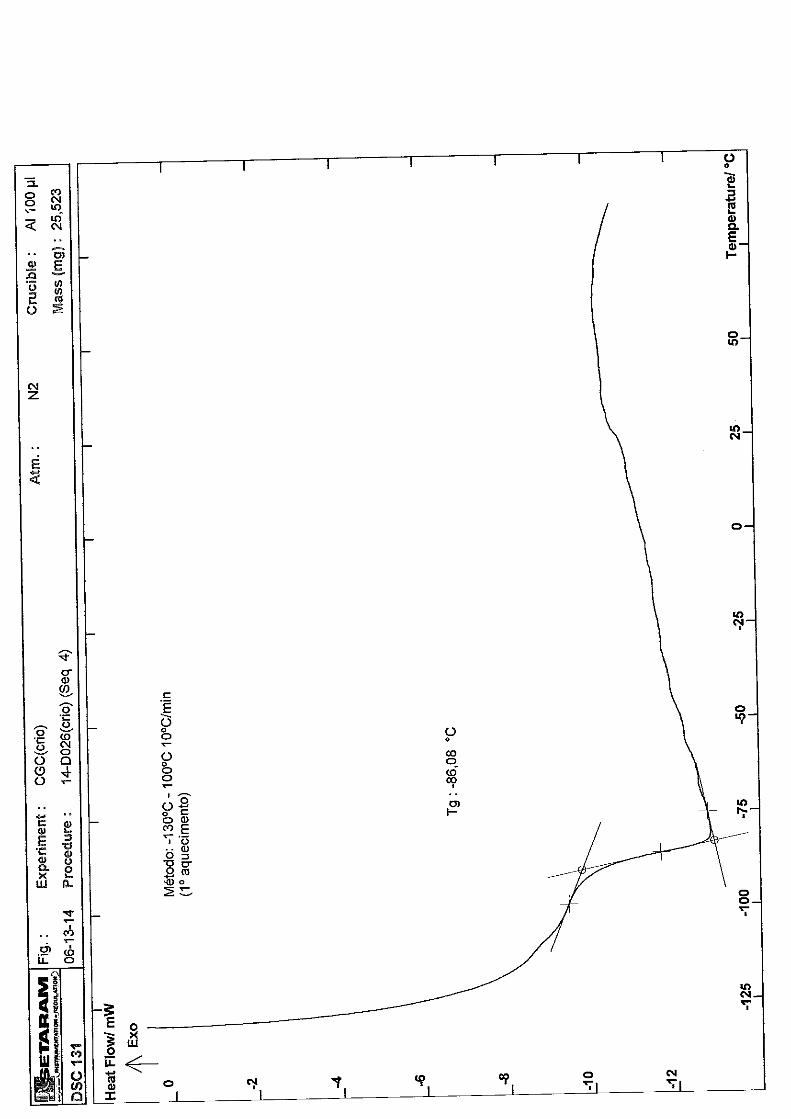
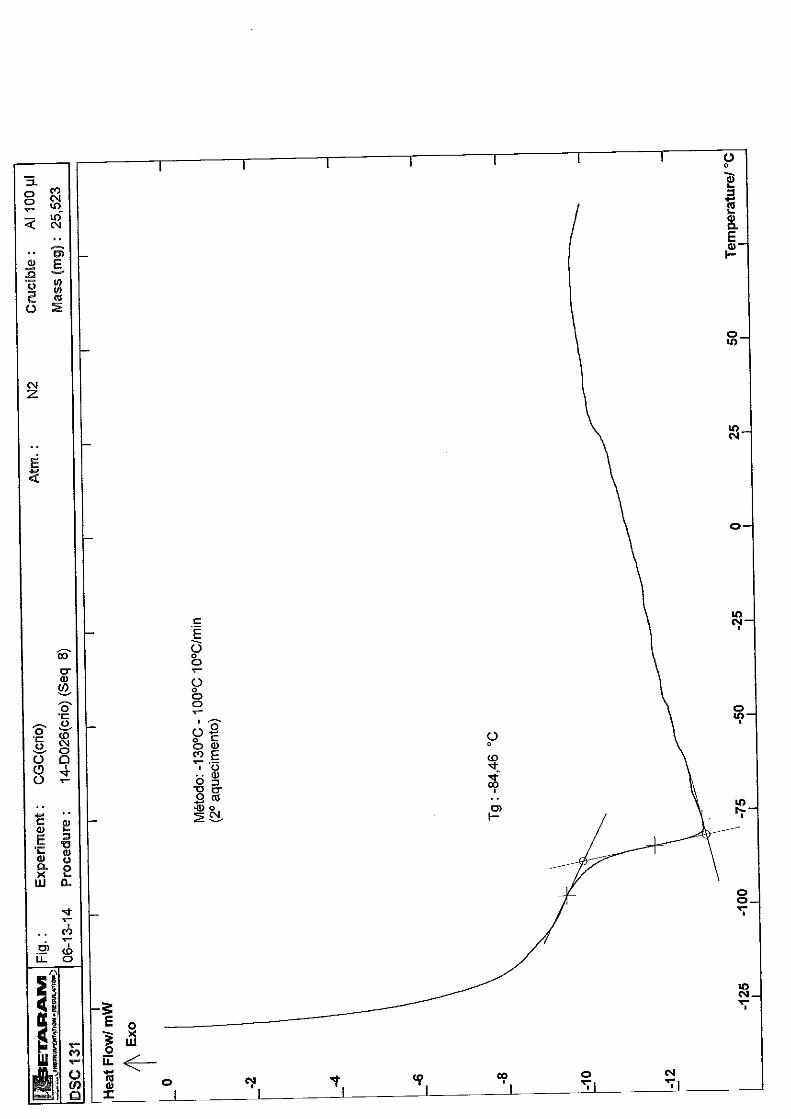
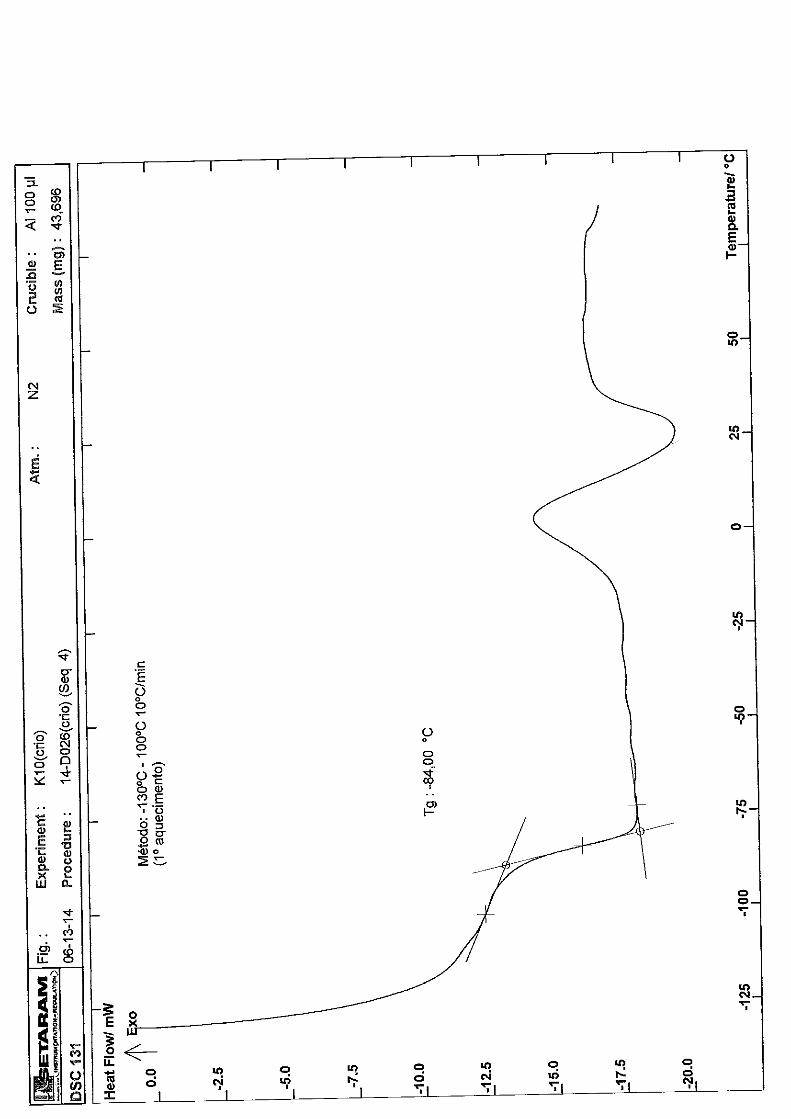
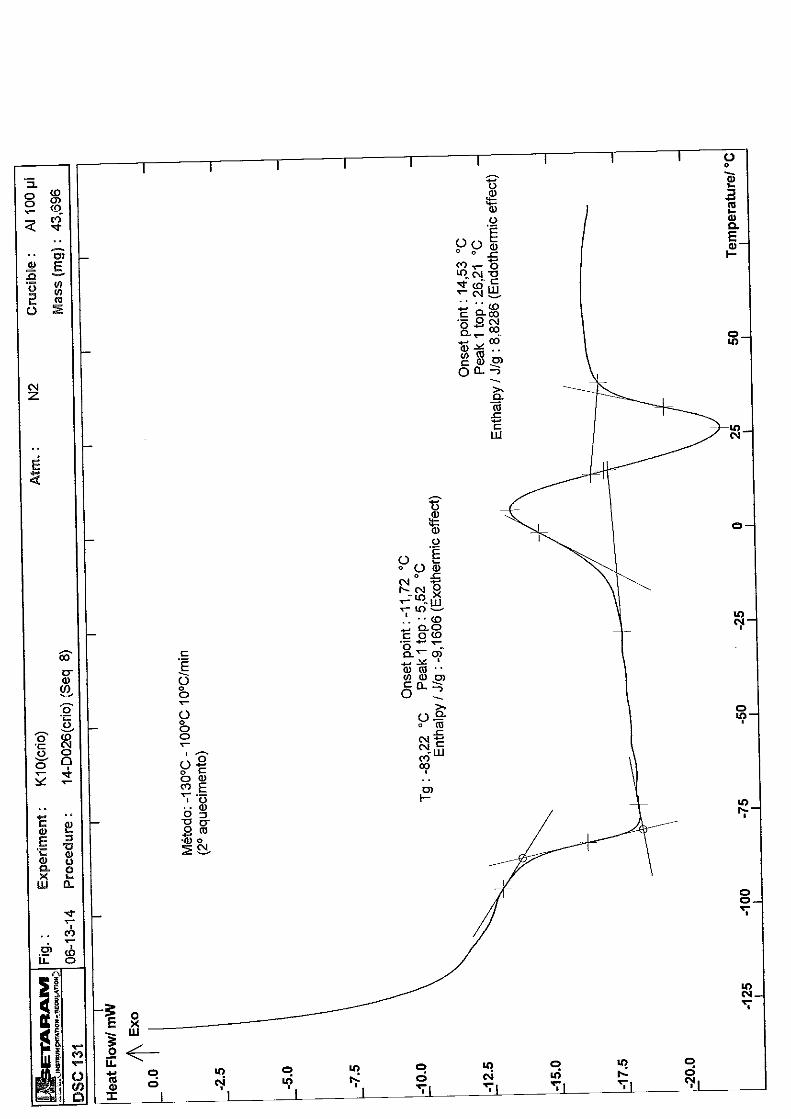
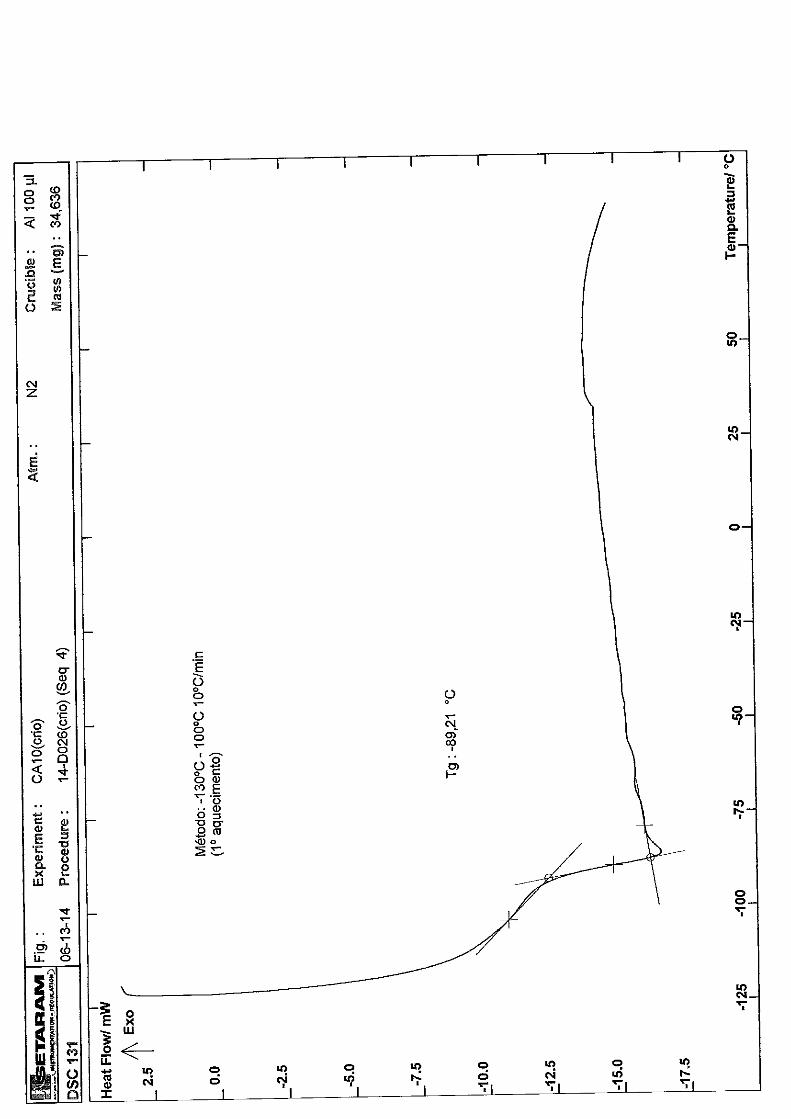
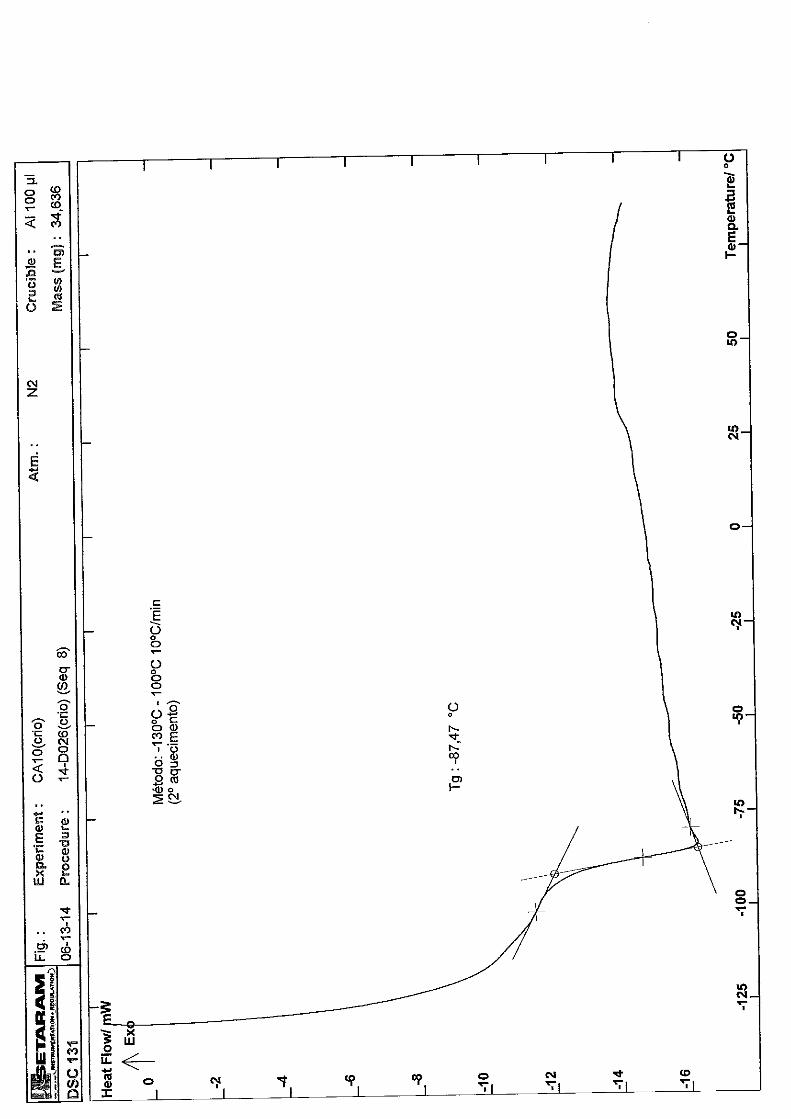
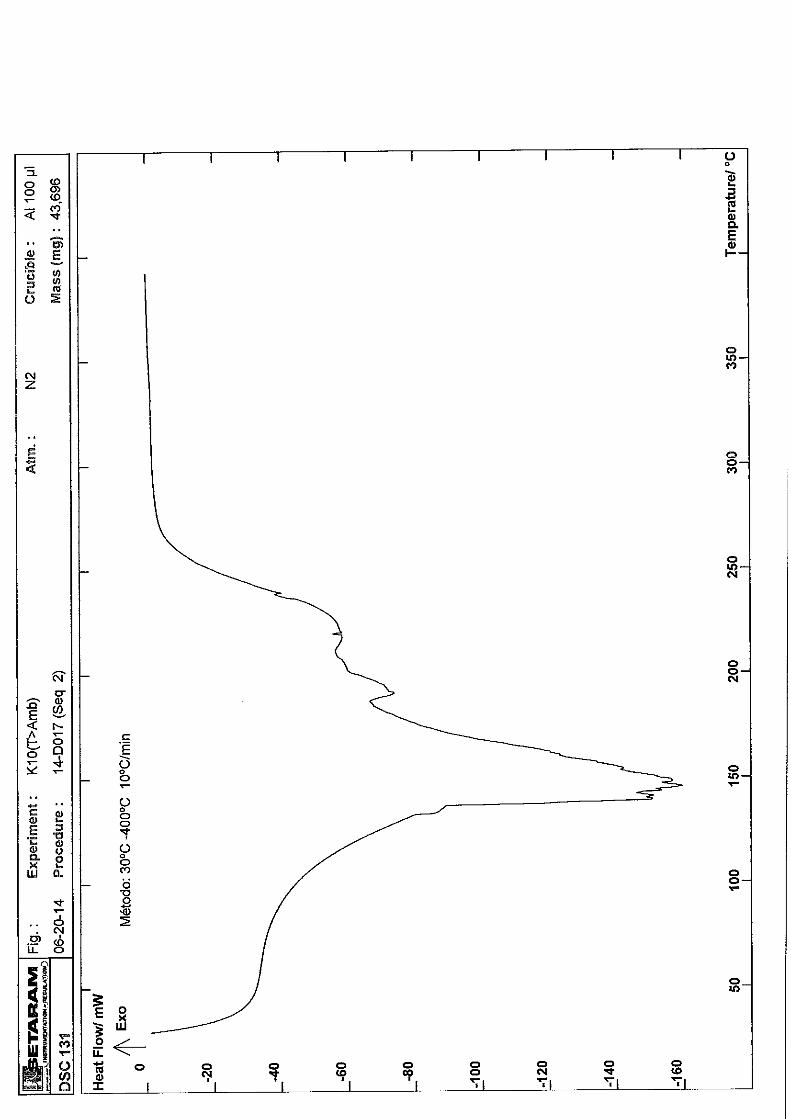
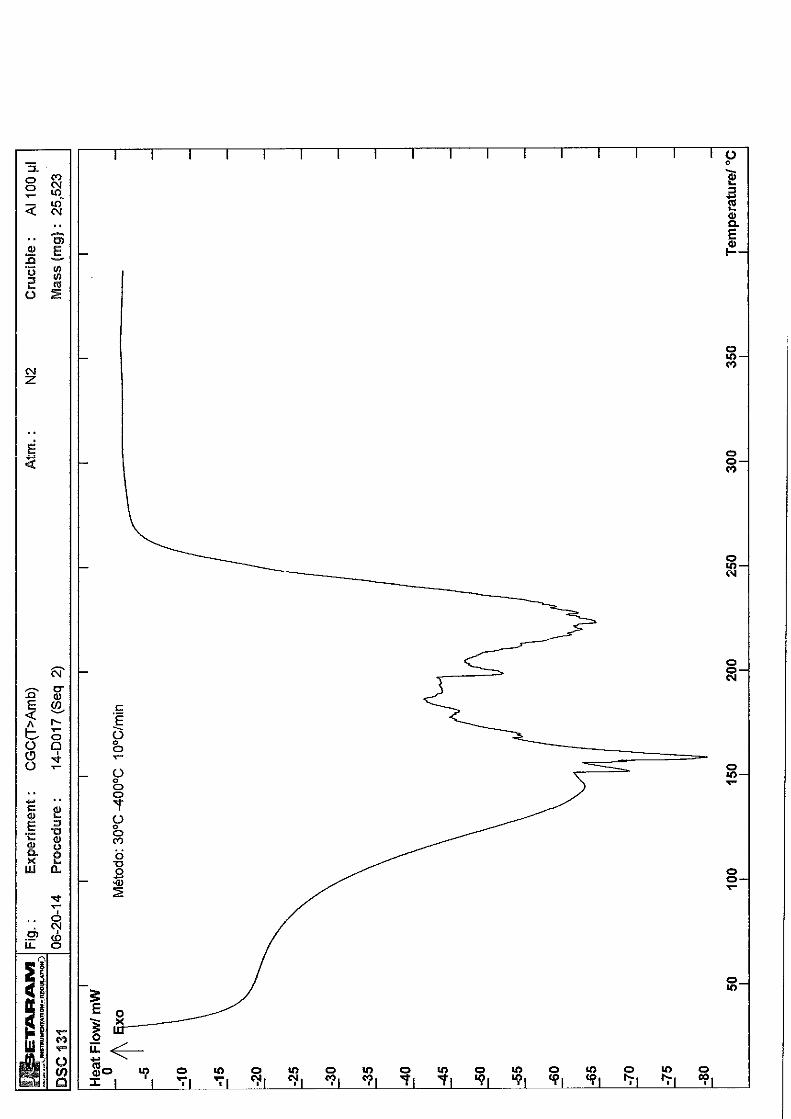
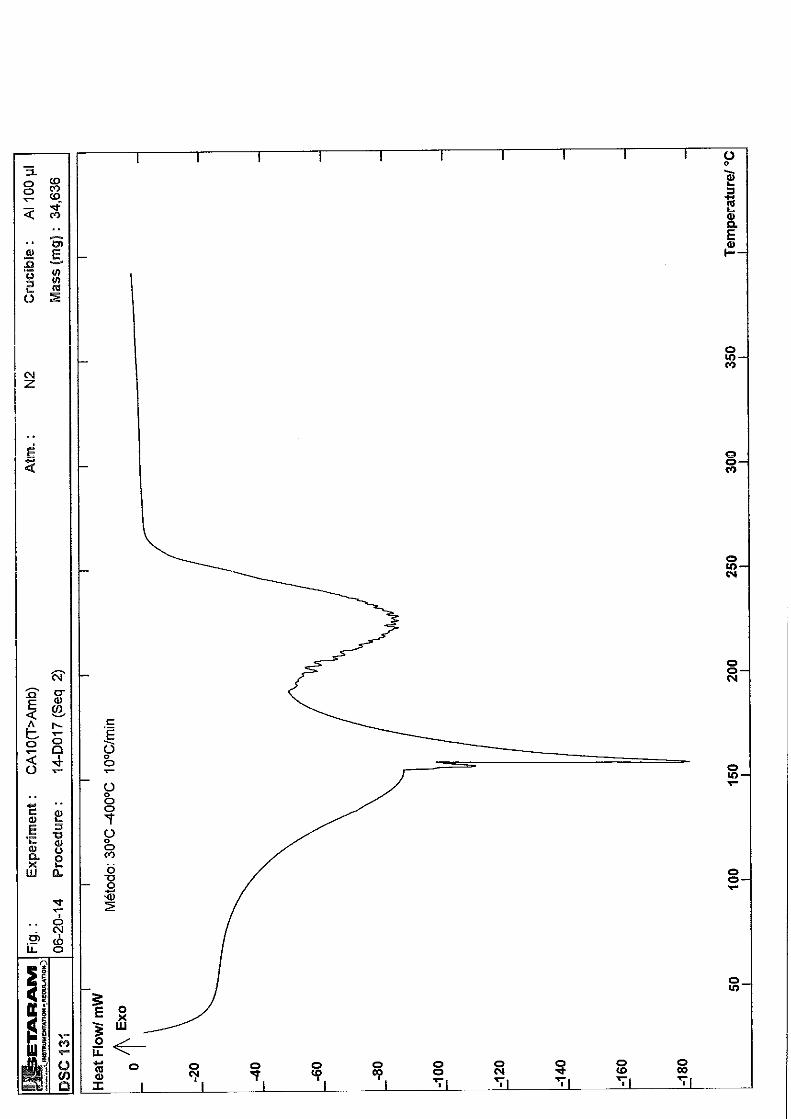
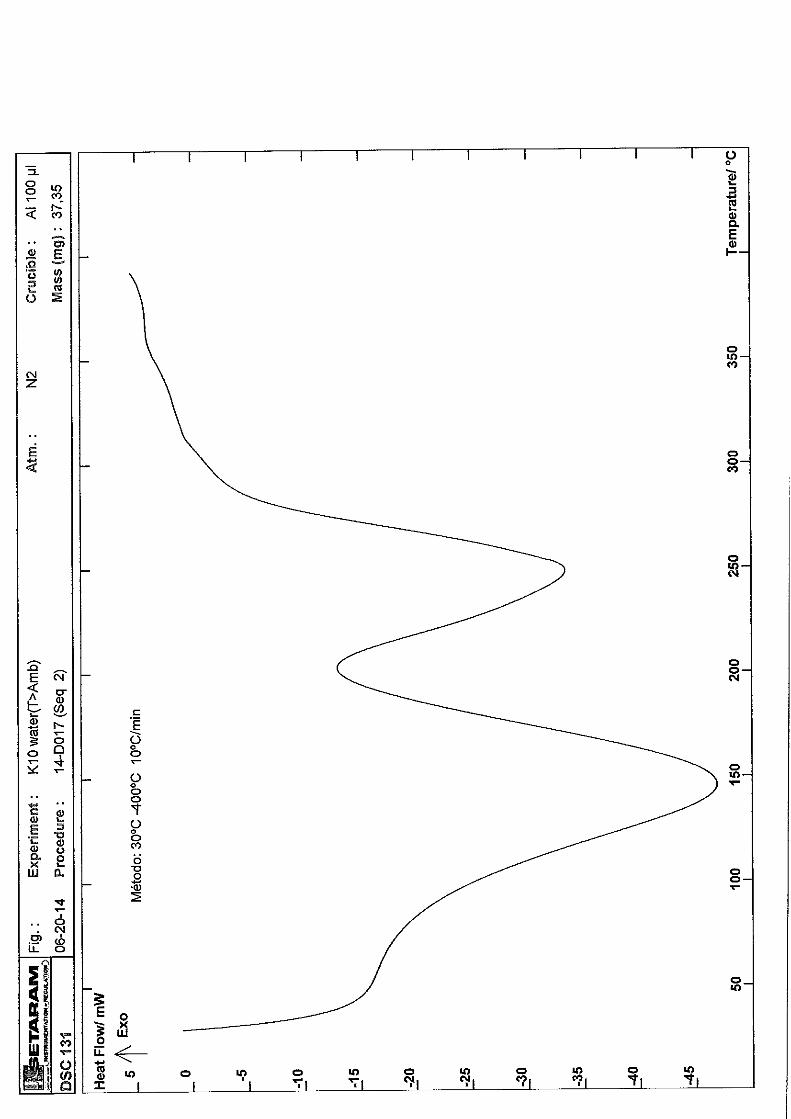
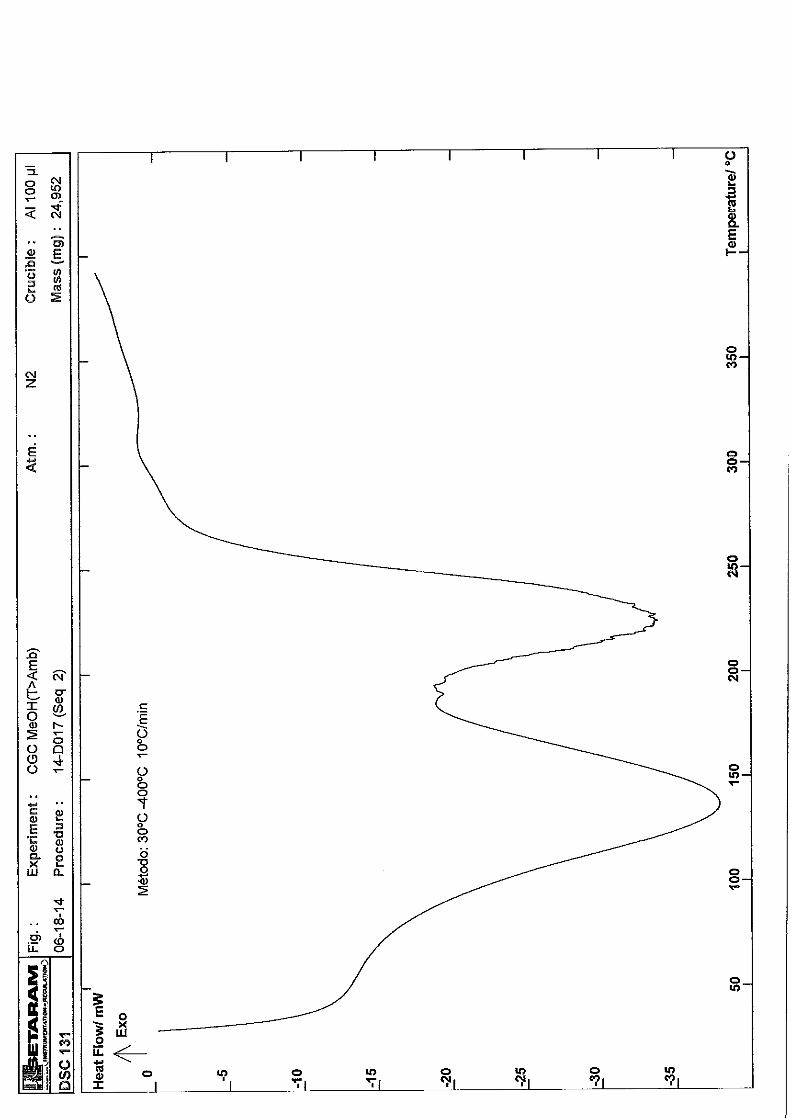
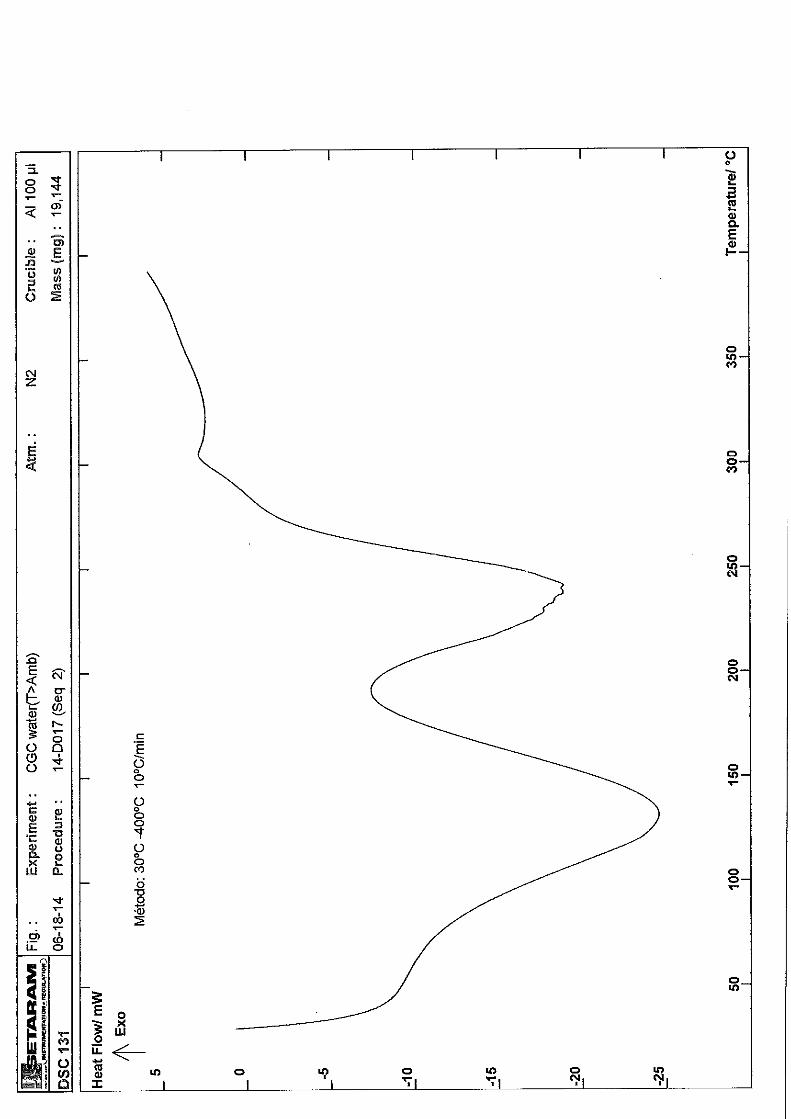
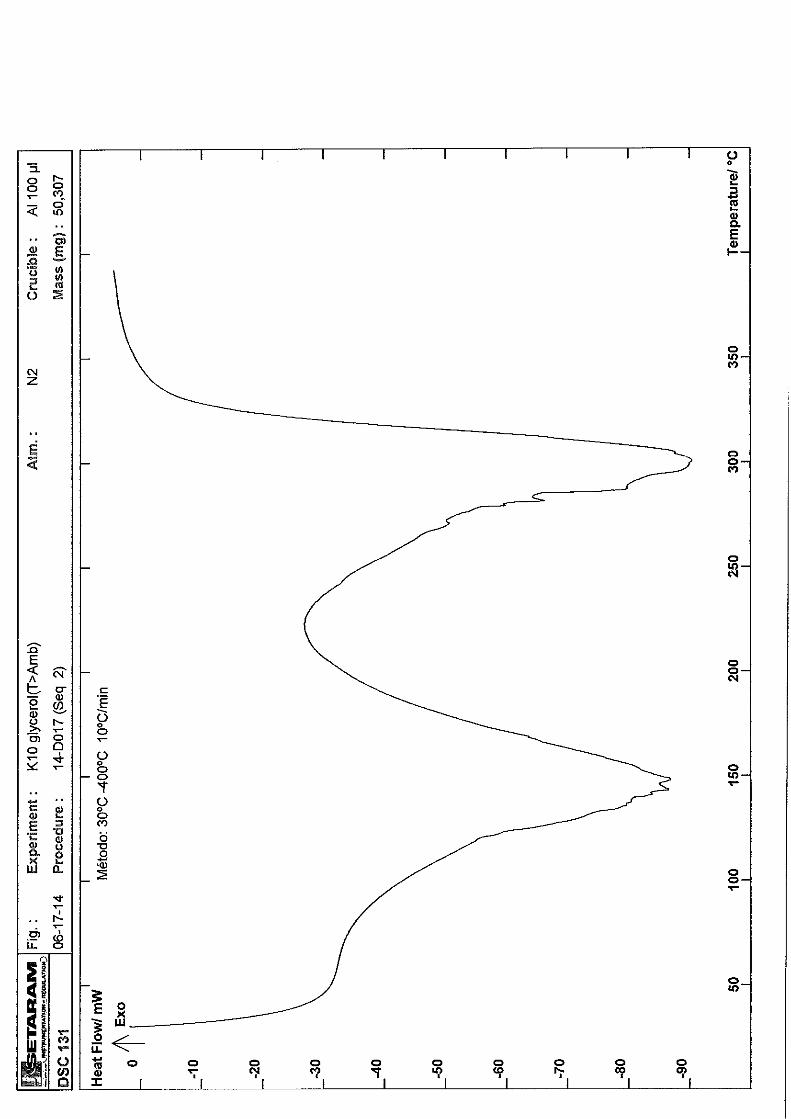
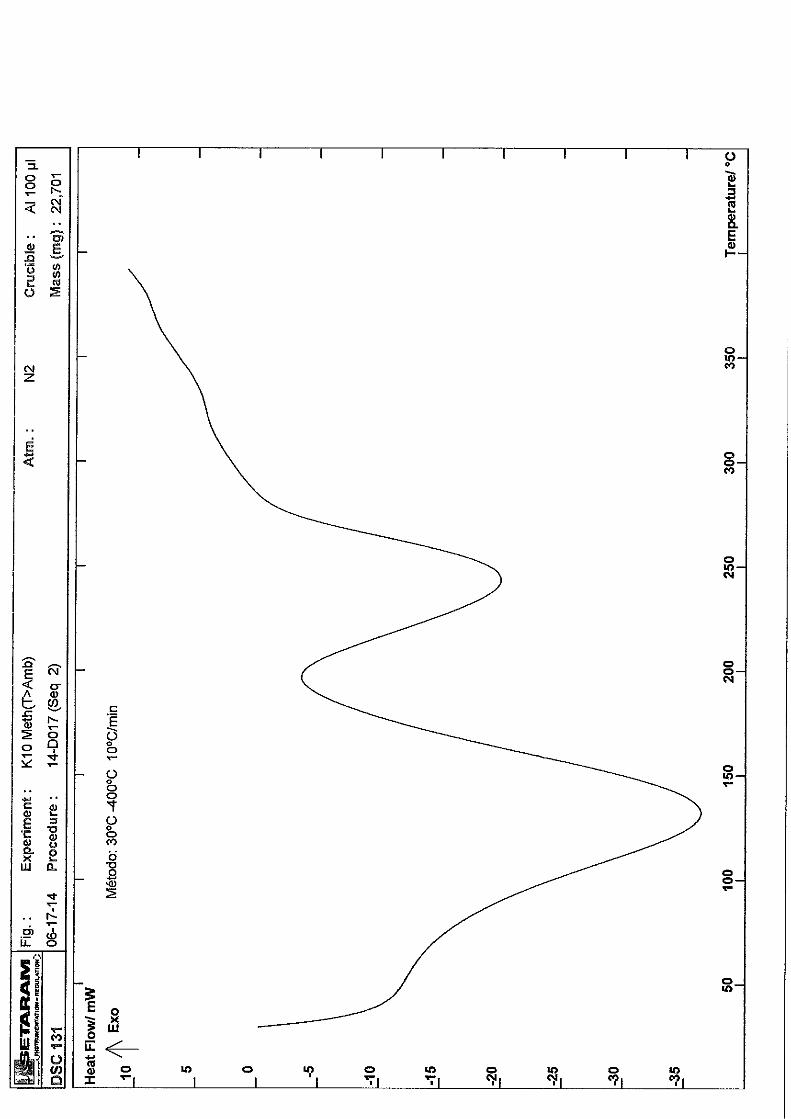
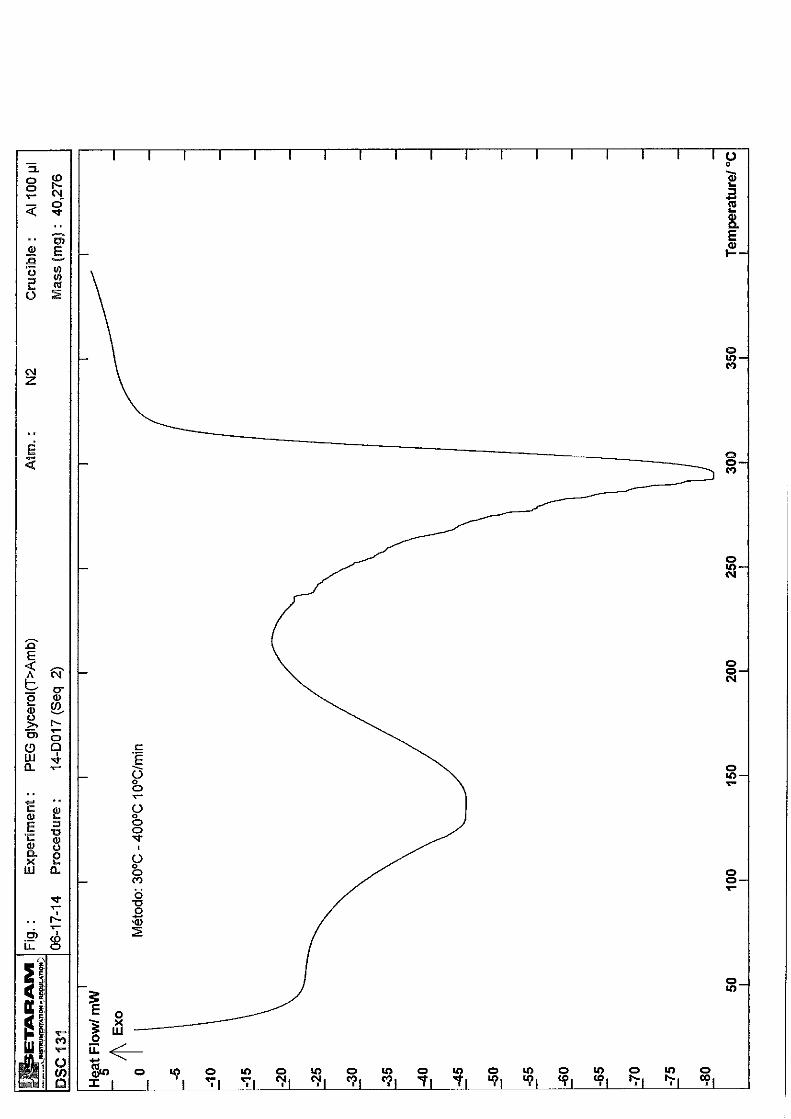
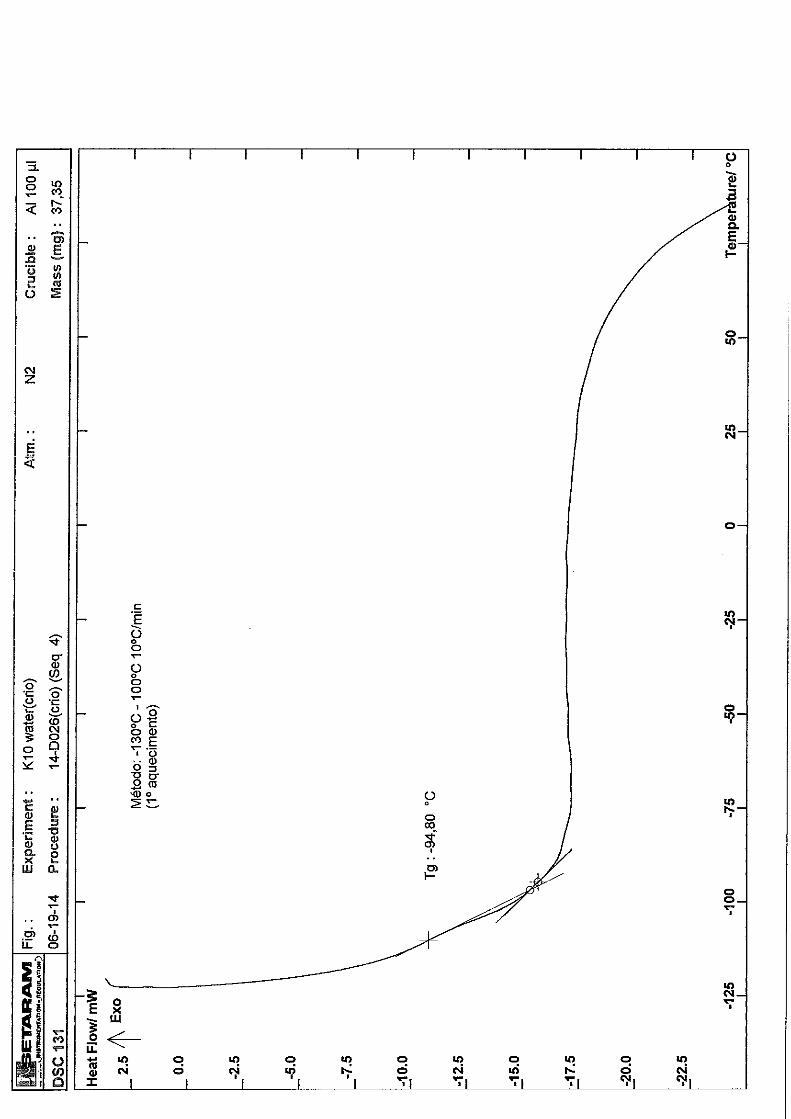
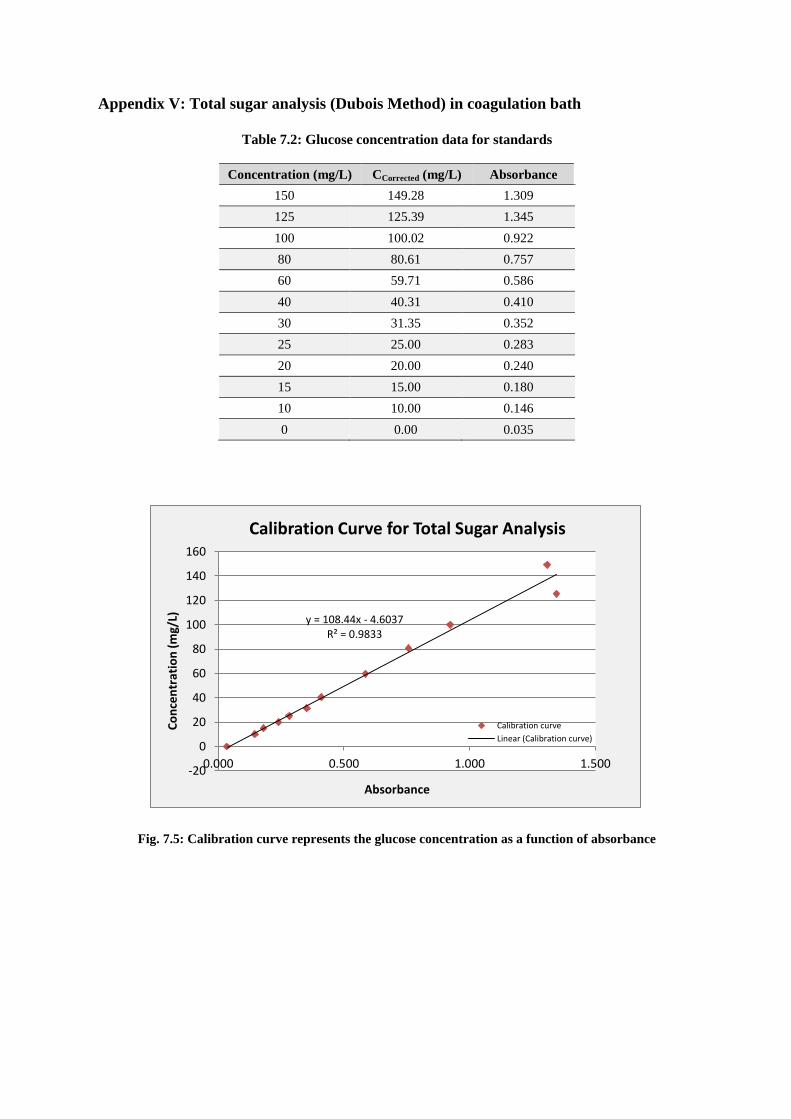
Appendix V: Total sugar analysis (Dubois Method) in coagulation bath
Table 7.2: Glucose concentration data for standards
Concentration (mg/L) CCorrected (mg/L) Absorbance
150 149.28 1.309
125 125.39 1.345
100 100.02 0.922
80 80.61 0.757
60 59.71 0.586
40 40.31 0.410
30 31.35 0.352
25 25.00 0.283
20 20.00 0.240
15 15.00 0.180
10 10.00 0.146
0 0.00 0.035
Fig. 7.5: Calibration curve represents the glucose concentration as a function of absorbance
y = 108.44x - 4.6037 R² = 0.9833
-20
0
20
40
60
80
100
120
140
160
0.000 0.500 1.000 1.500
Co
nce
ntr
atio
n (
mg/
L)
Absorbance
Calibration Curve for Total Sugar Analysis
Calibration curve
Linear (Calibration curve)
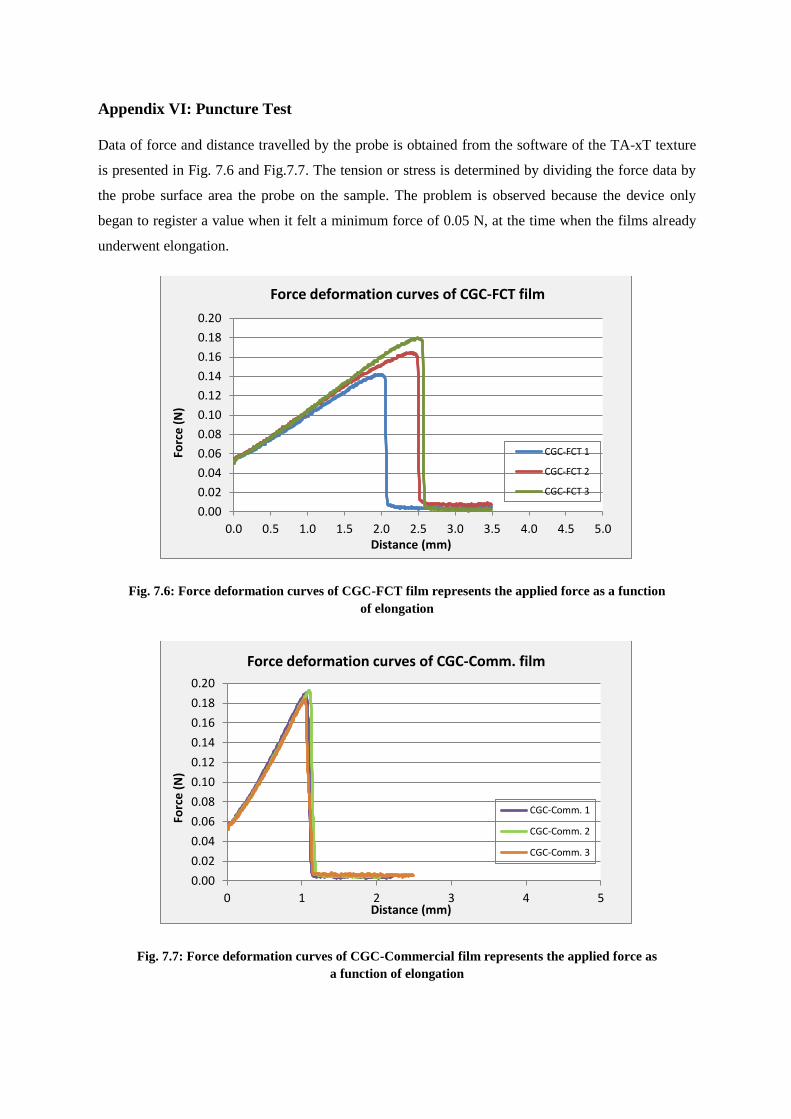
Appendix VI: Puncture Test
Data of force and distance travelled by the probe is obtained from the software of the TA-xT texture
is presented in Fig. 7.6 and Fig.7.7. The tension or stress is determined by dividing the force data by
the probe surface area the probe on the sample. The problem is observed because the device only
began to register a value when it felt a minimum force of 0.05 N, at the time when the films already
underwent elongation.
Fig. 7.6: Force deformation curves of CGC-FCT film represents the applied force as a function
of elongation
Fig. 7.7: Force deformation curves of CGC-Commercial film represents the applied force as
a function of elongation
0.00
0.02
0.04
0.06
0.08
0.10
0.12
0.14
0.16
0.18
0.20
0.0 0.5 1.0 1.5 2.0 2.5 3.0 3.5 4.0 4.5 5.0
Forc
e (
N)
Distance (mm)
Force deformation curves of CGC-FCT film
CGC-FCT 1
CGC-FCT 2
CGC-FCT 3
0.00
0.02
0.04
0.06
0.08
0.10
0.12
0.14
0.16
0.18
0.20
0 1 2 3 4 5
Forc
e (
N)
Distance (mm)
Force deformation curves of CGC-Comm. film
CGC-Comm. 1
CGC-Comm. 2
CGC-Comm. 3