Embed Size (px)
Citation preview
Abstract—A load monitoring energy meter has been
presented in this paper. The watt-meter monitors the electrical
energy consumed by the consumer’s load. The Arduino uno,
current sensor, voltage sensing circuit, keypad and LCD are
the major building blocks of this project. The electric load
power is displayed in watts, and the cost of running a
particular load for a given period of time can be determined by
the user by inputting the duration of time (i.e. number of
hours) the load is to run, using a keypad and the cost is
dependent on the programmed tariff plan. Designing a
programmable watt-meter involves the use of an Arduino Uno,
LCD (Liquid Crystal Display), voltage sensing circuit, YHDC
current sensor, and keypad.
Index Terms— Arduino uno, YHDC current- transformer,
20x4 LCD, Potential transformer
I. INTRODUCTION
NERGY crisis is a fundamental issue which has become
a source of concern in this present time. Interrupted and
unreliable electrical power supply has become a menace in
most third world countries. In this present day, some nations
with limited natural resources for generating their
electricity, use non-renewable energy sources such as gas,
are faced with the dilemma of changing their electricity
tariff rate, based on the cost of gas.
In some nations, the energy audit system is in a
deplorable state, and in some areas, public utility consumers
complain of the high electricity tariff rates, while in other
areas, electricity bills are issued at the end of the month
without the DISCO (Distribution company) carrying out a
comprehensive energy audit.
According to ISO50002, “An energy audit is a systematic
analysis of energy used and energy consumption within a
defined energy scope.” An energy audit is like an energy
assessment.
Therefore, to carry out an effective energy audit, there is the
need for a device capable of monitoring the load
consumption and is not prone to the mistakes which are
traceable to manual input. Hence, the need of a
Manuscript received June 23, 2018; revised August 18, 2018. The
authors wish to appreciate the Center for Research, Innovation, and
Discovery (CU-CRID) of Covenant University, Ota, Nigeria for funding
this research.
J.O. Olowoleni, C.O.A. Awosope, A.U. Adoghe, C.A. Okeke, and F.E.
Idachaba are with the Department of Electrical and Information
Engineering, Covenant University, Ota, Nigeria. (E-mail:
programmable energy meter.
II. METHODOLOGY
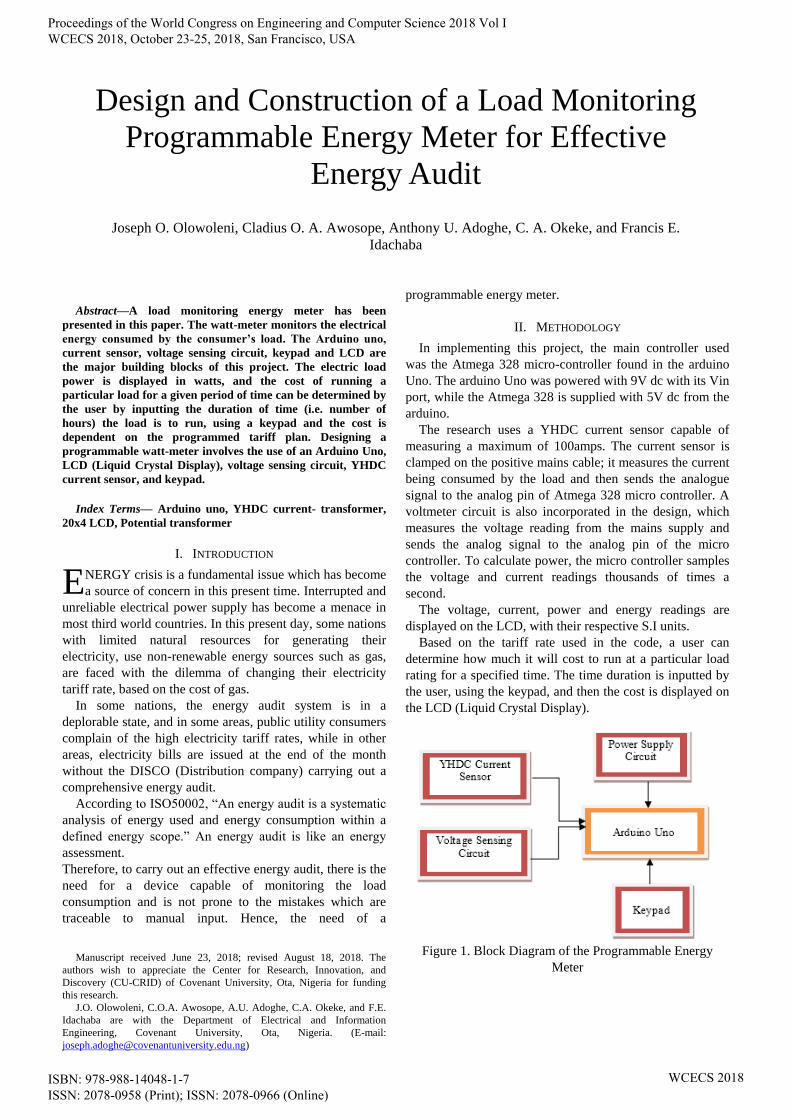
In implementing this project, the main controller used
was the Atmega 328 micro-controller found in the arduino
Uno. The arduino Uno was powered with 9V dc with its Vin
port, while the Atmega 328 is supplied with 5V dc from the
arduino.
The research uses a YHDC current sensor capable of
measuring a maximum of 100amps. The current sensor is
clamped on the positive mains cable; it measures the current
being consumed by the load and then sends the analogue
signal to the analog pin of Atmega 328 micro controller. A
voltmeter circuit is also incorporated in the design, which
measures the voltage reading from the mains supply and
sends the analog signal to the analog pin of the micro
controller. To calculate power, the micro controller samples
the voltage and current readings thousands of times a
second.
The voltage, current, power and energy readings are
displayed on the LCD, with their respective S.I units.
Based on the tariff rate used in the code, a user can
determine how much it will cost to run at a particular load
rating for a specified time. The time duration is inputted by
the user, using the keypad, and then the cost is displayed on
the LCD (Liquid Crystal Display).
Figure 1. Block Diagram of the Programmable Energy
Meter
Design and Construction of a Load Monitoring
Programmable Energy Meter for Effective
Energy Audit
Joseph O. Olowoleni, Cladius O. A. Awosope, Anthony U. Adoghe, C. A. Okeke, and Francis E.
Idachaba
E
Proceedings of the World Congress on Engineering and Computer Science 2018 Vol I WCECS 2018, October 23-25, 2018, San Francisco, USA
ISBN: 978-988-14048-1-7 ISSN: 2078-0958 (Print); ISSN: 2078-0966 (Online)
WCECS 2018

III. DESIGN STAGES AND COMPONENTS
A. Voltmeter Circuit
The voltage across the mains supply terminals is stepped
down to 12V ac, and then converted to dc by connecting the
12V ac to a bridge rectifier. The rectified voltage is then
filtered using a 1000-uf capacitor. The output 12V dc is then
connected to the positive and the negative terminals of a
variable resistor. A 5-V zenner diode is connected between
the ground and the wiper, which is the output of the variable
resistor. This is to ensure that the voltage across the ADC
(Analogue to digital converter) pins of the microcontroller
does not exceed 5V dc, since the maximum voltage rating of
the Atmega 328 is 5V dc.
The output of the variable resistor has to be calibrated
before connecting it to pin A4 of the arduino.
The voltmeter circuit is calibrated thus:
Max ac voltage reading: 250V ac = 5V dc
The voltage from the mains is measured using an external
voltmeter. Then, the corresponding dc value of the
measured ac voltage has to be calculated mathematically.
i.e.
Measured ac value from mains = 230V ac
250V ac= 5V dc
230V ac= unknown dc voltage
Unknown dc voltage= (230*5)/250= 4.6V dc
The variable resistor output will be adjusted to the
unknown dc voltage value, and series of processes such as:
low-pass filtering, sample and hold, quantization and
encoding, occur at the ADC port of the micro- controller to
read the analog signal value.
B. YHDC Current Sensor
Figure 2. YHDC Current Sensor
It is a non-invasive current sensor, it doesn’t have an
internal resistance. Zener diodes limit the output voltage in
the event of a disconnection from the burden resistor. It can
develop sufficient voltage to drive a 5-V input, and in this
work, the YHDC current sensor acts as a CT (current
transformer). A current transformer usually consists of a
primary side and a secondary side, and in a CT, the
transformer has a ten-turn secondary and a one-turn
primary. If 1amp flows in the primary coil, it will result in
0.1amp in the secondary coil. The arduino micro controller
is capable of reading voltage signals, and since the output
from the CT is a current signal, then there is the need to
convert it to a voltage signal. Therefore, a burden resistor is
needed.
Sizing the burden resistor:
-The maximum current range of the CT been used is
100A. Maximum RMS (root mean square value) =
100Amps.
- Primary peak current= RMS current
Primary peak current= 100A = 141.4A
-The YHDC SCT-013-000 has 2,000 turns,
Secondary Peak Current =
Secondary peak current= = 0.0707A
-For maximum measurement resolution, the voltage
across the burden resistor should be half of the arduino
AREF (Arduino reference voltage).
Ideal burden resistance =
AREF = 5volts.
Ideal burden resistor value =
Ideal burden resistor value = 35.4Ω
Since a 35.4-Ω resistor could not be found, a 33-Ω
resistor, which is close enough to the calculated value, was
used.
The two 10-kΩ resistors used for voltage divider are to
reduce the 5V to 2.5V.
C. Power Supply
The AC voltage from the mains supply was stepped down
to 12V AC by using a potential transformer. The 12V AC
was converted to DC, using a full-wave rectification circuit.
The rectification circuit consists of four rectification diodes
(1N4007) connected in a bridge configuration. After
rectification, the output DC voltage was filtered to remove
ripples and get a pure DC voltage output. A 9-volt regulator
(LM7809) was used to step down the output DC voltage of
13.5V to 9 volt which was used to power the Arduino.
D. Arduino Uno
It is a microcontroller board based on ATmega328P. It
uses a 16-MHz crystal oscillator, and it has 6 analog input
pins. 14digital output/input pins, (out of which 6 can be
used as PWM outputs), one USB jack, an ICSP header, one
power jack and a reset button.
The Arduino Uno can easily be used to program the
ATmega328p microcontroller, using the Arduino IDE. The
Arduino Uno was powered with 9V DC, using the power
jack. The Arduino Uno has an internal voltage regulator
which steps the 9V down to 5V DC for the ATmega328P to
function properly.
IV. RESULTS
The circuit was connected as shown in the circuit diagram
below. The watt-meter was tested with predefined loads
such as an electric iron and it was able to measure the
voltage, current, power and energy. The keypad was also
tested. It displayed the cost based on the number of hours
inputted.
Proceedings of the World Congress on Engineering and Computer Science 2018 Vol I WCECS 2018, October 23-25, 2018, San Francisco, USA
ISBN: 978-988-14048-1-7 ISSN: 2078-0958 (Print); ISSN: 2078-0966 (Online)
WCECS 2018
The accuracy of the energy meter was tested by
comparing the actual power rating to the measured power of
some household device [1, 2]. There was a very minimal
percentage error when the reading from the energy meter
was compared with that of the actual wattage of the devices.
Percentage Error =
The highest percentage error was 4%, and the variations
in the measurement could be due to the difference in the
voltage used in calculating the actual wattage and the
measured wattage.
There was a very minimal percentage error when the
reading from the energy meter was compared with that of
the actual wattage of the devices.
Percentage Error
=
The highest percentage error was 4%, and the variations
in the measurement could be due to the difference in the
voltage used in calculating the actual wattage and the
measured wattage.
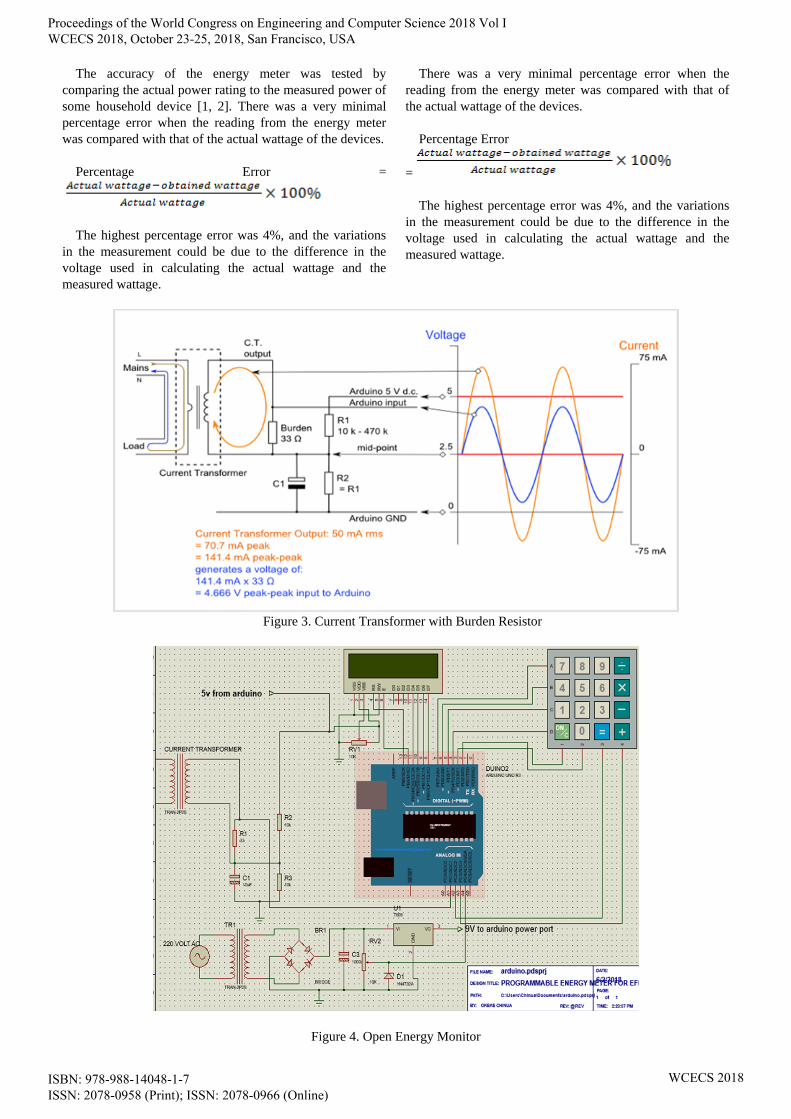
Figure 3. Current Transformer with Burden Resistor
Figure 4. Open Energy Monitor
Proceedings of the World Congress on Engineering and Computer Science 2018 Vol I WCECS 2018, October 23-25, 2018, San Francisco, USA
ISBN: 978-988-14048-1-7 ISSN: 2078-0958 (Print); ISSN: 2078-0966 (Online)
WCECS 2018
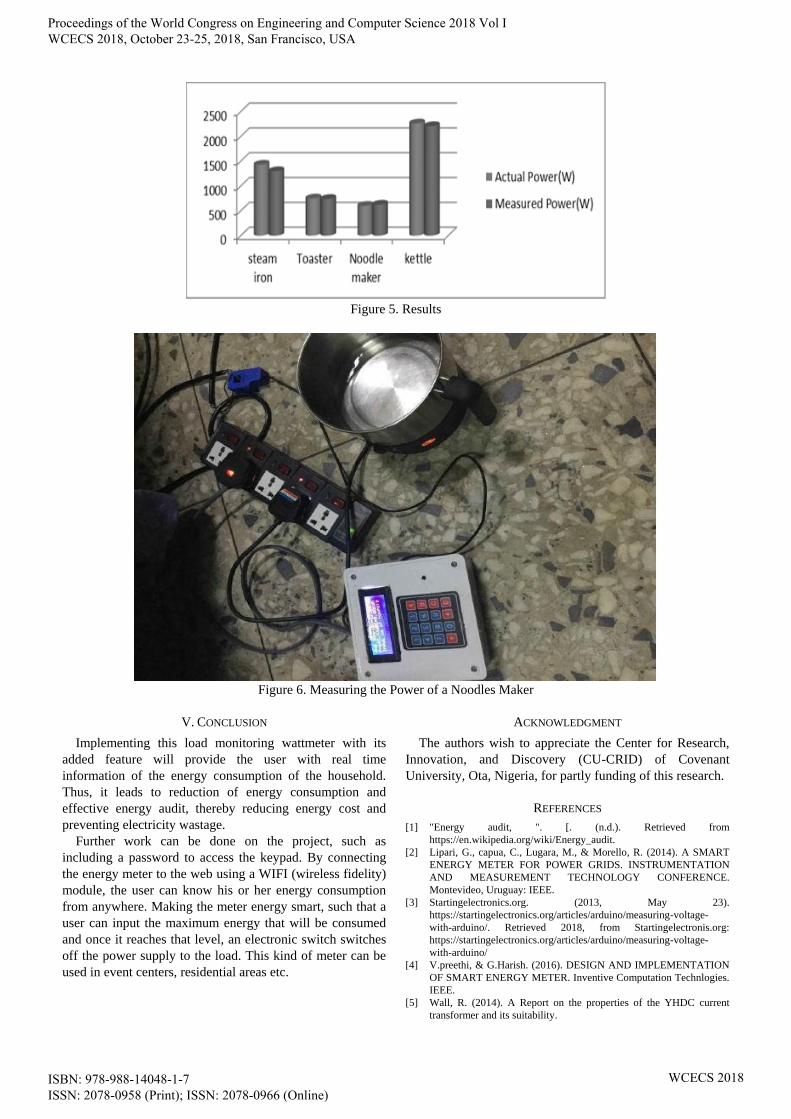
Figure 5. Results
Figure 6. Measuring the Power of a Noodles Maker
V. CONCLUSION
Implementing this load monitoring wattmeter with its
added feature will provide the user with real time
information of the energy consumption of the household.
Thus, it leads to reduction of energy consumption and
effective energy audit, thereby reducing energy cost and
preventing electricity wastage.
Further work can be done on the project, such as
including a password to access the keypad. By connecting
the energy meter to the web using a WIFI (wireless fidelity)
module, the user can know his or her energy consumption
from anywhere. Making the meter energy smart, such that a
user can input the maximum energy that will be consumed
and once it reaches that level, an electronic switch switches
off the power supply to the load. This kind of meter can be
used in event centers, residential areas etc.
ACKNOWLEDGMENT
The authors wish to appreciate the Center for Research,
Innovation, and Discovery (CU-CRID) of Covenant
University, Ota, Nigeria, for partly funding of this research.
REFERENCES
[1] "Energy audit, ". [. (n.d.). Retrieved from
https://en.wikipedia.org/wiki/Energy_audit.
[2] Lipari, G., capua, C., Lugara, M., & Morello, R. (2014). A SMART
ENERGY METER FOR POWER GRIDS. INSTRUMENTATION
AND MEASUREMENT TECHNOLOGY CONFERENCE.
Montevideo, Uruguay: IEEE.
[3] Startingelectronics.org. (2013, May 23).
https://startingelectronics.org/articles/arduino/measuring-voltage-
with-arduino/. Retrieved 2018, from Startingelectronis.org:
https://startingelectronics.org/articles/arduino/measuring-voltage-
with-arduino/
[4] V.preethi, & G.Harish. (2016). DESIGN AND IMPLEMENTATION
OF SMART ENERGY METER. Inventive Computation Technlogies.
IEEE.
[5] Wall, R. (2014). A Report on the properties of the YHDC current
transformer and its suitability.
Proceedings of the World Congress on Engineering and Computer Science 2018 Vol I WCECS 2018, October 23-25, 2018, San Francisco, USA
ISBN: 978-988-14048-1-7 ISSN: 2078-0958 (Print); ISSN: 2078-0966 (Online)
WCECS 2018