Embed Size (px)
Citation preview

Design and control of combined chemicalprocesses for the production of pure
enantiomers
Dissertationzur Erlangung des akademischen Grades
Doktoringenieur(Dr.-Ing.)
von M.S. Subramanian Swernath
geb. am 10-10-1983 in Chennai, India
genehmigt durch die Fakultat fur Elektrotechnik und Informationstechnik
der Otto-von-Guericke Universitat Magdeburg
Gutachter:Prof. Dr.-Ing. Achim KienleProf. Dr.-Ing. Malte Kaspereit
Promotionskolloquium am 10-01-2013
Acknowledgements
This thesis evolved from the research which was performed during my PhD at
the Max Planck Institute for Dynamics of Complex Technical Systems, Magdeburg,
Germany.
I am deeply indebted to Prof. Achim Kienle for providing me this opportunity
to work at the MPI as a part of the IMPRS. He has been patient and encouraging
during the entire course of the work. He has enlightened me with his wide knowledge
of the process dynamics and control. I am also extremely thankful to Prof. Malte
Kaspereit who has helped me personally and professionally during my stay at the
institute.
I would like to express my gratitude to all of my group members for their kind
cooperation. Here, Michael Mangold needs to be mentioned explicitly for his imme-
diate support in sorting out the issues in DIVA. Among other group members, I want
to thank Carolyn Mangold for proof-reading the thesis.
I would like to thank the IMPRS coordinator Dr. Barbara Witter and Dr. Juergen
Koch for all the necessary support during my stay in Magdeburg. Without their
constant cooperation, my stay in Magdeburg would not have been very pleasant. A
special thanks to the group secretary Carolyn for her help. I would also like to express
my gratitude to IT staff members as well as MPI administration for always sorting
out my problems efficiently and quickly.
I would like to thank all the Indian colleagues in MPI with whom we had intense
scientific and non-scientific discussion during the regular cofee breaks. I would also like
to thank Praveen for clearing some of the mathematical doubts over skype. Finally, I
want to thank my parents for providing me the necessary love and motivation during
the entire four years.
ii

To my parents
iii
Contents
Acknowledgements . . . . . . . . . . . . . . . . . . . . . . . . . . . . . . . ii
Dedication . . . . . . . . . . . . . . . . . . . . . . . . . . . . . . . . . . . . . iii
List of Figures . . . . . . . . . . . . . . . . . . . . . . . . . . . . . . . . . . vii
List of Tables . . . . . . . . . . . . . . . . . . . . . . . . . . . . . . . . . . . x
Notation . . . . . . . . . . . . . . . . . . . . . . . . . . . . . . . . . . . . . . xi
German Abstract . . . . . . . . . . . . . . . . . . . . . . . . . . . . . . . . xiv
Abstract . . . . . . . . . . . . . . . . . . . . . . . . . . . . . . . . . . . . . . xvi
Chapter
1. Introduction . . . . . . . . . . . . . . . . . . . . . . . . . . . . . . 1
1.1 Introduction . . . . . . . . . . . . . . . . . . . . . . . . . . . 11.2 State-of-the-art and Objectives . . . . . . . . . . . . . . . . . 4
1.2.1 SMB-crystallization . . . . . . . . . . . . . . . . . . 41.2.2 SMB-racemization . . . . . . . . . . . . . . . . . . . 51.2.3 Advanced optimization approaches . . . . . . . . . . 61.2.4 Process dynamics and control . . . . . . . . . . . . 7
1.3 Outline of the thesis . . . . . . . . . . . . . . . . . . . . . . . 9
2. Optimal design methodology . . . . . . . . . . . . . . . . . . . . 10
2.1 Mathematical formulation . . . . . . . . . . . . . . . . . . . . 102.2 Model system 1: PDE (Simple system) . . . . . . . . . . . . . 16
2.2.1 SMB-crystallization . . . . . . . . . . . . . . . . . . 172.2.2 SMB-racemization . . . . . . . . . . . . . . . . . . . 182.2.3 SMB-racemization-crystallization . . . . . . . . . . 19
iv

2.2.4 SMB-crystallization-crystallization . . . . . . . . . . 212.3 Model system 2: 2’,6’-Pipecoloxylidide (PPX) . . . . . . . . 22
2.3.1 Design of fixed process structures (NLP optimization) 242.3.2 Simultaneous design of the process structure and op-
erating conditions (MINLP optimization) . . . . . . 302.4 Summary . . . . . . . . . . . . . . . . . . . . . . . . . . . . . 33
3. Dynamics and control of SMB-crystallization processes . . . 36
3.1 Open loop dynamics . . . . . . . . . . . . . . . . . . . . . . . 363.1.1 Robust design . . . . . . . . . . . . . . . . . . . . . 363.1.2 Extract configuration . . . . . . . . . . . . . . . . . 373.1.3 Raffinate configurations . . . . . . . . . . . . . . . . 43
3.2 Feedback control . . . . . . . . . . . . . . . . . . . . . . . . . 483.3 Summary . . . . . . . . . . . . . . . . . . . . . . . . . . . . . 53
4. Dynamics and control of SMB-racemization processes . . . . 54
4.1 Slow reaction kinetics and moderate purities . . . . . . . . . . 544.1.1 Static controllability analysis . . . . . . . . . . . . . 554.1.2 Open loop and closed loop process dynamics . . . . 57
4.2 Fast reaction kinetics and high purities . . . . . . . . . . . . . 624.2.1 Static controllability analysis . . . . . . . . . . . . . 624.2.2 Open and closed loop dynamics . . . . . . . . . . . 64
4.3 Summary . . . . . . . . . . . . . . . . . . . . . . . . . . . . . 68
5. Conclusions . . . . . . . . . . . . . . . . . . . . . . . . . . . . . . . 69
Appendices . . . . . . . . . . . . . . . . . . . . . . . . . . . . . . . . . . . . 72
A. Physico-chemical parameters . . . . . . . . . . . . . . . . . . . . 73
B. MINLP optimization of SMB processes and process combi-nations with variable number of stages . . . . . . . . . . . . . . 75
B.1 Model formulation . . . . . . . . . . . . . . . . . . . . . . . . 75B.2 Results . . . . . . . . . . . . . . . . . . . . . . . . . . . . . . 79
B.2.1 Simple cost function . . . . . . . . . . . . . . . . . . 79B.2.2 Super structure based optimization for process com-
binations . . . . . . . . . . . . . . . . . . . . . . . . 85B.2.3 SMB design using TMB parameters . . . . . . . . . 86
C. Dynamic crystallizer model . . . . . . . . . . . . . . . . . . . . . 89
v

Bibliography . . . . . . . . . . . . . . . . . . . . . . . . . . . . . . . . . . . 93
vi
List of Figures
Figure
1.1 Enantiomer forms of Lactic acid. Non-super imposable mirror imagesof each other. Dashed lines represent a hypothetical mirror . . . . . 2
1.2 Schematic of an SMB process . . . . . . . . . . . . . . . . . . . . . 21.3 Different possible SMB based process combinations to produce pure
enantiomers (a) stand-alone SMB process, (b) SMB-crystallization,(c) SMB-racemization, (d) SMB-crystallization-racemization . . . . 3
2.1 Figure illustrating the nomenclature for the solvent removal unit be-fore the crystallizer . . . . . . . . . . . . . . . . . . . . . . . . . . . 12
2.2 SLE on a rectangular diagram . . . . . . . . . . . . . . . . . . . . . 132.3 Figure illustrating the nomenclature around the the crystallizer and
the solvent makeup . . . . . . . . . . . . . . . . . . . . . . . . . . . 142.4 Figure illustrating the nomenclature around the the reactor and the
solvent removal before the reactor . . . . . . . . . . . . . . . . . . . 152.5 Decision tree based on simple qualitative criteria for the selection of
a suitable combined or integrated process concept for the productionof a pure enantiomer . . . . . . . . . . . . . . . . . . . . . . . . . . 23
2.6 Costs as a function of production rate of a stand-alone SMB as inFigure 1.3(a) (dashed line), compared to an SMB process coupledwith a racemizer as in Figure 1.3(c) (solid line) for two different feedcost scenarios. . . . . . . . . . . . . . . . . . . . . . . . . . . . . . . 26
2.7 Maximum production rates and coupling purity as a function of thetotal number of theoretical stages of a stand-alone SMB (dashed line)compared to an SMB process with a crystallizer at the raffinate. . . 28
2.8 Maximum production rates and coupling purity as a function of thetotal number of theoretical stages of a stand-alone SMB (dashed line)compared to an SMB process with a crystallizer at the extract. . . . 28
2.9 Maximum production rates and coupling purity as a function of thetotal number of theoretical stages of a stand-alone SMB (dashed line)compared to an SMB process with a crystallizer at the raffinate anda crystallizer at the extract. . . . . . . . . . . . . . . . . . . . . . . 29
2.10 Superstructure for MINLP optimization . . . . . . . . . . . . . . . . 32
vii

3.1 Optimal and robust operating points obtained from a steady stateoptimization . . . . . . . . . . . . . . . . . . . . . . . . . . . . . . . 38
3.2 Schematic diagram for an SMB-crystallization with a crystallizer atthe extract . . . . . . . . . . . . . . . . . . . . . . . . . . . . . . . . 39
3.3 Effect of step disturbances of the external feed concentration for acrystallizer at the extract . . . . . . . . . . . . . . . . . . . . . . . . 41
3.4 Effect of step disturbances of the external feed flow rate for a crys-tallizer at the extract . . . . . . . . . . . . . . . . . . . . . . . . . . 42
3.5 Effect of step disturbances of the external feed concentration for acrystallizer at the raffinate (configuration 1) . . . . . . . . . . . . . 44
3.6 Effect of step disturbances of the external feed flow rate for a crys-tallizer at the raffinate (configuration 1) . . . . . . . . . . . . . . . . 45
3.7 Schematic diagram for the alternative raffinate configuration (config-uration 2) . . . . . . . . . . . . . . . . . . . . . . . . . . . . . . . . 46
3.8 Effect of step disturbances of the external feed flow rate for a crys-tallizer at the raffinate (configuration 2) . . . . . . . . . . . . . . . . 47
3.9 Comparison of open loop and closed loop process behavior for a stepdisturbance of +10.0% of the external feed concentration for a crys-tallizer at the extract . . . . . . . . . . . . . . . . . . . . . . . . . . 50
3.10 Comparison of open loop and closed loop process behavior for a stepdisturbance of +17.5% of the external feed concentration for a crys-tallizer at the extract . . . . . . . . . . . . . . . . . . . . . . . . . . 51
3.11 Comparison of open loop and closed loop process behavior for a stepdisturbance of -33% of the external feed flow rate for a crystallizer atthe extract . . . . . . . . . . . . . . . . . . . . . . . . . . . . . . . . 52
4.1 Schematic diagram for an SMB-racemization process . . . . . . . . 554.2 Comparison of steady state parameter continuation profiles when
subjected to step disturbances of ± 5% of the external feed con-centration for slow kinetics . . . . . . . . . . . . . . . . . . . . . . . 56
4.3 Comparison of steady state parameter continuation profiles whensubjected to step disturbances of ± 5% of the external feed flowrate for slow kinetics . . . . . . . . . . . . . . . . . . . . . . . . . . 56
4.4 Comparison of an open loop and closed loop process for ± 5% dis-turbance of the external feed concentration for slow kinetics . . . . 58
4.5 Comparison of an open loop and closed loop process for ± 5% dis-turbance of the external feed flow rate for slow kinetics . . . . . . . 59
4.6 Comparison of steady state parameter continuation profiles whensubjected to step disturbances of 7.5% disturbance of the externalfeed concentration for slow kinetics . . . . . . . . . . . . . . . . . . 60
4.7 Comparison of an open loop and closed loop process for ± 7.5%disturbance of the external feed concentration for slow kinetics . . . 61
4.8 Comparison of steady state parameter continuation profiles for nom-inal, 5%, -5% disturbance of the external feed concentration for thefast kinetics . . . . . . . . . . . . . . . . . . . . . . . . . . . . . . . 63
viii

4.9 Comparison of steady state parameter continuation profiles for nom-inal, 5%, -5% disturbance of the external feed flow rate for fast kinetics 63
4.10 Comparison of possible control options for 5% disturbance of theexternal feed concentration through steady state parameter continu-ation for fast kinetics . . . . . . . . . . . . . . . . . . . . . . . . . . 65
4.11 Comparison of an open loop and closed loop process for ± 5 % dis-turbance of the external feed concentration for fast kinetics . . . . . 66
4.12 Comparison of an open loop and closed loop process for ± 5% dis-turbance of the external feed flow rate for fast kinetics . . . . . . . . 67
B.1 Schematic models for stage number optimization for SMB processesand process combinations . . . . . . . . . . . . . . . . . . . . . . . . 76
B.2 Enumeration approach for understanding the effect of stage numberfor PDE enantiomer . . . . . . . . . . . . . . . . . . . . . . . . . . . 80
B.3 Effect of purity and feed flow rate on the number of stages . . . . . 83B.4 Effect of separation factor on the number of stages . . . . . . . . . . 84C.1 Open loop dynamics for a step disturbance of +17.5% of the external
feed concentration for a crystallizer at the extract with finite dy-namics with a capacity of 0.1 (red), 1 (blue) and 10 (black) volumeunits. Meaning of thick and thin lines in diagrams (a) and (d) is asin Figure 3.3. . . . . . . . . . . . . . . . . . . . . . . . . . . . . . . 91
C.2 Closed loop dynamics for a step disturbance of +17.5% of the ex-ternal feed concentration for a crystallizer at the extract with finitedynamics with a capacity of 0.1 (red), 1 (blue) and 10 (black) volumeunits. Meaning of thick and thin lines in diagrams (a) and (d) is asin Figure 3.3. . . . . . . . . . . . . . . . . . . . . . . . . . . . . . . 92
ix

List of Tables
Table
2.1 Optimal design for an SMB-crys . . . . . . . . . . . . . . . . . . . . 182.2 Optimal design for an SMB-extr.rac . . . . . . . . . . . . . . . . . . 192.3 Optimal design for an SMB-raff.rac . . . . . . . . . . . . . . . . . . 192.4 Optimal design for an SMB-extr.rac and raff.cryst . . . . . . . . . . 202.5 Optimal design for an SMB-raff.rac and extr.cryst . . . . . . . . . . 202.6 Optimal design for an SMB-crys-crys . . . . . . . . . . . . . . . . . 212.7 NLP calculations for PPX . . . . . . . . . . . . . . . . . . . . . . . 302.8 MINLP calculations for PPX . . . . . . . . . . . . . . . . . . . . . . 353.1 Robust design for an SMB-crys . . . . . . . . . . . . . . . . . . . . 373.2 Controller parameters for an SMB-extr.crys . . . . . . . . . . . . . . 494.1 Controller parameters for an SMB-racemization for slow kinetics . . 574.2 Robust design for an SMB-Extr.rac for slow kinetics . . . . . . . . . 604.3 Robust design for an SMB-Extr.rac for fast kinetics . . . . . . . . . 644.4 Controller parameters for an SMB-racemization for fast kinetics . . 64A.1 Parameters for the model system: PDE . . . . . . . . . . . . . . . . 73A.2 Parameter values for the model system: PPX . . . . . . . . . . . . . 73B.1 Comparison of CPU time for the two methods to perform stage num-
ber optimization. Computations were performed on a linux 2GHz,AMD Athlon single core processer . . . . . . . . . . . . . . . . . . . 82
B.2 Minimum number of stages for the different process schemes . . . . 82B.3 Minimum number of stages for unequal stage number for stand alone
SMB . . . . . . . . . . . . . . . . . . . . . . . . . . . . . . . . . . . 85B.4 Comparison of different processes with translation to SMB . . . . . 88B.5 Comparison of different processes with translation to SMB for case 1
in Table B.4 . . . . . . . . . . . . . . . . . . . . . . . . . . . . . . . 88C.1 Controller parameters for an SMB-crystallization with dynamic model 90
x

Notation
Abbreviations
Symbols MeaningCrys MSMPR crystallizerGAMS General Algebraic Modelling SystemMINLP Mixed-Integer Non-Linear ProgrammingMSMPR Mixed Suspension Mixed Product RemovalNLP Non-Linear-ProgrammingPDE Pharmaceutical Intermediate CompoundPPX 2’, 6’-PipecoloxylidideRac Racemization reactor (CSTR)SLE Solid-Liquid-EquilibriumSMB Simulated Moving BedSM Solvent MakeupSR Solvent Removal unitTMB True Moving Bed
xi

Arabic Symbols
Symbols Meaning SI Unitsa Adsorption isotherm parameterAc Area of column [m2]b Adsorption isotherm parameter [l/g]ci,k Liquid phase concentration of the component i on the stage k [g/l]ci,F0 Liquid phase feed concentration of the component i in feed [g/l]creaci,recycle Liquid phase concentration of the component i in reactor [g/l]creaci,evap Liquid phase concentration of the component i leaving SR [g/l]
ccrysti,evap Liquid phase concentration of the component i leaving SR [g/l]
ccrysti,recycle Liquid phase concentration of the component i in cryst recycle [g/l]
ccrysti,evap,feed Liquid phase concentration of the component i entering SR [g/l]
creaci,evap,feed Liquid phase concentration of the component i entering SR [g/l]Cf Feed material cost [USD/hr]Cop Operation cost [USD/hr]Cinv Investment material cost [USD/hr]Dc Length of column [m2]HETP Height equivalent to theoretical platei Components/enantiomerIE Binary variable for extract of TMBIR Binary variable for raffinate of TMBID Binary variable for desorbent of TMBIL Binary variable for last stage of TMBk Stage number in the SMBKc Controller gain [min/ml]Lc Length of column [m]Mrac Mass of racemic feed [kg/hr]Mprod Mass of product [kg/hr]NTPCOL Number of theoretical plates in a columnkforward Reaction rate constant [1/s]qi,k Solid phase concentration of the component i on the stage k [g/l]Pumin Minimum purity requirement [-]
Qml Mother liquor flow rate from the crystallizer [ml/min]Qk Real SMB flow rate in Appendix B [ml/min]
QF0 External feed flow rate [ml/min]
Qi,crystal Crystal flow rate of the component i from the crystallizer [ml/min]
QDiluent Diluent flow rate to the mother liquor [ml/min]
Qcrystrecycle Recycle flow rate from the crystallizer [ml/min]
Qreacrecycle Recycle flow rate from the reactor [ml/min]
Qsolid Solid flow rate within the SMB [ml/min]
Qk Liquid flow rate on the stage k of the TMB [ml/min]
Qexternal Liquid flow rate of the stream from/to the TMB [ml/min]
xii
Arabic Symbols - Continued ...,
Symbols Meaning SI Units
QcrystSR Liquid flow rate of the stream leaving the SR before cryst [ml/min]
QreacSR Liquid flow rate of the stream leaving the SR before reac [ml/min]
Qcrystevap Liquid flow rate of the stream leaving the SR to cryst [ml/min]
Qreacevap Liquid flow rate of the stream leaving the SR to reac [ml/min]
Qcrystevap,feed Liquid flow rate of the stream entering the SR before cryst [ml/min]
Qreacevap,feed Liquid flow rate of the stream entering the SR before reac [ml/min]
tswitch Switch time of an SMB [s]ULIN Linear velocityV Volume of each stage of the SMB unit [ml]Vc Volume of an SMB column [ml]Vreac Volume of the reactor [ml]Vcryst Volume of the crystallizer [ml]Wf Feed material cost [USD/kg]Wop Operation cost [USD/hr]Winv Investment material cost [USD/kg]xi,evap Mass fraction of the component i leaving SRy Binary decision variablesY Yield of racemization
Greek Symbols
Symbols Meaningǫ Void fraction of liquid phase in SMBνi Stoichiometric coefficientψ Void fraction of the crystallizerδ Fraction of crystals of the enantiomer 1ρ Density of liquidτI Integral time in controller
xiii

German Abstract
Enatiomere sind Stereoisomere mit spiegelsymmetrischer Struktur. Sie spielen eine
wichtige Rolle in der pharmazeutischen Industrie. Typischerweise haben sie identische
physikalisch-chemische Eigenschaften in einer achiralen Umgebung, konnen aber ver-
schiedene physiologische Effekte haben. Dies macht die Herstellung von enatiomeren-
reinen Medikamenten notwendig. Solche Produktionprozesse basieren oft auf einer
nicht-selektiven chemischen Synthese. Diese fuhrt auf eine 50:50 Mischung der beiden
Enantiomere, die auch als Racemat bezeichnet wird. Folglich ist eine anschliessende
Trennung erforderlich, um das gewunschte Enantiomer in hoher Reinheit zu erhalten.
In der vorliegenden Arbeit werden dazu kontinuierliche chromatographische Tren-
nprozesse nach dem Simulated Moving Bed (SMB) Verfahren verwendet.
Zentrales Ziel dieser Arbeit ist die Verbesserung solcher Prozesse durch eine in-
telligente Kombination chromatographischer Trennunprozesse mit einer selektiven
Kristallisation und/oder einer chemischen Racemisierung. Die optimale Konfigu-
ration und die optimalen Betriebsbedingungen dieser kombinierten Prozesse hangen
entscheidend von den spezifischen Kostenstrukturen und den physikalisch-chemischen
Eigenschaften der betrachteten Systeme ab. Zur Bestimmung eines optimalen Design
werden in der vorliegenden Arbeit geeignete Optimierungsstrategien entwickelt. In
einem ersten Schritt werden Methoden der Nichtlinearen Optimierung verwendet, um
optimale Betriebsbedingungen fur eine gegebene Prozesskonfiguration zu bestimmen.
Anschliessend wird eine erweitere Superstruktur-Formulierung zur simultanen Bes-
timmung einer optimalen Prozesskonfigurationen und optimalen Betriebsbedingungen
eingefuhrt und mit Methoden der Gemischt-Ganzzahligen Nichtlinearen Optimierung
gelost. Als Anwendungsbeispiel dienen zwei verschiedene pharmazeutische Kompo-
nenten unterschiedlicher Komplexitat.
Neben dem optimalen Design liegt ein weiterer Schwerpunkt der Arbeit im Gegen-
satz zu fruheren Untersuchungen auch bei der dynamischen Betreibbarkeit und der
xiv

Regelung solcher kombinierten Prozesse mit Ruckfuhrungen. Fur eine systematis-
che Analyse werden zwei charakteristische Konfigurationen betrachtet: (1) ein SMB
Prozess kombiniert mit einer enantioselektiven Kristallisation und (2) ein SMB Prozess
kombiniert mit einem Racemisierungsreaktor.
Um im ersten Fall bei unvorhergesehenen Storungen die gewunschte hohe Qualitat
des kristallinen Produktes zu erzielen, ist es notwendig, die Kristallisation innerhalb
der zugehorigen Grenzen im Phasendiagramm zu halten. In einem ersten Schritt wird
der Einfluss von Storungen auf die Dynamik des ungeregelten Systems untersucht.
Es wird gezeigt, dass das dynamische Verhalten der kombinierten Prozesse entschei-
dend von der Pumpenkonfiguration der SMB Anlage anhangt. Je nach Storung kann
dabei die Kristallisation des unerwunschten Produktes beobachtet werden. Außer-
dem konnen Instabilitaten in Form nichtlinearer Oszillationen auftreten. Daher wird
in einem zweiten Schritt eine anlagenweite Regelungsstrategie vorgeschlagen, um eine
robuste Betriebsweise zu gewahrleisten. Es wird gezeigt, dass die direkte Regelung des
SMB Prozesses nicht notwendig ist, um den Gesamtprozess zu stabilisieren und die
gewunschten Produktreinheiten einhalten zu konnen. Alternativ wird eine neues ein-
fach umzusetzendes Regelkonzept vorgeschlagen, bei dem nur die Menge des abzuziehe-
nden bzw. hinzuzufugenden Losungsmittels geregelt wird. Weiterhin wird gezeigt,
dass sich diese Regelungsstrategie auch auf den zweiten Fall anwenden last, wenn die
Racemisierungsreaktion im kinetischen Regime liegt und die Reinheitsanforderun-
gen an die Produkte moderat sind. Anschliessend wird gezeigt, dass eine direkte
Regelung des SMB Prozesses zwingend notwendig ist, wenn sich die Reaktion im
Gleichgewichts-Regime befindet.
Zum Schluss wird eine mogliche Erweiterung dieser einfachen Regelkonzepte fur
komplexere SMB-Prozesskonfigurationen diskutiert.
xv
Abstract
Enantiomers are stereoisomers, which are structured like mirror images of each
other. They play an important role in pharmaceutical industries. Typically, they
have identical physico-chemical properties in an achiral environment but may have
different physiological effects. This requires the production of enantiopure drugs.
Such production processes are often based on a nonselective chemical synthesis deliv-
ering a 50:50 mixture of both enantiomers called the racemate. Hence, a subsequent
separation is required to obtain the desired enantiomer with high purity. In the
present work continuous chromatographic separation by means of simulated moving
bed (SMB) processes is considered.
The thesis aims at improving the production of single enantiomers by clever combi-
nation of the chromatographic separation with selective crystallization and/or racem-
ization. The optimal configuration and the optimal operating conditions of such a
combined process crucially depend on specific cost structures and physico-chemical
properties of the system to be considered. For model-based computer-aided optimal
design, various optimization strategies are developed in this thesis. In a first step,
nonlinear programming is applied to determine optimal operating conditions for a
given process configuration. Afterwards, an extended superstructure formulation is
introduced to determine optimal process configurations and optimal process condi-
tions simultaneously by means of mixed integer nonlinear programming. Application
is demonstrated for two different compounds from pharmaceutical industries with
increasing complexity.
Besides the optimal design, focus is on the dynamic operability and control of
such combined processes with recycles, which has not been considered so far. For
a systematic analysis two characteristic benchmark problems are considered: (1) an
SMB process combined with an enantio-selective crystallization, and (2) an SMB
process combined with a racemization reactor.
xvi

To achieve the desired high purity of the crystalline product, in the first case, it
is required to keep the crystallizer operation within the corresponding region in the
phase diagram in the presence of unforeseen disturbances. In the first step, the effect
of such disturbances on the open loop dynamics is investigated. It is shown that the
dynamic behavior of the combined process crucially depends on the pump configu-
ration of the SMB plant involved. Depending on the disturbance, the formation of
the crystals of the undesired product is observed. Further open loop instability in
the form of self sustained oscillations may arise. Therefore, in a second step a simple
plantwide control strategy is proposed in order to ensure a robust process operation.
It is shown that the direct control of the SMB unit is not required to stabilize the
process combination while maintaining the desired product specifications. Instead,
we show that this can be achieved easily by controlling the amount of the solvent that
is removed or added to the system. Further, it is shown, that a similar strategy can
be applied to the second process combination. However, for good controllability in
the second case, it is required that the racemization reaction is in the kinetic regime
and that the product purities are not too high. Afterwards, it is illustrated that a
direct control of one of the SMB flow rates is mandatory when the reaction is in the
equilibrium regime.
Finally, the possibility of extending these simple control concepts to more com-
plicated process schemes involving SMB is also briefly addressed.
xvii

Chapter 1
Introduction
1.1 Introduction
The production of pure enantiomers is essential and challenging due to their wide
application in pharmaceutical industries. Enantiomers are a class of stereoisomers.
They exist in two different forms, which are non-superimposable mirror images of
each other. The asymmetry in the three dimensional arrangement in space arises
from the presence of a chiral carbon atom, chiral axes etc. [1] [Figure 1.1]. Different
conventions have been used for classifying these two forms of enantiomers such as
+/-, D/L, R/S etc. The two enantiomers have identical physico-chemical properties
in achiral environments but may have different physiological impacts. The effects
of the two different forms of enantiomers can be widely dissimilar as in the case of
ethambutol where the human consumption of R-form could lead to blindness while
the S-form has antimycobacterial properties [2]. In these cases, the production of
pure single enantiomers is of fundamental importance.
Preparative large scale production methods for pure enantiomers can be broadly
classified into two major types. One of the approaches is to perform a stereo-selective
synthesis of the desired enantiomer. Methods based on selective synthesis rely on the
use of biological or chemical catalysis in order to produce the desired enantiomer.
Although this approach seems to be much more simple, asymmetric catalysis is in-
dustrially often not economical and requires elaborate process development. The
other method which is primarily used in industrial production is based on a non-
selective chemical synthesis of the racemic (50/50) mixture and a subsequent enantio-
separation. In this method the synthesis is comparatively easy while the separation
is the major challenge due to the identical physico-chemical properties of the two
enantiomers.
1

Chapter 1. Introduction
Figure 1.1: Enantiomer forms of Lactic acid. Non-super imposable mirror images ofeach other. Dashed lines represent a hypothetical mirror
Most of the enantiopure production methods are performed in an isolated manner
using stand-alone chromatography, crystallization, etc. These methods are feasible
and established, but there exists a significant potential for cost reduction by using
improved process concepts combining one or more of the separation methods and/or
(bio)chemical reactions which will be discussed within the course of this thesis.
Due to the tremendous advancements made in simulated moving bed (SMB) chro-
matography during the last decade, it has become a powerful option for separating
enantiomeric mixtures [3]. Main advantages compared to classical batch chromatog-
raphy are increased productivity and reduced solvent consumption.
Figure 1.2: Schematic of an SMB process
2

Chapter 1. Introduction
An SMB chromatography unit consists of a series of interconnected columns with
a continuous flow of liquid along these as shown in Figure 1.2. A periodic switching
of the inlet and outlet ports in the direction of liquid flow is carried out to simulate a
counter-current flow of solid and liquid phases. A feed, consisting of a binary mixture
is introduced into the SMB. The less adsorbed component (component 2 in this thesis)
is carried along with the liquid flow and can be collected at the raffinate. The more
adsorbed component (component 1 in this thesis) can be drawn off at the extract.
Figure 1.3: Different possible SMB based process combinations to produce pure enan-tiomers (a) stand-alone SMB process, (b) SMB-crystallization, (c) SMB-racemization, (d) SMB-crystallization-racemization
It has been shown earlier that the productivity of an SMB process increases ex-
ponentially with decrease in purity requirements [4, 5]. As enantiomers are often
required in pure crystalline form, the combination of an SMB with crystallization can
be a very favorable process option. The scheme for such a process combination is
illustrated in Figure 1.3(b). This process combination helps to reduce the separation
load on the SMB and simultaneously distributes the load between the SMB and the
crystallization. Crystallization can be enantio-selective [6, 7] or preferential [8, 9].
3

Chapter 1. Introduction
Another benefit of such a process combination arises from the use of less efficient
and shorter and therefore cheaper columns within the SMB. It can be seen from Fig-
ure 1.3(a), that half of the produced material becomes waste as it is of the undesired
enantiomer. This translates mathematically to a maximum yield of 50%. This limi-
tation of any pure separation process can be overcome by performing a racemization
(isomerization) of the undesired enantiomer and recycling the reactor outlet to the
feed of the separation unit [Figure 1.3(c)] and thereby increasing the yield of the de-
sired enantiomer upto 100%. The concept shown in the Figure 1.3(c) was considered,
for example, applying thermal racemization of Troeger’s base [10], Chlorthalidone
[11] and enzymatic racemization of amino acids [12, 13]. Further, it is also possible to
have a process combination involving SMB-racemization-crystallization such as the
one shown in Figure 1.3(d). Under such conditions, racemization occurs at the unde-
sired enantiomer outlet and crystallization at the desired enantiomer outlet. Besides
these, there are other non-intuitive process structures possible such as an SMB with a
crystallizer at the undesired enantiomer outlet which can improve the process perfor-
mance. These processes will be discussed in the subsequent chapter which focuses on
the optimal design. It is evident that there are a lot of new process variants available
which can enhance the efficiency of the state-of-the-art enantio-separations. Design
and operation of such novel processes forms the essence of this thesis.
1.2 State-of-the-art and Objectives
1.2.1 SMB-crystallization
The importance of SMB-crystallization in the enantiomer domain is clear from the
amount of literature which has appeared during the last decade. Lim et al. [14] ex-
perimentally showed that a partial resolution using SMB, followed by crystallization,
is a promising process route to produce pure praziquantel enantiomers. However,
they have not explored the benefits of operating such a process with reduced SMB
purity. Blehaut and Nicoud [15] were the first to promote the economic potential of
an integrated SMB-crystallization. They discussed it from an industrial perspective
and showed that the robustness of the process can also be improved. Lorenz et al.
[6] demonstrated the advantages of SMB-crystallization using numerical simulations
for mandelic acid enantiomers. Since numerical optimization of the complete process
is computationally challenging, an alternate shortcut method was developed. This
method was used to evaluate the potential of the process combination [7]. The au-
thors conclude that there is an optimal coupling purity (SMB outlet purity) at which
4

Chapter 1. Introduction
the productivity of the process is maximized. These methods were later extended
to study an enantiomeric and an epimeric system. The importance of recycling the
mother liquor back to the chromatography unit was underlined in Gedicke et al.
[16]. Since there is an optimal coupling purity which is not known a priori, the
equilibrium design methods for SMB processes are insufficient for the design of SMB-
crystallization [5, 17]. A detailed dynamic optimization using multi-objective opti-
mization was employed to study the performance of the SMB-crystallization process
for different but fixed coupling purities which necessitates numerous computationally
expensive parametric optimizations [18] . In this work, a detailed model was used for
the SMB, while the Solid-Liquid-Equilibrium (SLE) was not accounted for in detail
and the recycle stream from the crystallizer was always at the eutectic composition
which implies that the crystallization process is highly unrobust. In Amanullah and
Mazzotti [18] as well as in Kaspereit [4] the focus was on the steady state design of
combined SMB-crystallization processes and the optimal coupling purities were de-
termined by performing extensive parametric studies. Most of the limitations of these
earlier works have been avoided within this thesis by performing a “total process”
design in a single step. This implies the SMB flow rates, the optimal coupling purities
and the solvent enrichment/dilution have been determined simultaneously, avoiding
extensive parametric optimization studies.
1.2.2 SMB-racemization
Another major drawback of the SMB is its yield limitation which becomes evident
from Figure 1.3(a). Combining the separation with the isomerization (racemization)
of the undesired enantiomeric form has the obvious benefit of increasing the yield of
the desired enantiomer from a maximum of 50% to a maximum of 100%.
There are three possible options to achieve this. The three different options are 1.
fully integrated processes [19–21], 2. partially integrated processes with side reactors
which is known as the Hashimoto process [22] and 3. classical reactor-separator
schemes.
In the third option discussed previously, an external racemization reaction is per-
formed to increase the yield to a theoretical maximum of 100% as shown in Fig-
ure 1.3(c). This option is studied within this thesis. Some of the recent applications
of such process schemes are available [12, 23]. The optimal design or dynamics of
such reactor-separator schemes involving SMB with an isomerization reactor has not
been discussed using mathematical optimization approaches. Further, the optimal
design of such processes is not straight forward due to the reduced purity at SMB
5

Chapter 1. Introduction
outlet coupled to the reactor. Hence, in this work, we bridge this gap by using a
Non-Linear-Programming (NLP) optimization based approach to design such hybrid
process schemes and discuss the dynamics and control of such a combined process.
1.2.3 Advanced optimization approaches
Until now, the discussion was focused on the benefits which can arise by using
hybrid process combinations of an SMB. However, to design such processes, powerful
numerical optimization tools are necessary. Therefore, in this section we look at the
approaches which have been used to design such processes. As the number of process
alternatives available to produce enantiomers is quite large, it would be ideal if the
optimal process structure and the operating conditions are determined simultaneously.
This can be achieved using either a qualitative heuristic decision tree [24] or by means
of a rigorous Mixed-Integer-Non-Linear-Programming (MINLP) optimization. In this
thesis, the latter approach has been employed.
Early work in using MINLP optimization in chemical process design was con-
cerned, for example, with the determination of the optimal feed plate location and
the optimal number of stages in a single distillation column [25]. These studies on
single distillation systems were later extended to synthesize distillation sequences
using Generalized Disjunctive Programming (GDP) or MINLP reformulation [26].
MINLP optimization has been applied extensively for the optimal design of reactive
distillation columns [27, 28]. MINLP approaches have also been applied successfully
to optimize heat exchanger networks [29], water distribution networks [30], reactor
networks [31], etc. Lima and Grossmann [32] addressed the crystallizer design prob-
lem for p-xylene by formulating a superstructure entailing multiple possible process
streams. There the focus is on the superstructure for crystallization. The details
regarding the primary step which is often adsorption have been neglected.
Superstructure optimization approaches were employed by Kawajiri and Biegler
[33, 34] for SMB chromatography processes. However, focus in this work was on
optimizing SMB process operation using e.g. cyclic modulation of flow rates and
asynchronous column switching corresponding to the POWERFEED [35, 36] and
VARICOL [37, 38] concepts introduced earlier.
Palacios et al. [20] used a superstructure based optimization approach to design
an integrated reactive SMB process.
Besides the two approaches mentioned above, no further work on super structure
optimization for the design of SMB processes and its process combinations has been
done so far to the best of the authors knowledge. Due to the success achieved in
6

Chapter 1. Introduction
other areas of process design, it is clear that the use of MINLP based superstructure
optimization for SMB based process combinations can have a huge potential. For this
purpose, a superstructure which subsumes all possible sub-structures and determines
the optimal process configuration and operating conditions simultaneously for a spe-
cific objective, physico-chemical parameters etc. is developed in this thesis for the first
time and applied to some challenging application examples from pharmaceutical in-
dustries with increasing complexity. Results have been published partly in Kaspereit
et al.[24]. Further, the applicability of these methods to large scale problems has also
been presented.
1.2.4 Process dynamics and control
It is clear from the earlier discussion that an efficient process design can create a
huge step forward in the enantiomer production. However, since most of the design
is performed at steady state, the practical implementation of these optimal process
schemes may not be straight forward as the most economical processes often contain
recycle streams. The dynamics of such processes are non-trivial and needs to be
addressed for the process operability. The effect of recycle on non-linear processes
could result in various phenomena such as snow balling (steady state sensitivity),
inverse response, loss of stability, multiple steady states, self sustained oscillations,
etc. Studies on the non-linear effects of reactor-separator recycle systems concentrated
mostly on distillation/flash separators. Pushpavanam and Kienle [39] investigated the
behavior of ideal reactor-separator systems. The importance of fixing the appropriate
flow rates was highlighted. One of the later investigations from the same group
revealed the importance of control structure selection on the overall process operation
[40]. A steady state phenomenon called the “snowball” effect was reported for systems
involving reactor-separator recycles [41]. It was reported that these effects crucially
depend on the control structure which has been chosen.
The earlier described literature advocates the necessity of controlling the appro-
priate flow rates (control structure) for a smooth plant operation. This problem
translates to the determination of a suitable pump configuration in SMB process
operation. Understanding the dynamics of stand-alone SMB systems itself is quite
challenging. The effect of SMB pump configuration plays a critical role on the perfor-
mance. The effect of different SMB pump configurations have already been presented
in [42, 43]. A sensitivity analysis with respect to a disturbance on flow rates for
an amino acid separation system was also published in Lee et al.[44]. However, to
the best of our knowledge, there has not been any work so far which focused on
7

Chapter 1. Introduction
the pump configurations and the resulting process dynamics of SMB-crystallization
or SMB-racemization systems. Dynamic operability of such process combinations is
addressed in the present thesis for the first time.
It turns out that suitable control strategies are required to compensate the nega-
tive effects of unforeseen disturbances. The control of a stand-alone SMB represents
a challenging issue since it represents a switched non-linear system with distributed
parameters. SMB control has been addressed at various levels of complexities. Most
approaches have focused on model predictive control (e.g. [45–49]). Schramm et
al. [50] applied simple PI controllers based on non-linear wave propagation to control
the chromatographic unit. Another approach based on input-output linearization was
reported in [35]. Most recently, non-linear wave propagation was also used to find
a simple and efficient problem and controller formulation in discrete time [51, 52].
Though there has been numerous studies on stand-alone SMB control, there has been
no work to date which addressed plantwide control concepts for process combinations
involving SMB-crystallization or SMB-racemization processes.
From the literature analysis mentioned above, it is clear that there are many gaps
which need to be addressed. One of those involve applying advanced optimization
concepts to design SMB based enantiomer production processes, thus avoiding ex-
tensive parametric optimization or highly approximated shortcut methods. It is also
noticeable that the dynamics and control of SMB based processes has rarely been
addressed, which can be crucial in view of the practical operation. This gives rise to
the following objectives of the present thesis:
• To determine the steady state optimal design for chromatography based enantio-
separation processes
– Design for fixed process configurations involving SMB-crystallization, SMB-
racemization and multiple combinations of the above (NLP optimization)
– Determine the optimal process configuration and operating conditions si-
multaneously, thus developing new process routes for the production of
pure enantiomers (MINLP optimization)
• To understand the dynamics of process combination involving SMB-crystalliz-
ation and to develop simple control strategies to ensure a robust process oper-
ation
• To understand the dynamics of process combination involving SMB-racemiz-
ation and to extend the previously developed control strategies
8

Chapter 1. Introduction
1.3 Outline of the thesis
In order to fulfill the objectives mentioned above and to convey the ideas smoothly,
the thesis has been structured as follows
Chapter 2: In the initial part of this chapter the modeling methodology which has
been used within the thesis is described. In the next section, optimization methods are
introduced for optimal design of combined processes for the production of pure enan-
tiomers. In a first step, methods from Non-Linear-Programming (NLP) are applied
to optimize the operating conditions for a given process configuration. Application
is demonstrated for two different compounds from the pharmaceutical industry. The
first is an intermediate named PDE [4]. The second is 2’,6’-Pipecoloxylidide which is
called PPX for brevity in the remainder. In a second step, Mixed-Integer-Non-Linear-
Programming (MINLP) is applied to determine optimal process configurations and
optimal operating conditions simultaneously.
Chapter 3: The chapter starts with the analysis of process dynamics correspond-
ing to the optimal design obtained in the previous chapter for SMB-crystallization
processes. Focus is on the PDE system. The effect of different disturbances are
studied which reveal the need for a controller to maintain the necessary product
specifications. It is shown that this can be achieved with a relatively simple control
concept using PI controllers. A direct control of the SMB plant is not required.
Chapter 4: The ideas developed previously for SMB-crystallization are extended
to SMB-racemization systems. Here two different case studies have been considered.
The first of these corresponds to slow reaction kinetics implying that the process
operation is in the kinetic regime. The second case study which was used had a
high reaction rate constant implying that the process operation is in the equilibrium
regime. A static controllability analysis was performed in a first step to evaluate
process controllability. For the first case study, a straight forward extension of the
elegant control concept developed previously for SMB-crystallization was found to be
sufficient. The static controllability analysis revealed the inadequacy of this control
concept for the fast kinetics scenario. Hence, a direct control based on manipulating
one of the SMB flow rates was developed.
Chapter 5: This chapter summarises the major findings of the thesis and gives
an outlook for possible future work in this field.
9

Chapter 2
Optimal design methodology
In the initial part of this chapter, the mathematical modeling approach which
is used subsequently within the thesis is described. The SMB model equations have
been formulated in a generalized form. Reformulation of those equations if and where
necessary are highlighted in the corresponding sections. As it has been described in
the previous chapter, the process performance can be enhanced significantly by using
process combinations. The model equations necessary to describe these additional
units are also presented. In the second part of this chapter, we focus on the steady
state optimal design. Two different model compounds have been considered within
this work. The first of those corresponds to a well studied enantiomer called PDE.
Here, process configuration is fixed and a simple and commonly used objective func-
tion has been considered to optimize the operating conditions for the given process
structures. The second model compound which has been studied is an industrial
compound 2’,6’-Pipecoloxylidide (PPX). The efficiency of the previously developed
optimization approaches is illustrated for PPX which exhibits complex and highly
non-linear adsorption characteristics. A more detailed economic cost function has
been employed for this study in order to compare the potential of different process
combinations. The chapter concludes with the results of an MINLP optimization,
which optimizes process configuration and operating conditions simultaneously and
which is a promising option at an early design stage and has not been studied in the
frame work of SMB chromatography.
2.1 Mathematical formulation
Optimization of a real SMB model is extremely complex and time consuming due
to the presence of periodic switching within a distributed parameter system. Hence, it
10

Chapter 2. Optimal design of chromatographic process combinations
is quite a common practice to use a true moving bed (TMB) model as an approxima-
tion to the real SMB [53]. A TMB model assumes a continuous counter-current flow
between the solid and the liquid phase. Fluid flow rates are fixed correspondingly,
using pumps. The equivalent solid flow rate which is the same in all the four zones is
linked to the switching time of the SMB plant by
tswitch =Vc(1 − ǫ)
Qsolid
(2.1)
Continuous Chromatography model
In this work we have used an equilibrium stage TMB model. This model assumes
a series of equilibrium stages with the dispersion being captured by the number of
stages/cells. The mass balance for a component i on a stage k can be written as
ǫVdci,kdt
+ (1− ǫ)Vdqi,kdt
= Qsolid [qi,k+1 − qi,k] + Qk−1ci,k−1 − Qkci,k + Qexternalci,external
(2.2)
0 = Qk−1 − Qk + Qexternal (2.3)
In Eqs.(2.2) and (2.3), i = 1, 2 and k = 1, ..N . V is the volume of the stage, ǫ is
the porosity, Qk−1 and Qk are the volumetric flow rates of the liquid that enter and
leave the stage k respectively. Qsolid is the solid flow rate which is constant in all
the four zones. Qexternal refers to possible external streams due to feed, desorbent,
extract or raffinate and ci,external refers to the concentration of the corresponding
external stream. In Eq.(2.2), Qexternal is positive for the streams entering the plant
(feed, desorbent) and negative for the streams leaving the plant (extract, raffinate).
ci,k represents the concentration of the i th component in the liquid phase on stage
k where as qi,k is the solid phase concentration of the corresponding component.
The relation between the solid and the liquid phase is given by the thermodynamic
adsorption equilibrium. This can be written mathematically for a two component
system as
qi,k = fi(c1,k, c2,k) (2.4)
In this thesis, enantiomer ‘1’ i.e. i = 1 is assumed to be the stronger adsorbing
enantiomer and enantiomer ‘2’ is considered to be the weaker adsorbing enantiomer.
Since enantiomer ‘1’ is the stronger adsorbing enantiomer it would be enriched at the
extract outlet and can be collected at high purity at this outlet. Similarly, enantiomer
‘2’ being the weaker adsorbing enantiomer would be enriched at the raffinate outlet
and can be obtained in high purity at the raffinate.
11

Chapter 2. Optimal design of chromatographic process combinations
For the other units, simple mass balances have been applied and are assumed to
be quasi-static.
Crystallizer model
The governing equations for the enrichment step before the crystallizer can be written
as (see also Figure 2.1)
Qcrystevap,F eed = Qcryst
evap + QcrystSR (2.5)
Qcrystevap,F eedc
crysti,evap,F eed = Qcryst
evap ccrysti,evap (2.6)
ccrysti,evap = ρxi,evap (2.7)
Figure 2.1: Figure illustrating the nomenclature for the solvent removal unit beforethe crystallizer
where the index Qcrystevap denotes the stream from the solvent removal to the crys-
tallizer. QcrystSR is the solvent removal rate. xi,evap is the mass fraction of component i
in the crystallizer inlet. Crystallization characteristics being defined in terms of mass
fraction in a Solid-Liquid-Equilibrium (SLE) diagram [Eqns.(2.8) - (2.10)]. This ne-
cessitates the conversion of concentration to mass fraction.
Depending on the composition of the feed to the crystallizer ccrysti,evap or xi,evap, dif-
ferent regimes of operation of the crystallizer can be distinguished according to the
phase diagram in Figure 2.2. For simplicity, a SLE of conglomerate type is considered
in this thesis. For the ease of presentation, rectangular coordinates are used as shown
in Figure 2.2. The composition is specified in terms of mass fractions xi. The phase
diagram has four different regions which are labeled from I to IV in Figure 2.2 and
which give rise to different patterns of behavior. Region I corresponds to a single
liquid phase, whereas regions II and IV correspond to the two phase regions, where a
liquid phase coexists with pure crystals of enantiomer ‘1’ in region II, or pure crystals
of the enantiomer ‘2’ in region IV, respectively. Hence, pure crystals of the enantiomer
‘1’ can be produced by crystallization in region II and pure crystals of the enantiomer
12

Chapter 2. Optimal design of chromatographic process combinations
00 0.2
0.2
0.4
0.4
0.6
0.6
0.8
0.8
1
1
III
IV
III
x1
x2
Pure crystals ofenantiomer 2
Pure crystals ofenantiomer 1
Figure 2.2: SLE for a conglomerate on a rectangular diagram
II by a crystallization in region IV. So the nominal operation for producing pure
crystals of enantiomer ‘1’ is located in region II. Accordingly, the nominal operation
for the production of pure crystals of enantiomer ‘2’ is in region IV of Figure 2.2. In
the region III, all the three phases coexist, i.e. a liquid phase and a mixture of pure
crystals of the enantiomer ‘1’ and pure crystals of the enantiomer ‘2’.
The simple crystallizer model to be used subsequently is based on the following
assumptions
• quasi-static behavior
• isothermal operation
• ideal solubility as in Figure 2.2
• equal density of the liquid and the solid
Under these assumptions the model of the crystallizer accounting for the different
13
Chapter 2. Optimal design of chromatographic process combinations
operational regions in Figure 2.2 is given by
Qcrystevap = Qml +
2∑
1
Qi,crystal (2.8)
Qcrystevap xi,evap = Qml xi,ml + Qi,crystal (2.9)
Qi,crystal = ki [xi,ml − x∗i ] (2.10)
for all coupledprocessi = 1, 2
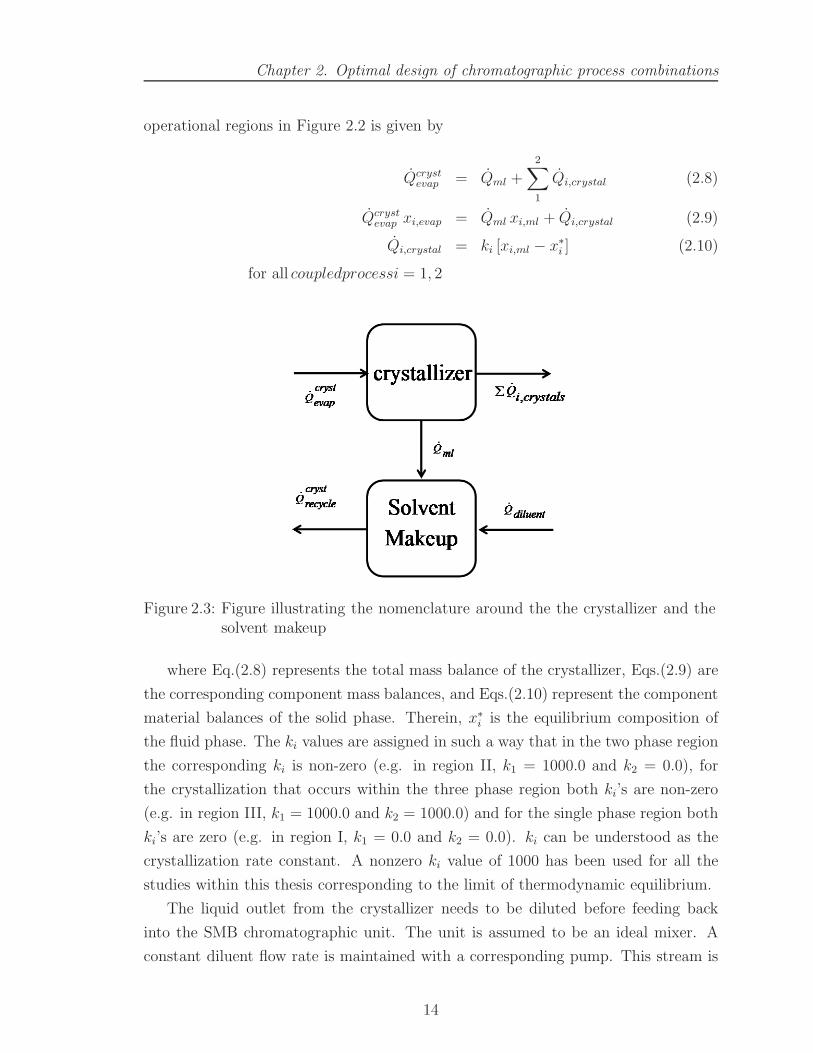
Figure 2.3: Figure illustrating the nomenclature around the the crystallizer and thesolvent makeup
where Eq.(2.8) represents the total mass balance of the crystallizer, Eqs.(2.9) are
the corresponding component mass balances, and Eqs.(2.10) represent the component
material balances of the solid phase. Therein, x∗i is the equilibrium composition of
the fluid phase. The ki values are assigned in such a way that in the two phase region
the corresponding ki is non-zero (e.g. in region II, k1 = 1000.0 and k2 = 0.0), for
the crystallization that occurs within the three phase region both ki’s are non-zero
(e.g. in region III, k1 = 1000.0 and k2 = 1000.0) and for the single phase region both
ki’s are zero (e.g. in region I, k1 = 0.0 and k2 = 0.0). ki can be understood as the
crystallization rate constant. A nonzero ki value of 1000 has been used for all the
studies within this thesis corresponding to the limit of thermodynamic equilibrium.
The liquid outlet from the crystallizer needs to be diluted before feeding back
into the SMB chromatographic unit. The unit is assumed to be an ideal mixer. A
constant diluent flow rate is maintained with a corresponding pump. This stream is
14
Chapter 2. Optimal design of chromatographic process combinations
in turn mixed with the fresh feed.
Qcrystrecycle = Qml + QDiluent (2.11)
Qcrystrecycle xi,recycle = Qml xi,ml (2.12)
Reactor model
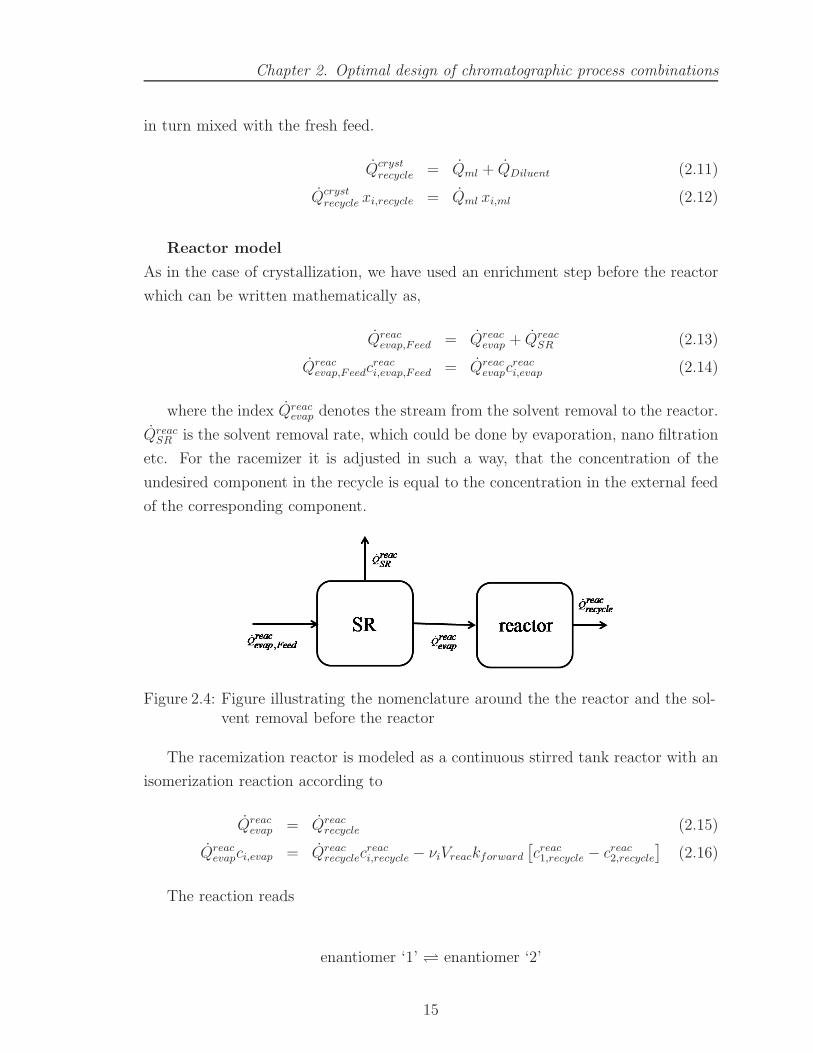
As in the case of crystallization, we have used an enrichment step before the reactor
which can be written mathematically as,
Qreacevap,F eed = Qreac
evap + QreacSR (2.13)
Qreacevap,F eedc
reaci,evap,F eed = Qreac
evapcreaci,evap (2.14)
where the index Qreacevap denotes the stream from the solvent removal to the reactor.
QreacSR is the solvent removal rate, which could be done by evaporation, nano filtration
etc. For the racemizer it is adjusted in such a way, that the concentration of the
undesired component in the recycle is equal to the concentration in the external feed
of the corresponding component.
Figure 2.4: Figure illustrating the nomenclature around the the reactor and the sol-vent removal before the reactor
The racemization reactor is modeled as a continuous stirred tank reactor with an
isomerization reaction according to
Qreacevap = Qreac
recycle (2.15)
Qreacevapci,evap = Qreac
recyclecreaci,recycle − νiVreackforward
[
creac1,recycle − creac
2,recycle
]
(2.16)
The reaction reads
enantiomer ‘1’ ⇋ enantiomer ‘2’
15

Chapter 2. Optimal design of chromatographic process combinations
with kforward being the reaction rate constant. Note that the equilibrium constant
is equal to 1 for a racemization. νi is the stoichiometric coefficient, which is equal to
+1 for the desired enantiomer ‘2’ and -1 for the undesired enantiomer ‘1’.
The recycle stream from the reactor and crystallizer or from the two crystallizers
are mixed with the fresh feed before feeding it to the SMB. It is assumed to be an
ideal mixer. It can be written as
Qfeed = QF0+ Qreac
recycle + Qcrystrecycle (2.17)
Qfeed ci,feed = QF0ci,F0 + Qreac
recycle creaci,recycle + Qcryst
recycle ccrysti,recycle (2.18)
2.2 Model system 1: PDE (Simple system)
In this section, we show the results of the optimal design for a pharmaceutical
intermediate called PDE. The adsorption equilibrium is of Langmuir type and the
solid-liquid-equilibrium for the crystallizer assumes ideal solubilities. The physico-
chemical parameters for PDE are provided in Appendix A. SMB-crystallization has
already been proposed as an interesting option for this compound [4, 16]. Chro-
matographic separation parameters are also available [54]. SLE for this system is of
conglomerate type [55]. Crystallization is assumed to occur at a fixed temperature
of 40oC. This corresponds to a mass fraction of 0.4 at the eutectic. The SMB unit
considered within this section is assumed to consist of 400 stages distributed equally
among the four zones.
In order to perform an optimal design, it is necessary to define an objective func-
tion. As an initial case, a simple well studied objective function is used, which is the
specific solvent consumption. It can be written mathematically as
QSolvent
QF0∗ (c1,F0 + c2,F0)
(2.19)
Solvent is defined as Q1 − Q4. The objective function given by Eq.(2.19) simultane-
ously minimizes solvent consumption and maximizes throughput. Optimization has
been performed within the modeling environment GAMS [56]. As fixed process struc-
tures such as SMB, SMB-crystallization, SMB-racemization etc. are optimized, it is
sufficient to solve a NLP problem. The CONOPT 3 solver based on a generalized
reduced gradient has been used for solution purposes [57].
16

Chapter 2. Optimal design of chromatographic process combinations
A general NLP problem can be written as
min f (x) (2.20)
s.t. h (x) = 0,
g (x) ≤ 0 .
Eq.(2.20) formulates the task of minimizing an objective or cost function f that
depends on continuous variables x. Equality constraints h are the mass balances,
thermodynamic relations and other process model equations. The inequality con-
straints g arise from the user restrictions such as minimum purity, yield etc. In the
present case, inequality constraints are imposed on SMB purities as well as on the
positive flow rates into and out of the SMB unit at the corresponding stages.
Optimal design is based on the steady state version of the model introduced in
the previous section.
2.2.1 SMB-crystallization
Depending on the location of the crystallizer two different scenarios can arise.
First of these would be called the extract configuration within this work. In this
configuration, the crystallizer occurs at the extract outlet and the stronger adsorbing
enantiomer, i.e. enantiomer ‘1’, is the desired product. The second scheme consists
of a crystallizer at the raffinate outlet of the SMB which is called the raffinate con-
figuration. This is the desired scenario when the weaker adsorbing enantiomer, i.e.
enantiomer ‘2’, is the desired product.
Slightly modified crystallization equations have been used for optimization pur-
poses. Instead of accounting for the different crystallization characteristics depending
on the region of the SLE, additional inequality constraints are imposed to restrict
the optimal design to region II for the extract configuration, or to region IV for
the raffinate configuration, respectively. The non crystallizing SMB outlet purity is
maintained at a value of 99% in order to limit the loss of the desired enantiomer.
The amount of diluent (QDiluent) added to the recycle is adjusted in such a way that
the concentration of the crystallizing component in the internal feed is equal to the
concentration in the external feed.
SMB-crystallization for the extract configuration was found to be 23.7% more
efficient than a stand-alone SMB using cost function given by Eq.(2.19). While for
the raffinate configuration, the process combination outperformed the stand alone unit
by 26.3%. Improvement will be even more pronounced for the lower stage numbers.
17

Chapter 2. Optimal design of chromatographic process combinations
The effect of stage number will be discussed in detail for the PPX system.
Kaspereit [4] has shown earlier that such an SMB-crystallization can be highly
beneficial using a computationally intensive approach. He combined the SMB char-
acterisitcs obtained from extensive parametric optimization of TMB with algebraic
relations defining the mass balances across the solvent removal and crystallization
units. While in this thesis, a more elegant model formulation optimizing all the units
simultaneously has been performed whereby the computational efficiency is increased
drastically. Optimal operational variables to be determined by the optimizer are the
flow rates of the SMB unit, the coupling purity and the solvent removal/addition
(QcrystSR /QDiluent) rate. The operational parameters corresponding to the optimal de-
sign for both the extract and the raffinate configurations are listed in Table 2.1.
Table 2.1: Optimal design for an SMB-crystallization processVariables Extract Raffinate
Q1[ml/min] 2.1796 1.4644
Q2[ml/min] 0.2861 0.75
Q3[ml/min] 1.0876 1.511
Q4[ml/min] 0.6811 0.7209
Qsolid[ml/min] 1.8696 1.8696
QcrystSR [ml/min] 1.8647 0.4168
QDiluent[ml/min] 0.2009 0.075Puritycoupling 78.75 83.23
QF0[ml/min] 0.5868 0.321
2.2.2 SMB-racemization
As has been done before, a steady state version of the model equations is used
here too. Two different case studies have been considered within this chapter. One
of them corresponds to what we call the “slow kinetics” for which Vreackforward =
0.1 and the purity requirements at the non-racemizing outlet have been fixed to 90
%. The second case study corresponds to a Vreackforward = 10000.0 which would be
referred to within this thesis as “fast kinetics”. The purity requirements for the latter
scenario has been maintained at a high value of 99 %.
The amount of solvent which needs to be removed (QreacSR ) is adjusted in such
a way that the concentration of the undesired enantiomer in the reactor outlet is
equal to the concentration in the external feed. Optimal operational variables to be
determined by the optimizer are the flow rates of the SMB unit, the coupling purity
and the solvent removal (QreacSR ). The optimal design parameters corresponding to
18

Chapter 2. Optimal design of chromatographic process combinations
the two case studies for racemization at the extract are given in Table 2.2. The
calculations have been repeated for the scenario when the racemization occurs at the
raffinate outlet and are provided in Table 2.3.
The primary benefit of SMB-racemization with respect to a stand-alone SMB
arises from the increase in yield from a maximum of 50% to a maximum of 100%.
In addition, a reduction of specific solvent consumption by around 20% was observed
when the reaction is in the equilibrium regime (fast reaction) for both the extract
and raffinate configurations. But, in the later part of this chapter it is shown that by
using a more detailed cost function, the improvement can be much more significant.
Table 2.2: Optimal design for an SMB-racemization process with racemization at theextract
Variables slow reaction fast reaction
Q1[ml/min] 1.7432 2.1796
Q2[ml/min] 0.25 0.2857
Q3[ml/min] 1.2074 1.0876
Q4[ml/min] 0.9852 0.6811
Qsolid[ml/min] 1.8696 1.8696
QreacSR [ml/min] 0.6127 1.3884Puritycoupling 82.22 78.72
QF0[ml/min] 0.0769 0.2963
Table 2.3: Optimal design for an SMB-racemization process with racemization at theraffinate
Variables slow reaction fast reaction
Q1[ml/min] 1.1291 1.4644
Q2[ml/min] 0.7313 0.7499
Q3[ml/min] 2.5 1.1511
Q4[ml/min] 0.6479 0.7209
Qsolid[ml/min] 1.8696 1.8696
QreacSR [ml/min] 0.1579 0.1912Puritycoupling 62.82 83.23
QF0[ml/min] 0.0746 0.1621
2.2.3 SMB-racemization-crystallization
After having discussed the optimal design of the two simple and straightforward
process combinations, we shift our attention to coupled processes which involve mul-
tiple combinations of the former two. The first multi-unit process combination which
19

Chapter 2. Optimal design of chromatographic process combinations
Table 2.4: Optimal design for an SMB-extract.racemization and raffi-nate.crystallization
Variables values
Q1[ml/min] 1.434374
Q2[ml/min] 0.315376
Q3[ml/min] 1.024929
Q4[ml/min] 0.635821
Qsolid[ml/min] 1.8696
QreacSR [ml/min] 0.726818
QcrystSR [ml/min] 0.371214
QDiluent[ml/min] 0.111113Purityextract 75.321035Purityraffinate 85.437920
QF0[ml/min] 0.198606
Table 2.5: Optimal design for an SMB-raffinate.racemization and ex-tract.crystallization
Variables values
Q1[ml/min] 1.32327440
Q2[ml/min] 0.39210279
Q3[ml/min] 1.00477873
Q4[ml/min] 0.63442873
Qsolid[ml/min] 1.8696
QcrystSR [ml/min] 0.91194584
QreacSR [ml/min] 0.09062685
QDiluent[ml/min] 0.14944738Purityextract 81.05755237Purityraffinate 80.96352825
QF0[ml/min] 0.17321029
is studied is called the “total process combination”. The scheme consists of an SMB
unit coupled with a crystallization at the desired enantiomer outlet and a racemiza-
tion at the undesired enantiomer outlet. Fast kinetics for racemization has only been
considered here. Two different possible options are available. Since it is a generic in-
vestigation, both the situations, extract being the desired product outlet or raffinate
being the desired product outlet have been considered. The result of the optimization
for this “total process combination” when crystallization is at the raffinate (desired
product) is shown in Table 2.4. In Table 2.5, the optimal design parameters for the
counter scenario, i.e. the extract outlet being the desired product has been provided.
It is also worth mentioning that including a crystallization can not only have an
economic impact, it can also increase the process robustness.
In such a process combination, the productivity can be improved because of the
presence of a crystallizer coupled to the SMB unit. This stems from the fact that
SMB can be operated at lower purities and simultaneously delivering pure crystals.
Further, due to the presence of racemization and recycle at the other outlet, the
separation scheme has a single product stream. Thus the yield of such a process
becomes 100%. In addition, the specific solvent consumption is reduced by about
44% irrespective of the location of the crystallizer and racemizer.
20

Chapter 2. Optimal design of chromatographic process combinations
2.2.4 SMB-crystallization-crystallization
Here, we calculate the optimal design of a process which involves crystallization
at both outlets. Unlike for racemization which can occur only at the undesired enan-
tiomer outlet, crystallization may occur at both the outlets irrespective of whether
both the enantiomers are desired or not. Table 2.6 shows the optimal operating con-
ditions for a hybrid process which involves SMB with enantio-selective crystallization
at both the outlets. In fact, it was observed that for certain cases, crystallizing the
undesired enantiomer alone may be economically beneficial depending on the stage
number, crystallizing outlet etc. (Results of section 2.3).
In contrast to a single crystallizer, here both the outlets can be operated at reduced
purities. This leads to a significant reduction in the solvent consumption. Also, since
the crystallizer delivers pure products, the loss of desired enantiomer at the undesired
outlet can be eliminated. These effects lead to a reduced specific solvent consumption.
An improvement of 57% is observed with respect to a stand-alone process in the
objective function. It needs to be mentioned that there are additional investments
and operating costs associated with the presence of additional crystallization and
racemization units. In this study, they have been neglected. These additional costs
may affect overall economics. Therefore, in the next section, a more detailed cost
function which takes into account these additional cost factors have been formulated
and the effect of those on process combinations have been discussed.
Table 2.6: Optimal design for an SMB-raff.crystallization and extr.crystallization pro-cess
Variables values
Q1[ml/min] 1.460361
Q2[ml/min] 0.407649
Q3[ml/min] 1.049641
Q4[ml/min] 0.655810
Qsolid[ml/min] 1.8696
QcrystSR,extract[ml/min] 1.033040
QcrystSR,raffinate[ml/min] 0.376999
QDiluent,extract[ml/min] 0.144091
QDiluent,raffinate[ml/min] 0.102864Purityextract 82.348184Purityraffinate 85.701256
QF0[ml/min] 0.378024
21

Chapter 2. Optimal design of chromatographic process combinations
2.3 Model system 2: 2’,6’-Pipecoloxylidide (PPX)
2’,6’-Pipecoloxylidide (PPX) is an intermediate in the manufacture of several
anaesthetics. It has a number of properties that make its production through an
integrated process interesting. A specific process combination for the production of
the pure S-enantiomer i.e enantiomer ‘2’ according to this thesis convention by steady
state recycling (SSR) chromatography, metal-catalyzed racemization and enantio-
selective crystallization has been studied very recently [58]. Here focus is on continu-
ous processing and a systematic evaluation of different process options. The discussion
in section 2.3 was in part already published in Kaspereit et al. [24].
In this publication a three step approach was proposed for the optimal design
of combined processes for the production of pure enantiomers [24]. The first of
these steps involves discarding/selecting the impossible/possible candidates based on
a qualitative criteria. For enantiomer production, the qualitative criteria can be based
on a decision tree such as the one shown in Figure 2.5. One of the characteristic exam-
ples of the use of a decision tree would be to discard hybrid SMB-crystallization pro-
cesses when the eutectic purity is high. In the second step, short cut methods which
are already available and based on equilibrium theory (analytical/semi-analytical) are
applied to analyze the potential of the selected process candidates. In the last step, a
detailed numerical optimization is employed to obtain optimal process configurations
and/or optimal operating conditions.
The three step approach has been employed for the development of improved pro-
duction processes for PPX. PPX is a compound-forming substance with a favorable
eutectic purity of 67%. Based on this property and the ease of racemization, the deci-
sion tree suggests a process combination consisting of chromatography, crystallization
and racemization as illustrated in Figure 1.3(d). Since the statement of a “reasonable”
eutectic composition is not quantitative, the chromatography-racemization process in
Figure 1.3(c) is also an interesting candidate.
The details of the chromatography, racemization and crystallization are available
elsewhere [58].
Since the adsorption isotherms are extremely complex i.e quadratic isotherm, as
can be seen from Appendix A, there are no shortcut methods available to design
SMB processes. Since it is not the primary topic of this thesis, we shift our attention
directly to the final step of the three step approach. For that purpose, a detailed
numerical optimization of the equations, developed in section 2.1 has been carried
out. .
22

Chapter
2.
Optim
aldesign
ofch
rom
atogra
phic
process
com
binatio
ns
Figure 2.5: Decision tree based on simple qualitative criteria for the selection of a suitable combined or integrated processconcept for the production of a pure enantiomer [24].
23

Chapter 2. Optimal design of chromatographic process combinations
2.3.1 Design of fixed process structures (NLP optimization)
In order to compare the effect of the various process combinations, it is necessary
to formulate a more detailed objective (cost) function based on process economics
than the one used for the model system 1, i.e. Eq.(2.19). So, for that purpose, we
propose and apply a cost function which is sufficiently general and does not depend on
highly industry/compound specific cost structure. Here, costs are measured in money
units per kg of product, i.e. [MU/kg product]. The cost function used here comprises
of cost contributions due to the feed cost Cf , personnel costs Cop and investment
costs Cinv according to
f = Cf + Cop + Cinv (2.21)
Feed and investment costs depend on the amount of racemate to be processed
Mrac in [kg racemate/hr], personnel costs are fixed in a given time frame leading to
f =(wf + winv)Mrac + wop
Y Mrac
=(wf + winv)Mprod/Y + wop
Mprod
(2.22)
with cost or weighting factors wf in [MU/kg racemate], winv in [MU/kg racemate]
and wop in [MU/hr]. Mprod = YMrac in [kg product/hr] is the amount of desired
enantiomer produced, with Y being the yield.
Examining the expression in Eq.(2.22), it can be seen that at low production rates
Mprod, the personnel costs are dominating and tending to infinity as the production
rate goes to zero. At high production rates, the other costs are dominating and tend-
ing towards the asymptotic value (wf + winv)/Y .
Mathematical optimization using the cost function defined by Eq.(2.22) is applied
to determine the optimal operating conditions for different process configurations.
Process configurations which have been considered for this model system are:
1. Stand-alone SMB process
2. SMB with racemization
3. Three different types of SMB processes with crystallization, namely :
(a) SMB with a crystallizer at the raffinate (product stream)
(b) SMB with a crystallizer at the extract (waste stream)
(c) SMB with a crystallizer at the raffinate as well as the extract
24

Chapter 2. Optimal design of chromatographic process combinations
4. SMB with racemization at the extract and crystallization at the raffinate outlet.
The six different process candidates mentioned above have been compared using
the cost function given by Eq.(2.22). However, it is worth mentioning, that an im-
plementation of much more detailed cost functions such as in Jupke et al. [59] into
the optimization framework discussed here is straightforward.
The cost function given by Eq.(2.22) also allows a preliminary discussion of the
basic effects of racemization and crystallization on process economics. The initial ob-
jective is to evaluate the effect of racemization. In order to achieve that, a stand-alone
SMB chromatographic unit is compared with a coupled process, where the undesired
enantiomer is racemized and the reactor outlet is subsequently recycled back to the
SMB unit according to Figure 1.3(c). This corresponds to the 2nd candidate in the
list of possible process configurations mentioned previously. In the PPX example
the undesired enantiomer is obtained at the extract outlet of the SMB. The most
important effect of the racemization is an increase of the overall yield from 50% in
the stand-alone SMB to a maximum of 100% in the process combination. It is worth
noting, that this effect on the simple cost function can be readily predicted without
knowing the optimal process conditions, i.e. without a detailed mathematical opti-
mization. The effect is illustrated in Figure 2.6 as a function of the production rate.
For demonstration purposes, equal cost factors of 1.0 for wf , winv, wop are assumed for
the stand-alone process, whereas a 20% increase in investment and operational costs
are assumed for the process with racemization (i.e. winv, wop = 1.2 for the coupled
process) in Figure 2.6(a). At low production rates the personnel costs are dominant
and thus minimizing the benefit through an improved overall yield. At high produc-
tion rates, the other costs are dominating leading to a significant cost reduction for
the coupled process. In between, there is a break even point at a production rate of
0.1 in Figure 2.6(a). The difference between the stand-alone and the coupled process
increases with increasing feed costs as illustrated in Figure 2.6(b) for wf = 10, shifting
the break even point to even lower production rates not shown anymore in Figure
2.6(b). The cost reduction for the coupled process will tend to a maximum of 50%
for increasing production rates and increasing feed costs due to a 100% increase of
yield compared to the stand-alone process.
An additional scope for improvement of the coupled process follows from the fact
that the purity requirements for the feed to the racemizer can be relaxed leading to
an increase of productivity of the SMB unit. However, to quantify this effect, rigorous
optimization of the coupled process is required. Details will be discussed later in this
chapter.
25

Chapter
2.
Optim
aldesign
ofch
rom
atogra
phic
process
com
binatio
ns
0 0.5 1 1.5 20
5
10
15
20
25
30
cost
s [M
U/k
g pr
oduc
t]
Mprod
[kg product/hr]
(a) cheap feed, wf=1
0 0.5 1 1.5 210
15
20
25
30
35
40
45
cost
s [M
U/k
g pr
oduc
t]M
prod [kg product/hr]
(b) expensive feed, wf=10
Figure 2.6: Costs as a function of production rate of a stand-alone SMB as in Figure 1.3(a) (dashed line), compared to an SMBprocess coupled with a racemizer as in Figure 1.3(c) (solid line) for two different feed cost scenarios.
26
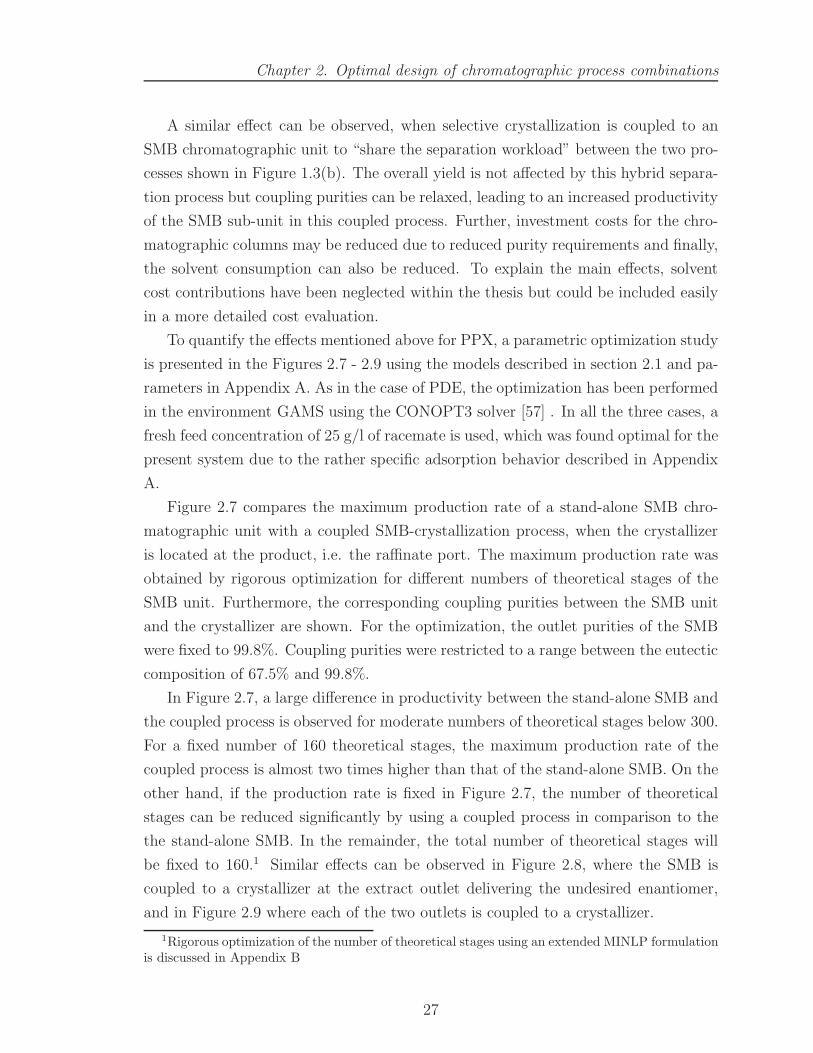
Chapter 2. Optimal design of chromatographic process combinations
A similar effect can be observed, when selective crystallization is coupled to an
SMB chromatographic unit to “share the separation workload” between the two pro-
cesses shown in Figure 1.3(b). The overall yield is not affected by this hybrid separa-
tion process but coupling purities can be relaxed, leading to an increased productivity
of the SMB sub-unit in this coupled process. Further, investment costs for the chro-
matographic columns may be reduced due to reduced purity requirements and finally,
the solvent consumption can also be reduced. To explain the main effects, solvent
cost contributions have been neglected within the thesis but could be included easily
in a more detailed cost evaluation.
To quantify the effects mentioned above for PPX, a parametric optimization study
is presented in the Figures 2.7 - 2.9 using the models described in section 2.1 and pa-
rameters in Appendix A. As in the case of PDE, the optimization has been performed
in the environment GAMS using the CONOPT3 solver [57] . In all the three cases, a
fresh feed concentration of 25 g/l of racemate is used, which was found optimal for the
present system due to the rather specific adsorption behavior described in Appendix
A.
Figure 2.7 compares the maximum production rate of a stand-alone SMB chro-
matographic unit with a coupled SMB-crystallization process, when the crystallizer
is located at the product, i.e. the raffinate port. The maximum production rate was
obtained by rigorous optimization for different numbers of theoretical stages of the
SMB unit. Furthermore, the corresponding coupling purities between the SMB unit
and the crystallizer are shown. For the optimization, the outlet purities of the SMB
were fixed to 99.8%. Coupling purities were restricted to a range between the eutectic
composition of 67.5% and 99.8%.
In Figure 2.7, a large difference in productivity between the stand-alone SMB and
the coupled process is observed for moderate numbers of theoretical stages below 300.
For a fixed number of 160 theoretical stages, the maximum production rate of the
coupled process is almost two times higher than that of the stand-alone SMB. On the
other hand, if the production rate is fixed in Figure 2.7, the number of theoretical
stages can be reduced significantly by using a coupled process in comparison to the
the stand-alone SMB. In the remainder, the total number of theoretical stages will
be fixed to 160.1 Similar effects can be observed in Figure 2.8, where the SMB is
coupled to a crystallizer at the extract outlet delivering the undesired enantiomer,
and in Figure 2.9 where each of the two outlets is coupled to a crystallizer.
1Rigorous optimization of the number of theoretical stages using an extended MINLP formulationis discussed in Appendix B
27

Chapter 2. Optimal design of chromatographic process combinations
100 200 300 400
4
8
12
16
Total number of stages
Mpr
od,m
ax
100 200 300 4000.85
0.9
0.95
1
Total number of stages
Cou
plin
g pu
rity
Figure 2.7: Maximum production rates and coupling purity as a function of the totalnumber of theoretical stages of a stand-alone SMB (dashed line) comparedto an SMB process with a crystallizer at the raffinate.
100 200 300 400
4
8
12
16
20
Total number of stages
Mpr
od,m
ax
100 200 300 400
0.8
0.85
0.9
Total number of stages
Cou
plin
g pu
rity
Figure 2.8: Maximum production rates and coupling purity as a function of the totalnumber of theoretical stages of a stand-alone SMB (dashed line) comparedto an SMB process with a crystallizer at the extract.
28

Chapter 2. Optimal design of chromatographic process combinations
100 200 300 400
4
8
12
16
20
Total number of stages
Mpr
od,m
ax
100 200 300 4000.85
0.9
0.95
1
Total number of stages
Cou
plin
g pu
rity
Raffinate
Extract
Figure 2.9: Maximum production rates and coupling purity as a function of the totalnumber of theoretical stages of a stand-alone SMB (dashed line) comparedto an SMB process with a crystallizer at the raffinate and a crystallizerat the extract.
29

Chapter 2. Optimal design of chromatographic process combinations
After illustrating the basic effects, the effect of various process combinations men-
tioned above on the simplified cost functions will be evaluated in detail by means
of rigorous NLP optimization. Results are provided in Table 2.7. Cost factors
wf , winv, wop for the SMB unit are assumed to be equal to one. Again, for the
racemization a twenty percent increase in investment and operational costs are as-
sumed. Since crystallization is required anyhow in most cases to obtain crystalline
products, no extra costs for the crystallization have been taken into account.
Rigorous optimization results as presented in Table 2.7 are fully consistent with
our earlier discussion. Namely, the productivity of the overall process can be increased
significantly if a crystallizer is coupled to the SMB process. Although the effect
on costs is moderate for the present arbitrary cost model, it can be much more
pronounced if operational (personnel) costs have a stronger weight. The strongest
improvement is observed for the racemization, which leads to a reduction in costs
of 45%. Besides the increased overall yield by factor 2 an additional increase in
the optimal production rate is observed due to reduced coupling purity as discussed
above.
Table 2.7: NLP calculations for PPX for a total number of 160 theoretical stagesProcess Objective function Optimal production rate raff., extr. puritySMB 4.301 3.315 99.8, 99.8
SMB-raff.cryst 4.158 6.330 96.3, 99.8SMB-extr.cryst 4.148 6.735 99.8, 87.3SMB-two.cryst 4.113 8.831 97.0, 88.8
SMB-rac 2.364 7.289 99.8, 79.0SMB-rac-cryst 2.318 10.211 96.2, 74.4
2.3.2 Simultaneous design of the process structure and operating condi-
tions (MINLP optimization)
Until now, the focus has been on the design of a priorily fixed process configura-
tions. But often, at an early design stage, the optimal configuration is not known and
needs to be determined along with the operating conditions for the same. This can be
achieved using either a Mixed Integer Non Linear Programming (MINLP) approach
or by an extensive enumeration techinique. In the latter approach, we evaluate all
the possible process options by means of NLP optimization and determine the best
candidate. This approach can be computationally challenging when the number of
process combinations is large.
30

Chapter 2. Optimal design of chromatographic process combinations
In this thesis, we use the more elegant MINLP approach for simultaneous determi-
nation of process structure and operating conditions. A generalized MINLP problem
can be written as
min f (x, y) (2.23)
s.t. h (x, y) = 0,
g (x, y) ≤ 0 .
Depending on the objective function, process constraints etc., the optimization
algorithm calculates the optimal process configuration (sub-structure) from the su-
perstructure by means of binary decision variables y ∈ {0, 1}. Since the formulation
involves both the integer y and continuous variables x, the optimal process struc-
ture as well as the optimal perating conditions are obtained simultaneously from
Eqs.(2.23).
The superstructure to be discussed subsequently is shown in Figure 2.10. In this
figure, ’SR’ stands for solvent removal, ’SM’ for solvent makeup, ’Rac’ for racemiza-
tion, ’Crys’ for crystallization. The binary decision variables yi with i = RR,RO,RC,
EC,ER,EO, also shown in Figure 2.10, specify, whether the corresponding flowrate
is zero (yi = 0) or finite (yi = 1). In this notation, the first index refers to the raffinate
(’R’) or extract (’E’) outlet of the SMB whereas the second index refers to the type of
process connected to this outlet, i.e. ’R’ for racemizer, ’C’ for crystallizer and ’O’ if
no further processing step is connected to the stream. In the present case, additional
constraints have to be taken into account according to
yRR = 0,∑
i
yR,i = 1,∑
i
yE,i = 1 (2.24)
meaning that exactly one flow is active at the raffinate and the extract side. Also,
additional conditions are enforced so that no racemizer is located at the raffinate side,
where the desired enantiomer is obtained with high purity. It is worth noting, that
the number of stages for the SMB unit can also be optimized in a similar way with
additional binary decision variables, which specify whether a tray in a given SMB
superstructure is active or not. Such strategies are illustrated in Appendix B. For
simplicity, however, focus in the following is on a fixed total number of 160 stages like
in the previous section.
For the MINLP optimization with fixed number of stages, the simplified cost
function from the previous section is extended to account for the various process
31
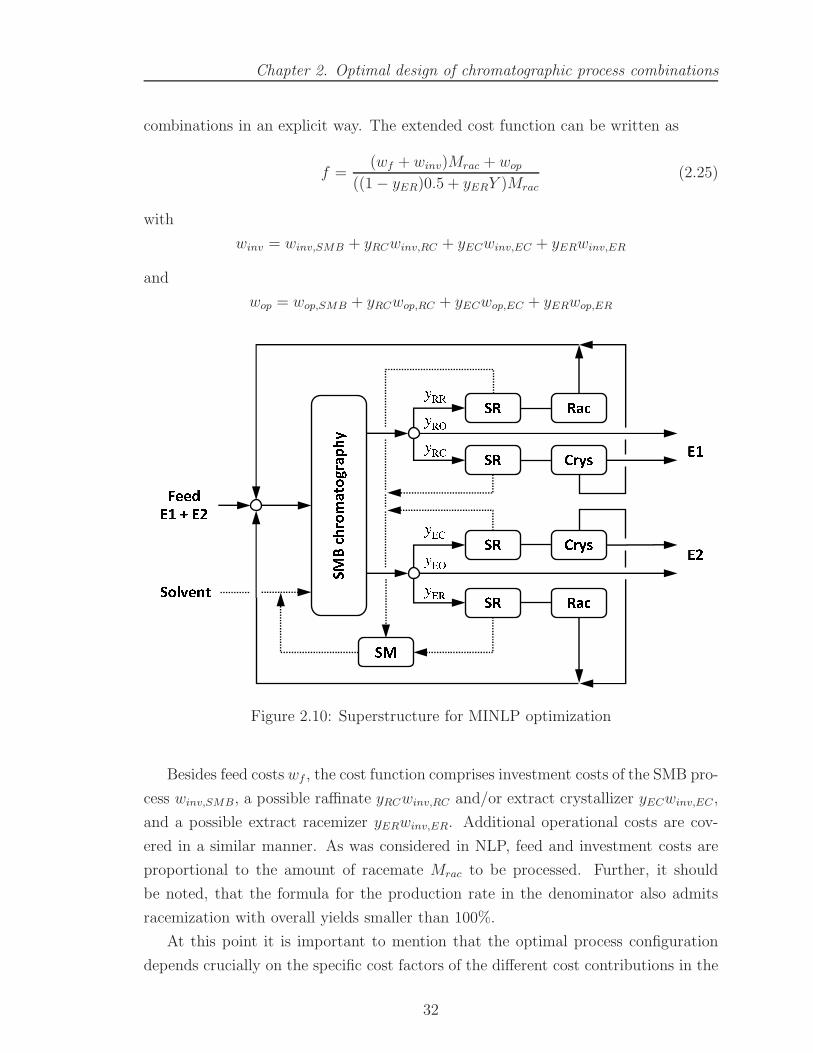
Chapter 2. Optimal design of chromatographic process combinations
combinations in an explicit way. The extended cost function can be written as
f =(wf + winv)Mrac + wop
((1 − yER)0.5 + yERY )Mrac
(2.25)
with
winv = winv,SMB + yRCwinv,RC + yECwinv,EC + yERwinv,ER
and
wop = wop,SMB + yRCwop,RC + yECwop,EC + yERwop,ER
Figure 2.10: Superstructure for MINLP optimization
Besides feed costs wf , the cost function comprises investment costs of the SMB pro-
cess winv,SMB, a possible raffinate yRCwinv,RC and/or extract crystallizer yECwinv,EC ,
and a possible extract racemizer yERwinv,ER. Additional operational costs are cov-
ered in a similar manner. As was considered in NLP, feed and investment costs are
proportional to the amount of racemate Mrac to be processed. Further, it should
be noted, that the formula for the production rate in the denominator also admits
racemization with overall yields smaller than 100%.
At this point it is important to mention that the optimal process configuration
depends crucially on the specific cost factors of the different cost contributions in the
32

Chapter 2. Optimal design of chromatographic process combinations
Eq.(2.25). For a given cost function, the optimal process can be determined directly
by MINLP optimization. Exemplary results are given in Table 2.8.
The process configuration given in the first line of Table 2.8 is obtained when
using the same weighting factors as in the cost function of section 2.3.1. As expected,
the SMB plus the racemization at the extract and the crystallization at the raffinate
is the best configuration, if no additional costs for the crystallization are taken into
account according to our earlier argument. In the second line, additional costs for
crystallization are considered which counterbalances the benefit of potential crystal-
lizers leading to an elimination of the crystallizers in the optimal process structure,
given in the first row. In a similar way, the racemizer will be eliminated for an ex-
pensive racemization with reduced yields in line 3. High investment costs may be
due to an expensive catalyst, as an example. Racemizers and crystallizers will be
eliminated if the two previous cost factors are added which leads to a stand-alone
SMB in line four. In a similar way, the SMB plus the crystallizer at the extract or
raffinate are obtained in line 5 and 6 of Table 2.8 for an expensive racemization with
low yield, if the respective other crystallizer is penalized with high costs. The two
latter examples are a bit artifical, but are useful to demonstrate the full capacity of
the MINLP optimization employed here.
All MINLP calculations were done in GAMS [56] using the DICOPT MINLP
solver [60] with CPLEX for the MILP sub problems and CONOPT for the NLP sub
problems.
2.4 Summary
In this chapter, methods for optimal design of combined processes for the pro-
duction of pure enantiomers were introduced and illustrated with two case studies.
For the first system, an intermediate chemical compound called PDE, NLP opti-
mization was used to determine optimal operating conditions for some given SMB-
racemization-crystallization processes. For demonstrating the potential of the pro-
cess combinations, specific solvent consumption was considered as a simplified cost
function. A more detailed cost function together with a simultaneous MINLP opti-
mization pf process configuration and process structure was demonstrated here for
the first time for a second compound with highly nonlinear adsorption behavior called
PPX. For simplicity the number of stages was fixed in a first step. Extended formula-
tions with variable number of stages are presented in Appendix B. This gives rise to
a large number of additional binary variables which clearly underlines the usefulness
33

Chapter 2. Optimal design of chromatographic process combinations
of advanced optimization methods in this context
In most of the cases, the optimal design consisted of single or multiple recycle
streams. The dynamics of these non-linear recycle systems is non-trivial and requires
a critical analysis. Therefore, in the next step, we study the effect of disturbances
on process behavior. This is decisive in view of practical operability of the process.
The results of these dynamic investigations are discussed in the next two chapters
for the two different process combinations namely SMB-crystallization and SMB-
racemization.
34

Chapter
2.
Optim
aldesign
ofch
rom
atogra
phic
process
com
binatio
ns
Table 2.8: MINLP calculations for PPX for a total number of 160 theoretical stages. All MINLP calculations were performedin GAMS using the DICOPT MINLP solver with CPLEX for the MILP sub-problems and CONOPT for the NLPsub-problems.
Optimal process wf winv,SMB winv,ER winv,EC winv,RC wop,SMB wop,ER wop,EC wop,RC YSMB-rac-cryst 1.0 1.0 0.2 0.0 0.0 1.0 0.2 0.0 0.0 1.0
SMB-rac 1.0 1.0 0.2 0.2 0.2 1.0 0.2 0.2 0.2 1.0SMB-two-cryst 1.0 1.0 0.5 0.0 0.0 1.0 0.2 0.0 0.0 0.7
SMB 1.0 1.0 0.5 0.2 0.2 1.0 0.2 0.2 0.2 0.7SMB-extr.cryst 1.0 1.0 0.5 0.0 0.2 1.0 0.2 0.0 0.2 0.7SMB-raff.cryst 1.0 1.0 0.5 0.2 0.0 1.0 0.2 0.2 0.0 0.7
35

Chapter 3
Dynamics and control of
SMB-crystallization processes
It has already been shown that the process combinations such as SMB-crystallizati-
on, SMB-racemization, SMB-crystallization-racemization etc. outperform the stand-
alone SMB in terms of process performance. In the previous chapter, optimization
techniques were introduced to design those favorable process structures, one of them
being SMB-crystallization, which is the investigated process within this chapter. Since
the optimal process schemes are often multi-unit recycle systems with inherent non-
linearities, process dynamics is non-trivial. This implies that the steady state optimal
design described in the previous chapter alone is not sufficient to ensure process oper-
ability. Process dynamics is also very important in terms of practical implementation.
Thus, in the first step, we study the dynamics of an SMB-crystallization process sub-
jected to step disturbances of the external feed flow rate and concentration. Since
the dynamic investigations reveal undesired characteristics, simple feed back control
strategies are proposed. They form the basis for the current chapter. As a benchmark
problem the PDE enantiomers are considered [4, 55]. Numerical investigation for the
dynamic process models has been performed using the simulation environment DIVA
[61]
3.1 Open loop dynamics
3.1.1 Robust design
In chapter 2, optimal design of SMB-crystallization process has been addressed.
Figure 3.1 shows the optimal design for the extract and the raffinate configuration
36

Chapter 3. Dynamics and control of SMB-crystallization processes
Table 3.1: Robust design for an SMB-crystallization processVariables Extract Raffinate
Q1[ml/min] 2.1856 1.5721
Q2[ml/min] 0.3949 0.7571
Q3[ml/min] 1.1067 1.1861
Q4[ml/min] 0.6981 0.7344
Qsolid[ml/min] 1.8696 1.8696
QcrystSR [ml/min] 1.7663 0.4374
QDiluent[ml/min] 0.148 0.0806Puritycoupling 85.77 86.96
QF0[ml/min] 0.5538 0.3429
in the rectangular phase diagram. The optimal process is always located at the
boundary between the two and the three phase regions in Figure 3.1. This is due to
the fact, that the maximum amount of crystalline product is obtained at the boundary.
However in view of practical operation, this may not be the ideal solution since process
operation around this point would be extremely sensitive. The smallest disturbance
in the wrong direction would move the process into the three phase region whereby
the product specifications would be lost. Hence, to be operable at all, an extra
safety margin was introduced in the optimization and a new set of design parameters
referred to as “Robust design” have been obtained. Robust design parameters have
been calculated with a safety margin of 15% with respect to the eutectic purity. This
corresponds to about 25% decrease in the mass fraction of the undesired enantiomer
from the eutectic composition of 0.4. They are also shown in Figure 3.1 and serve
as the optimal/nominal operating point for the dynamic analysis studied in the next
section. The robust design parameters are given in Table 3.1. The procedure has
been repeated for both the extract as well as raffinate.
3.1.2 Extract configuration
In order to study the process dynamics, a standard SMB pump configuration is
applied (see e.g. [62]). Figure 3.2 shows a combined SMB-crystallization process
with a crystallizer at the extract outlet of the SMB unit which is studied in the
initial part of this chapter. This is termed as the extract configuration within this
thesis. It is worth noting that the direction of the liquid flow in combination with the
pump configuration introduces a certain asymmetry. Operational consequences of this
asymmetry for the extract configuration will be discussed subsequently. Afterwards,
the consequences of this asymmetry on the process dynamics when the crystallizer is
37

Chapter 3. Dynamics and control of SMB-crystallization processes
0.0 0.2 0.4 0.6 0.8 1.00.0
0.2
0.6
0.8
1.0
0.4
I
IV
II
IIIE
Raffinateconfiguration
Puresolvent
Extractconfiguration
Pure crystals ofenantiomer 1
Pure crystals ofenantiomer 2
X1
X2
Figure 3.1: Optimal and robust operating points obtained from steady state opti-mization. Red indicates the optimal operating points and blue shows therobust operating points. ◦ – composition of feed to the crystallizer, � –composition of the mother liquor. xi represents the mass fraction of thecorresponding enantiomer.
38

Chapter 3. Dynamics and control of SMB-crystallization processes
at the raffinate outlet of the SMB will also be treated.
Figure 3.2: Schematic diagram for an SMB-crystallization with a crystallizer at theextract
Two different types of disturbances are investigated, namely step disturbances of
the external feed flow rate and of the external feed concentration. Disturbances of the
external feed composition show similar effects like external feed concentration and are
therefore not explicitly considered. Nominal operating points for the studies within
this chapter correspond to the robust design parameters presented in Table 3.1.
Let us first focus on the extract configuration shown in Figure 3.2. In Figure 3.2
Qexternal(Raffinate) denotes the raffinate flow rate which is given by Q3 - Q4. Fig-
ure 3.3 shows the effect of positive disturbances of the external feed concentration
with +5, +10 and +17.5% of magnitude. Figure 3.3(a) shows the mass flow rate of
crystals out of the crystallizer of the desired (thick lines) and the undesired enantiomer
(thin lines). Initially, only the desired enantiomer is crystallized. Due to the robust
design, i.e. the design of Table 3.1, the process can tolerate a small disturbance of
+5% of the external feed concentration without moving to the three phase region and
crystallizing the undesired enantiomer. In contrast to this, the larger disturbances of
+10 and +17.5% lead to the crystallization of the undesired enantiomer and loss of
the product specifications. In addition, for the largest disturbance of 17.5%, stability
39

Chapter 3. Dynamics and control of SMB-crystallization processes
is lost, leading to self sustained oscillations located entirely in the three phase region.
A more detailed analysis revealed, that in this case, stability is lost through a Hopf
bifurcation [63].
The effect on the flow rates illustrated in Figure 3.3(b) and (c) is less pronounced.
This is a direct consequence of the type of disturbance and a consequence of the
pump configuration of the SMB unit illustrated in Figure 3.2. It must be noted
that this pump configuration implies that the extract flow rate is implicitly fixed.
As a consequence the recycle rate is almost constant. Changes in the flow rates of
the SMB unit are transmitted directly to the raffinate flow rate. This is even more
obvious regarding disturbances of the external feed flow rate to be discussed below.
Step disturbances of the external feed concentration in the negative direction were
also examined. For a decrease of the feed concentration from the nominal value, the
process moved further into the two phase region, which was therefore not critical and
is not discussed any further.
Figure 3.4 shows the effect of disturbances of the external feed flow rate by -
5, -10 and -33%. As explained above, the recycle flow rate is almost constant as
a consequence of the pump configuration. Changes of the external feed flow rate
are directly transmitted to the raffinate outlet and therefore have only a moderate
effect on the product purities of the SMB unit as illustrated in Figure 3.4(d) and
in turn also a moderate effect on the operation of the crystallizer. Only for a very
large disturbance of the external feed flow rate of -33%, small amounts of undesired
enantiomer are crystallized as illustrated in the zoom of Figure 3.4(a).
Disturbances of the external feed flow rate in the positive direction were found to
be even less critical.
40

Chapter
3.
Dynam
icsand
contro
lofSM
B-cry
stalliza
tion
processes
0 5 10 15 200
2
4
6
8
10
12
14
Simulation time[hr]
Mas
s flo
w r
ate
of c
ryst
als
[mg/
min
]
0 5 10 15 200.155
0.1555
0.156
0.1565
0.157
0.1575
0.158
0.1585
0.159
Simulation time[hr]
Rec
ycle
flow
rat
e [m
l/min
]
0 5 10 15 200.4055
0.406
0.4065
0.407
0.4075
0.408
0.4085
0.409
0.4095
Simulation time[hr]
Raf
finat
e flo
w r
ate
[ml/m
in]
0 5 10 15 200.8
0.85
0.9
0.95
1
Simulation time[hr]
Pur
ity
0 5 10 15 207.85
7.9
7.95
8
8.05
8.1
8.15
Simulation time[hr]
Con
cent
ratio
n stro
ngex
trac
t [g/l]
0 5 10 15 200
1
2
3
4
5
Simulation time[hr]
Con
cent
ratio
n stro
ngra
ffina
te [g
/l]
(a) (b) (c)
(d) (e) (f)
Figure 3.3: Effect of step disturbances of the external feed concentration for a crystallizer at the extract. Blue is for +5%disturbance, red is for +10% and green is for +17.5%. Thick lines in the figure (a) denote the crystals of theenantiomer 1 and thin lines in figure (a) denote crystals of the enantiomer 2. Thick lines in the figure (d) representthe extract purities and thin lines in the figure (d) represent the raffinate purities.
41

Chapter
3.
Dynam
icsand
contro
lofSM
B-cry
stalliza
tion
processes
0 5 10 15 200
2
4
6
8
10
12
Simulation time[hr]
Mas
s flo
w r
ate
of c
ryst
als
[mg/
min
]
0 5 10 15 200.158
0.16
0.162
0.164
0.166
0.168
0.17
Simulation time[hr]
Rec
ycle
flow
rat
e [m
l/min
]
0 5 10 15 200.2
0.25
0.3
0.35
0.4
0.45
Simulation time[hr]
Raf
finat
e flo
w r
ate
[ml/m
in]
0 5 10 15 200.7
0.75
0.8
0.85
0.9
0.95
1
Simulation time[hr]
Pur
ity
0 5 10 15 205.5
6
6.5
7
7.5
8
Simulation time[hr]
Con
cent
ratio
n stro
ngex
trac
t [g/l]
0 5 10 15 200.2
0.22
0.24
0.26
0.28
0.3
0.32
Simulation time[hr]C
once
ntra
tion st
rong
raffi
nate [g
/l]
0 20 400
0.02
0.04
(a) (c)(b)
(d) (e) (f)
Figure 3.4: Effect of step disturbances of the external feed flow rate for a crystallizer at the extract. Blue is for -5% disturbance,red is for -10% and green is for -33%. Meaning of the thick and the thin lines in figures (a) and (d) is as in Figure 3.3.
42
Chapter 3. Dynamics and control of SMB-crystallization processes
3.1.3 Raffinate configurations
Next, discussion is extended to an SMB-crystallization process with a crystallizer
at the raffinate outlet of the SMB unit. In a first step a pump configuration according
to Figure 3.2 is also applied to the raffinate configuration (configuration 1). Due to
this pump configuration flow rate as well as the composition of the raffinate stream
may change. This makes this configuration much more sensitive to disturbances of
the external feed concentration as well as to the disturbances of the external feed flow
rate compared to the process configuration with a crystallizer at the extract of the
previous section. The amount of solvent removed from the system (QcrystSR ) remains
constant irrespective of the changes on the raffinate stream flow rate.
Figure 3.5 illustrates the open loop dynamics for a positive (+20% red)and a neg-
ative (-12.5%, blue) step disturbance of the external feed concentration. In general, a
larger sensitivity to negative disturbances was observed. However, in contrast to the
extract configuration, for both, the positive and negative disturbance, formation of
crystals of undesired enantiomer is observed in Figure 3.5. This is due to changes of
the composition and the flow rates in the recycle loop and their mutual interaction.
In contrast to the extract configuration, no oscillations were observed for the raffinate
configuration.
Due to the specific pump configuration, sensitivity with respect to the disturbances
of the external feed flow rate is even more pronounced. This is illustrated in Figure 3.6
for small disturbances of about ±0.5%, which have already large effects, especially
on the raffinate flow rate. For the positive disturbance (red lines in Figure 3.6), the
raffinate flow rate is decreased. Since the solvent removal rate is fixed, this causes a
shift to the three phase region leading to the formation of crystals of an undesired
enantiomer. For the negative disturbance (blue lines in Figure 3.6), the raffinate
flow rate is increased significantly and the process is shifted towards the single phase
region (region I in the Figure 3.1) leading to a drastic reduction in crystals of the
desired enantiomer.
43

Chapter
3.
Dynam
icsand
contro
lofSM
B-cry
stalliza
tion
processes
0 5 10 15 200
1
2
3
4
5
6
7
Simulation time[hr]
Mas
s flo
w r
ate
of c
ryst
als
[mg/
min
]
0 5 10 15 200.08
0.082
0.084
0.086
0.088
0.09
0.092
0.094
Simulation time[hr]
Rec
ycle
flow
rat
e [m
l/min
]
0 5 10 15 200.445
0.45
0.455
0.46
Simulation time[hr]
Raf
finat
e flo
w r
ate
[ml/m
in]
0 5 10 15 200.7
0.75
0.8
0.85
0.9
0.95
1
Simulation time[hr]
Pur
ity
0 5 10 15 206
6.5
7
7.5
8
8.5
9
9.5
10
Simulation time[hr]
Con
cent
ratio
n stro
ngex
trac
t [g/l]
0 5 10 15 202
3
4
5
6
7
8
9
10
Simulation time[hr]C
once
ntra
tion st
rong
raffi
nate [g
/l]
(a) (b) (c)
(e)(d) (f)
Figure 3.5: Effect of step disturbances of the external feed concentration for a crystallizer at the raffinate (configuration 1).Red is for +20% disturbance and blue is for -12.5%. Meaning of the thick and the thin lines in figures (a) and (d)is as in Figure 3.3.
44

Chapter
3.
Dynam
icsand
contro
lofSM
B-cry
stalliza
tion
processes
0 5 10 15 200
1
2
3
4
5
6
7
8
Simulation time[hr]
Mas
s flo
w r
ate
of c
ryst
als
[mg/
min
]
0 5 10 15 200.08
0.085
0.09
0.095
0.1
0.105
Simulation time[hr]
Rec
ycle
flow
rat
e [m
l/min
]
0 5 10 15 200.448
0.45
0.452
0.454
0.456
0.458
0.46
0.462
0.464
Simulation time[hr]
Raf
finat
e flo
w r
ate
[ml/m
in]
0 5 10 15 200.8
0.85
0.9
0.95
1
Simulation time[hr]
Pur
ity
0 5 10 15 207.2
7.4
7.6
7.8
8
8.2
8.4
8.6
Simulation time[hr]
Con
cent
ratio
n stro
ngex
trac
t [g/l]
0 5 10 15 202.5
3
3.5
4
4.5
5
5.5
Simulation time[hr]C
once
ntra
tion st
rong
raffi
nate [g
/l]
(a) (b) (c)
(d) (e) (f)
Figure 3.6: Effect of step disturbances of the external feed flow rate for a crystallizer at the raffinate (configuration 1). Blue isfor -0.5% disturbance and red is for + 0.5%. Meaning of the thick and the thin lines in figures (a) and (d) is as inFigure 3.3.
45

Chapter 3. Dynamics and control of SMB-crystallization processes
Figure 3.7: Schematic diagram for the alternative raffinate configuration (configura-tion 2)
This high sensitivity to disturbances of the raffinate configuration can easily be
rectified by adapting the pump configuration to fix the raffinate instead of the ex-
tract flow rate. One corresponding alternative pump configuration (configuration 2)
is shown in Figure 3.7. For validation, the open loop dynamics for disturbances of the
external feed flow rate with the alternative pump configuration are illustrated in Fig-
ure 3.8. From Figure 3.8 we conclude that the alternative configuration can tolerate
much larger disturbances (± 7.5% in Figure 3.8 compared to ± 0.5 % in Figure 3.6)
without the formation of crystals of the undesired enantiomer and achieves a similar
performance like the extract configuration in Figure 3.2. Nevertheless, tolerable dis-
turbances are of course limited, underlining the necessity of control which is discussed
in the next section.
46
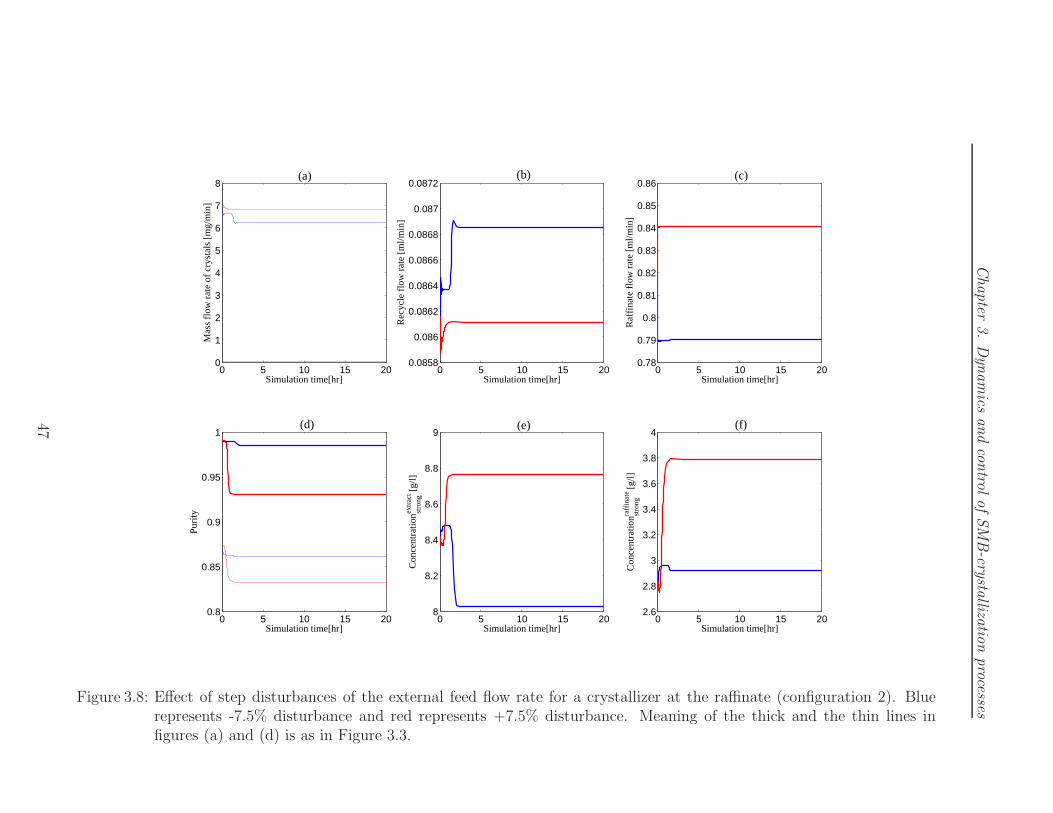
Chapter
3.
Dynam
icsand
contro
lofSM
B-cry
stalliza
tion
processes
0 5 10 15 200
1
2
3
4
5
6
7
8
Simulation time[hr]
Mas
s flo
w r
ate
of c
ryst
als
[mg/
min
]
0 5 10 15 200.0858
0.086
0.0862
0.0864
0.0866
0.0868
0.087
0.0872
Simulation time[hr]
Rec
ycle
flow
rat
e [m
l/min
]
0 5 10 15 200.78
0.79
0.8
0.81
0.82
0.83
0.84
0.85
0.86
Simulation time[hr]
Raf
finat
e flo
w r
ate
[ml/m
in]
0 5 10 15 200.8
0.85
0.9
0.95
1
Simulation time[hr]
Pur
ity
0 5 10 15 208
8.2
8.4
8.6
8.8
9
Simulation time[hr]
Con
cent
ratio
n stro
ngex
trac
t [g/l]
0 5 10 15 202.6
2.8
3
3.2
3.4
3.6
3.8
4
Simulation time[hr]C
once
ntra
tion st
rong
raffi
nate [g
/l]
(a) (b) (c)
(d) (e) (f)
Figure 3.8: Effect of step disturbances of the external feed flow rate for a crystallizer at the raffinate (configuration 2). Bluerepresents -7.5% disturbance and red represents +7.5% disturbance. Meaning of the thick and the thin lines infigures (a) and (d) is as in Figure 3.3.
47
Chapter 3. Dynamics and control of SMB-crystallization processes
3.2 Feedback control
In this section, suitable plantwide control concepts for SMB crystallization pro-
cesses are introduced. The focus is on the extract configuration illustrated in Fig-
ure 3.2. It should be noted, however, that analogous concepts can be applied to the
raffinate configuration. For the latter, the modified pump arrangement i.e. configu-
ration 2 according to Figure 3.7 should be used.
The main objective of the control is to guarantee high purity of the crystalline
product from the crystallizer also in the presence of unforeseen disturbances. This in
turn requires that the feed to the crystallizer has to stay all the time in the corre-
sponding two phase region of the phase diagram. In case of the extract configuration
in Figure 3.2, which will be discussed below, this is region II in Figure 3.1.
The aim of the control can be achieved via different approaches. A straight forward
approach would be to directly control the purity in the extract outlet of the SMB plant
by manipulating the corresponding flow rates. For this, different control concepts have
been developed during the last years as briefly summarized in Chapter 1. However,
easier options are available for the coupled SMB-crystallization process considered
within this chapter. Instead of controlling the SMB plant, crystallizer operation can
be manipulated directly by controlling the amount of solvent removed or added to
the system (Figure 3.2). In a first step, the solvent removal between the SMB unit
and the crystallizer (unit SR in Figure 3.2) is considered as a manipulated variable.
As a second option, solvent addition after the crystallizer is briefly discussed as a
manipulated variable. In both cases, the measured variable is the mass fraction of
the weaker adsorbing component in the crystallizer outlet, which is directly related
to the location of the feed to the crystallizer according to Figure 3.1. This quantity
could be measured relatively easily online using a combination of a UV detector and
a polarimeter.
For both control concepts discussed before, simple PI controllers are used. The
controller tuning was performed using the step response method by Ziegler and
Nichols [64]. However, any other tuning method for single input single output lin-
ear systems could be applied including auto tuning methods [65]. The controller
parameters are provided in Table 3.2
The performance of this simple control concept is displayed in the Figures 3.9
through 3.11 for some characteristic disturbances used already in the previous section.
All of these figures give a direct comparison between the open loop dynamics (red
lines) and the closed loop dynamics (blue lines). Figures 3.9 and 3.10 are for step
48
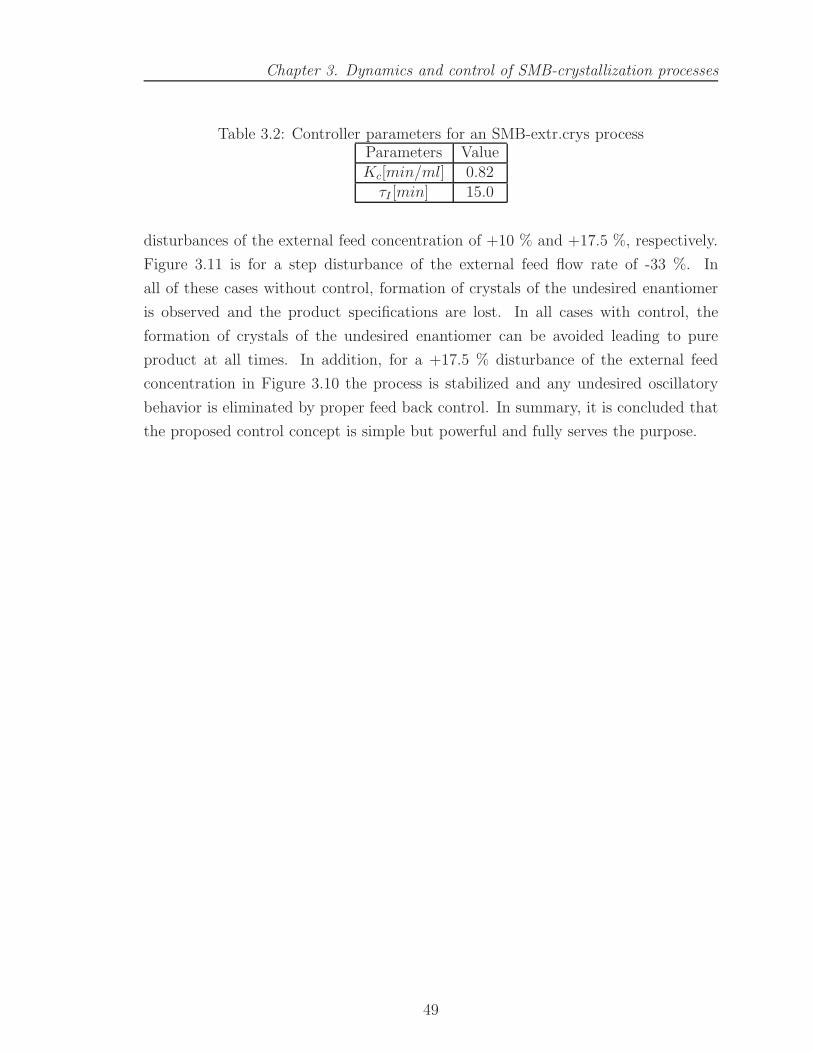
Chapter 3. Dynamics and control of SMB-crystallization processes
Table 3.2: Controller parameters for an SMB-extr.crys processParameters ValueKc[min/ml] 0.82τI [min] 15.0
disturbances of the external feed concentration of +10 % and +17.5 %, respectively.
Figure 3.11 is for a step disturbance of the external feed flow rate of -33 %. In
all of these cases without control, formation of crystals of the undesired enantiomer
is observed and the product specifications are lost. In all cases with control, the
formation of crystals of the undesired enantiomer can be avoided leading to pure
product at all times. In addition, for a +17.5 % disturbance of the external feed
concentration in Figure 3.10 the process is stabilized and any undesired oscillatory
behavior is eliminated by proper feed back control. In summary, it is concluded that
the proposed control concept is simple but powerful and fully serves the purpose.
49

Chapter
3.
Dynam
icsand
contro
lofSM
B-cry
stalliza
tion
processes
0 5 10 15 200
5
10
15
Simulation time[hr]
Mas
s flo
w r
ate
of c
ryst
als
[mg/
min
]
0 5 10 15 200.156
0.158
0.16
0.162
0.164
0.166
Simulation time[hr]
Rec
ycle
flow
rat
e [m
l/min
]
0 5 10 15 200.406
0.408
0.41
0.412
0.414
0.416
Simulation time[hr]
Raf
finat
e flo
w r
ate
[ml/m
in]
0 5 10 15 200.8
0.85
0.9
0.95
1
Simulation time[hr]
Pur
ity
0 5 10 15 207.8
7.9
8
8.1
8.2
8.3
Simulation time[hr]
Con
cent
ratio
n stro
ngex
trac
t [g/l]
0 5 10 15 200
2
4
6
Simulation time[hr]
Con
cent
ratio
n stro
ngra
ffina
te [g
/l]
0 5 10 15 200.25
0.3
0.35
0.4
0.45
Simulation time[hr]
Con
trol
led
varia
ble
0 5 10 15 200
0.1
0.2
0.3
0.4
0.5
Simulation time[hr]
Flo
w to
cry
stal
lizer
[ml/m
in]
0 5 10 15 201.7
1.72
1.74
1.76
1.78
1.8
Simulation time[hr]M
anip
ulat
ed v
aria
ble
[ml/m
in]
0 10 200
0.5
(a) (c)(b)
(d) (f)(e)
(g) (h) (i)
Figure 3.9: Comparison of open loop and closed loop process behavior for a step disturbance of +10.0% of the external feedconcentration for a crystallizer at the extract. Blue represents the process with SR control and red represents theuncontrolled process. Meaning of the thick and the thin lines in figures (a) and (d) is as in Figure 3.3.
50

Chapter
3.
Dynam
icsand
contro
lofSM
B-cry
stalliza
tion
processes
0 5 10 15 200
5
10
15
Simulation time[hr]Mas
s flo
w r
ate
of c
ryst
als
[mg/
min
]
0 5 10 15 200.155
0.16
0.165
0.17
Simulation time[hr]
Rec
ycle
flow
rat
e [m
l/min
]
0 5 10 15 200.405
0.41
0.415
0.42
0.425
Simulation time[hr]
Raf
finat
e flo
w r
ate
[ml/m
in]
0 5 10 15 200.7
0.8
0.9
1
Simulation time[hr]
Pur
ity
0 5 10 15 207.5
8
8.5
9
Simulation time[hr]
Con
cent
ratio
n stro
ngex
trac
t [g/l]
0 5 10 15 200
2
4
6
8
10
Simulation time[hr]
Con
cent
ratio
n stro
ngra
ffina
te [g
/l]
0 5 10 15 200.25
0.3
0.35
0.4
0.45
Simulation time[hr]
Con
trol
led
varia
ble
0 5 10 15 200.024
0.026
0.028
0.03
0.032
Simulation time[hr]
Flo
w to
cry
stal
lizer
[ml/m
in]
0 5 10 15 201.7
1.72
1.74
1.76
1.78
1.8
Simulation time[hr]
Man
ipul
ated
var
iabl
e [m
l/min
]
(a) (b) (c)
(d) (f)(e)
(g) (h) (i)
Figure 3.10: Comparison of open loop and closed loop process behavior for a step disturbance of +17.5% of the external feedconcentration for a crystallizer at the extract. Blue represents the process with SR control and red represents theuncontrolled process. Meaning of the thick and the thin lines in figures (a) and (d) is as in Figure 3.3.
51

Chapter
3.
Dynam
icsand
contro
lofSM
B-cry
stalliza
tion
processes
0 5 10 15 200
5
10
15
Simulation time[hr]Mas
s flo
w r
ate
of c
ryst
als
[mg/
min
]
0 5 10 15 200.155
0.16
0.165
0.17
Simulation time[hr]
Rec
ycle
flow
rat
e [m
l/min
]
0 5 10 15 200.2
0.3
0.4
0.5
Simulation time[hr]
Raf
finat
e flo
w r
ate
[ml/m
in]
0 5 10 15 200.7
0.8
0.9
1
Simulation time[hr]
Pur
ity
0 5 10 15 205
6
7
8
Simulation time[hr]
Con
cent
ratio
n stro
ngex
trac
t [g/l]
0 5 10 15 200.2
0.25
0.3
0.35
Simulation time[hr]
Con
cent
ratio
n stro
ngra
ffina
te [g
/l]
0 5 10 15 200.25
0.3
0.35
0.4
0.45
Simulation time[hr]
Con
trol
led
varia
ble
0 5 10 15 200.022
0.024
0.026
0.028
Simulation time[hr]
Flo
w to
cry
stal
lizer
[ml/m
in]
0 5 10 15 201.7
1.72
1.74
1.76
1.78
1.8
Simulation time[hr]
Man
ipul
ated
var
iabl
e [m
l/min
]
(a) (b) (c)
(d) (e) (f)
(g) (h) (i)
Figure 3.11: Comparison of open loop and closed loop process behavior for a step disturbance of -33% of the external feedflow rate for a crystallizer at the extract. Blue represents the process with SR control and red represents theuncontrolled process. Meaning of the thick and the thin lines in figures (a) and (d) is as in Figure 3.3.
52

Chapter 3. Dynamics and control of SMB-crystallization processes
The results in the Figures 3.9 to 3.11 have been obtained with a quasi-static model
of the crystallizer. To check the influence of finite crystallizer dynamics, an extended
version of this simple model with finite dynamics has also been implemented. The cor-
responding model equations are given in the Appendix C. The results of the open and
closed loop dynamic investigations with finite crystallizer dynamics are also provided
in the Appendix C. There it is shown that the simple control concept introduced with
a quasistatic crystallizer model can be directly applied to finite crystallizer dynamics
if the controller parameters are adjusted accordingly (see table C.1 ).
As mentioned earlier, instead of manipulating the amount of solvent which is re-
moved from the extract before being fed to the crystallizer, also the amount of solvent
added to the system after the crystallizer (QDiluent) could be used as a manipulated
variable. In principle, this also works. However, since the crucial influence on the
crystallizer operation has an additional lag introduced by the SMB unit, performance
of this second control structure is not as good as with the first control structure.
During the transients some temporary formation of undesired crystals was observed.
3.3 Summary
This chapter discussed the dynamics and control of SMB crystallization processes.
The main control objective is to restrain the process operation within the correspond-
ing two phase region of the SLE thus ensuring a pure crystalline product. For this
purpose, the optimal design of the previous chapter had to be relaxed giving rise
to a so called robust design. The effect of disturbances on the “robust design” was
analyzed. It was observed that due to the asymmetry introduced by the direction of
the fluid flow in the SMB unit, an appropriate pump configuration turned out to be
crucial to avoid high sensitivity to disturbances, especially of the external feed flow.
From the investigations, it was recognized that the outlet flow rate of the SMB unit
coupled to the crystallizer should be fixed to limit the variation of the flow rates in
the recycle loop. This is in agreement with standard rules for plantwide control of
multi-unit chemical process with recycle [66]. Nevertheless, for larger disturbances,
the product purities could not be kept within the required specification. Therefore, a
feedback control based on manipulating the solvent removed or added to the system
was developed as a simple alternate option to standard complicated SMB control.
In the following chapter, we evaluate the dynamics of a second hybrid process
combination, namely SMB-racemization.
53
Chapter 4
Dynamics and control of
SMB-racemization processes
In the previous chapter, the effect of disturbances of the external feed on the oper-
ability and process dynamics of SMB-crystallization process were studied. Although
some extra safety margins were introduced leading to a so called robust design, the
magnitude of tolerable disturbances was limited and some simple plant wide control
strategies were developed to compensate such disturbances. In the present chapter,
the investigation of dynamics and operability is extended to SMB-racemization pro-
cesses. Since dynamics and controllability crucially depends on the kinetics of the
chemical reaction, two different case studies are considered
• slow reaction with kforwardVreac = 0.1 and moderate product purity of 90%
• fast reaction with kforwardVreac = 100000 and high product purity of 99%
Adsorption isotherms are taken from the PDE system according to Appendix A.
4.1 Slow reaction kinetics and moderate purities
In this section, focus is on the first case study with slow racemization kinetics and
moderate product purity requirements. Figure 4.1 shows the schematic configuration
of the process. Nominal operating points are the optimal design parameters which
have been obtained in section 2.2.2 (Table 2.2). The consequence of step disturbances
of the external feed concentration and of the external feed flow rate imposed to
the nominal operating points have been investigated. In general, any permanent
disturbance of the external feed concentration/flowrate will lead to a permanent offset
54

Chapter 4. Dynamics and control of SMB-racemization processes
Figure 4.1: Schematic diagram for an SMB-racemization process
of the product purity from its specification. To overcome this problem suitable control
strategies are introduced within this chapter step-by-step.
As an initial step, an extension of the control concepts developed previously in
chapter 3 for SMB-crystallization processes to SMB-racemization processes is con-
sidered. In these concepts, the solvent removal in the recycle loop is used as a ma-
nipulated variable and product purity of the raffinate is considered as the controlled
variable. Online measurement with reasonable effort is possible for the present class
of mixtures by a combination of a UV detector and a polarimeter, for example [67].
4.1.1 Static controllability analysis
To check the feasibility of this control concept, static controllability of the raf-
finate product purity by means of the solvent removal is investigated using steady
state continuation in DIVA [61]. Results are shown in Figure 4.2 for nominal opera-
tion and a 5% increase/decrease of the external feed concentration. In all cases the
desired steady state purity of 90% can be achieved with some suitable values of the
manipulated variable. Due to the maximum of the curves even two different values of
the manipulated variable are available in each case, corresponding to an input mul-
tiplicity. The solvent removal value which would be adjusted by the control system
depends on the controller tuning and/or the initial conditions and does not bother
us at this point of the discussion.
55

Chapter 4. Dynamics and control of SMB-racemization processes
0.55 0.6 0.65 0.70.825
0.85
0.875
0.9
0.925
Qreac
SR [ml/min]
Pur
ity
Nominal
+ 5 %
− 5 %
Figure 4.2: Comparison of steady state parameter continuation profiles when sub-jected to step disturbances of ± 5% of the external feed concentration.The solid lines are for 5%, the dotted lines for nominal and the dashedlines are for -5%. Case study corresponds to slow kinetics
0.55 0.6 0.65 0.70.825
0.85
0.875
0.9
0.925
Qreac
SR [ml/min]
Pur
ity
Figure 4.3: Comparison of steady state parameter continuation profiles when sub-jected to step disturbances of ± 5% of the external feed flow rate. Thesolid lines are for 5%, the dotted lines for nominal and the dashed linesare for -5%. Case study corresponds to slow kinetics. Nomenclature issame as in Figure 4.2
56

Chapter 4. Dynamics and control of SMB-racemization processes
Table 4.1: Controller parameters for an SMB-extract.racemization process for slowkinetics
Parameters ValueKc[min/ml] 7.86τI [min] 18.1
Analogous patterns of behavior are illustrated in Figure 4.3 for a ± 5% in-
crease/decrease of the external feed flow rate.
4.1.2 Open loop and closed loop process dynamics
Here, we discuss the results of the dynamic simulation for the process scheme
shown in Figure 4.1. The dynamic behavior of the closed loop operation compared to
the open loop operation corresponding to the feed concentration disturbances (step
disturbance) in Figure 4.2 are shown in Figure 4.4, whereas the feed flow rate dis-
turbances corresponding to Figure 4.3 are shown in Figure 4.5. The open loop step
responses are illustrated in Figure 4.4 and Figure 4.5 by the dashed lines. In contrast
to the previous chapter, any permanent disturbances lead to a permanent offset of
the product purity. Further, from the symmetry of the open loop responses it is
concluded that the system is in the linear range. The reason for this is the moder-
ate product purity of the reference point. Further, it is concluded from Figures 4.4
and 4.5 that in closed loop operation the disturbances are well compensated by the
control system through readjusting the solvent removal (QreacSR ). For this purpose,
simple PI controllers were used. Controller parameters were calculated by numerical
optimization minimizing the integral of the squared controller error. The controller
parameters are provided in Table 4.1. The resulting closed loop dynamics is smooth
and relatively fast as shown by the solid line in the Figures 4.4 and 4.5 and it is
concluded that the proposed control strategy works nicely if the disturbances are not
too large.
For a larger disturbance of +7.5%, however, controllability fails for the above de-
sign specifications without safety margins as illustrated in Figure 4.6. In this figure,
the maximum product purity of the corresponding dashed line is clearly below 90%.
This implies that the desired product purity cannot be adjusted anymore by means
of the solvent removal rate. To overcome this problem and extend the range of dis-
turbances the control system is able to tolerate, the design is modified. In particular,
the process is overdesigned for a product purity of 92% instead of 90%. Modified
design parameters are determined with the optimization procedure described in the
57

Chapter 4. Dynamics and control of SMB-racemization processes
0 1 2 3 4 5 6 7 8 9 100.89
0.895
0.9
0.905
0.91
0.915
Simulation time[hr]
Pu
rity
0 1 2 3 4 5 6 7 8 9 100.6
0.61
0.62
0.63
0.64
Simulation time[hr]
Ma
nip
ula
ted
va
ria
ble
[m
l/m
in]
0 1 2 3 4 5 6 7 8 9 100.2
0.21
0.22
0.23
0.24
0.25
Simulation time[hr]
Ra
ffin
ate
flo
w r
ate
[m
l/m
in]
Figure 4.4: Comparison of an open loop and closed loop process for ± 5 % disturbanceof the external feed concentration. The solid lines are for the process withcontrol while the dashed lines are for the process without control. Red isfor -5 % while the blue curves are for + 5 %
58
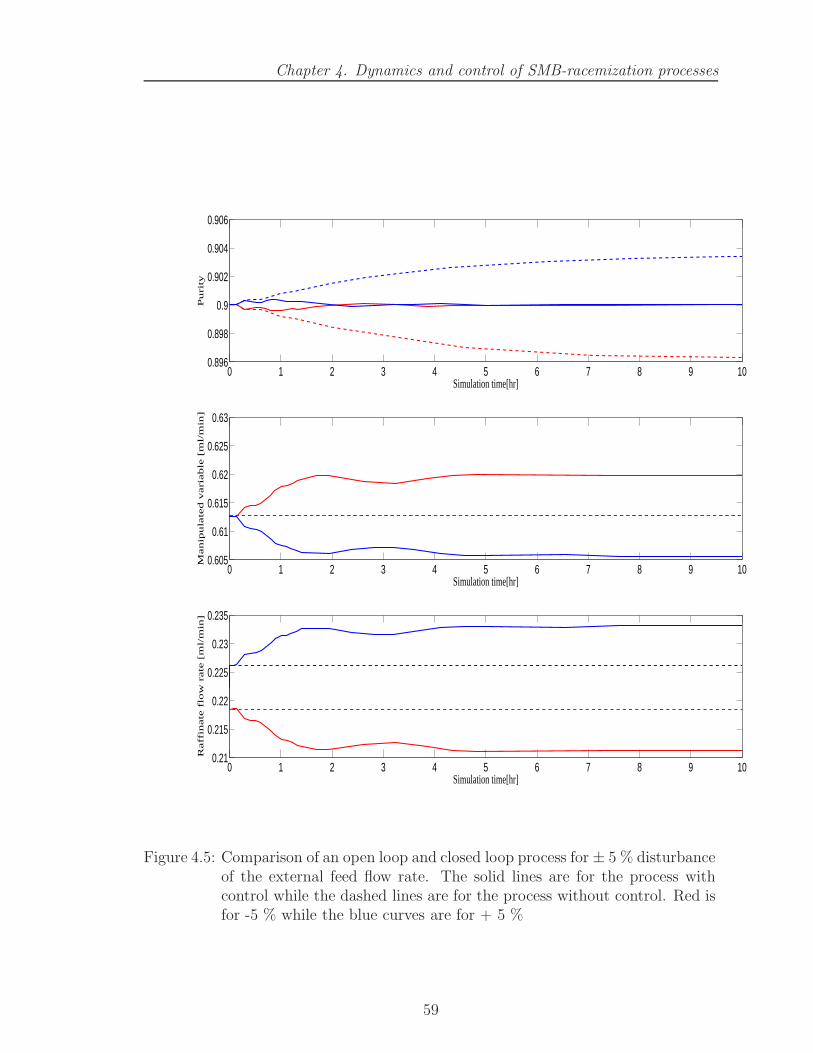
Chapter 4. Dynamics and control of SMB-racemization processes
0 1 2 3 4 5 6 7 8 9 100.896
0.898
0.9
0.902
0.904
0.906
Simulation time[hr]
Pu
rity
0 1 2 3 4 5 6 7 8 9 100.605
0.61
0.615
0.62
0.625
0.63
Simulation time[hr]
Ma
nip
ula
ted
va
ria
ble
[m
l/m
in]
0 1 2 3 4 5 6 7 8 9 100.21
0.215
0.22
0.225
0.23
0.235
Simulation time[hr]
Ra
ffin
ate
flo
w r
ate
[m
l/m
in]
Figure 4.5: Comparison of an open loop and closed loop process for ± 5 % disturbanceof the external feed flow rate. The solid lines are for the process withcontrol while the dashed lines are for the process without control. Red isfor -5 % while the blue curves are for + 5 %
59
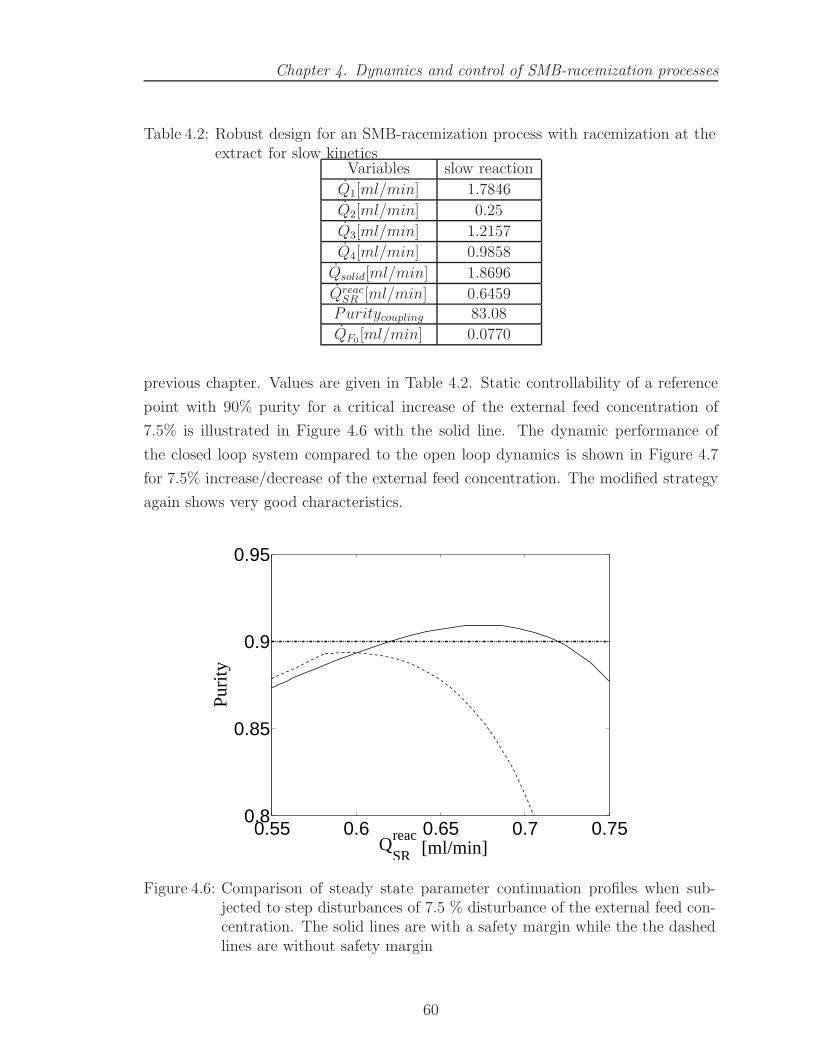
Chapter 4. Dynamics and control of SMB-racemization processes
Table 4.2: Robust design for an SMB-racemization process with racemization at theextract for slow kinetics
Variables slow reaction
Q1[ml/min] 1.7846
Q2[ml/min] 0.25
Q3[ml/min] 1.2157
Q4[ml/min] 0.9858
Qsolid[ml/min] 1.8696
QreacSR [ml/min] 0.6459Puritycoupling 83.08
QF0[ml/min] 0.0770
previous chapter. Values are given in Table 4.2. Static controllability of a reference
point with 90% purity for a critical increase of the external feed concentration of
7.5% is illustrated in Figure 4.6 with the solid line. The dynamic performance of
the closed loop system compared to the open loop dynamics is shown in Figure 4.7
for 7.5% increase/decrease of the external feed concentration. The modified strategy
again shows very good characteristics.
0.55 0.6 0.65 0.7 0.750.8
0.85
0.9
0.95
Qreac
SR [ml/min]
Pur
ity
Figure 4.6: Comparison of steady state parameter continuation profiles when sub-jected to step disturbances of 7.5 % disturbance of the external feed con-centration. The solid lines are with a safety margin while the the dashedlines are without safety margin
60

Chapter 4. Dynamics and control of SMB-racemization processes
0 1 2 3 4 5 6 7 8 9 100.89
0.895
0.9
0.905
0.91
0.915
Simulation time[hr]
Pu
rity
0 1 2 3 4 5 6 7 8 9 100.6
0.62
0.64
0.66
Simulation time[hr]
Ma
nip
ula
ted
va
ria
ble
[m
l/m
in]
0 1 2 3 4 5 6 7 8 9 100.26
0.28
0.3
0.32
Simulation time[hr]
Ra
ffin
ate
flo
w r
ate
[m
l/m
in]
(a)
(c)
(b)
Figure 4.7: Comparison of an open loop and closed loop process for ± 7.5% dis-turbance of the external feed concentration. The solid lines are for theprocess with control while the dashed lines are for the process withoutcontrol. Red is for -5% while the blue curves are for + 7.5%
61

Chapter 4. Dynamics and control of SMB-racemization processes
In summary, we find that the proposed control strategy of manipulating product
purity by means of solvent removal is very effective. It can be combined with an over
design to also handle large disturbances, if necessary. Results are however for slow
racemization kinetics with moderate purity requirement. Influence of fast racemiza-
tion kinetics with high product purity requirement is analyzed in the next section as
the second case study.
4.2 Fast reaction kinetics and high purities
Here, in this section, an increased product purity of 99% and a fast racemization
kinetics with Vreackforward = 100000 are considered. As in the previous section, the
effects of step disturbances of the external feed concentration and of the external
feed flow rate applied to the nominal operating points are investigated. Unlike in the
previous section, the recycle concentration of both components is almost symmetric
and is equal to the external feed concentration which confirms that the process is in
the equilibrium regime. Nominal operating points have been obtained in section 2.2.2
and are listed in Table 2.2.
4.2.1 Static controllability analysis
In order to examine if the simple control concept developed in the last section can
be applied for fast racemization kinetics with high product purity requirements, a
steady state continuation is applied as a first step. Results for the nominal operation
compared to a ± 5% increase/decrease of the external feed concentration are shown
in Figure 4.8 for the nominal design corresponding to Table 2.2. It is observed that
for the nominal operation (dotted line in Figure 4.8), the maximum value of the curve
coincides with the required product purity and that there is no room left for handling
disturbances in the positive direction, whereas disturbances in the negative direction
are not critical in that respect. Consequently, the control strategy applied to the
nominal design is not feasible.
Therefore, following the ideas in the previous section, in a second step, safety
margins by means of an overdesign are introduced. In the present case the process
was redesigned for a product purity of 99.5% instead of 99%. Parameters are given
in Table 4.3. Results of the steady state continuation can be seen in Figure 4.9.
Compared to Figure 4.8, the maximum lies now a bit higher than the nominal purity
of 99% giving little room to tolerate some disturbances in the positive direction.
However, a disturbance of the external feed concentration of 5% which is the solid
62

Chapter 4. Dynamics and control of SMB-racemization processes
1.3 1.35 1.4 1.45 1.5 1.550.9
0.92
0.94
0.96
0.98
1
Q reac
SR [ml/min]
Pur
ity
Figure 4.8: Comparison of steady state parameter continuation profiles for nominal,5%, -5% disturbance of the external feed concentration. The solid linesare for 5%, the dotted lines for nominal and the dashed lines are for -5%.Design without safety margin. Nomenclature same as in Figure 4.2
1.35 1.4 1.45 1.5 1.55 1.60.9
0.925
0.95
0.975
1
Qreac
SR [ml/min]
Pur
ity
Figure 4.9: Comparison of steady state parameter continuation profiles for nominal,5%, -5% disturbance of the external feed flow rate. The solid lines are for5%, the dotted lines for nominal and the dashed lines are for -5%. Designwith safety margin. Nomenclature same as in Figure 4.2
63

Chapter 4. Dynamics and control of SMB-racemization processes
line in Figure 4.9 is still clearly out of reach.
Table 4.3: Robust design for an SMB-racemization process with racemization at theextract for fast kinetics
Variables Fast reaction
Q1[ml/min] 2.2728
Q2[ml/min] 0.2865
Q3[ml/min] 1.0905
Q4[ml/min] 0.6830
Qsolid[ml/min] 1.8696
QreacSR [ml/min] 1.4787Puritycoupling 78.89
QF0[ml/min] 0.2963
Hence, in a last step, alternative handles for controlling the product purity are
explored. Results are summarized in Figure 4.10 for a critical increase of the external
feed concentration of 5%. Possible handles are indicated by the pumps in Figure 4.1.
Besides the solvent removal, flow rates in Zone II, Zone IV and the solvent feed of
the SMB plant can be manipulated. From Figure 4.10 it is concluded, that the flow
rate in Zone IV is the only choice which works for a 5% increase of the external feed
concentration.
4.2.2 Open and closed loop dynamics
The dynamics of the open loop system compared to the corresponding closed loop
system is described in Figure 4.11 for a ± 5% change of the external feed concen-
tration. Open loop dynamics show a strong asymmetry of the responses indicating
strong nonlinearity for the high product purity requirements. The blue dashed line
even shows an inverse response. Nevertheless, closed loop control works very well as
indicated by the solid lines. The controller parameters were obtained by numerical
optimization of the integral square error. The controller parameters are shown in Ta-
ble 4.4. Similar patterns of behavior are observed in Figure 4.12 for a ± 5% change of
the external feed flow rate confirming the feasibility of the alternative control concept.
Table 4.4: Controller parameters for an SMB-extract.racemization process for fastkinetics
Parameters ValueKc[min/ml] 8.93τI [min] 15.0
64

Chapter 4. Dynamics and control of SMB-racemization processes
0.4 0.45 0.5 0.55 0.6 0.650.975
0.98
0.985
0.99
0.995
1
Qzone4
[ml/min]
Pu
rity
1.3 1.35 1.4 1.45 1.5 1.550.92
0.94
0.96
0.98
1
QreacSR
[ml/min]
Pu
rity
1.45 1.5 1.55 1.6 1.65 1.70.85
0.9
0.95
1
Qsolvent
[ml/min]
Pu
rity
0.1 0.2 0.3 0.4 0.5 0.60.95
0.955
0.96
0.965
0.97
0.975
Qzone2
[ml/min]P
urity
Figure 4.10: Comparison of possible control options for 5% disturbance of the externalfeed concentration through steady state parameter continuation for fastkinetics
65

Chapter 4. Dynamics and control of SMB-racemization processes
0 1 2 3 4 5 6 7 8 9 100.975
0.98
0.985
0.99
0.995
1
Simulation time[hr]
Pu
rity
0 1 2 3 4 5 6 7 8 9 100.55
0.6
0.65
0.7
0.75
Simulation time[hr]
Ma
nip
ula
ted
va
ria
ble
[m
l/m
in]
0 1 2 3 4 5 6 7 8 9 10−1
−0.5
0
0.5
1
1.5
Simulation time[hr]
Ra
ffin
ate
flo
w r
ate
[m
l/m
in]
(a)
(b)
(c)
Figure 4.11: Comparison of an open loop and closed loop process for ± 5% distur-bance of the external feed concentration. The solid lines are for theprocess with control while the dashed lines are for the process withoutcontrol. Red is for -5% while the blue curves are for + 5%
66

Chapter 4. Dynamics and control of SMB-racemization processes
0 1 2 3 4 5 6 7 8 9 100.97
0.98
0.99
1
Simulation time[hr]
Pu
rity
0 1 2 3 4 5 6 7 8 9 100.55
0.6
0.65
0.7
0.75
Simulation time[hr]
Ma
nip
ula
ted
va
ria
ble
[m
l/m
in]
0 1 2 3 4 5 6 7 8 9 100.39
0.4
0.41
0.42
0.43
Simulation time[hr]
Ra
ffin
ate
flo
w r
ate
[m
l/m
in]
(a)
(b)
(c)
Figure 4.12: Comparison of an open loop and closed loop process for ± 5% distur-bance of the external feed flow rate. The solid lines are for the processwith control while the dashed lines are for the process without control.Red is for -5% while the blue curves are for + 5 %
67

Chapter 4. Dynamics and control of SMB-racemization processes
4.3 Summary
The dynamics and control of coupled SMB-racemization processes has been ex-
plored for the first time within this thesis. Two simple control concepts have been pro-
posed to compensate unforeseen disturbances of the external feed flow and the exter-
nal feed concentration. It has been proven that for moderate product purity require-
ments an extension of the previous concepts for SMB-crystallization processes can
be applied successfully to the present class of processes, namely SMB-racemization.
For high product purity, this control concept is not applicable anymore and an al-
ternative strategy has been developed. In both cases, an overdesign of the nominal
operation point improved the controllability in respect to the magnitude of tolera-
ble disturbances. Further, from the results of the SMB-crystallization (chapter 3)
it was observed that a selective crystallizer at the product outlet introduces a cer-
tain robustness with respect to the disturbances and therefore a process comprising
SMB-crystallization-racemization is an interesting option.
68

Chapter 5
Conclusions
Enantio-pure compounds play a decisive role in the pharmaceutical industry. Due
to their significantly different physiological effects, most of the drugs are marketed in
the enantio-pure form which accounts for almost 40% of the world wide drug market.
This asserts that the development of innovative and economically conducive produc-
tion processes is very important. Traditionally, these productions were performed
using stand-alone separation or reaction units. An enormous potential for improv-
ing the performance of pure enantiomer production is provided by “smart” process
schemes that combine the existing separation techniques such as chromatography
and crystallization with chemical reactions. Also, due to the ever increasing need for
enantio-pure drugs within the pharmaceutical industries, there is a strong demand for
faster process development. A three step approach can be employed for this purpose
which proves to be a useful tool to select and evaluate the interesting process options.
In the first step, promising process candidates are selected based on qualitative crite-
ria arising from industrial practice. In the second step, shortcut methods are applied
for preliminary process design and preliminary evaluation of process performance.
The final step of the three step procedure involves rigorous optimization of the chosen
process variants which is discussed in detail in the first part of this thesis. Initially,
Non-Linear-Programming (NLP) based optimization was used to evaluate six possi-
ble process candidates derived from a qualitative decision tree. The results revealed
that an ingenious and efficient approach would be to determine the optimal process
structure as well as operating conditions simultaneously. This can be performed el-
egantly using Mixed-Integer-Non-Linear-Programming (MINLP). For the first time
these advanced optimization approaches have been applied to design advanced pro-
cess schemes for enantiomer production.
69

Chapter 5. Conclusions
The results of the steady state optimal design affirmed that the hybrid process schemes
involving combinations of SMB chromatography with enantio-selective crystallization
and/or racemization are economically more favorable than the corresponding stand-
alone processes. However, the dynamic operation of such non-linear processes with
mass recycle is delicate and non-trivial. Hence, in the second step, dynamics, oper-
ability and control of such processes were considered. The first process which was
investigated was the SMB-crystallization process. The operational objective of such
a process is to produce a pure crystalline product irrespective of the presence of un-
foreseen disturbances. The open loop investigations highlighted the importance of
the pump configuration on the process performance. It was also observed that the
process specifications were not adhered to for moderate to large disturbances. Also
for sufficiently large disturbances, the system stability was lost through a Hopf bifur-
cation leading to self sustained oscillations. This underlines the necessity of suitable
plant wide control which was achieved by manipulating the amount of solvent added
or removed from the system, thus avoiding a complicated direct SMB control.
The second process scheme which was considered for the dynamic investigations
was the SMB-racemization system. Here, two qualitatively contrasting scenarios for
racemization, one corresponding to the kinetic regime while the other in the equi-
librium regime of the chemical reaction were considered. A steady state parameter
continuation was employed as a tool to determine the necessary condition for control-
lability. It was observed that for the process in the kinetic regime, indirect control
based on a solvent removal rate is a simple and feasible option. A direct control
of the SMB plant was not required. It was further shown that this simple control
concept will fail for fast racemization kinetics with high purity requirements. In this
case readjustment of the SMB operational parameters is inevitable for good control
performance. Further, it was also emphasized that for SMB-racemization, including
an enantio-selective crystallization can improve the process robustness.
Here the design and control aspects have been dealt with sequentially. Future work
should focus on integrating design and control. This can be achieved by formulating
a dynamic optimization problem. An extension of this dynamic optimization with
parametric uncertainty can be an interesting option and would ensure a robust de-
sign. Also, by formulating a Mixed Integer Dynamic Optimization (MIDO) problem,
the pump configuration which can tolerate characterisitc disturbances irrespective of
70

the location of the crystallizer can be determined which is challenging and worth
pursuing.
For a proof of concept, simple PI controllers were used in this thesis. Alterna-
tively, one could also think of more advanced control concepts like model predictive
control, for example, to explicitly account for non-linear process dynamics and hard
constraints on the process dynamics introduced by the boundaries of the desired
operational region in the phase diagram of enantioselective crystallization process.
71

72
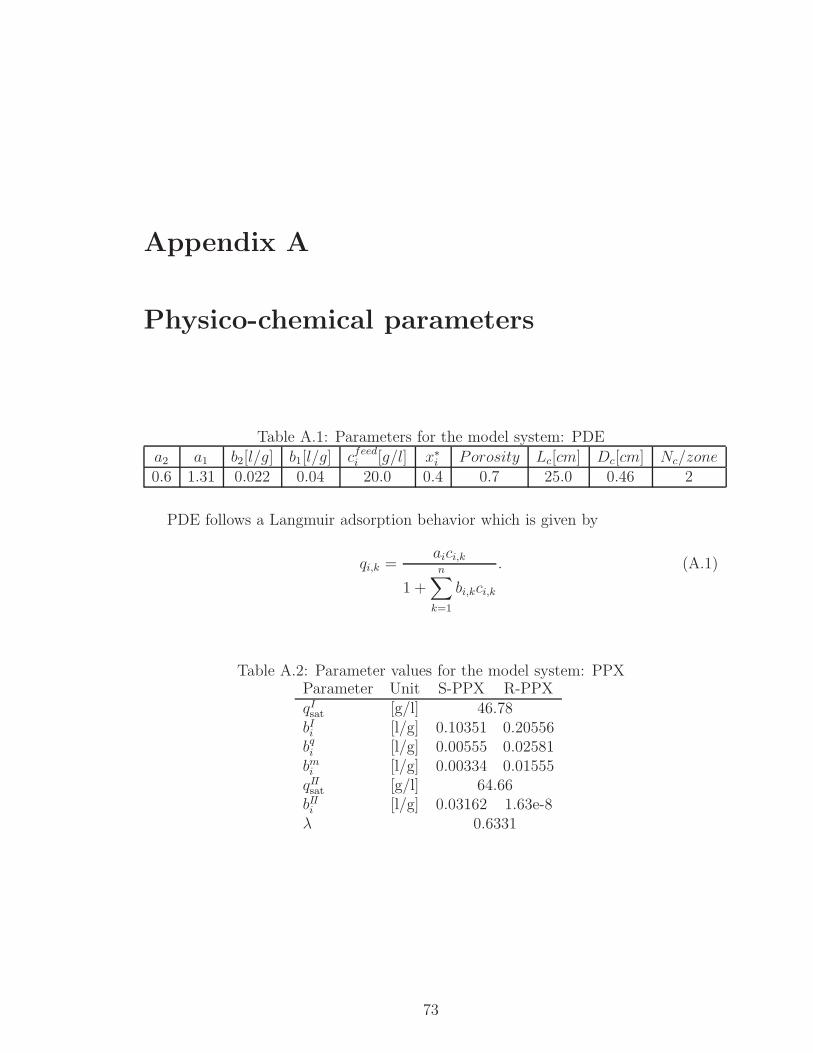
Appendix A
Physico-chemical parameters
Table A.1: Parameters for the model system: PDE
a2 a1 b2[l/g] b1[l/g] cfeedi [g/l] x∗i Porosity Lc[cm] Dc[cm] Nc/zone
0.6 1.31 0.022 0.04 20.0 0.4 0.7 25.0 0.46 2
PDE follows a Langmuir adsorption behavior which is given by
qi,k =aici,k
1 +n
∑
k=1
bi,kci,k
. (A.1)
Table A.2: Parameter values for the model system: PPXParameter Unit S-PPX R-PPXqIsat [g/l] 46.78bIi [l/g] 0.10351 0.20556bqi [l/g] 0.00555 0.02581bmi [l/g] 0.00334 0.01555qIIsat [g/l] 64.66bIIi [l/g] 0.03162 1.63e-8λ 0.6331
73

Appendix A. Physico-chemical properties
PPX follows a quadratic thermodynamic adsorption equilibrium given by [58]
qi = qIsat
bIi ci + 2bqi c2i + cScR (bmS + bmR )
1 +∑
j bIjcj +
∑
k bqkc
2k + cScR (bmS + bmR )
+ qIIsat
bIIi ci1 +
∑
l cl+ λci (A.2)
The feed concentration which has been used for the PPX case studies is ci = 12.5
g/l.
74

Appendix B
MINLP optimization of SMB processes
and process combinations with variable
number of stages
B.1 Model formulation
A schematic of an SMB unit allowing optimization of the number of stages i.e.
a variable size SMB unit is shown in Figure B.1(a). Later, such units are included
within a super structure such as the one studied in Chapter 2 [Figure B.1(b)]. The
approach which has been used here is similar to the one which has been proposed for
optimizing distillation columns [68].
In this work, an SMB unit is modeled using its equivalent TMB. The feed stage of
the TMB is fixed. The remaining inlet and outlet stages are variable and determined
by MINLP optimization. Binary variables are used to determine the location of
the extract (IkE), raffinate (Ik
R), desorbent (IkD) and final stage (Ik
L) according to
Eq.(B.1) and thereby define the length of the different zones. Adsorption equilibrium
is described by Langmuir isotherms with parameters for the PDE system as described
in Appendix A. The unit is assumed to be at steady state.
—————–
75
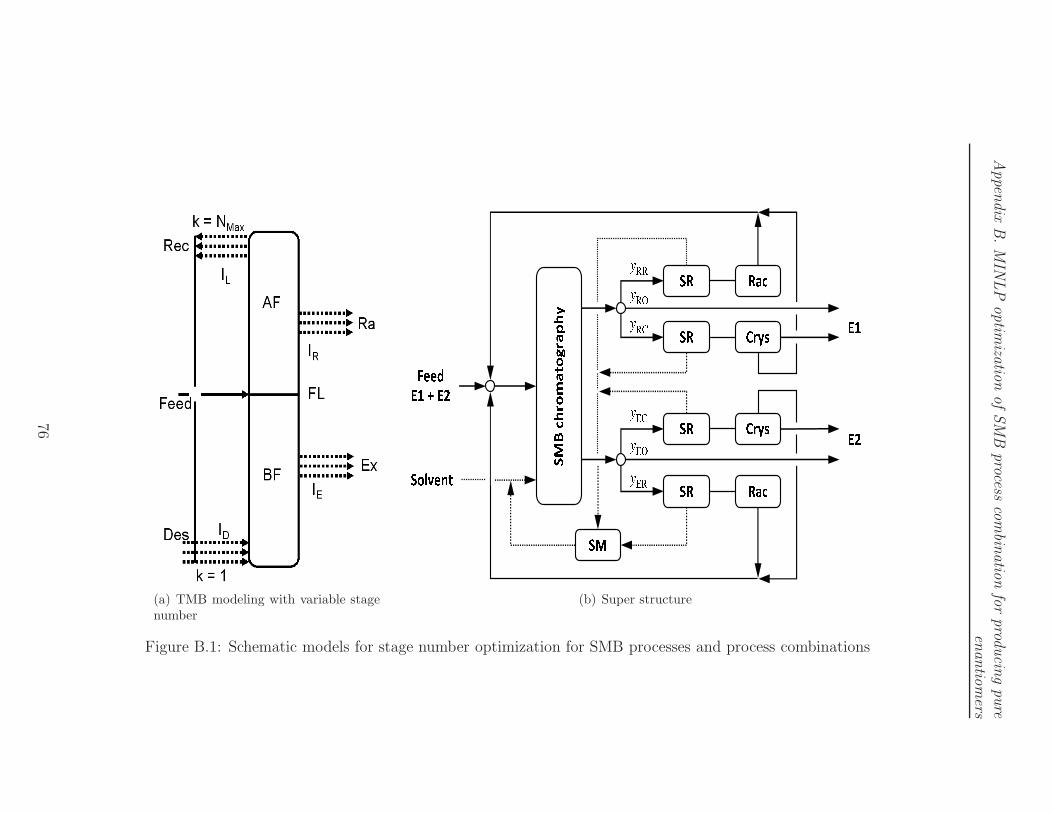
Appen
dix
B.M
INLP
optim
izatio
nofSM
Bprocess
com
binatio
nfo
rprod
ucin
gpure
enantio
mers
(a) TMB modeling with variable stagenumber
(b) Super structure
Figure B.1: Schematic models for stage number optimization for SMB processes and process combinations
76

Appen
dix
B.M
INLP
optim
izatio
nofSM
Bprocess
com
binatio
nfo
rprod
ucin
gpure
enantio
mers
The dimension of the four binary variables can be written as
IkE , I
kD, I
kR, I
kL ∈ {0, 1}FL−1 (B.1)
Single stage conditions can be written as
FL−1∑
k=1
IkE = 1,
FL−1∑
k=1
IkD = 1,
NMax∑
k=FL+1
IkR = 1,
NMax∑
k=FL+1
IkL = 1 (B.2)
The steady state mass balances of the TMB unit can be written as
I1D [Des+Rec] − Q1 = 0, k = 1
IkD [Des+Rec] + Qk−1 − Qk = Ik
E ∗ Ex, k = 2, ...FL− 1
QFL−1 − QFL + Feed = 0, k = FL
Qk−1 − Qk − IkL ∗Rec = Ik
R ∗Ra, k = FL+ 1, ...NMax − 1
QNMax−1 − QNMax − INMax
L ∗Rec = 0, k = NMax
(B.3)
It needs to be mentioned that QNMax is always fixed at zero.
77
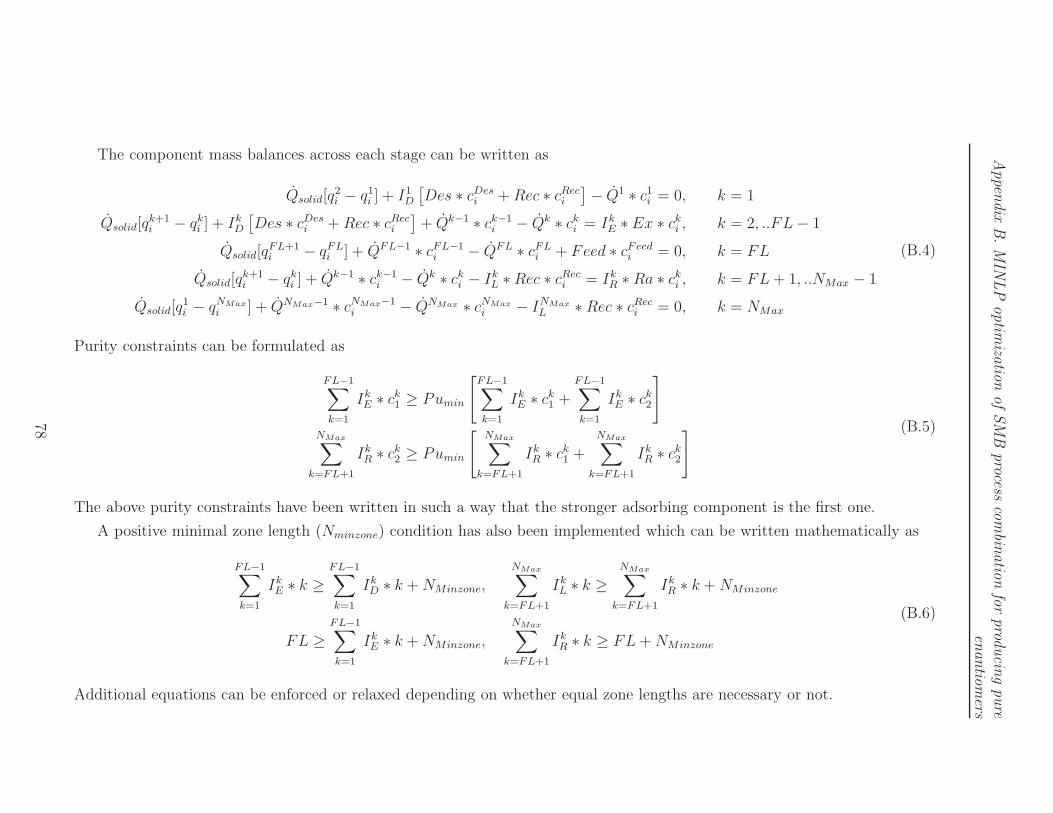
Appen
dix
B.M
INLP
optim
izatio
nofSM
Bprocess
com
binatio
nfo
rprod
ucin
gpure
enantio
mers
The component mass balances across each stage can be written as
Qsolid[q2i − q1
i ] + I1D
[
Des ∗ cDesi +Rec ∗ cRec
i
]
− Q1 ∗ c1i = 0, k = 1
Qsolid[qk+1i − qk
i ] + IkD
[
Des ∗ cDesi +Rec ∗ cRec
i
]
+ Qk−1 ∗ ck−1i − Qk ∗ cki = Ik
E ∗ Ex ∗ cki , k = 2, ..FL− 1
Qsolid[qFL+1i − qFL
i ] + QFL−1 ∗ cFL−1i − QFL ∗ cFL
i + Feed ∗ cFeedi = 0, k = FL
Qsolid[qk+1i − qk
i ] + Qk−1 ∗ ck−1i − Qk ∗ cki − Ik
L ∗Rec ∗ cReci = Ik
R ∗Ra ∗ cki , k = FL+ 1, ..NMax − 1
Qsolid[q1i − qNMax
i ] + QNMax−1 ∗ cNMax−1i − QNMax ∗ cNMax
i − INMax
L ∗Rec ∗ cReci = 0, k = NMax
(B.4)
Purity constraints can be formulated as
FL−1∑
k=1
IkE ∗ ck1 ≥ Pumin
[
FL−1∑
k=1
IkE ∗ ck1 +
FL−1∑
k=1
IkE ∗ ck2
]
NMax∑
k=FL+1
IkR ∗ ck2 ≥ Pumin
[
NMax∑
k=FL+1
IkR ∗ ck1 +
NMax∑
k=FL+1
IkR ∗ ck2
] (B.5)
The above purity constraints have been written in such a way that the stronger adsorbing component is the first one.
A positive minimal zone length (Nminzone) condition has also been implemented which can be written mathematically as
FL−1∑
k=1
IkE ∗ k ≥
FL−1∑
k=1
IkD ∗ k +NMinzone,
NMax∑
k=FL+1
IkL ∗ k ≥
NMax∑
k=FL+1
IkR ∗ k +NMinzone
FL ≥FL−1∑
k=1
IkE ∗ k +NMinzone,
NMax∑
k=FL+1
IkR ∗ k ≥ FL+NMinzone
(B.6)
Additional equations can be enforced or relaxed depending on whether equal zone lengths are necessary or not.
78

Appendix B. MINLP optimization of SMB process combination for producing pure
enantiomers
In this formulation, a fixed order of desorbent, extract, feed, raffinate and recycle
stages according to Figure B.1(a) is explicitly taken into account . This reduces the
number of binary variables and leads to a computational efficient implementation.
The set of relations given by Eq.(B.2) ensures that there is only a single extract
stage, feed stage and so on. The first equation in the set of mass balances given by
Eqs.(B.3) ensures that if the first stage is inactive the fluid flow rate becomes zero.
Since the first active stage below the feed is the desorbent stage i.e. IkD = 1, sum of
the solvent and recycle from zone 4 represents the stream which enters and leaves this
stage. Inequality constraints given by Eq.(B.6) enforce positive zone lengths i.e. the
extract stage is located above the desorbent stage. Hence between the the desorbent
and the extract stages there is just a transfer of components between the two phases
while the solid and liquid flow rates are unchanged. Similar ideas are used in the
remaining zones of the SMB unit except in the final zone. When the stage NMax is
inactive, IkL = 0 as well as QNMax = 0. This implies that the liquid flow rate is zero
everywhere till the last active stage is encountered. The entire liquid stream which
enters the last active stage is completely recycled back to the desorbent stage of the
SMB unit.
B.2 Results
B.2.1 Simple cost function
The efficiency of this modeling approach is illustrated in a first step by using a very
simple objective function. Here, the objective function corresponds to minimizing the
number of active stages of a stand-alone SMB for a fixed feed flow rate. Identical
purity requirements at both outlets ranging from 95 - 99.8% have been considered.
Further, in a first step, the number of stages in each zone is assumed to be equal.
In Chapter 2, an enumeration approach was used to determine the maximum feed
flow rate as a function of stage number. In such a calculation, the objective function
was to maximize the feed flow rate. Symmetric purity constraints were enforced and
the maximal feed rate was calculated for various stage numbers. Such a calculation
is repeated here for the PDE enantiomer system and is shown in Figure B.2. A high
purity of 99.8% was used in Figure B.2
The results of MINLP optimization needs to be validated which has been per-
formed by comparing them with that of the parametric enumeration procedure. For
this purpose, a fixed feed flow rate of 0.225 ml/s was used. This corresponds to the
horizontal dashed line in Figure B.2. With a fixed feed rate of 0.225 ml/s and out-
79

Appendix B. MINLP optimization of SMB process combination for producing pure
enantiomers
50 100 150 200 250 300 350 4000
0.05
0.1
0.15
0.2
0.25
Number of stages
FM
ax
Figure B.2: Enumeration approach illustrating the effect of stage number on the max-imum feed which can be processed for outlet purity of 99.8%. Resultsare for the PDE enantiomer
80

Appendix B. MINLP optimization of SMB process combination for producing pure
enantiomers
let purities of 99.8%, MINLP optimization using DICOPT in GAMS [56, 57] with
CONOPT3 for the NLP subproblems and CPLEX for the MILP master problems.
Parametric enumeration was done using CONOPT3. The minimum number of stages
which is necessary to achieve this separation corresponds to 136 which is identical
with the result of the above enumeration as indicated in Figure B.2. This proves that
the number of stages determined by the NLP based enumeration approach and the
more elegant MINLP approach is identical. The solid flow rate was assumed to be
1.0 ml/s.
Once the validation between the two methods was established, the computational
efficiency of the two methods were compared. For this purpose, the feed flow rate
was fixed to 0.225 unit/time in MINLP optimization and the extract and raffinate
purities were varied. In the parametric enumeration based approach, the maximum
feed flow rate as a function of stage number was calculated similar to Figure B.2
for different purity requirements as shown in Table B.1. In the case of parametric
enumeration, the entire curve was generated ranging from a maximum of 400 stages
to a minimum of 40 stages irrespective of the location of the desired operating point.
Table B.1 clearly demonstrates the efficiency of the MINLP optimization compared
to the parametric approach.
In Figure B.3(a), we show the effect of product purity on the number of stages.
The results have been generated using MINLP optimization. The number of stages
required to achieve the necessary purity decreases exponentially with a decrease in
purity requirements which is perfectly along the lines of expectation. These are for a
feed flow rate of 0.225 units/time which is identical to that in the Table B.1.
Figure B.3(b) shows the effect of feed flow rate on the minimum number of stages
which is necessary to achieve a certain separation. These are similar to the calcula-
tions shown earlier. Here the blue curve is for a product purity of 99.8% while the red
curve is for 97.5%. The circles in the figure are the outcome of MINLP calculations.
As expected, the amount of feed which can be processed increases by relaxing the
purity requirements. Further, for a fixed purity, the minimum number of stages which
is necessary to achieve the desired purity decreases significantly with a decrease in
the feed flow rate.
Upto now focus has been on stand-alone SMB processes. In a next step, such
variable stage number SMB models were coupled to other process units such as crys-
tallization and racemization. Here, the discussion is limited to fixed process candi-
dates. For the stand-alone SMB process, a feed flow rate of 0.225 ml/s is considered.
For a feed concentration of 20 mg/ml, this corresponds to 4.5 mg/s of product. Since
81

Appendix B. MINLP optimization of SMB process combination for producing pure
enantiomers
Table B.1: Comparison of CPU time for the two methods to perform stage num-ber optimization. Computations were performed on a linux 2GHz, AMDAthlon single core processer
Purity Ntot TIME (sec) Method95.0 % 40 70 MINLP97.5 % 60 66 MINLP99.0 % 84 47 MINLP99.5 % 104 101 MINLP99.8 % 136 92 MINLP95.0 % 40 289 Parametric97.5 % 60 259 Parametric99.0 % 84 251 Parametric99.5 % 104 243 Parametric99.8 % 136 257 Parametric
Table B.2: Minimum number of stages for the different process schemesProcess Ntot
SMB 136SMB-cryst 60SMB-rac 132
SMB-rac-cryst 28
SMB units have to be compared with the SMB-racemization systems, the calcula-
tions here are based on a product rate of 4.5 mg/s at the extract. This in turn makes
sure that the stand-alone SMB which has already been optimized previously can be
compared with the more advanced process options. Table B.2 shows the results of
the optimization for four different processes. It can be seen that there is a significant
reduction in the number of stages necessary to produce the fixed amount of products
by using a crystallization. This is clear from the results for SMB-crystallization as
well as for SMB-racemization-crystallization. In the case of SMB-racemization, there
is no significant improvement for this hypothetical cost function. This is due to the
fact that the reduction in feed material cost by half does not have a direct effect on
the number of stages.
Another important parameter which has a significant effect on the number of
stages is the separation factor. In order to evaluate the effect of separation factor, the
adsorption isotherm parameter of the stronger adsorbing enantiomer is varied while
simultaneously maintaining the weaker adsorbing isotherm parameter constant. The
separation factor is defined as the ratio of the adsorption isotherm parameters i.e.a1
a2
according to the convention used in this thesis. The results of such an investigation
82

Appendix B. MINLP optimization of SMB process combination for producing pure
enantiomers
60 150 250 350 4000.05
0.1
0.15
0.2
0.25
0.3
Number of stages
FM
ax
95 96 97 98 99 10040
60
80
100
120
140
Purity
Nu
mb
er
of
sta
ge
s
Figure B.3: (a) Minimum number of stages as a function of the product purity (b)Minimum number of stages as a function of the feed flow rate
83
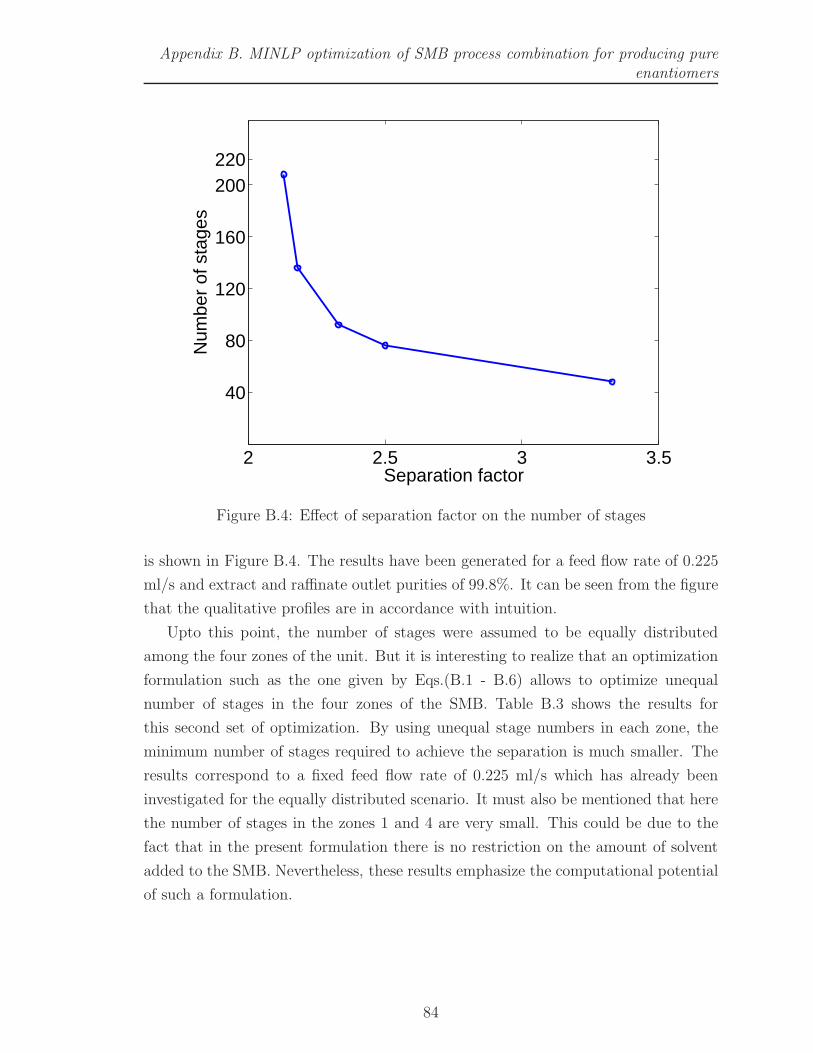
Appendix B. MINLP optimization of SMB process combination for producing pure
enantiomers
2 2.5 3 3.5
40
80
120
160
200220
Separation factor
Num
ber
of s
tage
s
Figure B.4: Effect of separation factor on the number of stages
is shown in Figure B.4. The results have been generated for a feed flow rate of 0.225
ml/s and extract and raffinate outlet purities of 99.8%. It can be seen from the figure
that the qualitative profiles are in accordance with intuition.
Upto this point, the number of stages were assumed to be equally distributed
among the four zones of the unit. But it is interesting to realize that an optimization
formulation such as the one given by Eqs.(B.1 - B.6) allows to optimize unequal
number of stages in the four zones of the SMB. Table B.3 shows the results for
this second set of optimization. By using unequal stage numbers in each zone, the
minimum number of stages required to achieve the separation is much smaller. The
results correspond to a fixed feed flow rate of 0.225 ml/s which has already been
investigated for the equally distributed scenario. It must also be mentioned that here
the number of stages in the zones 1 and 4 are very small. This could be due to the
fact that in the present formulation there is no restriction on the amount of solvent
added to the SMB. Nevertheless, these results emphasize the computational potential
of such a formulation.
84

Appendix B. MINLP optimization of SMB process combination for producing pure
enantiomers
Table B.3: Minimum number of stages for unequal stage number for stand alone SMBwith symmetric purities
Purity No. of stages in zone Ntot
1 2 3 495.0 % 3 12 9 3 2799.0 % 6 15 27 3 5199.8 % 5 30 26 4 65
B.2.2 Super structure based optimization for process combinations
From the results of the MINLP optimization with fixed stage numbers in Chapter
2, it is clear that the weighting factors, production rates etc. play a critical role
in determining the optimal process scheme. Figure B.1(b) shows a super structure
which includes a variable stage SMB unit coupled with a racemization reactor and
enantio-selective crystallizer. Here, additional binary variables are used to denote
the existence/non-existence of the different auxiliary units. Optimizing such a super
structure for the user defined process and product specifications as well as user defined
cost factors would provide the optimal process structure including the SMB size and
the optimal operating conditions. A more detailed cost function along the lines of
chapter 2 can be written for a variable stage SMB unit as
f =(wf + winv)Mrac + wop
((1 − yER)0.5 + yERY )Mrac
(B.7)
with
winv = winv,SMB ∗Ntot + yRCwinv,RC + yECwinv,EC + yERwinv,ER
and
wop = wop,SMB + yRCwop,RC + yECwop,EC + yERwop,ER
Here, Ntot is the total number of active stages of the SMB unit. Depending on the
different weighing factors, various process schemes were obtained as optima.
Until now, the results were calculated using a hypothetical TMB model. But in
reality, the parameters obtained need to be converted to SMB design parameters.
For designing an SMB unit, the Qk and Qsolid values need to be converted to real
flow rates and switching times along with an additional pressure drop constraint.
Converting the optimized TMB results to actual SMB operational parameters can be
performed using relations already available in the literature [53]. In the next section,
we use these translation strategies to design an SMB unit incorporating the additional
restriction on pressure drop.
85

Appendix B. MINLP optimization of SMB process combination for producing pure
enantiomers
B.2.3 SMB design using TMB parameters
In order to design an SMB, the model equations used in the previous section are
appended to the Eqs.(B.8) - (B.22). This in turn ensures that the optimal Qk values
which are determined are in accordance with the minimum switch time or maximum
pressure drop limitations. The additional optimal design parameters besides the ones
which were determined for the TMB calculations are the column length (Lc), column
diameter (Dc), switch time (tswitch). The equations which are used for the TMB to
SMB translation can be written as.
Ac = 3.1416 ∗Dc ∗Dc/4 (B.8)
Vc = Ac ∗ Lc (B.9)
tswitch =
Vc ∗ (1 − ǫt) ∗
[
FL−1∑
k=1
ID ∗ Qk −FL−1∑
k=1
IE ∗ Qk
]
QE(B.10)
HETP = (aV D + bV D ∗ ULIN) (B.11)
NTPCOL ∗HETP = Lc (B.12)
NTP = 4 ∗NTPCOL (B.13)
NTP = (FNP −DPR + 1) (B.14)
dPj =1 ∗KdP ∗ Lc ∗Q1
ǫb ∗ Ac
(B.15)
Q1 ∗ tswitch =FL−1∑
k=1
ID ∗ Qk ∗ (1 − ǫt) ∗ Vc + ǫt ∗ V c (B.16)
Q2 ∗ tswitch =
FL−1∑
k=1
IE ∗ Qk ∗ (1 − ǫt) ∗ Vc + ǫt ∗ V c (B.17)
Q3 ∗ tswitch = QFL ∗ (1 − ǫt) ∗ Vc + ǫt ∗ V c (B.18)
Q4 ∗ tswitch =
NMax∑
k=F l+1
IR ∗ Qk ∗ (1 − ǫt) ∗ Vc + ǫt ∗ V c (B.19)
ULIN =Q1 +Q2 +Q3 +Q4
4 ∗ PORB ∗ Ac(B.20)
dP1 + dP2 + dP3 + dP4 ≤ ∆PMax (B.21)
QE ∗FL−1∑
k=1
IE ∗ Qk ∗ ck2 = MPEX (B.22)
Here we discuss the results obtained using a more detailed cost function. The cost
86

Appendix B. MINLP optimization of SMB process combination for producing pure
enantiomers
function can be written as C = CInv + CFeed + CSolv + COper + Cads [59]. Here CInv
represents the investment cost arising from the different units. CFeed and CSolv corre-
sponds to the feed material and solvent cost respectively. COper is the operation/labor
cost while Cads arises from the cost of chiral stationary phase.
The studies in this section have been performed for a fixed production rate of 2
mg/s. The extract is assumed to be the desired product. The cost function incorpo-
rating all the former contributions can be written as
C = Wf∗Mrac+Winv,SMB+Winv,Cry+Winv,Rac+Wsolv∗SC+Wop+Wads∗V c∗4 (B.23)
Since the investment and operation costs are not known explicitly, it is assumed in
a first step that the effect of these contributions is same for all three processes. This
implies that additional equipments and operation costs associated with a crystallizer
and racemizer are insignificant. Under such scenarios, the three processes namely
SMB, SMB-cryst, and SMB-rac-cryst can be compared. The results for this case is
given in Table B.5. Irrespective of the weighing factors as well the process scheme, the
length of the column (Lc) was always observed to be at the lower bound. Hence, there
was no significant effect of the number of stages on the process optimum though there
is a significant reduction in the objective function value for the process combinations.
A maximum pressure drop restriction of 200 bar across the four zones was considered
as the limit and was always at the bound. It can be seen that there is a significant
reduction in the cost by using process combinations. This arises mainly from the
use of columns with smaller diameters which reduces Cads. Since the effect of feed
material cost is not significant in comparison with the adsorbent cost, the effect of
racemization is not so pronounced. By using a larger Wf , and lower Wads, the effect
of racemization would be much more evident as there is a reduction in the amount of
feed material by half.
87

Appen
dix
B.M
INLP
optim
izatio
nofSM
Bprocess
com
binatio
nfo
rprod
ucin
gpure
enantio
mers
Table B.4: Comparison of different processes with translation to SMBProcess Wf Wsolv Wads Winv,SMB Winv,Cry Winv,Rac Wop
Case 1 1.0 0.1 0.01 0.0 0.0 0.0 0.0
The entries which are in bold implies they are at their lower/upper bounds.
Table B.5: Comparison of different processes with translation to SMB for case 1 in Table B.4Process Q1 Q2 Q3 Q4 F0 Lc Dc ts NTP Objective
SMB 2.983 1.722 1.822 1.615 0.1 10.0 3.248 60.0 200 1.066SMB-cryst 2.316 0.635 0.814 0.593 0.1 10.0 2.294 60.0 188 0.686
SMB-cryst-rac 2.019 0.951 1.071 0.951 0.05 10.0 2.544 60.0 200 0.665
88

Appendix C
Dynamic crystallizer model
In this Appendix, a dynamic version of the simple crystallizer model in the
Eqs.(2.8) - (2.10) is introduced. Let ψ be the void fraction of the crystallizer, i.e.
the volumetric fraction of the liquid phase. Further, let δ be the fraction of crystals
of the enantiomer 1 of the solid phase of the crystallizer. If we assume that ψ and
δ in the product removal are the same as inside the crystallizer and - as before -
the densities of the solid and the liquid are constant and identical, a simple dynamic
model can be formulated in the following form:
Total material balance of the liquid phase
d(ψV )
dt= Qevap − ψQout −
2∑
1
ki [Xi,ml −X∗
i ] (C.1)
Component material balances of both solutes in the liquid phase
d(ψVXi,ml)
dt= Qevap Xi,evap − ψQoutXi,ml − ki [Xi,ml −X∗
i ] (C.2)
Component material balance of enantiomer 1 in the solid phase
d((1 − ψ)V δ)
dt= k1 [X1,ml −X∗
1 ] − δ(1 − ψ)Qout (C.3)
Total material balance for equal and constant densities of the solid and the liquid
phase can be written as
Qout = Qevap (C.4)
This arises from the equal density assumption whereby they cancel off.
The effect of finite crystallizer dynamics on the open loop behavior is illustrated
in Figure C.1 for a capacity of 0.1 (red), 1 (blue) and 10 (black) volume units of
89

Appendix C. Dynamics of SMB-crystallization with a dynamic MSMPR crystallizer
model
the crystallizer for a +17.5 % increase of the external feed concentration. For very
small volumes, similar patterns of behavior as predicted with the quasi-static model
are observed. In particular, instability in the form of self sustained oscillations is
obtained. As can be expected, the oscillations are being damped away with increasing
volume of the crystallizer. However, formation of undesired crystals, which is the
major problem in this disturbance scenario remains independent of the volume of the
crystallizer. Irrespective of the volume, the control strategy proposed above can be
used to solve this problem. This is illustrated in Figure C.2 for the three different
cases of Figure C.1. The controller parameters for the closed loop process is given in
Table C.1.
Table C.1: Controller parameters for an SMB-crystallization process with a dynamiccrystallizer model
Parameters ValueKc[min/ml] 0.55τI [min] 120.0
90

Appen
dix
C.D
ynam
icsofSM
B-cry
stalliza
tion
with
adynam
icM
SM
PR
crysta
llizer
mod
el
0 20 40 60 80 1000
1
2
3
4
5
6
7
8
Simulation time [min]
Mas
s flo
w r
ate
of c
ryst
als
[mg/
min
]
0 20 40 60 80 1000.082
0.083
0.084
0.085
0.086
0.087
0.088
Simulation time [min]
Rec
ycle
flow
rat
e [m
l/min
]
0 20 40 60 80 1000.2
0.22
0.24
0.26
0.28
0.3
0.32
Simulation time [min]
Raf
finat
e flo
w r
ate
[ml/m
in]
0 20 40 60 80 1000.75
0.8
0.85
0.9
0.95
Simulation time [min]
Pur
ity
0 20 40 60 80 1007.85
7.9
7.95
8
8.05
8.1
8.15
Simulation time [min]
Con
cent
ratio
n stro
ngex
trac
t [g/l]
0 20 40 60 80 1001
2
3
4
5
6
7
Simulation time [min]
Con
cent
ratio
n stro
ngra
ffina
te [g
/l]
(a) (b) (c)
(d) (e) (f)
Figure C.1: Open loop dynamics for a step disturbance of +17.5% of the external feed concentration for a crystallizer at theextract with finite dynamics with a capacity of 0.1 (red), 1 (blue) and 10 (black) volume units. Meaning of thickand thin lines in diagrams (a) and (d) is as in Figure 3.3.
91

Appen
dix
C.D
ynam
icsofSM
B-cry
stalliza
tion
with
adynam
icM
SM
PR
crysta
llizer
mod
el
0 20 40 60 80 1000
2
4
6
8
Simulation time [min]Mas
s flo
w r
ate
of c
ryst
als
[mg/
min
]
0 20 40 60 80 1000.084
0.086
0.088
0.09
0.092
Simulation time [min]
Rec
ycle
flow
rat
e [m
l/min
]
0 20 40 60 80 1000.2
0.25
0.3
0.35
0.4
Simulation time [min]
Raf
finat
e flo
w r
ate
[ml/m
in]
0 20 40 60 80 1000.75
0.8
0.85
0.9
0.95
Simulation time [min]
Pur
ity
0 20 40 60 80 1007.8
8
8.2
8.4
8.6
8.8
Simulation time [min]
Con
cent
ratio
n stro
ngex
trac
t [g/l]
0 20 40 60 80 1000
2
4
6
8
10
Simulation time [min]
Con
cent
ratio
n stro
ngra
ffina
te [g
/l]
0 20 40 60 80 100
0.3
0.32
0.34
0.36
0.38
Simulation time [min]
Con
trol
var
iabl
e
0 20 40 60 80 1000.013
0.014
0.015
0.016
0.017
Simulation time [min]
Flo
w to
cry
stal
lizer
[ml/m
in]
0 20 40 60 80 1000.9
0.91
0.92
0.93
0.94
Simulation time [min]
Man
ipul
ated
var
iabl
e
(a)
(a)
(b) (c)
(e)(d)
(g) (h)
(f)
(i)
Figure C.2: Closed loop dynamics for a step disturbance of +17.5% of the external feed concentration for a crystallizer at theextract with finite dynamics with a capacity of 0.1 (red), 1 (blue) and 10 (black) volume units. Meaning of thickand thin lines in diagrams (a) and (d) is as in Figure 3.3.
92

Bibliography
[1] J. Jacques, A. Collet, and S. Wilen. Enantiomers, Racemates and Resolutions.Krieger, Malabar, 1994.
[2] B. Li and D. T. Haynie. Encyclopedia of Chemical Processing, Chapter “Chiraldrug separation”, page 451. Taylor and Francis, 2006.
[3] A. Rajendran, G. Paredes, and M. Mazzotti. Simulated moving bed chromatog-raphy for the separation of enantiomers. J. Chromatogr. A, 1216:709–738, 2009.
[4] M. Kaspereit. Separation of enantiomers by a process combination of chro-matography and crystallization. Shaker, Aachen, 2006.
[5] M. Kaspereit, A. Seidel-Morgenstern, and A. Kienle. Design of simulated mov-ing bed under reduced purity requirements. J. Chromatogr. A, 1162:2–13, 2007.
[6] H. Lorenz, P. Sheehan, and A. Seidel-Morgenstern. Coupling of simulated mov-ing bed chromatography and fractional crystallisation for efficient enantiosepa-ration. J. Chromatogr. A, 908:201–214, 2001.
[7] M. Kaspereit, K. Gedicke, V. Zahn, A. W. Mahoney, and A. Seidel-Morgenstern.Shortcut method for the evaluation and design of a hybrid process for enan-tioseparations. J. Chromatogr. A, 1092:43–54, 2005.
[8] H. Kaemmerer, M. J. Jones, H. Lorenz, and A. Seidel-Morgenstern. Selectivecrystallisation of a chiral compound-forming system – solvent screening, SLEdetermination and process design. Fluid Phase Equilibria, 296:192 – 205, 2010.
[9] H. Kaemmerer, R. Zinke, H. Lorenz, M. J. Jones, A. Seidel-Morgenstern, andM. Stein. Corrigendum to selective crystallisation of a chiral compound-formingsystem–solvent screening, SLE determination and process design by H. Kaem-merer et al. [Fluid Phase Equilibria. 296 (2010) 192–205]. Fluid Phase Equilibria,307:110 – 112, 2011.
[10] T. Borren, J. Fricke, and H. Schmidt-Traub. Integrated reaction and separa-
tion operations: Modelling and experimental validation, chapter Reactive liquidchromatography, pages 191–239. Springer, Berlin, 2006.
93

Bibliography
[11] M. Kaspereit, J. Garcıa Palacios, T.F. Meixus, and A. Kienle. In BertrandBraunschweig and Xavier Joulia, editors, Computer-Aided Chemical Engineer-
ing, vol. 25 – 18th European Symposium on Computer Aided Process Engineer-
ing, pages 97–102. 2008.
[12] M. Bechtold, S. Makart, M. Heinemann, and S. Panke. Integrated operation ofcontinuous chromatography and biotransformations for the generic high yieldproduction of fine chemicals. Journal of Biotechnology, 124:146 – 162, 2006.
[13] K. Petruevska-Seebach, K. Wrges, A. Seidel-Morgenstern, S. Ltz, and M. P.Elsner. Enzyme-assisted physicochemical enantioseparation processes – part ii:Solid-liquid equilibria, preferential crystallization, chromatography and racem-ization reaction. Chem. Eng. Sci., 64:2473 – 2482, 2009.
[14] B. G. Lim, C.-B. Ching, R.B.H. Tan, and S.-C.Ng. Recovery of (-) -praziquantelfrom racemic mixtures by continuous chromatography and crystallisation.Chem. Eng. Sci., 50:2289–2298, 1995.
[15] J. Blehaut and R.-M. Nicoud. Recent aspects in simulated moving bed. Analusis
Magazine, 26:M60–M70, 1998.
[16] K. Gedicke, M. Kaspereit, W. Beckamnn, U. Budde, H. Lorenz, and A. Seidel-Morgenstern. Conceptual design and feasibility study of combining continuouschromatography and crystallization for stereoisomer separations. Chem. Eng.
Res. Des., 85:928–936, 2007.
[17] A. Rajendran. Equilibirum theory based design of simulated moving bed pro-cesses for reduced purity requirements: Linear isotherms. J. Chromatogr. A,1185:216–222, 2008.
[18] M. Amanullah and M. Mazzotti. Optimization of a hybrid chromatography-crystallization process for the separation of troger’s base enantiomers. J. Chro-
matogr. A, 1107:36–45, 2006.
[19] J. Garcıa Palacios, M. Kaspereit, and A. Kienle. Conceptual design of integratedchromatographic processes for the production of single (stereo-)isomers. Chem.
Eng. Tech., 32:1392–1402, 2009.
[20] J. Garcıa Palacios, M. Kaspereit, and A. Kienle. Integrated simulated movingbed processes for the production of single enantiomers. Chem. Eng. Tech.,34(5):688–698, 2011.
[21] J. Garcıa Palacios, B. Kramer, A. Kienle, and M. Kaspereit. Experimentalvalidation of a new integrated simulated moving bed process for the productionof single enantiomers. J. Chromatogr. A, 1218:2232–2239, 2011.
[22] K. Hashimoto, S. Adachi, H. Noujima, and Y. Ueda. A new process combiningadsorption and enzyme reaction for producing higher-fructose syrup. Biotech-
nology & Bioengineering, 25:2371–2393, 1983.
94

Bibliography
[23] M. Bechtold, M. Fureder, and N. Wagner und S. Panke. Potenzial von prozess-integration mit adsorbern zur herstellung seltener monosaccharide eine mod-ellbasierte untersuchung. Chem. Ing. Tech., 82:65–75, 2010.
[24] M. Kaspereit, S. Swernath, and A. Kienle. Evaluation of competing processconcepts for the production of pure enatiomers. Org. Proc. Res. Dev., 16(2):353–363, 2012.
[25] J. Viswanathan and I. E. Grossmann. A combined penalty function and outer-approximation method for MINLP optimization. Comp. Chem. Eng., 14:769–782, 1990.
[26] I. E. Grossmann, P. A. Aguirre, and M. Barttfeld. Optimal synthesis of complexdistillation columns using rigorous models. Comp. Chem. Eng., 29:1203–1215,2005.
[27] J. Gangadwala and A. Kienle. MINLP optimization of butyl acetate synthesis.Chem. Eng. and Proc., 46:107–118, 2007.
[28] J. Gangadwala, A. Kienle, Utz-Uwe Haus, D. Michaels, and R. Weismantel.Global bounds on optimal solutions for the production of 2,3-dimethylbutene-1. Ind. Eng. Chem. Res., 45:2261–2271, 2006.
[29] T. F. Yee and Ignacio E. Grossmann. Simultaneous optimization models for heatintegration-ii. heat exchanger network synthesis. Comp. Chem. Eng., 14:1165–1184, 1990.
[30] E. Ahmetovia and I. E. Grossmann. Strategies for the global optimizationof integrated process water networks. Computer Aided Chemical Engineering,28:901–906, 2010.
[31] A. Lakshmanan and L. T. Biegler. Synthesis of optimal chemical reactor net-works with simultaneous mass integration. Ind. Eng. Chem. Res., 35:4523–4536,1996.
[32] R. M. Lima and I. E. Grossmann. Optimal synthesis of p-xylene separationprocesses based on crystallization technology. AIChE J., 55:354–373, 2009.
[33] Y. Kawajiri and L. T. Biegler. Nonlinear programming superstructure for op-timal dynamic operations of simulated moving bed processes. Ind. Eng. Chem.
Res., 45:8503–8513, 2006.
[34] Y. Kawajiri and L. T. Biegler. Large scale optimization strategies for zoneconfiguration of simulated moving beds. Comp. Chem. Eng., 32:135–144, 2008.
[35] E. Kloppenburg and E. D. Gilles. Automatic control of the simulated mov-ing bed process for c8 aromatics separation using asymptotically exact in-put/output linearization. J. Proc. Cont., 9:41–50, 1999.
95

Bibliography
[36] Z. Zhang, M. Mazzotti, and M. Morbidelli. Powerfeed operation of aimulatedmoving bed units: changing flow rates during the switching interval. J. Chro-
matogr. A, 1006:87–99, 2003.
[37] O. Ludemann-Hombourger, G. Pigorini, R.-M. Nicoud, D. Ross, and G. Ter-floth. Application of the ”varicol“ process to the separation of the isomers ofthe sb-553261 racemate. J. Chromatogr. A, 947:59–68, 2002.
[38] O. Ludemann-Hombourger, R.-M. Nicoud, and M. Bailly. The “varicol” process:a new multicolumn continuous chromatographic process. Sep. Sci. and Tech.,35:1829–1862, 2000.
[39] S. Pushpavanam and A. Kienle. Nonlinear behavior of an ideal reactor separatornetwork with mass recycle. Chem. Eng. Sci., 56:2837–2849, 2001.
[40] K.P. Zeyer, S. Pushpavanam, and A. Kienle. Nonlinear behavior of reactor-separator networks: Influence of separator control structure. Ind. Eng. Chem.
Res., 42:3294–3303, 2003.
[41] W. L. Luyben. Snowball effects in reactor/separator processes with recycle.Ind. Eng. Chem. Res., 33:299–305, 1994.
[42] C. Y. Chin and N.-H.L.Wang. Simulated moving bed equipment designs. Sep.
and Purification Reviews, 33:77–155, 2004.
[43] C. Y. Chin, Y. Xie, Jr J. S. Alford, and N.-H.L.Wang. Analysis of zone andpump configurations in simulated moving bed purification of insulin. AIChE
J., 52:2447–2460, 2006.
[44] JuWeon Lee, Ching Ho Lee, and Yoon Mo Koo. Sensitivity analysis of aminoacids in simulated moving bed chromatography. BioTech and BioProc. Eng.,11:110–115, 2006.
[45] S. Natarajan and J. H. Lee. Repetitive model predictive control applied to asimulated moving bed chromatography system. Comp. Chem. Eng., 24:1127–1133, 2000.
[46] A. Toumi and S. Engell. Optimization-based control of a reactive simulatedmoving bed process for glucose isomerization. Chem. Eng. Sci., 59:3777–3792,2004.
[47] G. Erdem, S. Abel, M. Morari, M. Mazzotti, M. Morbidelli, and J.H. Lee.Automatic control of simulated moving beds. Ind. Eng. Chem. Res., 43:405–421, 2004.
[48] G. Erdem, S. Abel, M. Morari, M. Mazzotti, and M. Morbidelli. Automaticcontrol of simulated moving beds - II: Nonlinear isotherm. Ind. Eng. Chem.
Res., 43:3895–3907, 2004.
96

Bibliography
[49] C. Grossmann, G. Erdem, M. Morari, M. Amanullah, M. Mazzotti, and M. Mor-bidelli. Cycle to cycle optimizing control of simulated moving bed plants. AIChE
J., 54:194–208, 2008.
[50] H. Schramm, S. Gruner, and A. Kienle. Optimal operation of simulated mov-ing bed chromatographic processes by means of simple feedback control. J.
Chromatogr. A, 1006:3–13, 2003.
[51] M. Fuetterer. An adaptive control concept for simulated moving bed plants incase of complete separation. Chem. Eng. Tech., 31:1438–1444, 2008.
[52] M. Fuetterer. An adaptive control concept for simulated moving bed plantsunder reduced purity requirements. Chem. Eng. Tech., 31:1816–1823, 2008.
[53] F. Charton and R. M. Nicoud. Complete design of a simulated moving bed. J.
Chromatogr. A, 702:97–112, 1995.
[54] H. Kniep, G. Mann, C. Vogel, and A. Seidel-Morgenstern. Separation of enan-tiomers through simulated moving bed chromatography. Chem. Eng. Tech.,23:853–857, 2000.
[55] H. Lorenz, D. Sapoundjiev, and A. Seidel-Morgenstern. Solubility equilibriain chiral systems and their importance for enantioseparation. Eng. Life. Sci.,3:132–136, 2003.
[56] A. Brooke, D. Kendrick, A. Meeraus, and R. Raman. GAMS A User‘s Guide.GAMS Development corporation, Washington D.C., 1996.
[57] GAMS Development corporation, Washington D.C. GAMS The Solver Manu-
als, 2006.
[58] J. v. Langermann, M. Kaspereit, M. Shakeri, H. Lorenz, M. Hedberg, M. J.Jones, K. Larson, B. Herschend, R. Arnell, E. Temmel J.E. Backvall A. Kienle,and A. Seidel-Morgenstern. Design of an integrated process of chromatogra-phy, crystallization and racemization for the resolution of 2’,6’-pipecoloxylidide(PPX). Org. Proc. Res. Dev., 16:343–352, 2012.
[59] A. Jupke, A. Epping, and H. Schmidt-Traub. Optimal design of batch andsimulated moving bed chromatographic separation processes. J. Chromatogr.
A, 944:93–117, 2002.
[60] G. R. Kocis and I. E. Grossmann. Relaxation strategy for the structural opti-mization of process flow sheets. Ind. Eng. Chem. Res., 26:1869–1880, 1987.
[61] M. Mangold, A. Kienle, E.D. Gilles, and K.D. Mohl. Nonlinear computation inDIVA-methods and applications. Chem. Eng. Sci., 55:441–454, 2000.
[62] H. Schramm, M. Kaspereit, A. Kienle, and A. Seidel-Morgenstern. Simulatedmoving bed process with cyclic modulation of the feed concentration. J. Chro-
matogr. A, 1006:77–86, 2003.
97

Bibliography
[63] M. Golubitsky and D. G. Schaeffer. Singularities and Groups in Bifurcation
Theory, volume 1. Springer, New York, 1985.
[64] J. A. Romagnoli and A. Palazoglu. Introduction to Process Control. CRC,Taylor and Francis, Oxford, 2006.
[65] S. Sommer, P. Muller, and A. Kienle. Iterative feedback tuning of PID con-trollers for reactive distillation processes: A comparison with relay feedbacktuning. Ind. Eng. Chem. Res., 50:9821–9828, 2011.
[66] W. L. Luyben, B. D. Tyreus, and M. L. Luyben. Plantwide Process Control.McGraw Hill, New York, 1998.
[67] M. P. Elsner, D. F. Menendez, E. A. Muslera, and A. Seidel-Morgenstern. Ex-perimental study and simplified mathematical description of preferential crys-tallization. Chirality, 17:S183–S195, 2005.
[68] J. Viswanathan and I. E. Grossmann. An alternate MINLP model for findingthe number of trays for a specified separation objective. Comp. Chem. Eng.,17:949–955, 1993.
98