Embed Size (px)
Citation preview
i n t e r n a t i o n a l j o u r n a l o f h y d r o g e n e n e r g y 3 5 ( 2 0 1 0 ) 9 9 8 3 – 9 9 8 9
Avai lab le a t www.sc iencedi rec t .com
j ourna l homepage : www.e lsev ier . com/ loca te /he
Design and development of a 7kW polymer electrolytemembrane fuel cell stack for UPS application
G. Squadrito a,*, G. Giacoppo a, O. Barbera a, F. Urbani a, E. Passalacqua a, L. Borello b,A. Musso b, I. Rosso b
a CNR - Istituto di Tecnologie Avanzate per l’Energia ‘‘Nicola Giordano’’ (CNR-ITAE), Salita S. Lucia sopra Contesse 5,
98126 Messina, Italyb Electro Power Systems spa (EPS), Via Grange Palmero 104, 10091 Alpignano, Italy
a r t i c l e i n f o
Article history:
Received 19 June 2009
Received in revised form
30 October 2009
Accepted 3 November 2009
Available online 22 November 2009
Keywords:
Polymer electrolyte fuel cells
Stack design
UPS
* Corresponding author. Tel.: þ39-090624231E-mail addresses: gaetano.squadrito@ita
(O. Barbera), [email protected] (F. Urbani), [email protected] (A. Musso), ilaria.rosso@0360-3199/$ – see front matter ª 2009 Profesdoi:10.1016/j.ijhydene.2009.11.019
a b s t r a c t
This work presents the PEMFC stack design methodology developed at CNR-ITAE, in the
frame of a collaboration with an industrial partner, Electro Power Systems (EPS), operating
in the Uninterruptable Power Supply (UPS) market. A detailed description of the design
procedure of a 7 kW PEMFC stack is reported, starting from technical requirements of the
UPS system to experimental tests. Bipolar plate layout, active area surface and shape,
maximum (OCV) and minimum voltage, maximum cooling circuit pressure drop,
maximum cathodic flow-field pressure drop, were the main constraint that influenced the
constructive solutions. The electrochemical performances of Gore Primea 5621 MEA with
SGL Sigracet GDL were chosen as reference to select the appropriate operating point in
terms of current density and single cell voltage. A current density of 800 mA/cm2 was
imposed as operating point of the stack, subsequently main stack parameters were
calculated. Three different cathodic flow fields, that were designed to fulfill UPS system
requirements, were tested in a single cell arrangement, to find the best gas flow path in
terms of compromise between cell performance and pressure drop. Also a specific study
was dedicated to the selection of gasket material to find the best compromise between cell
performance and limited mechanical stress. The assembled 70 cells unit was tested in
a test bench simulating the power system. Preliminary tests of the full unit yielded to
a power of 6.2kW at 36 V.
ª 2009 Professor T. Nejat Veziroglu. Published by Elsevier Ltd. All rights reserved.
1. Introduction systems. Furthermore, recent advances in PEFC technology
Polymer Electrolyte (Membrane) Fuel Cells (PEMFC or PEFC) are
considered as an environmentally friendly and high efficiency
power generator for many applications, and are becoming an
interesting power source in different application fields, from
small electronic portable units to medium size stationary
; fax: þ39-090624247.e.cnr.it (G. Squadrito), [email protected] (I. Rosso).sor T. Nejat Veziroglu. Pu
have opened the way for commercialisation in several appli-
cation field, especially UPS and backup power market,
showing the possibility to reach a large scale application [1–6].
Although, PEFC technology is far from being commercially
cost effective, single components, (membrane, catalyst, gas
diffusion layers, catalysed membranes) and stacks have been
[email protected] (G. Giacoppo), [email protected] (E. Passalacqua), [email protected] (L. Borello), andrea.
blished by Elsevier Ltd. All rights reserved.
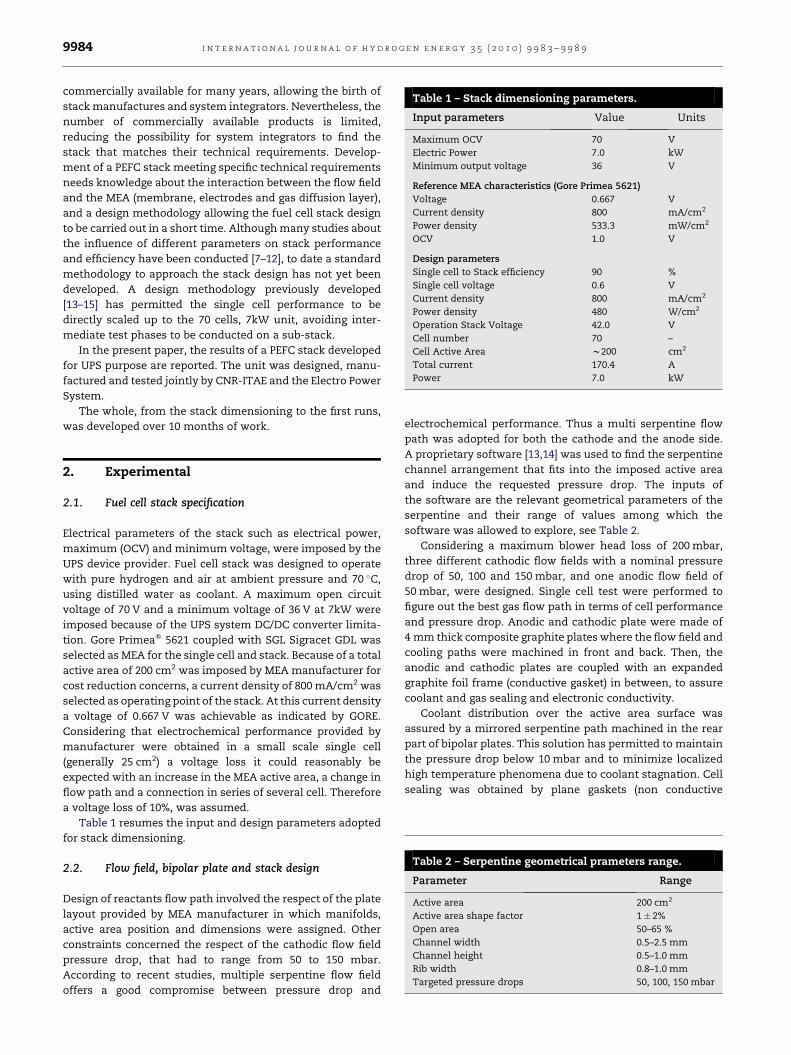
Table 1 – Stack dimensioning parameters.
Input parameters Value Units
Maximum OCV 70 V
Electric Power 7.0 kW
Minimum output voltage 36 V
Reference MEA characteristics (Gore Primea 5621)
Voltage 0.667 V
Current density 800 mA/cm2
Power density 533.3 mW/cm2
OCV 1.0 V
Design parameters
Single cell to Stack efficiency 90 %
Single cell voltage 0.6 V
Current density 800 mA/cm2
Power density 480 W/cm2
Operation Stack Voltage 42.0 V
Cell number 70 –
Cell Active Area w200 cm2
Total current 170.4 A
Power 7.0 kW
i n t e r n a t i o n a l j o u r n a l o f h y d r o g e n e n e r g y 3 5 ( 2 0 1 0 ) 9 9 8 3 – 9 9 8 99984
commercially available for many years, allowing the birth of
stack manufactures and system integrators. Nevertheless, the
number of commercially available products is limited,
reducing the possibility for system integrators to find the
stack that matches their technical requirements. Develop-
ment of a PEFC stack meeting specific technical requirements
needs knowledge about the interaction between the flow field
and the MEA (membrane, electrodes and gas diffusion layer),
and a design methodology allowing the fuel cell stack design
to be carried out in a short time. Although many studies about
the influence of different parameters on stack performance
and efficiency have been conducted [7–12], to date a standard
methodology to approach the stack design has not yet been
developed. A design methodology previously developed
[13–15] has permitted the single cell performance to be
directly scaled up to the 70 cells, 7kW unit, avoiding inter-
mediate test phases to be conducted on a sub-stack.
In the present paper, the results of a PEFC stack developed
for UPS purpose are reported. The unit was designed, manu-
factured and tested jointly by CNR-ITAE and the Electro Power
System.
The whole, from the stack dimensioning to the first runs,
was developed over 10 months of work.
Table 2 – Serpentine geometrical prameters range.
Parameter Range
Active area 200 cm2
Active area shape factor 1� 2%
Open area 50–65 %
Channel width 0.5–2.5 mm
Channel height 0.5–1.0 mm
Rib width 0.8–1.0 mm
Targeted pressure drops 50, 100, 150 mbar
2. Experimental
2.1. Fuel cell stack specification
Electrical parameters of the stack such as electrical power,
maximum (OCV) and minimum voltage, were imposed by the
UPS device provider. Fuel cell stack was designed to operate
with pure hydrogen and air at ambient pressure and 70 �C,
using distilled water as coolant. A maximum open circuit
voltage of 70 V and a minimum voltage of 36 V at 7kW were
imposed because of the UPS system DC/DC converter limita-
tion. Gore Primea� 5621 coupled with SGL Sigracet GDL was
selected as MEA for the single cell and stack. Because of a total
active area of 200 cm2 was imposed by MEA manufacturer for
cost reduction concerns, a current density of 800 mA/cm2 was
selected as operating point of the stack. At this current density
a voltage of 0.667 V was achievable as indicated by GORE.
Considering that electrochemical performance provided by
manufacturer were obtained in a small scale single cell
(generally 25 cm2) a voltage loss it could reasonably be
expected with an increase in the MEA active area, a change in
flow path and a connection in series of several cell. Therefore
a voltage loss of 10%, was assumed.
Table 1 resumes the input and design parameters adopted
for stack dimensioning.
2.2. Flow field, bipolar plate and stack design
Design of reactants flow path involved the respect of the plate
layout provided by MEA manufacturer in which manifolds,
active area position and dimensions were assigned. Other
constraints concerned the respect of the cathodic flow field
pressure drop, that had to range from 50 to 150 mbar.
According to recent studies, multiple serpentine flow field
offers a good compromise between pressure drop and
electrochemical performance. Thus a multi serpentine flow
path was adopted for both the cathode and the anode side.
A proprietary software [13,14] was used to find the serpentine
channel arrangement that fits into the imposed active area
and induce the requested pressure drop. The inputs of
the software are the relevant geometrical parameters of the
serpentine and their range of values among which the
software was allowed to explore, see Table 2.
Considering a maximum blower head loss of 200 mbar,
three different cathodic flow fields with a nominal pressure
drop of 50, 100 and 150 mbar, and one anodic flow field of
50 mbar, were designed. Single cell test were performed to
figure out the best gas flow path in terms of cell performance
and pressure drop. Anodic and cathodic plate were made of
4 mm thick composite graphite plates where the flow field and
cooling paths were machined in front and back. Then, the
anodic and cathodic plates are coupled with an expanded
graphite foil frame (conductive gasket) in between, to assure
coolant and gas sealing and electronic conductivity.
Coolant distribution over the active area surface was
assured by a mirrored serpentine path machined in the rear
part of bipolar plates. This solution has permitted to maintain
the pressure drop below 10 mbar and to minimize localized
high temperature phenomena due to coolant stagnation. Cell
sealing was obtained by plane gaskets (non conductive
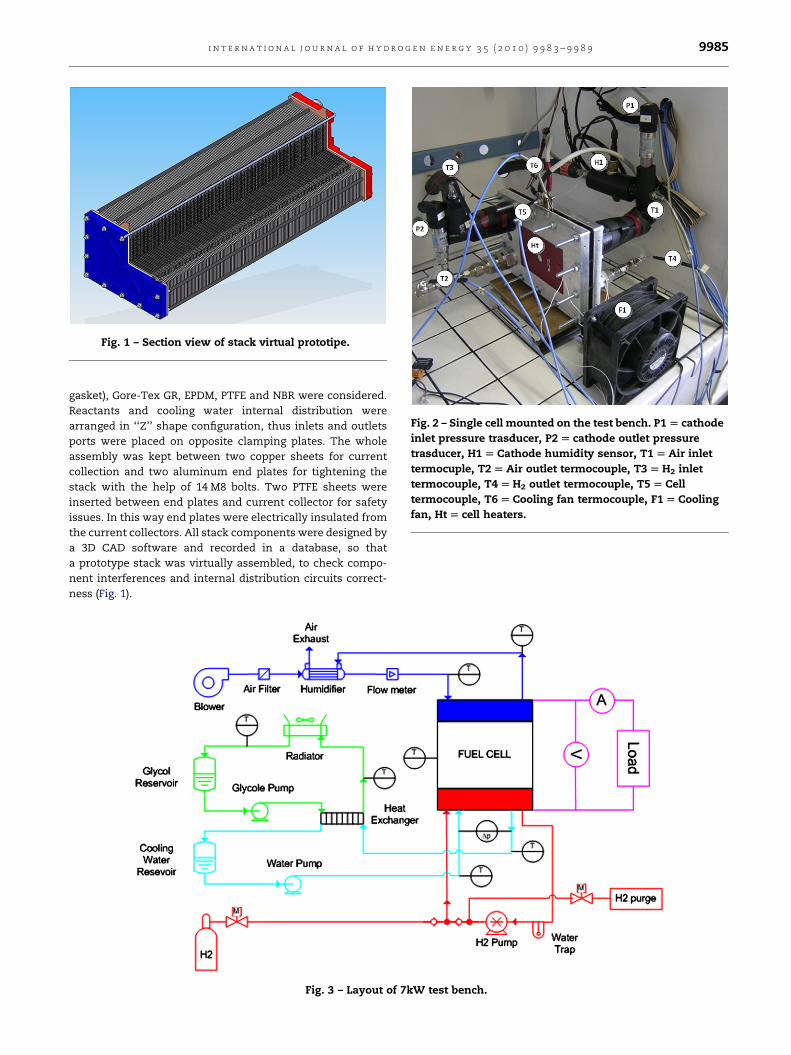
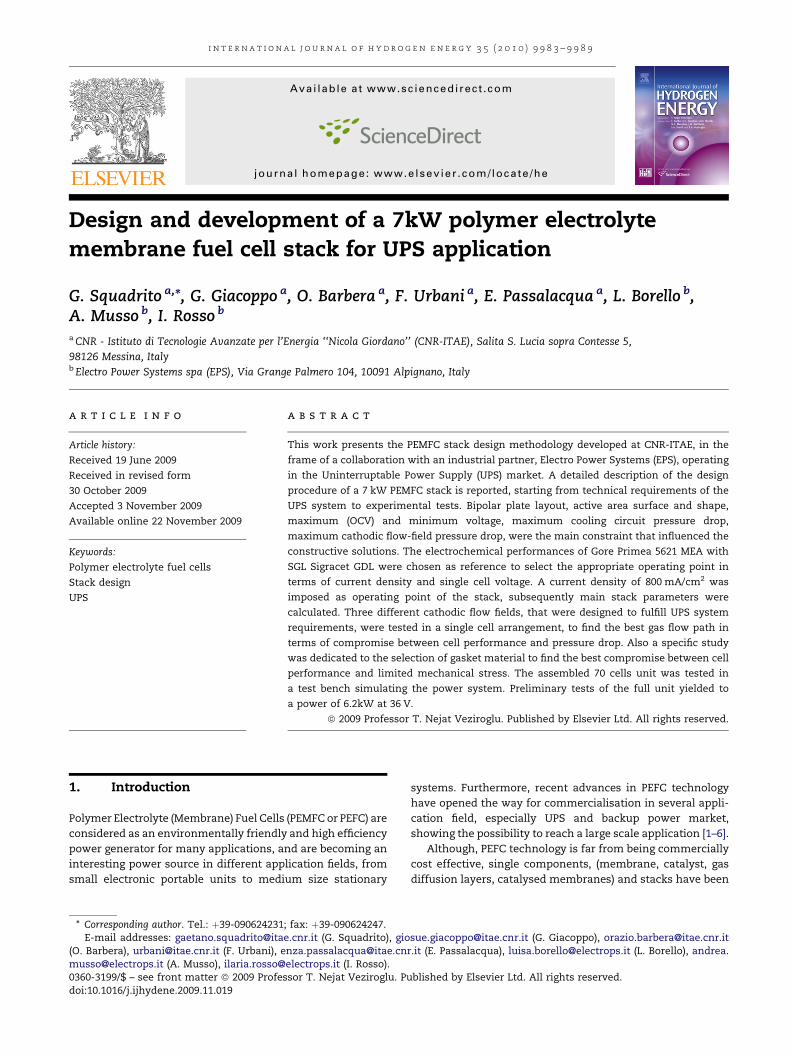
Fig. 1 – Section view of stack virtual prototipe.
Fig. 2 – Single cell mounted on the test bench. P1 [ cathode
inlet pressure trasducer, P2 [ cathode outlet pressure
trasducer, H1 [ Cathode humidity sensor, T1 [ Air inlet
termocuple, T2 [ Air outlet termocouple, T3 [ H2 inlet
termocouple, T4 [ H2 outlet termocouple, T5 [ Cell
termocouple, T6 [ Cooling fan termocouple, F1 [ Cooling
fan, Ht [ cell heaters.
i n t e r n a t i o n a l j o u r n a l o f h y d r o g e n e n e r g y 3 5 ( 2 0 1 0 ) 9 9 8 3 – 9 9 8 9 9985
gasket), Gore-Tex GR, EPDM, PTFE and NBR were considered.
Reactants and cooling water internal distribution were
arranged in ‘‘Z’’ shape configuration, thus inlets and outlets
ports were placed on opposite clamping plates. The whole
assembly was kept between two copper sheets for current
collection and two aluminum end plates for tightening the
stack with the help of 14 M8 bolts. Two PTFE sheets were
inserted between end plates and current collector for safety
issues. In this way end plates were electrically insulated from
the current collectors. All stack components were designed by
a 3D CAD software and recorded in a database, so that
a prototype stack was virtually assembled, to check compo-
nent interferences and internal distribution circuits correct-
ness (Fig. 1).
Fig. 3 – Layout of 7kW test bench.
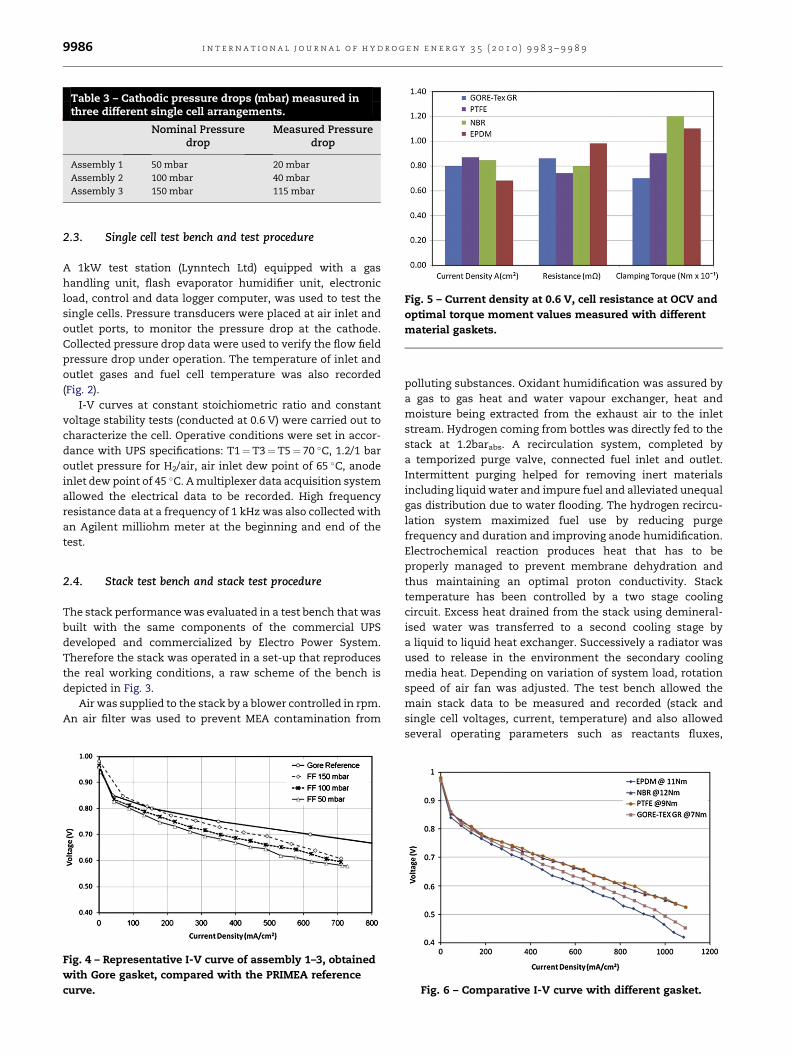
Table 3 – Cathodic pressure drops (mbar) measured inthree different single cell arrangements.
Nominal Pressuredrop
Measured Pressuredrop
Assembly 1 50 mbar 20 mbar
Assembly 2 100 mbar 40 mbar
Assembly 3 150 mbar 115 mbar
Fig. 5 – Current density at 0.6 V, cell resistance at OCV and
optimal torque moment values measured with different
material gaskets.
i n t e r n a t i o n a l j o u r n a l o f h y d r o g e n e n e r g y 3 5 ( 2 0 1 0 ) 9 9 8 3 – 9 9 8 99986
2.3. Single cell test bench and test procedure
A 1kW test station (Lynntech Ltd) equipped with a gas
handling unit, flash evaporator humidifier unit, electronic
load, control and data logger computer, was used to test the
single cells. Pressure transducers were placed at air inlet and
outlet ports, to monitor the pressure drop at the cathode.
Collected pressure drop data were used to verify the flow field
pressure drop under operation. The temperature of inlet and
outlet gases and fuel cell temperature was also recorded
(Fig. 2).
I-V curves at constant stoichiometric ratio and constant
voltage stability tests (conducted at 0.6 V) were carried out to
characterize the cell. Operative conditions were set in accor-
dance with UPS specifications: T1¼T3¼T5¼ 70 �C, 1.2/1 bar
outlet pressure for H2/air, air inlet dew point of 65 �C, anode
inlet dew point of 45 �C. A multiplexer data acquisition system
allowed the electrical data to be recorded. High frequency
resistance data at a frequency of 1 kHz was also collected with
an Agilent milliohm meter at the beginning and end of the
test.
2.4. Stack test bench and stack test procedure
The stack performance was evaluated in a test bench that was
built with the same components of the commercial UPS
developed and commercialized by Electro Power System.
Therefore the stack was operated in a set-up that reproduces
the real working conditions, a raw scheme of the bench is
depicted in Fig. 3.
Air was supplied to the stack by a blower controlled in rpm.
An air filter was used to prevent MEA contamination from
Fig. 4 – Representative I-V curve of assembly 1–3, obtained
with Gore gasket, compared with the PRIMEA reference
curve.
polluting substances. Oxidant humidification was assured by
a gas to gas heat and water vapour exchanger, heat and
moisture being extracted from the exhaust air to the inlet
stream. Hydrogen coming from bottles was directly fed to the
stack at 1.2barabs. A recirculation system, completed by
a temporized purge valve, connected fuel inlet and outlet.
Intermittent purging helped for removing inert materials
including liquid water and impure fuel and alleviated unequal
gas distribution due to water flooding. The hydrogen recircu-
lation system maximized fuel use by reducing purge
frequency and duration and improving anode humidification.
Electrochemical reaction produces heat that has to be
properly managed to prevent membrane dehydration and
thus maintaining an optimal proton conductivity. Stack
temperature has been controlled by a two stage cooling
circuit. Excess heat drained from the stack using demineral-
ised water was transferred to a second cooling stage by
a liquid to liquid heat exchanger. Successively a radiator was
used to release in the environment the secondary cooling
media heat. Depending on variation of system load, rotation
speed of air fan was adjusted. The test bench allowed the
main stack data to be measured and recorded (stack and
single cell voltages, current, temperature) and also allowed
several operating parameters such as reactants fluxes,
Fig. 6 – Comparative I-V curve with different gasket.
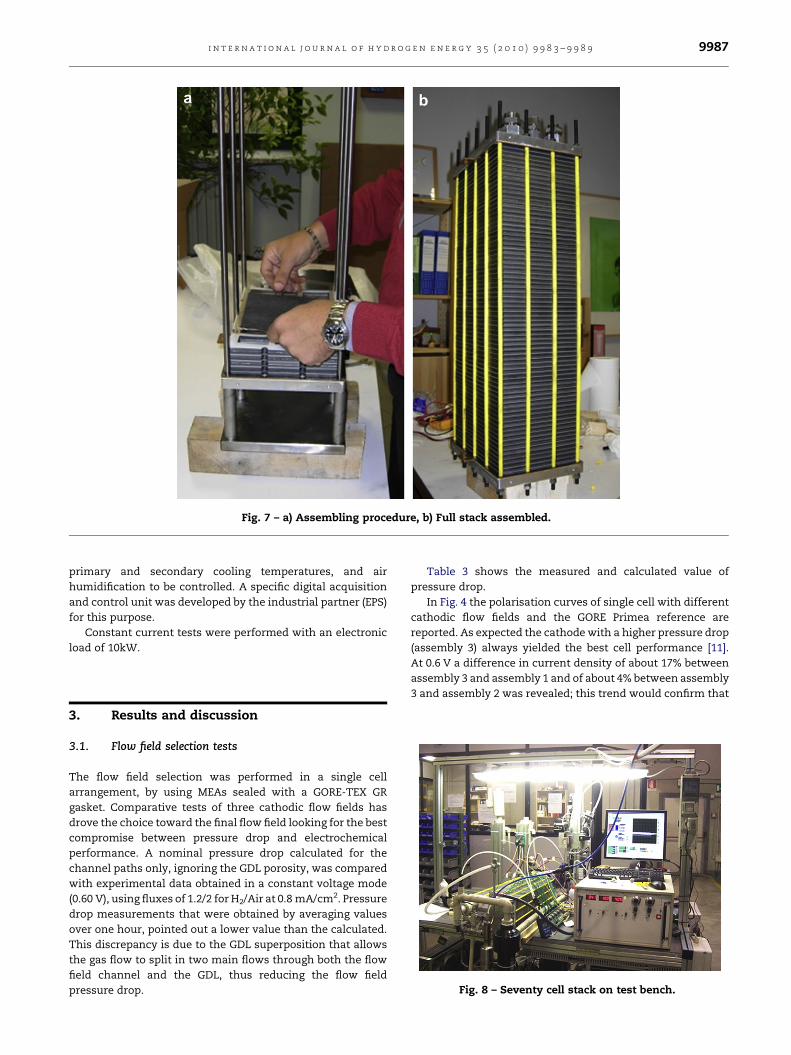
Fig. 7 – a) Assembling procedure, b) Full stack assembled.
i n t e r n a t i o n a l j o u r n a l o f h y d r o g e n e n e r g y 3 5 ( 2 0 1 0 ) 9 9 8 3 – 9 9 8 9 9987
primary and secondary cooling temperatures, and air
humidification to be controlled. A specific digital acquisition
and control unit was developed by the industrial partner (EPS)
for this purpose.
Constant current tests were performed with an electronic
load of 10kW.
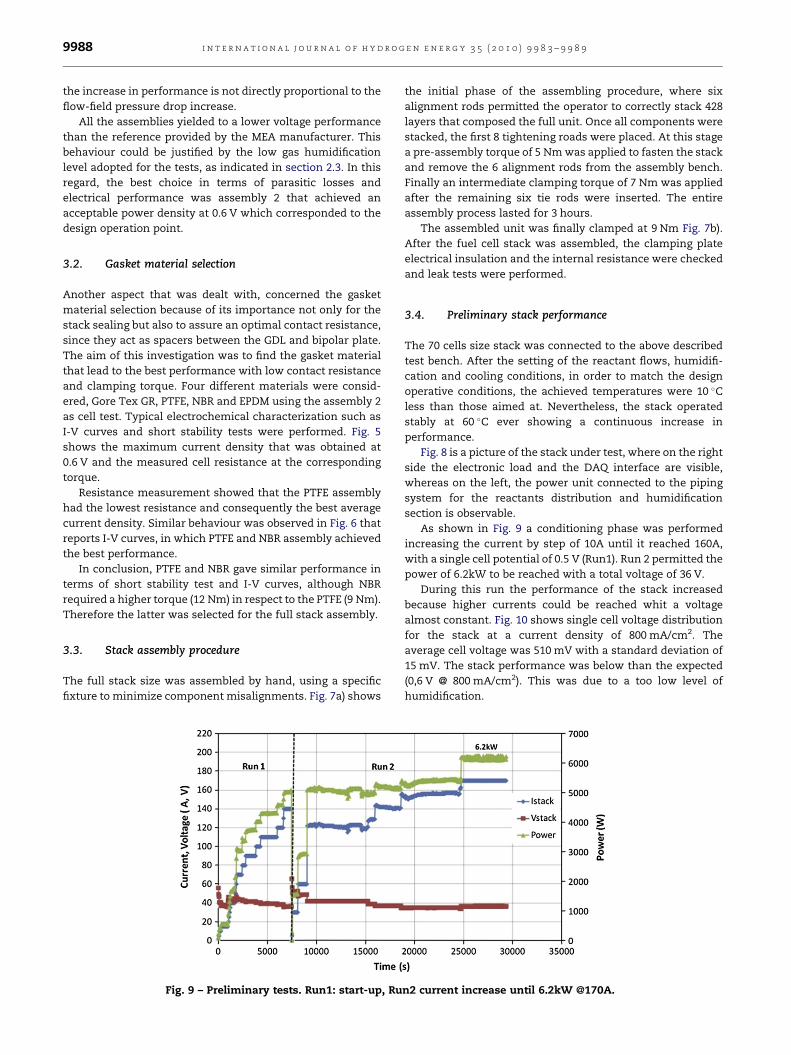
Fig. 8 – Seventy cell stack on test bench.
3. Results and discussion
3.1. Flow field selection tests
The flow field selection was performed in a single cell
arrangement, by using MEAs sealed with a GORE-TEX GR
gasket. Comparative tests of three cathodic flow fields has
drove the choice toward the final flow field looking for the best
compromise between pressure drop and electrochemical
performance. A nominal pressure drop calculated for the
channel paths only, ignoring the GDL porosity, was compared
with experimental data obtained in a constant voltage mode
(0.60 V), using fluxes of 1.2/2 for H2/Air at 0.8 mA/cm2. Pressure
drop measurements that were obtained by averaging values
over one hour, pointed out a lower value than the calculated.
This discrepancy is due to the GDL superposition that allows
the gas flow to split in two main flows through both the flow
field channel and the GDL, thus reducing the flow field
pressure drop.
Table 3 shows the measured and calculated value of
pressure drop.
In Fig. 4 the polarisation curves of single cell with different
cathodic flow fields and the GORE Primea reference are
reported. As expected the cathode with a higher pressure drop
(assembly 3) always yielded the best cell performance [11].
At 0.6 V a difference in current density of about 17% between
assembly 3 and assembly 1 and of about 4% between assembly
3 and assembly 2 was revealed; this trend would confirm that
i n t e r n a t i o n a l j o u r n a l o f h y d r o g e n e n e r g y 3 5 ( 2 0 1 0 ) 9 9 8 3 – 9 9 8 99988
the increase in performance is not directly proportional to the
flow-field pressure drop increase.
All the assemblies yielded to a lower voltage performance
than the reference provided by the MEA manufacturer. This
behaviour could be justified by the low gas humidification
level adopted for the tests, as indicated in section 2.3. In this
regard, the best choice in terms of parasitic losses and
electrical performance was assembly 2 that achieved an
acceptable power density at 0.6 V which corresponded to the
design operation point.
3.2. Gasket material selection
Another aspect that was dealt with, concerned the gasket
material selection because of its importance not only for the
stack sealing but also to assure an optimal contact resistance,
since they act as spacers between the GDL and bipolar plate.
The aim of this investigation was to find the gasket material
that lead to the best performance with low contact resistance
and clamping torque. Four different materials were consid-
ered, Gore Tex GR, PTFE, NBR and EPDM using the assembly 2
as cell test. Typical electrochemical characterization such as
I-V curves and short stability tests were performed. Fig. 5
shows the maximum current density that was obtained at
0.6 V and the measured cell resistance at the corresponding
torque.
Resistance measurement showed that the PTFE assembly
had the lowest resistance and consequently the best average
current density. Similar behaviour was observed in Fig. 6 that
reports I-V curves, in which PTFE and NBR assembly achieved
the best performance.
In conclusion, PTFE and NBR gave similar performance in
terms of short stability test and I-V curves, although NBR
required a higher torque (12 Nm) in respect to the PTFE (9 Nm).
Therefore the latter was selected for the full stack assembly.
3.3. Stack assembly procedure
The full stack size was assembled by hand, using a specific
fixture to minimize component misalignments. Fig. 7a) shows
Fig. 9 – Preliminary tests. Run1: start-up, Ru
the initial phase of the assembling procedure, where six
alignment rods permitted the operator to correctly stack 428
layers that composed the full unit. Once all components were
stacked, the first 8 tightening roads were placed. At this stage
a pre-assembly torque of 5 Nm was applied to fasten the stack
and remove the 6 alignment rods from the assembly bench.
Finally an intermediate clamping torque of 7 Nm was applied
after the remaining six tie rods were inserted. The entire
assembly process lasted for 3 hours.
The assembled unit was finally clamped at 9 Nm Fig. 7b).
After the fuel cell stack was assembled, the clamping plate
electrical insulation and the internal resistance were checked
and leak tests were performed.
3.4. Preliminary stack performance
The 70 cells size stack was connected to the above described
test bench. After the setting of the reactant flows, humidifi-
cation and cooling conditions, in order to match the design
operative conditions, the achieved temperatures were 10 �C
less than those aimed at. Nevertheless, the stack operated
stably at 60 �C ever showing a continuous increase in
performance.
Fig. 8 is a picture of the stack under test, where on the right
side the electronic load and the DAQ interface are visible,
whereas on the left, the power unit connected to the piping
system for the reactants distribution and humidification
section is observable.
As shown in Fig. 9 a conditioning phase was performed
increasing the current by step of 10A until it reached 160A,
with a single cell potential of 0.5 V (Run1). Run 2 permitted the
power of 6.2kW to be reached with a total voltage of 36 V.
During this run the performance of the stack increased
because higher currents could be reached whit a voltage
almost constant. Fig. 10 shows single cell voltage distribution
for the stack at a current density of 800 mA/cm2. The
average cell voltage was 510 mV with a standard deviation of
15 mV. The stack performance was below than the expected
(0,6 V @ 800 mA/cm2). This was due to a too low level of
humidification.
n2 current increase until 6.2kW @170A.
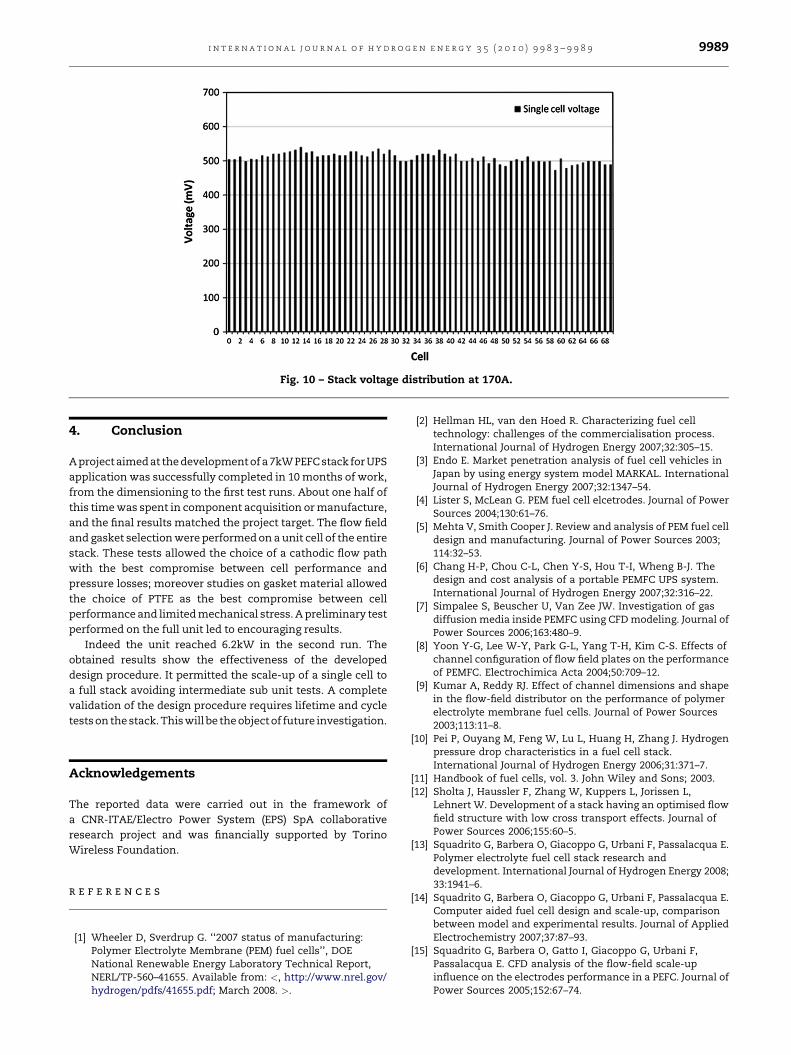
Fig. 10 – Stack voltage distribution at 170A.
i n t e r n a t i o n a l j o u r n a l o f h y d r o g e n e n e r g y 3 5 ( 2 0 1 0 ) 9 9 8 3 – 9 9 8 9 9989
4. Conclusion
A project aimed at the development of a 7kW PEFC stack for UPS
application was successfully completed in 10 months of work,
from the dimensioning to the first test runs. About one half of
this time was spent in component acquisition or manufacture,
and the final results matched the project target. The flow field
and gasket selection were performed on a unit cell of the entire
stack. These tests allowed the choice of a cathodic flow path
with the best compromise between cell performance and
pressure losses; moreover studies on gasket material allowed
the choice of PTFE as the best compromise between cell
performance and limited mechanical stress. A preliminary test
performed on the full unit led to encouraging results.
Indeed the unit reached 6.2kW in the second run. The
obtained results show the effectiveness of the developed
design procedure. It permitted the scale-up of a single cell to
a full stack avoiding intermediate sub unit tests. A complete
validation of the design procedure requires lifetime and cycle
tests on the stack. This will be the object of future investigation.
Acknowledgements
The reported data were carried out in the framework of
a CNR-ITAE/Electro Power System (EPS) SpA collaborative
research project and was financially supported by Torino
Wireless Foundation.
r e f e r e n c e s
[1] Wheeler D, Sverdrup G. ‘‘2007 status of manufacturing:Polymer Electrolyte Membrane (PEM) fuel cells’’, DOENational Renewable Energy Laboratory Technical Report,NERL/TP-560–41655. Available from: <, http://www.nrel.gov/hydrogen/pdfs/41655.pdf; March 2008. >.
[2] Hellman HL, van den Hoed R. Characterizing fuel celltechnology: challenges of the commercialisation process.International Journal of Hydrogen Energy 2007;32:305–15.
[3] Endo E. Market penetration analysis of fuel cell vehicles inJapan by using energy system model MARKAL. InternationalJournal of Hydrogen Energy 2007;32:1347–54.
[4] Lister S, McLean G. PEM fuel cell elcetrodes. Journal of PowerSources 2004;130:61–76.
[5] Mehta V, Smith Cooper J. Review and analysis of PEM fuel celldesign and manufacturing. Journal of Power Sources 2003;114:32–53.
[6] Chang H-P, Chou C-L, Chen Y-S, Hou T-I, Wheng B-J. Thedesign and cost analysis of a portable PEMFC UPS system.International Journal of Hydrogen Energy 2007;32:316–22.
[7] Simpalee S, Beuscher U, Van Zee JW. Investigation of gasdiffusion media inside PEMFC using CFD modeling. Journal ofPower Sources 2006;163:480–9.
[8] Yoon Y-G, Lee W-Y, Park G-L, Yang T-H, Kim C-S. Effects ofchannel configuration of flow field plates on the performanceof PEMFC. Electrochimica Acta 2004;50:709–12.
[9] Kumar A, Reddy RJ. Effect of channel dimensions and shapein the flow-field distributor on the performance of polymerelectrolyte membrane fuel cells. Journal of Power Sources2003;113:11–8.
[10] Pei P, Ouyang M, Feng W, Lu L, Huang H, Zhang J. Hydrogenpressure drop characteristics in a fuel cell stack.International Journal of Hydrogen Energy 2006;31:371–7.
[11] Handbook of fuel cells, vol. 3. John Wiley and Sons; 2003.[12] Sholta J, Haussler F, Zhang W, Kuppers L, Jorissen L,
Lehnert W. Development of a stack having an optimised flowfield structure with low cross transport effects. Journal ofPower Sources 2006;155:60–5.
[13] Squadrito G, Barbera O, Giacoppo G, Urbani F, Passalacqua E.Polymer electrolyte fuel cell stack research anddevelopment. International Journal of Hydrogen Energy 2008;33:1941–6.
[14] Squadrito G, Barbera O, Giacoppo G, Urbani F, Passalacqua E.Computer aided fuel cell design and scale-up, comparisonbetween model and experimental results. Journal of AppliedElectrochemistry 2007;37:87–93.
[15] Squadrito G, Barbera O, Gatto I, Giacoppo G, Urbani F,Passalacqua E. CFD analysis of the flow-field scale-upinfluence on the electrodes performance in a PEFC. Journal ofPower Sources 2005;152:67–74.