Embed Size (px)
Citation preview

DESIGN AND DEVELOPMENT OF AN ELECTROSTATIC SEPARATOR FOR WASTE SEGREGATION
LAI KOON CHUN
DOCTOR OF PHILOSOPHY (ENGINEERING)
FACULTY OF ENGINEERING AND GREEN
TECHNOLOGY UNIVERSITI TUNKU ABDUL RAHMAN
APRIL 2015

DESIGN AND DEVELOPMENT OF AN ELECTROSTATIC
SEPARATOR FOR WASTE SEGREGATION
By
LAI KOON CHUN
A thesis submitted to the Department of Electronic Engineering,
Faculty of Engineering and Green Technology,
Universiti Tunku Abdul Rahman,
in partial fulfillment of the requirements for the degree of
Doctor of Philosophy (Engineering)
April 2015

ii
ABSTRACT
DESIGN AND DEVELOPMENT OF AN ELECTROSTATIC
SEPARATOR FOR WASTE SEGREGATION
Lai Koon Chun
Household solid waste is commonly disposed of in landfills, generating
hazardous by-products such as leachate and methane gas from its organic
contents. Thus, organics in landfills which consist mainly of food matter
should be reduced. In this study, an electrostatic separator was designed and
developed to segregate the organic food waste from waste mixtures. Principles
of the electrostatic separation were discussed by referring to force models.
Besides, the separation process of food waste was characterised with respect to
both system and noise factors. The hard-to-control noise factors, i.e. size and
moisture level of the feeding particles were then identified by employing a
robust design based on Taguchi's method. Results revealed that the noise
factors are key factors that should be properly selected so as to avoid
undesirable sensitivity and variations of the separation process. The evaluation
results confirmed that the system factors, i.e. rotation speed, electrical
potential and electrodes interval are the most significant factors for the
separation process. A statistical analysis with central composite design was
conducted to analyse and model the performance of separation. Individual and
interactive effects of independent factors on separation performance were
assessed in terms of the recovery efficiency and purity of food waste matter.
iii
For the system considered, the optimal operational conditions were deduced to
be 60 rpm rotational speed, 30 kV applied voltage and 54 mm electrodes
interval on particles with 4.0 mm size and 20 % water content. Under these
conditions, food waste separation efficiency of 84.20% and purity of 93.00%
were experimentally achieved. Separation efficiency and purity of non-food
waste were respectively 88.70% and 98.50% under the same operational
condition. These results fitted well with the predicted model. Results in this
study concluded that the electrostatic separation could be an effective pre-
treatment alternative in dealing with leachate and methane problems caused by
landfilled organic wastes.

iv
ACKNOWLEDGEMENTS
Acknowledgements are due to my supervisors, Associate Professor Dr. Lim
Soo King and Dr. Teh Peh Chiong for their attention and support throughout
this study. I am particularly grateful to Assoc. Prof. Dr. Lim, without whose
advice this study would be harder to understand and appreciate. Thanks are
also due to Dr. Teh, whose encouragement ensured the completion of the study.
Thanks are due to my employer, Universiti Tunku Abdul Rahman for funding
the project. My sincere thanks to the Dean of Faculty of Engineering and
Green Technology, Universiti Tunku Abdul Rahman for being supportive and
understanding with the difficulties in working and studying at the same time
throughout all these years.
I also would like to dedicate this thesis to my parents and colleagues. Many
thanks are due to Professor Andrew Ragai Henry Rigit for his encouragement
towards the end of the project, Dr. KH Yeap for the proofreading, Mr. Peter
Chai and Mr. Michael Lee for their assistances and advices in fabricating and
setting up the separator, Mr. Jiyuan Lee with the high voltage power source,
and friends who have helped me in other ways especially Wymen and
Christine. Last but not least, special thanks are due to my wife and my son,
who have been very co-operative and also my source of inspiration.

v
APPROVAL SHEET
This dissertation/thesis entitled “DESIGN AND DEVELOPMENT OF AN
ELECTROSTATIC SEPARATOR FOR WASTE SEGREGATION” was
prepared by LAI KOON CHUN and submitted as partial fulfillment of the
requirements for the degree of Doctor of Philosophy (Engineering) at
Universiti Tunku Abdul Rahman.
Approved by:
___________________________
(ASSOC. PROF. DR. LIM SOO KING)
Date:
Associate Professor/Supervisor
Department of Electrical and Electronic Engineering
LKC Faculty of Engineering and Science
Universiti Tunku Abdul Rahman
___________________________
(DR. TEH PEH CHIONG)
Date:
Assistant Professor/Co-supervisor
Department of Electronic Engineering
Faculty of Engineering and Green Technology
Universiti Tunku Abdul Rahman

vi
FACULTY OF ENGINEERING AND GREEN TECHNOLOGY
UNIVERSITI TUNKU ABDUL RAHMAN
Date: __________________
SUBMISSION OF FINAL YEAR PROJECT /DISSERTATION/THESIS
It is hereby certified that LAI KOON CHUN (ID No: 10AED04870) has
completed this final year project/ dissertation/ thesis* entitled “Design and
Development of an Electrostatic Separator for Waste Segregation” under the
supervision of Assoc. Prof. Dr. Lim Soo King (Supervisor) from the Department
of Electrical and Electronic Engineering, LKC Faculty of Engineering and
Science , and Assist. Prof. Dr. Teh Peh Chiong (Co-Supervisor) from the
Department of Electronic Engineering, Faculty of Engineering and Green
Technology.
I understand that University will upload softcopy of my final year project /
dissertation/ thesis* in pdf format into UTAR Institutional Repository, which may
be made accessible to UTAR community and public.
Yours truly,
____________________
(LAI KOON CHUN)
*Delete whichever not applicable

vii
DECLARATION
I hereby declare that the dissertation is based on my original work except for
quotations and citations which have been duly acknowledged. I also declare
that it has not been previously or concurrently submitted for any other degree
at UTAR or other institutions.
Name LAI KOON CHUN N
Date ____________________________
viii
TABLE OF CONTENTS
Page
ABSTRACT ii
ACKNOWLEDGEMENT iv
APPROVAL SHEET v
SUBMISSION SHEET vi
DECLARATION vii
TABLE OF CONTENT viii
LIST OF FIGURES x
LIST OF TABLES xiii
LIST OF NOMENCLATURES xv
LIST OF ABBREVIATIONS xviii
CHAPTER
1.0 INTRODUCTION 1
1.1 Research Background 1
1.2 Problem Statements 4
1.3 Objectives of the Thesis 6
1.4 Outline of the Thesis 6
2.0 LITERATURE REVIEW 8
2.1 Introduction 8
2.2 Food Waste Overview and Treatment 8
2.3 Fundamental of Electrical Discharges 11
2.3.1 Dark discharges 12
2.3.1.1 Corona discharge 14
2.3.1.2 Spark discharge 16
2.3.2 Glow discharges 16
2.3.3 Arc discharge 18
2.4 Electrostatic Separator 19
2.4.1 Typical separation techniques 19
2.4.2 Applications and design consideration 24
2.5 Taguchi’s Method 25
2.5.1 Array design 27
2.5.2 Signal-to-noise ratio 28
2.6 Response Surface Methodology 29
2.6.1 Operational design 30
2.6.2 Analysis of variance 30
2.7 Force Model 33
2.7.1 Food waste 35
2.7.2 Non-food waste 38
2.8 Summary 40

ix
3.0 MATERIALS AND METHODS 44
3.1 Introduction 44
3.2 Waste Granule Preparation 45
3.3 Electrostatic Separator Design and Setup 47
3.3.1 Test rig 48
3.3.2 The separator design 50
3.4 Analytical Procedures 53
3.4.1 Efficiency and purity determination for
OVAT evaluations
54
3.5 Robust Design with Taguchi’s Method 55
3.6 Separation Process Optimisation using Response
Surface Methodology
59
3.7 Summary 60
4.0 RESULTS AND DISCUSSION 62
4.1 Characterisation of Recovery Efficiency 62
4.1.1 Effect of applied voltage 62
4.1.2 Effect of roller rotation speed 66
4.1.3 Effect of angular position of electrodes 68
4.1.4 Effect of mixture composition 72
4.1.5 Summary 74
4.2 Robust Design 75
4.2.1 Experimental results 75
4.2.2 SNR analysis 78
4.2.3 Summary 80
4.3 Optimisation and Modelling 81
4.3.1 Operational process design analysis and
optimisation
85
4.3.2 Surface plot analysis 95
4.3.3 Model optimisation and validation 101
4.3.4 Summary 102
5.0 CONCLUSION AND FURTHER WORK 105
5.1 Introduction 105
5.2 Conclusion 105
5.3 Further Work 107
LIST OF REFERENCES 108
LIST OF PUBLICATIONS 118

x
LIST OF FIGURES
Figures
1.1
Food waste in different regions of the world
Page
1
1.2 Solid waste composition (wt %) in Malaysia
3
2.1 The voltage-current characteristic between parallel
plate electrodes in a low pressure environment
12
2.2 Type of corona discharges (a) passive corona (b)
active corona
15
2.3 Typical electrostatic separation techniques (a)
triboelectric (b) induction (c) corona charging
20
2.4 Cyclone electrostatic separator
22
2.5 Induction type electrostatic separator
23
2.6 Corona charging type electrostatic separator
23
2.7 General model of control system
26
2.8 Forces act on particles (magnitude not according
to scale)
33
2.9 Forces exerted on food particles in (a) feeding, (b)
ionizing and (c) detaching stages
36
2.10 Forces exerted on non-food particles in (a)
feeding, (b) ionizing and (c) detaching stages
38
3.1 Flowchart of the proposed method
45
3.2 Different conductivities of particles (a) food, (b)
plastic and (c) glass
47
3.3 Diagram of electrostatic separator
48
3.4 Photograph of the separator
51
3.5 Design schematic of the separator
51
3.6 Inner and outer arrays by Taguchi design
58
4.1 Effect of applied voltage on food waste recovery
and purity (rotation speed = 70 rpm; feed content
63

xi
FW:NF = 40:60)
4.2 Effect of applied voltage on mass of recovered
food waste and middling (rotation speed = 70 rpm;
feed content FW:NF = 40:60)
64
4.3 Effect of applied voltage on purity and recovered
mass of non-food waste (rotation speed = 70 rpm;
feed content FW:NF = 40:60)
65
4.4 Effect of roller rotation speed on FW separation
efficiency (feed content FW:NF = 40:60)
66
4.5 Effect of roller rotation speed on middling (feed
content FW:NF = 40:60)
67
4.6 Effect of electrodes gap on separation efficiency
(rotation speed = 70 rpm; feed content FW:NF =
40:60)
69
4.7 Effect of electrodes gap on middling (rotation
speed = 70 rpm; feed content FW:NF = 40:60)
70
4.8 Mass and purity with different electrodes gap
(rotation speed = 70 rpm; feed content FW:NF =
40:60, applied voltage = 25 kV)
71
4.9 Effect of mixing ratios on separation efficiency
and purity (rotation speed = 70 rpm; applied
voltage = 25 kV)
73
4.10 Effect of different mixing ratios (rotation speed =
70 rpm; applied voltage = 25 kV)
74
4.11 Effect of factors on SNR for maximal food waste
recovery
79
4.12 Effect of factors on SNR for minimal middling
product
80
4.13 Pareto charts for (a) FW separation efficiency, (b)
middling and (c) NF separation efficiency
83
4.14 Predicted values versus actual values (a) FW
separation efficiency (b) NF separation efficiency
94
4.15 Predicted values versus actual values (a) FW
separation purity (b) NF separation purity
95

xii
4.16 Surface plots for combined effects of two
independent factors on FW separation efficiency.
(a) Potential level and rotation speed (electrodes
gap = 65 mm), (b) Potential level and electrodes
gap (rotation speed = 75 rpm) and (c) Rotation
speed and electrodes gap (potential level = 25 kV)
99
4.17 Surface plots for combined effects of two
independent factors on NF separation efficiency
(a) Potential level and rotation speed (electrodes
gap = 65 mm); (b) Potential level and electrodes
gap (rotation speed = 75 rpm); (c) Rotation speed
and electrodes gap (potential level = 25 kV)
100
4.18 Figure 4.18: Surface plots for combined effects of
two independent factors on FW separation purity
(a) Potential level and rotation speed (electrodes
gap = 65 mm); (b) Potential level and electrodes
gap (rotation speed = 75 rpm); (c) Rotation speed
and electrodes gap (potential level = 25 kV)
101
4.19 Figure 4.19: Surface plots for combined effects of
two independent factors on NF separation purity
(a) Potential level and rotation speed (electrodes
gap = 65 mm); (b) Potential level and electrodes
gap (rotation speed = 75 rpm); (c) Rotation speed
and electrodes gap (potential level = 25 kV)
102

xiii
LIST OF TABLES
Table
2.1
Triboelectric series
Page
21
2.2 L-9 orthogonal array design
27
2.3
Summary of review on development of waste
separator
42
2.4
Summary of review on design consideration 43
3.1 Typical properties of test samples
46
3.2 System parameters and their range
52
3.3 Factors and their levels
57
3.4 L-9 orthogonal array and the factors
58
4.1 Corona electrode angle and corresponding
electrodes gap
69
4.2 Mixture with different mixing ratios
72
4.3 Experimental response and the corresponding SNR
76
4.4 Percentage impact of different factors on food
waste and middling
77
4.5 Screening with PB factorial design
82
4.6 ANOVA table for FW separation efficiency in PB
design
84
4.7 ANOVA table for middling product in PB design
84
4.8 ANOVA table for NF separation efficiency in PB
design
84
4.9 Experimental levels of independent process factors
86
4.10 CCD for various experimental conditions
87
4.11 ANOVA results for quadratic model of S1
89
4.12 ANOVA results for quadratic model of S2
90

xiv
4.13 ANOVA results for quadratic model of P1
91
4.14 ANOVA results for quadratic model of P2
92
4.15 Comparison results of observation and prediction
101

xv
LIST OF NOMENCLATURES
Notation Description Unit
A surface area
mm2
B Pareto percentage
%
CAD Air drag coefficient
-
d Data dispersion
-
d1 Corona electrode distance from roller
mm
d2 Electrostatic electrode distance from roller
mm
D Particle size
mm
E Electric field strength
Vm-1
Fad Air drag force
N
Fct Centrifugal force
N
Fe Electrostatic force
N
Fg Gravity force
N
Fi Image force
N
FW0
Mass of initial food waste in feeder g
GE Electrodes gap
mm
k Number of factor
-
K Constant
-
m Mass
g
mFW Mass in food waste tank
g
m’FW Mass of food waste in food waste tank
g
mNF Mass in non-food tank
g
m’NF Mass of non-food in non-food tank
g

xvi
n Number
-
N Rotation speed
min-1
NF0
Mass of initial non-food in feeder g
PFW Separation purity of food waste
%
PNF Separation purity of non-food
%
Q Particle charge
C
R Radius of roller
mm
SFW Separation efficiency of food waste
%
SNF Separation efficiency of non-food
%
t Thickness
mm
U Supplied voltage
V
v Number of level
-
vr Relative velocity
ms-1
WC Water content
%
y Response
-
Greek
α1 Corona electrode angle
deg
α2 Electrostatic electrode angle
deg
β0 Constant coefficient
-
βi, Coefficient of linear
-
βii Coefficient of quadratic
-
βij Coefficient of interaction equations
-
ε Dielectric constant
Fm-1
σ Electrical conductivity
Sm-1
ρ Density kgm-3

xvii
ρc Surface charge density
kgm-3
ρr Resistivity
Ωm
ω Angular velocity rads-1

xviii
LIST OF ABBREVIATIONS
Notation Description
ANOVA Analysis of variance
CCD Central composite design
DC Direct current
ESD Electrostatic discharge
FAO Food and Agriculture Organization
FSC Food supply chain
FW Food waste
NF Non-food waste
NIMBY Not In My Back Yard
NSP National Strategic Plan
OA Orthogonal array
OVAT One Variable At Time
PB Plackett-Burman
PET Polyethylene terephthalate
PS Polystyrene
PTFE Polytetrafluoroethylene
PVC Polyvinyl chloride
RH Relative humidity
RSM Response surface methodology
SNR Signal-to-noise ratio
SS Sum of squares

CHAPTER ONE
INTRODUCTION
1.1 Research Background
Waste of food appears as a global dilemma in many countries. A study
from Food and Agriculture Organization of the United Nations (FAO) reveals
that 1.3 billion tonnes of food are wasted every year (FAOSTAT, 2012). Both
the industrialised world and developing countries are suffered from this global
threat (Gustavsson, 2010). Food loss and waste in different regions of the
world is shown in Figure 1.1. Solid waste generation increases due to rural-
urban migration, income per-capita increment and high demand of quality life
from the citizens (Manaf, Samah and Zukki, 2009; Periathamby, Hamid and
Khidzir, 2009). Rapid urbanisation and industrialisation in Malaysia make this
country on a par as developed countries, which lead to increment of waste
generation (Chua, Sahid and Leong, 2011).
Figure 1.1: Food waste in different regions of the world (Gustavsson, 2010)

2
The solid waste generated per day in Malaysia has reached 17000
tonnes according to the National Solid Waste Management Department
(2013). It is estimated that the daily wastes will increase to 30000 tonnes in
2020. The National Strategic Plan (NSP) for Solid Waste Management in
Malaysia has introduced policy on waste management to prioritise waste
reduction through processes of reducing, reusing and recycling since 2001.
However, the policy does not lead to a positive result due to low awareness of
citizens (Meen-Chee and Narayanan, 2006). Most food waste is disposed at
the disposal site due to the lack of food waste recovery facilities, poor waste
management in this country and NIMBY (Not In My Back Yard) syndrome
(Saeed, Hassan and Mujeebu, 2009; Badgie et al., 2011). To date, source
segregation of food waste is not commonly practised in Malaysia (Samsudin
and Don, 2013).
In general, solid waste is disposed as landfills. Landfilling is the most
general disposal method as compared to other approaches such as incineration
and composting. This is highly attributed to its simplest and cheapest disposal
procedures (Renou et al., 2008; Magdalena and Dana, 2014). Approximately
95% of collected municipal wastes are landfilled in Malaysia (Bashir et al.,
2010). Although this could be the most practical waste treatment solution,
landfilling does not seem to be the most rational approach to manage waste.
Despite the inert solids, landfilling of food waste generates two main kinds of
by-products, namely gaseous emission and fluidic leachate which can cause
high contamination (Christensen et al., 2001; Desideri et al., 2003; Jaffrin et
al., 2003). Landfill leachate is generally defined as a complex liquid

3
containing large amounts of organic (mainly food) and inorganic matter
(Chian and De Walle, 1976). Landfill leachate becomes a hazardous source to
groundwater aquifer and surrounding water sources for its high concentration
of pollutants (Kjeldsen et al. 2002). Rainfall is the primary cause of leachate
generation, followed by the biological decomposition activities taking place in
the landfill. Besides, landfill gas such as methane and carbon dioxide due to
the decomposition of biodegradable organic matter is a great source of
pollution. It would pollute the air and cause public nuisance such as global
warming and climate change (Tagaris et al., 2003).
Landfills in Malaysia are generally crowded and it is impractical to
find new locations (Kathirvale et al., 2004). Therefore, proper food waste
management is crucial in conserving a clean environment. It is not an
uncommon practice to sort and reuse the waste materials. As shown in Figure
1.2, a high amount of organic material, particularly food waste (FW) (~45%)
can be found in the municipal solid waste in Malaysia, followed by plastic
(~24%), paper (~7%), metal (~6%), glass (~3%) and others (~15%).
Figure 1.2: Solid waste composition (wt %) in Malaysia (National Solid Waste
Management Department, 2013)

4
At present, studies of the recovery of plastic, glass and metal from
solid waste have been widely carried out. However, to date, there is a lack of
progress made for the FW recovery (Lin et al., 2013). The FW residues are in
general turned into landfills or first generation recycling practices such as
composting and animal feed (Kofoworola, 2007). Lately, researchers have
placed high emphasis in food waste. This is because the high organic content
in FW has the potential of being turned into highly added value end products,
such as ethanol or a source of biofuel (Van Wyk, 2001; Le Man, Behera and
Park, 2010; Moukamnerd, Kawahara and Katakur, 2013). Bioethanol is one of
the most promising alternative energy sources to diminish the dependence on
fossil fuel (McMilan, 1997). It can be produced by the fermentation of sugar-
rich crops (e.g. sugar cane) and food wastes.
1.2 Problem Statements
Landfills consume large land area and it may cause undesired
pollutions. Proper capturing and processing of landfills will turn the biogases
emitted from landfills into renewable energy (Holm-Nielsen, Al Seadi and
Oleskowicz-Popiel, 2009). The recovery of biogas from landfills can be
profitable (Whalen, Reeburgh and Sandbeck, 1990). Incineration appears to be
the lowest cost method, but the direct heavy metal emissions generated from
the incineration process contribute significantly to human toxicity and
environmental burdens (Tammemagi and Tammemagi, 1999; Xu, Chen and
Hong, 2014). Hence, food waste contents from municipal solid waste are to be
segregated in an environmental friendly way for the sake of independent

5
biogas production and landfill reduction. Source segregation is crucial for
enabling the food waste to be reused and thus protecting the environment.
Thus, the main aim of this study is to investigate the feasibility of an
electrostatic separator in segregating non-food particles from the recoverable
food waste.
Electrostatic separator is capable of separating particles based on the
conductivities of the constituent components. It is widely used to sort out
particles with high conductivities from those with relatively low
conductivities. A number of studies have shown the capability of the separator
in treating the electronic waste (Mohabuth and Miles, 2005; Yamane et al.,
2011). Nevertheless, to the best of our knowledge, there is still a lack of
research of electrostatic separator on the recovery of food waste being
documented.
Food waste segregation with electrostatic separation process reduces
the water and air pollutions and minimises the land usage for landfilling.
Besides, the incineration of these landfill substances that are free from
inorganic matters produces less residue and toxic gases. It contributes to less
amount of landfill leachate with rare existence of organic matters in landfills.
In addition to the environmental protection, the proposed segregation process
indirectly enables the economical growth from biogas and potential biomass
energy generation.

6
1.3 Objectives of the Thesis
Electrostatic separation of food waste still lacks of basic research, and
it is crucial to carry out this study so as to increase the efficiency of the
process. This project seeks to contribute to the fundamental knowledge that is
required for future utilisation of practical sorting system. Therefore, the
project is divided into the following steps:
i) developing an environmentally friendly way for waste segregation,
ii) characterising the performance of an electrostatic separator in terms of
the separation efficiency and purity,
iii) designing a robust electrostatic separator which minimises random
error, and
iv) modelling the separation process by determining the significant factors
and the optimal operational conditions.
1.4 Outline of the Thesis
This chapter is the first of five chapters, which introduces the research
background, problems and purposes of this study. Chapter 2 reports the
general design of the electrostatic separator and the literature reviews. The
electrostatic theory, various types of gas discharges, the separator applications
and the descriptions of some related formulae are also described. The material
and method required to run the experiment are qualitatively narrated in
Chapter 3. The specifications of experimental equipment and the design
parameters are elucidated using Taguchi’s method. The mechanisms of the

7
corona formation process are introduced and the impact of the discharge of
corona on various matters is described in this chapter.
Chapter 4 evaluates and discusses the electrical performances of the
electrostatic separator with respect to its recovery efficiency and purity. The
performance varies for different experimental designs. This phenomenon is
thus studied in the same chapter by examining a number of potential
influencing parameters. The optimal operational conditions are thus
summarised by employing the optimisation method. Finally, Chapter 5 is
devoted to conclusions and recommendations. The overall findings of this
study are summarised and some recommendations are suggested for future
improvement work.

8
CHAPTER TWO
LITERATURE REVIEW
2.1 Introduction
This review is intended to provide an up-to-date account of research on
the electrostatic separation of wastes, with particular emphasis placed on the
corona charging technique. The fundamentals of electrostatic such as
discharge phenomena are introduced. In addition, information on typical
designs and applications of electrostatic separator are reviewed. The former is
becoming more important because of the knowledge required to predict
charged granular waste dynamics. The design and construction of a robust
separation system using Taguchi’s method is discussed. Finally, the
information essential for response surface methodology is briefly reviewed, in
term of the selection of the design of the experiment and its applications.
2.2 Food Waste Overview and Treatment
Throughout the food supply chain (FSC), food loss can occur during
the production stage and post-harvesting processes. Food waste is defined as
the food loss at the retail and final consumption stages of the food chain,
which relates to the behaviour of the retailers and consumers (Parfitt, Barthel
and Macnaughton, 2010). In the retail stage, the foods include vegetables and

9
fruits which will be provided to wet markets, grocers and supermarkets.
Before reaching the shelves, about 10-15% of them will be discarded for the
reasons of improper handling, e.g. insufficient cooling storage. A large portion
of crops is rejected before being distributed, due to the rigorous quality
standards on the size, shape and appearance (Stuart, 2009). Upon reaching the
consumption stage, wastage is once again generated from household,
restaurants, hospitality sector, prisons, cafes and so on. Vegetables and fruits
contribute the highest portion of food waste, if compared to cereal, roots and
tubers, oilseeds and pulses, meat, fish and seafood, and milk. The waste of
food does not only represent the waste of economic value, but also the waste
of the limited natural resources such as water, nutrients, land and energy.
Besides, the emission of greenhouse gases such as methane and carbon
dioxide, due to the waste of food, it can cause global warming (Weitz et al.,
2002).
Food waste in the consumption stage can be classified into two
categories, namely pre-consumer food waste and post-consumer food waste.
The pre-consumer waste gets its name for never being appeared in front of the
consumer. For instance, overcooked, expired, contamination and trim waste
contribute to this type of waste. Post-consumer waste, on the other hand, is
mainly caused by the lack of awareness from both caterers and guests. The
portion size and the behaviour of guests in the self-service buffet would lead
to the waste of food (Garnett, 2006). Some authorities have started to put
regulations on food waste management, before the food waste is sent for
incineration or landfill. In Ireland, the Environmental Protection Agency and

10
the Clean Technology Centre published Waste Management (Food Waste)
regulations 2009 to increase the recovery amount of food waste (Galway
Country Council, 2013). Food waste from household must be source
segregated, before being collected by an authorised waste collector. Source
segregation refers to the waste segregation at source by the producers to avoid
specified waste from being contaminated or mixed with others. Nevertheless,
it strongly depends on the awareness of citizens and the continual enforcement
from the policy authorities.
Pre-treatment of waste has recently received momentous interests. To
date, researchers have studied the pre-treatment of organic waste with a
number of processes. These include mechanical (Lindmark et al., 2012),
thermo-chemical (Vavouraki, Volioti and Kornaros, 2014) and enzymatic
(Taherzadeh and Karimi, 2008) treatments. However, very few studies were
conducted using the electrostatic technique. Although electrostatic separation
is not a common treatment for organic waste or food waste, it has received
considerable attention for metal segregation from electronic waste (Veit et al.,
2005).
Electrostatic separation provides an effective approach in recovering
the reusable matter from solid wastes. It has been widely employed in
applications involving dry separation process, e.g. to recover conductors from
non-conducting mixtures (Lawver and Dyrenforth, 1973). The separation
process sorts the charged bodies from the uncharged under an intensive
electric field. It serves as an environmentally friendly way for recycling and

11
reusing the resources without giving negative impact to the surrounding
(Kiewiet, Bergougnou and Brown, 1978).
2.3 Fundamental of Electrical Discharges
Upon energising by the high voltage electrical equipment, electrical
discharge through the gaseous medium, or known as gas discharge, can be
visible and audible. A gas discharge can be generated when the electrical
energy passes through gas medium. A considerable amount of electrical
charge should be created and stored. Studies show that gas discharges are
formed by neutral and partially ionised particles. The negative charged
particles (free electrons) drift in an opposite direction with the electric field.
Owing to the elastic collisions with the molecules, the speed of the electrons is
limited. When the field strength becomes larger and the collisions become
inelastic, the ionisation effect happens and leads to an avalanche of charged
particles. This process is known as gas discharging, where the electric field
strength is higher than the electric breakdown of ambient gas at about 3 MV
per meter. The constitution of electric current depends on the number of
charges, the polarity and the speed with which they move. The interactions
between particles have made the gas discharge a complex system which
requires detailed investigations. Gas discharge phenomena can be classified
typically into three categories, namely dark discharges (e.g. Townsend
discharge), glow discharges and arc discharge. Various low pressure discharge
modes between the parallel flat electrodes are schematically shown in Figure
2.1.
12
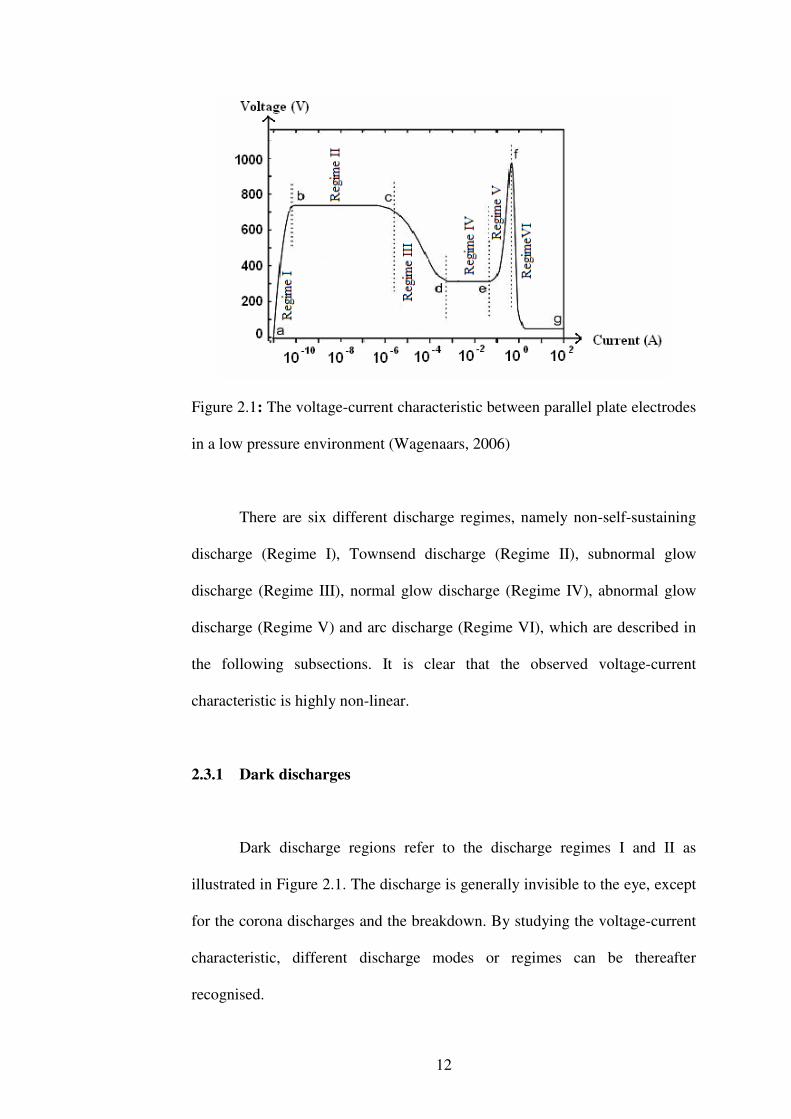
Figure 2.1: The voltage-current characteristic between parallel plate electrodes
in a low pressure environment (Wagenaars, 2006)
There are six different discharge regimes, namely non-self-sustaining
discharge (Regime I), Townsend discharge (Regime II), subnormal glow
discharge (Regime III), normal glow discharge (Regime IV), abnormal glow
discharge (Regime V) and arc discharge (Regime VI), which are described in
the following subsections. It is clear that the observed voltage-current
characteristic is highly non-linear.
2.3.1 Dark discharges
Dark discharge regions refer to the discharge regimes I and II as
illustrated in Figure 2.1. The discharge is generally invisible to the eye, except
for the corona discharges and the breakdown. By studying the voltage-current
characteristic, different discharge modes or regimes can be thereafter
recognised.

13
i) Regime I: Non-self-sustaining discharge
An extremely small current below 10−10
A can be measured when a
low voltage of 200 to 500 V passes through an electrode gap with a few
millimetres which containing gases such as oxygen and nitrogen. This is due
to the fact that the cosmic rays or nearby UV lamp that generates the electrons
in the gap. These few electrons produce a very small current and accelerate
towards the anode by the potential difference. The applied voltage is not
sufficient to ionise the atoms as observed in higher voltages. Therefore, it is
not self-sustaining since the discharge requires external sources for the
electrons generation. The discharge will cease when the electron source is
removed.
ii) Regime II: Townsend discharge
The Townsend discharge is also named as dark discharge. This is
because there is no substantial light emission from the discharge. Increasing in
the applied voltage causes a changeover from a non self-sustaining discharge
to a self-sustaining discharge. The electric field between the discharge gap
enhances with the increasing of voltage. Electrons in the discharge gap ionise
the neutral atoms and result in a multiplication of charged ions and electrons
within the gap. Due to the impact ionisation, new electrons at the surface of
the cathode experience a secondary emission into the gas. A sustainable
current through the discharge gap is thus produced. The required voltage for

14
transition from a non self-sustaining to a self-sustaining discharge is called the
breakdown voltage.
For Townsend discharge, the applied voltage of approximately 700 V
is slightly higher than the breakdown voltage with a large resistance and a low
current of 10-10
to 10-6
A. The space charge effect in the discharge gap is not
significant as there are a limited number of charged particles. As it can be seen
in Figures 2.1 (Regime II), the voltage-current curve for the Townsend
discharge is consistently constant. This is due to the fact that the avalanche
process takes its place in the gap. The increased voltage directs higher electron
multiplication and produces more secondary emission of electrons at the
cathode. The process results in a further multiplication of charges and
electrons in the gap. In other words, the current rises considerably with a small
increase in voltage.
2.3.1.1 Corona discharge
Corona discharge is a relatively weak luminous electrical discharge
which takes place at or near the atmospheric pressure. The corona is created
by a strong electric field using small needles or sharp edge on the electrode
(Chang et al., 1995). Corona discharge may be considered as a Townsend
discharge depending on field and potential distribution (Schütze et al., 1998).
This discharge which emits from the electrode appears as a faint blue-violet
filamentary discharge, differs from the applied field polarity and the
geometrical configuration of electrodes. The coronas can be positive or

15
negative, depending on the potential polarity of the electrode. For instance,
electrode with positive charge generates positive corona and vice versa.
Corona discharge has a relatively slower energy release compared with
other gas discharges. The discharge does not leave any definite traces, but
secondary effects such as wettability improvement of the directed material
surface. Corona discharge can exist in two ways, i.e. passive and active, as
illustrated in Figure 2.2. Passive corona in Figure 2.2 (a) refers to the
conducting needle electrode connected to ground and exposed to an electric
field by the sphere conductor. When the needle is moved towards the electric
field until the field strength reaches the breakdown of ambient air, corona
discharge is emitted in within the gap. On the other hand, the use of high
voltage power supply denotes the active corona as shown in Figure 2.2 (b).
The process is reversible to the passive corona, where the power supply
applies a high potential to the needle for producing corona discharge. Active
corona is widely used to charge objects electrostatically, such as powder
coating, electrostatic copying and separation applications.
Figure 2.2: Type of corona discharges (a) passive corona, (b) active corona

16
As the ion-emitting plasma of one polarity will accumulate in the inter
electrode space, the corona discharge is mostly limited by the space charge.
Consequently, the corona has a positive resistance characteristic that a higher
voltage is required with increasing current. As soon as the current in the
discharge is adequately raised, additional current-carrying species will be
produced and thus the spark discharge will be generated.
2.3.1.2 Spark discharge
Generally, if the source for a discharge is limited, the electrical
discharge tends to manifest itself into a rapid impulse type filament discharge
form known as spark. The existence of the spark discharge symbolises a
complex physical phenomenon that relies on plentiful of variables such as
pressure, electrode gap and electrode geometry. Spark can be formed when the
applied electric field strength is higher than the dielectric field strength of air.
This sporadically discharge redistributes charge and form regions of excess
charge, which may create a highly conductive path from the electrode to the
surrounding conductor. In electrostatic separation process, spark discharge is
considered an undesired phenomenon as it may bring damage to the
equipment and harm the operator.
2.3.2 Glow discharges
Discharges in regimes III, IV and V as illustrated by Figure 2.1 are
classified as glow discharges, owing to the generation of luminous glow. Glow

17
discharge occurs once the breakdown voltage is reached. The discharges emit
light due to the high enough electron energy of 1 to 5 eV and density, typically
of the order of 106 to 10
13 cm
-3, to generate excited gas atoms by collisions.
Glow discharge is widely applied in various applications which include
fluorescent lighting and plasma television.
i) Regime III: Subnormal glow discharge
Space charge effects are apparent in the discharge gap when the
voltage further increases from that of previous regime II. The space charge is
most likely positively due to the big mobility difference between the electrons
and ions (Chang et al., 1995). As the positive space charge accumulates in
front of the cathode, a cathode fall region is thus formed. Cathode fall, or
known as cathode dark space, refers to the relative dark region near the
cathode. The voltage drop in the cathode fall is almost equivalent to the
voltage difference across the electrodes. Typically, the electron multiplication
across the cathode fall enhances when the electron multiplication increases
under a higher electric field. This has resulted in a lower required voltage in
order to sustain the discharge. Hence, the voltage decreases with the
increasing current as shown in the voltage-current curve in Figures 2.1
(Regime III). This mode is not stable and easily changed to the glow discharge
mode.

18
ii) Regime IV: Normal glow discharge
In normal glow discharge mode, the minimum of sustaining voltage
can be attained as the development of the cathode fall is completed. As there is
a contact between the plasma with the cathode surface, the electrode current
density remains with the current change. In other words, the increased current
has no effect on the voltage change, but to spread the discharge over the
surfaces of the electrode. The glow discharge regime stops when the entire
electrode surfaces are covered by the discharge. The discharge voltage in this
regime is consistent over a large variation range of current (10-3
-10-1
A).
iii) Regime V: Abnormal glow discharge
The discharge covers entire electrodes in this mode. The cathode fall
increases with the increasing current and the voltage across the electrodes
ascends sharply. Consequently, the average ion energy increases with
enhancement of cathode current density. The ion bombarding the cathode
surface generates thermionic emission and turns the glow discharge into the
arc discharge.
2.3.3 Arc discharge
Arc discharge is the discharge regime VI shown in Figure 2.1. The
transition of glow into arc discharge is observable when the current is further
increased. An electric arc is a type of electric discharge which has the highest

19
current density, extending from an order of 0.1 to 1 A to a very large (10 kA)
upper limit. Arc discharge is commonly used for industrial applications such
as welding and plasma cutting. However, undesired arcing can bring harmful
damages to the power stations, electrical transmission systems and equipment.
2.4 Electrostatic Separator
Electrostatic discharge (ESD) is one of the electrical discharges. It
occurs when two electrically charged items contacting each other and
generates a flow of electricity. The charge is typically applied in the
electrostatic separator. Electrostatic separator sorts two items or substances
based on the differences in electrical characteristics such as friction charges
and surface resulting work function. This separation is a crucial manufacturing
process in the ore beneficiation industry to remove the impurities. In general,
the separation system does not only rely on electrostatic force, but also on the
gravitational and centrifugal forces. As the electrostatic force is inversely
proportional to the surface area, the separation works efficiently for the small
and light-weight substances such as thin sheet and short wires.
2.4.1 Typical separation techniques
Electrostatic separator typically sorts two different types of substances
(with different electrostatic characteristics) at once. Prior to the electrostatic
separation, the substances are typically charged by friction charge, induced
charge or corona charge before subjecting to the electrostatic and gravity

20
forces. Implementations of various charging methods are illustrated in Figure
2.3.
Figure 2.3: Typical electrostatic separation techniques (a) triboelectric (b)
induction (c) corona charging (Chang, Crowley and Kelly, 1995)
Triboelectric charging equipment as shown in Figure 2.3 (a) consists of
a vibration feeder, collection tanks and parallel plate electrodes connecting to
high voltage supply. The charging activity takes place in the vibrating feeder

21
and turning the substances into either positively charged or negatively
charged. The charging tendencies can be referred in the triboelectric series
Table 2.1. The positively charged substance tends to move toward the negative
electrode, whereas the negatively charged tends to move in an opposite
direction.
Table 2.1: Triboelectric series (Harper, 1967)
Human hands Positively charged
Glass
Nylon
Human hair
Wool
Aluminium
Food
Paper
Cotton Neutral
Steel
Wood
Hard rubber
Brass
Polyester
Polyethylene
PVC (Vinyl)
Teflon Negatively charged

22
This separation technique relies on the magnitude of supplied voltage
and the gravitational force. Thus, it is suitable for applications with large
gravity difference, such as removing impurities (ashes) from ore particles. In
addition, it can be combined with the cyclone type separator, as shown in
Figure 2.4, to provide better separation efficiency.
Figure 2.4: Cyclone electrostatic separator (Toraguchi and Haga, 1982)
Induction charging separator can be applied in the food processing
industry to remove the impurities such as hair, plastics and waste straw. The
food is placed on a vibrating conveyor belt under multiple high voltage
electrodes, as shown in Figure 2.5. The charged impurities are to be moved
toward the electrodes and carried away by a suction pump. This technique
ensures the foods are not in contact with the electrodes due to hygienic
purposes.

23
Figure 2.5: Induction type electrostatic separator (Masui, 1982)
In the waste processing industry, the corona charging separator can be
used to recover copper from used electrical wire, or to separate scrap papers
from the paper-plastic mixture. This technique is free from pollution as it does
not involve burning or chemical reaction. As demonstrated in Figure 2.6, the
substances on the roller surface are subjected to an electric charge, ionised
from the needle corona electrode and eventually separated due to the
differences in conductivity and electrostatic properties.
Figure 2.6: Corona charging type electrostatic separator (Masui, 1982)

24
2.4.2 Applications and design consideration
Electrostatic separation has long been applied in the mining industry.
For instance, the ores with good conductivity such as iron and magnesium can
be separated from quartz and silica which have poorer conductivity. Back in
1982, Murata et al. (1982) has utilised the method to separate copper particles
ranging from 37 to 840 µm in diameter. The particles were put on an inclining
plate electrode under a non-uniform electric field. The results revealed that the
particles could be sorted to the collecting boxes, and the sorting efficiency
increases with increasing particle size difference as the forces exerted on the
smaller particle could be easily differentiated from that of larger particle.
In the past decade, Iuga et al. (2001) applied the technique in
processing granular wastes of chopped electrical wires to remove polyvinyl
chloride (PVC) wires insulation from the copper conductor. Moreover, they
utilised the electrostatic force for feldspar extraction from pegmatite which
contains quartz and muscovite mica. It was summarised that electrostatic
separation is a better way for mineral beneficiation techniques, as compared to
flotation method and magnetic sorting, especially for small granular sizes (i.e.
< 0.5 mm) (Iuga et al, 2004).
Recently, Ravishankar and Kolla (2009) stated that the separation
efficiency is not only affected by particle sizes, but also other factors such as
humidity and temperature. Inline with the arguments, several studies had been
made to analyse the different electrostatic separation processes. Elder et al.

25
(2003) concluded the separation efficiency of mineral sand relies on the
rotation speed, electrodes configuration, temperature of granule and other
parameters. Besides, Aman et al. (2004) identified that the supply potential
and electrode position to be the key factors for metal recovery. A study from
Calin et al. (2008) revealed that the different compositions may affect the
separation results in separating plastic mixtures. In short, electrostatic
separation is a multi-factorial process which requires simultaneous control of
both mechanical and electrical forces on the granular mixtures (Samuila et al.,
2005). Various parameters could affect the performance of the separation
process.
2.5 Taguchi’s Method
In order to make the process less sensitive to the effects of random
variability, one may classify various design factors into two groups, namely
system factor and random (or noise) factor. A robust design should be made to
reduce the variations of the process conditions caused by the random factors,
such as manufacturing variation and component deterioration. Robust design
refers to a proper experimental arrangement that makes the process insensitive
to the sources that are hard to control in practical conditions. This design,
implemented by using Taguchi’s method (1986), is a statistical technique in
enhancing the manufactured goods’ quality. It identifies the dominant process
parameters and determines the appropriate operational environment in which
an experiment is to be performed. Given a general model of control system as
shown in Figure 2.7, Taguchi’s method can be employed to:

26
(i) determine which factors are influential on the response output y
(ii) determine where to set the influential controllable system factor x so
that the variability in y is small
(iii) determine where to set the influential controllable x so that the effects
of the uncontrollable noise factor z are minimised
Figure 2.7: General model of control system.
Taguchi’s method has been applied in the industries and it has been
proven to be a critical success in controlling the quality of process
(Dascalescu, 2008). Basavarajappa et al. (2008), Davidson et al. (2008), Hsu
et al. (2009) and Mahapatra et al. (2008) have utilised Taguchi’s method in
analysing the impacts caused by various parameters such as speed of the
experimental tools. The interactions between the empirical factors and
responses were discussed. Chiang and Hsieh (2009), Comakli et al. (2009),
Keles (2009) and Lin et al. (2009) have employed the same approach in
process optimisation and performance evaluation. The aim was to identify the
optimal operational conditions. Taguchi’s experimental design, which is based
only on a minimum number of experiments, provides a reliable model for
criterion selection and decision making (Chou, Ho and Huang, 2009).
27
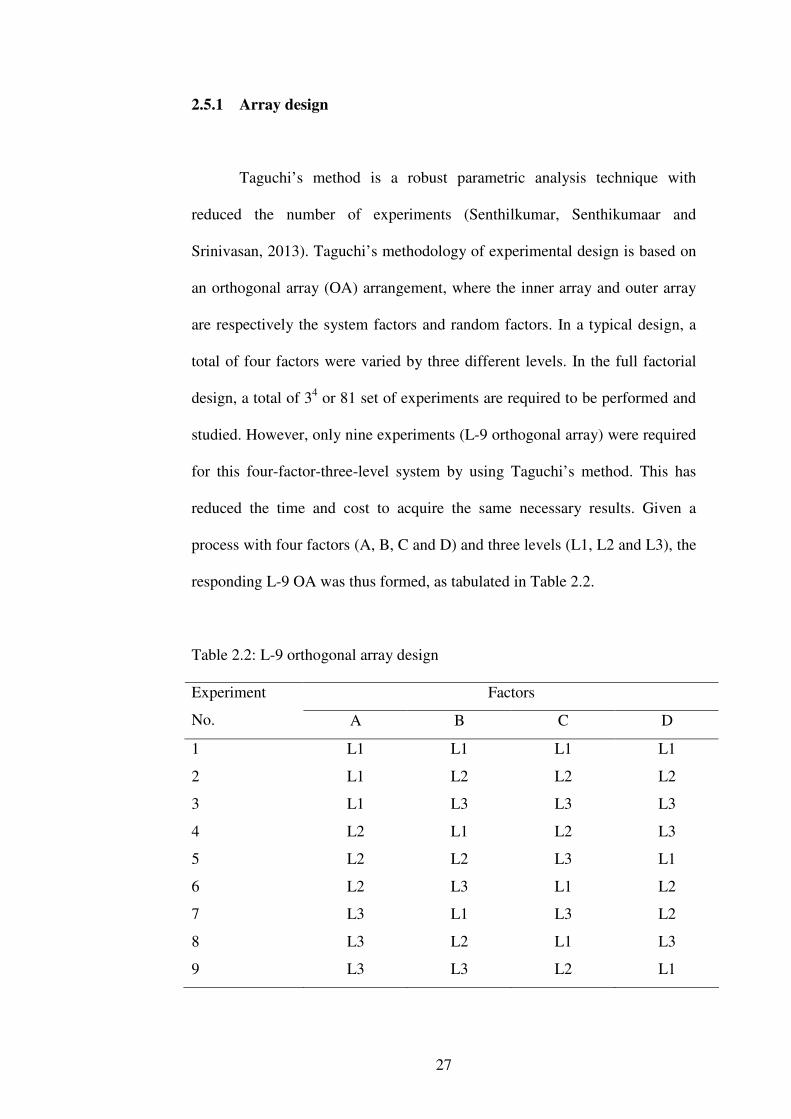
2.5.1 Array design
Taguchi’s method is a robust parametric analysis technique with
reduced the number of experiments (Senthilkumar, Senthikumaar and
Srinivasan, 2013). Taguchi’s methodology of experimental design is based on
an orthogonal array (OA) arrangement, where the inner array and outer array
are respectively the system factors and random factors. In a typical design, a
total of four factors were varied by three different levels. In the full factorial
design, a total of 34 or 81 set of experiments are required to be performed and
studied. However, only nine experiments (L-9 orthogonal array) were required
for this four-factor-three-level system by using Taguchi’s method. This has
reduced the time and cost to acquire the same necessary results. Given a
process with four factors (A, B, C and D) and three levels (L1, L2 and L3), the
responding L-9 OA was thus formed, as tabulated in Table 2.2.
Table 2.2: L-9 orthogonal array design
Factors Experiment
No. A B C D
1 L1 L1 L1 L1
2 L1 L2 L2 L2
3 L1 L3 L3 L3
4 L2 L1 L2 L3
5 L2 L2 L3 L1
6 L2 L3 L1 L2
7 L3 L1 L3 L2
8 L3 L2 L1 L3
9 L3 L3 L2 L1

28
The L-9 orthogonal array is equivalent to a 2-(v, k, 1) array, or a set of
(k-2) mutually Latin squares of order v, where v and k respectively denote the
number of levels and number of factors. In other words, the L-9 orthogonal
array in this study is a 2-(3, 4, 1) array, resulting in a 243 − fractional factorial
design. The first (indexing) column of the table is an array on v-set and other
columns appeared as square arrays of order k. The first square array is a
transpose array of the indexing column, whereas the resulting square is the
Latin squares of order v. Latin square is a v × v array in which each entry
occurring exactly once in each row and each column.
2.5.2 Signal-to-noise ratio
A signal-to-noise ratio (SNR) is used as the objective function to
determine the robustness. It relies on the orthogonal array output, which
specifies the effects of various factors on the response formation. There are
three different types of objective functions, namely nominal-is-best, larger-is-
better and smaller-is-better. Nominal-is-best type of objective function can be
used to determine the characteristics that are needed to be drawn as close as
possible to a nominal response value, which is shown in equation (2.1):
2
log10SNR
=
s
y (2.1)
where y is the mean of responses and s is the standard deviation. Larger-is-
better type of objective function identifies the characteristics for the response

29
to have its maximised value. Similarly, smaller-is-better type targets for the
minimised value of the response.
Larger-is-better type of objective function is defined as:
∑=
−=
n
iiyn 1 2
11log10SNR (2.2)
whereas smaller-is-better type of objective function is calculated by:
∑=
−=
n
iiy
n 1
21log10SNR (2.3)
where n is the number of sample and yi is the response collected in each
evaluation. The relative significance of the factors on the response can be
analysed by studying the percentage (%) impact that determined by:
( )( )∑ −
−=
2
2
SNRSNR
SNRSNR%impact (2.4)
where SNR is the mean value of SNR.
2.6 Response Surface Methodology
Response surface methodology (RSM) is an effective way to use with
multivariable system to determine the interactions among system factors and
to predict the response. It has been successfully employed to several
optimisation processes such as nickel removal (Aravind et al., 2013) and
wastewater denitrification (Srinu Naik and Pydi Setty, 2014).

30
2.6.1 Operational design
A number of factors can be analysed simultaneously with proper
design of experiments (Rezouga et al., 2009). Besides, the optimisation results
deduced from the statistical analysis reduce the computing effort and cost
(Vlad et al., 2014).
In order to identify the critical points in RSM, the response is
expressed as a quadratic model according to the following polynomial
function:
iep
jij
Xi
Xij
p
ii
Xii
p
ii
Xi
y +∑≤≤
+∑=
+∑=
+=11
210
ββββ (2.5)
where β0 is a constant coefficient, Xi, Xj are independent variables, βi, βii, βij
are the coefficients of linear, quadratic and interaction equations, and ei is the
error. Equation (2.5) can be rewritten as:
2333
2222
2111
...3322110
XXXp
Xp
XXXy ββββββββ ++++++++=
322331132112
2... XXXXXXp
Xpp
ββββ +++++
ep
Xp
Xpp
+−−
++11
... β (2.6)
2.6.2 Analysis of variance
Analysis of variance (ANOVA) was employed to assess the fitted
quality of model and statistical significance of regression coefficients.
ANOVA compares the change of variable levels and the variation due to
31
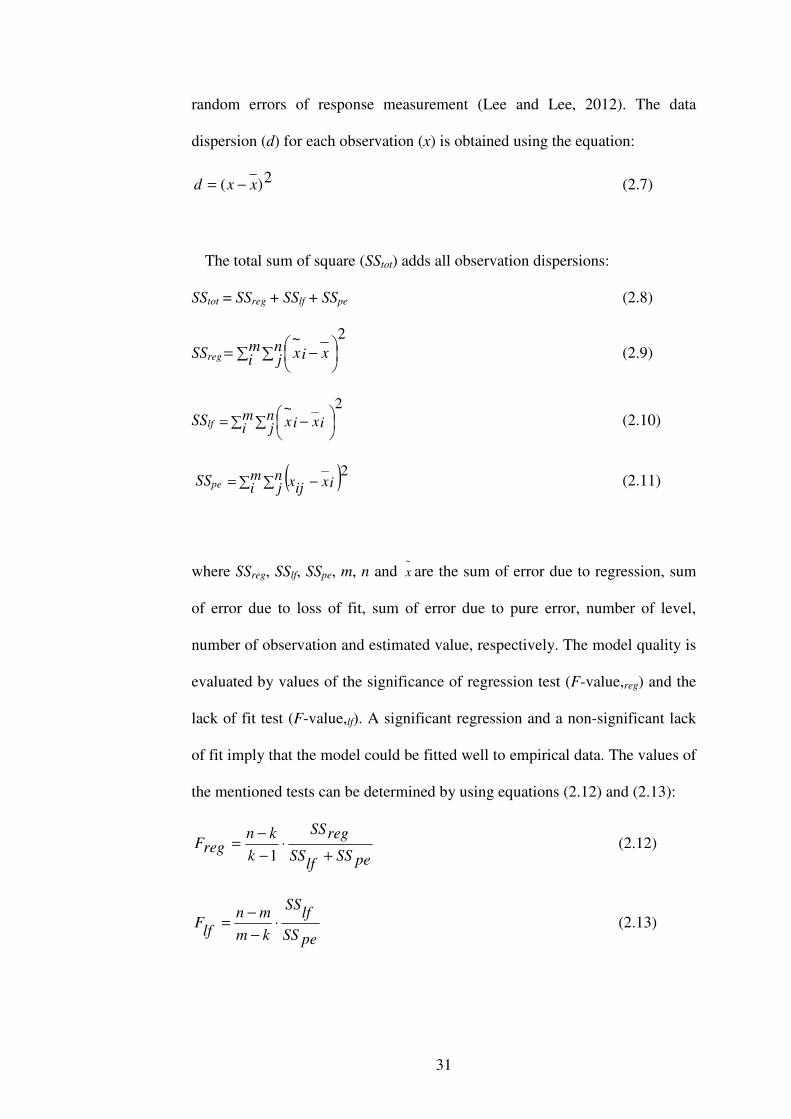
random errors of response measurement (Lee and Lee, 2012). The data
dispersion (d) for each observation (x) is obtained using the equation:
2)( xxd −= (2.7)
The total sum of square (SStot) adds all observation dispersions:
SStot = SSreg + SSlf + SSpe (2.8)
SSreg ∑ ∑
−= m
inj xix
2~ (2.9)
SSlf ∑ ∑
−= m
inj ixix
2~ (2.10)
SSpe ( )∑ ∑ −= mi
nj ixijx
2 (2.11)
where SSreg, SSlf, SSpe, m, n and ~
x are the sum of error due to regression, sum
of error due to loss of fit, sum of error due to pure error, number of level,
number of observation and estimated value, respectively. The model quality is
evaluated by values of the significance of regression test (F-value,reg) and the
lack of fit test (F-value,lf). A significant regression and a non-significant lack
of fit imply that the model could be fitted well to empirical data. The values of
the mentioned tests can be determined by using equations (2.12) and (2.13):
peSSlf
SS
regSS
k
knregF
+⋅
−
−=
1 (2.12)
peSS
lfSS
km
mn
lfF ⋅
−
−= (2.13)

32
where k is the number of parameters of the model.
Accuracy of the model can be measured by the coefficient of determination, or
known as R2:
totSS
peSSlf
SS
R
+−= 12 (2.14)
A larger value of R2 is desirable as it means higher accuracy. The
optimum conditions of the quadratic model can be determined by calculating
the critical points. The quadratic function, equation (2.6) for three variables
can be described as the first grade system in equations (2.15) to (2.17):
1112
31321211
XXXX
yββββ +++=
∂
∂ (2.15)
2222
32311222
XXXX
yββββ +++=
∂
∂ (2.16)
3332
22311333
XXXX
yββββ +++=
∂
∂ (2.17)
In order to obtain the optimum values, partial differentiations of output
response y with respect to 21 , XX and 3X are set to zero. The critical point, i.e.
the maximum and minimum coordinates of 21 , XX and 3X , can be obtained by
satisfying equations (2.15) to (2.17) and solving the system.

33
2.7 Force Model
Electrostatic separation process relies on the forces act on the particles,
allowing to be sorted out from a mixture. A number of forces exist in the
process. This includes the pinning force induced by the corona electrode and
the mechanical centrifugal force due to rotation. Figure 2.8 illustrates the forces
that act on a particle during the separation process.
Figure 2.8: Forces act on particles (magnitude not according to scale)
The five forces were summarised as (i) centrifugal force due to the
rotation, (ii) lifting force due to the attraction by electrostatic electrode, (iii)
gravity force, (iv) pinning force due to the ion generation from the corona
electrode on the insulative particles, and (v) air drag force due to air friction.
The deposition of particles from the feeder was set to 12 g/min in order to form
a monolayer on the surface of the roller.

34
The particles that pass through the corona ionising zone are subjected to
ionising and pinning effects generated by the corona electrode. According to
Lu et al. (2008), the induced pinning force, or known as image force, Fi
correlates to the size of the particles and is defined as:
1
2
2
4 επ t
QFi
⋅= (2.18)
where Q is particle charge, t is the particle thickness and ε1 is dielectric
constant of particle. The electrostatic electrode located downstream the corona
electrode induces a lifting force, the strength of which relies on the electric
field. The lifting force, also known as electrostatic force, Fe, applied on the
particles was calculated by:
ce EKQEF ρε 2
1== (2.19)
where K is a constant, E is the electric field strength and ρc is the surface
charge density. The gravity force, Fg, acted on the mass, m, of the particles was
defined as:
gAtmgFg ⋅== ρ (2.20)
where A is the surface area of particle and ρ is the density of the particle.

35
The centrifugal force applied on the particles is generated by the roller
which rotates in counter-clockwise angular direction. This force, Fct, is always
at an opposite direction to that of the pinning force and computed as (Younes et
al., 2007):
RAtFct
2ωρ= (2.21)
where R is the radius of separator roller, ω is the angular velocity and ρ, A, t are
the density, surface area, thickness of the particle respectively. An air drag
force, Fad in an opposite direction from the rotational trajectory provides
friction to the particles. It can be determined by:
2
2
1rADad vACF ρ⋅= (2.22)
where CAD is the air drag coefficient and vr is the relative speed of particle.
2.7.1 Food waste
Due to the dissimilarity of surface resistivity, the charges acted on food
waste particles differed from that of on non-food particles. For instance, when
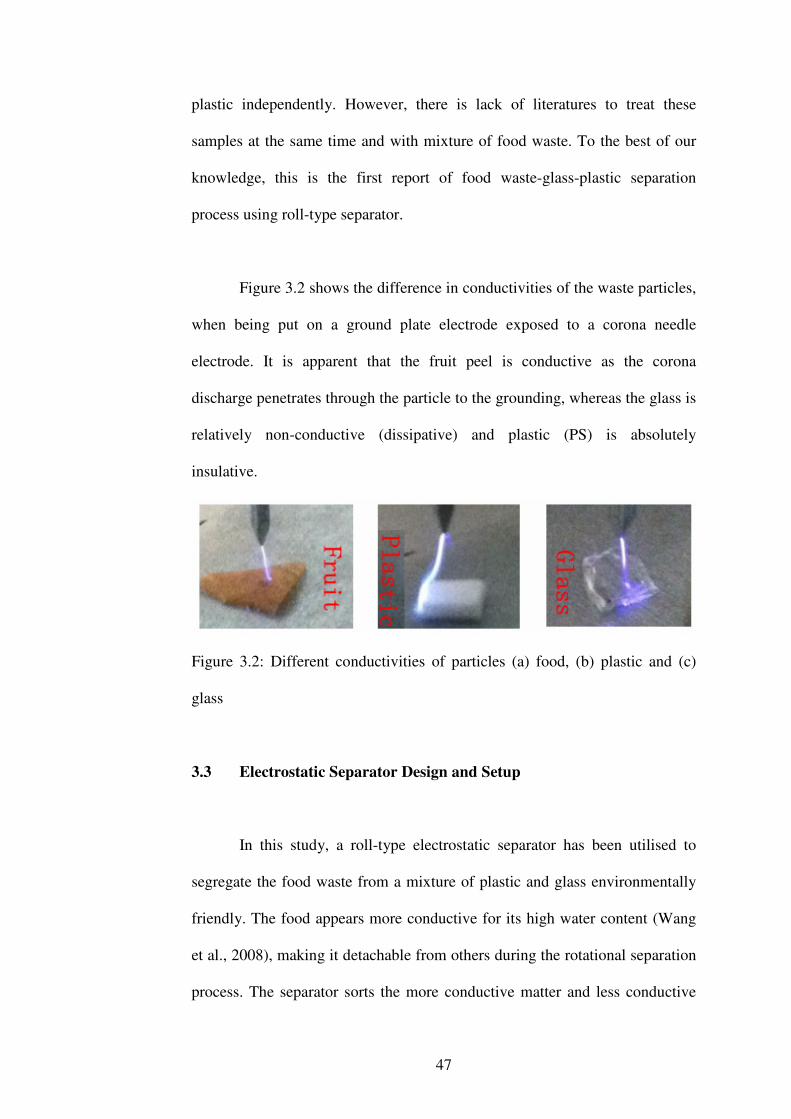
both food and non-food particles were moved into the corona ionising zone, the
more conductive food particles discharged rapidly to the grounded roller if
compared to the non-conductive plastic and glass particles. Figure 2.9
illustrates the combination of forces applied on the food particles.

36
Figure 2.9: Forces exerted on food particles in (a) feeding, (b) ionising and (c)
detaching stages (Li et al., 2007)
Figure 2.9 (a) shows the food particle being deposited onto the surface
of the roller rotating in a counter-clockwise direction. When the food particle
passed by the ionising zone as shown in Figure 2.9(b), it experienced a
combination effect of air-drag force, centrifugal force, electrostatic force,
pinning force and gravity force. However, since the food particle is

37
dissipative, the charges on it were discharged through the grounded electrode
and the effect of pinning force was weakened. Dissipative particle allows the
charges to flow to ground more slowly than the conductive particle. The
resulting force equilibrium state can be hence determined as:
ectg FFF +=γcos (2.23)
and
adg FF =γsin (2.24)
In order to detach from the ground rotating roller towards the food
collection tank as shown in Figure 2.9(c), the mechanical and electrical forces
exerting on the conductive food particle have to be satisfied,
γcosgect FFF ≥+ (2.25a)
or
γρρεωρ cos2
1
2AtgEkRAt c ≥+ (2.25b)
It is noticeable in equation (2.25b) that the process relies on the
properties of the particle (i.e. density, area, and thickness), roller configuration
(i.e. rotation speed and roller radius), electric field strength, particle surface
charge and position of corona electrode (angle γ). In this study, properties of
the particles were set to have small variability (further discussion in chapter
3). Impact of these variables on the separation performance was insignificant
if compared to the rotational speed and electric field strength. The two
parameters were then defined as the system factors in this study for the
parametric studies and the assessment of system robustness in chapter 4.

38
2.7.2 Non-food waste
Unlike dissipative particles, electrostatic force is absent in insulative
non-food particle. Non-food particle experiences only air-drag force,
centrifugal force, pinning force and gravity force, as shown in Figure 2.10.
Figure 2.10: Forces exerted on non-food particles in (a) feeding, (b) ionising
and (c) detaching stages (Li et al., 2007)

39
As shown in Figure 2.10(b), the force equilibrium state can be calculated by:
γcosgict FFF += (2.26)
and
adg FF =γsin
In contrast with food particle, the non-food particle was to be kept
attached to the roller surface before reaching the brush. This ensures the
particle to drop into the non-food collection tank. Thus, the following
conditions have to be satisfied:
ctgi FFF ≥+ γcos (2.27a)
or
RAtAtgt
EK c 2
2
22
2 cos ωργρρε
≥+ (2.27b)
where K is a constant and ε2 is dielectric constant of the non-food particle. As
the non-food particle travelled to a point that γ = π, equation (2.27a) can be
rewritten as:
gcti FFF +≥ , when γ = π (2.28a)
or
AtgRAtt
EK cρωρ
ρε+≥ 2
2
22
2 (2.28b)
It was apparent that a high electric field strength, E was required to
generate large pinning force on the non-food particle. Alternatively, the slow
rotation speed of the separator could ensure that the condition stated in

40
equation (2.28) can be satisfied and it maintains a minimised usage of
electricity. However, slow separation process was undesirably for productive
outputs and hence the moderate range of speed should be therefore selected.
By observing equations (2.25) and (2.28), it seems that electric field
demonstrated the synergistic effect to the separation efficiency for both food
and non-food particles. Effect of rotation speed, on the other hand, appeared as
synergistic to food particle separation and antagonistic to non-food separation.
Nevertheless, some essential evaluations ought to be performed and analysed
in order to confirm their influences on the performance of waste separation.
2.8 Summary
Electrostatic separation has been widely used for impurity removal and
waste recycling. Its comparatively simple configuration has gained a wide
acceptance. Charging of the substances can be achieved by means of
triboelectric charge, induction charge and corona discharge. The spark
discharge can be generated if the current in the discharge is adequately raised.
However, spark discharge produces erosion and degrading traces at the
electrodes. The energy released by the discharge should be maintained to
prevent the undesired spark effect.
The separation process is sensitive to the effects of random variability.
Taguchi’s method which based on an orthogonal array arrangement can be
employed to provide robustness to the process. Signal-to-noise ratios are used
in the robust parametric analysis technique. The robust process reduces the

41
variations of the process conditions caused by the random factors such as
manufacturing variation and component deterioration.
The efficiency of the separation relies on the uniform electric field and
the separator configuration. As the separation process relates to the system
parameters such as applied voltage and position of electrodes, the evaluation
of these parameters should thus be performed. Research on the optimum
electric field and equipment construction for a complete separation system
should also be carried out by employing respond surface methodology along
with ANOVA analysis. The review on development of waste separator and
review on design consideration were summarised in Table 2.3 and 2.4,
respectively.

42
Table 2.3: Summary of review on development of waste separator
Authors and
Year
Description Major Findings
Lawver and
Dyrenforth
(1973)
• Recover conductor from
non-conducting
mixtures
• Sorting of solid particles by
means of electrical forces that
exerted on charged bodies
Kiewiet,
Bergougnou
and Brown
(1978)
• Sort the very fine
particles in fluidised
base with electrostatic
fields
• Recovery of iron of 60 % can
be achieved.
• Recovery increases with
increasing voltage
Masui (1982) • Remove impurities in
food processing
industry with induction
type and corona
charging type separators
• Non-invasive separation with
high voltage, together with
either suction pump
(induction) or neutraliser
(corona charging)
Toraguchi and
Haga (1982)
• Remove ashes from ore
particles with cyclone
type separator
• Suitable for applications with
large gravity difference
Iuga et al.
(1993)
• Propose an improve
design over the
traditional with corona
electrodes
• Compared various electrodes
• Uniformity of space-charge
distribution on the surface of
electrode
Chang,
Crowley and
Kelly (1995)
• Separation using
triboelectric separator
with parallel electrodes
• Charging tendencies of
substances are referred in
triboelectric series
Veit et al.
(2005)
• Recover metal from
printed circuit boards
scraps
• Combine magnetic and
electrical forces for metal
recovery
Wu, Li and
Xu (2008)
• Propose an improve
design with double
rotating roller
• Improved recovery if
compared to single roller
design separator

43
Table 2.4: Summary of review on design consideration
Authors and
Year
Parameters and
Description
Major Findings
Murata et al.
(1982)
• Particle size: 37 -
840µm
• Sorting efficiency increases
with increasing size difference
Iuga et al.
(2001)
• Particle size decreases • Separation efficiency increases
Elder et al.
(2003)
• Electric field increases
• Uniform particle size
• Rotation speed
• Separation efficiency increases
• Better separation efficiency
• Affects the efficiency
Aman et al.
(2004)
• Corona electrode angle
increases
• Separation efficiency
decreases (conductor only)
• Effective when angle > 25°
Iuga et al.
(2004)
• DC electric filed
• Mineral size decreases
• Better than AC electric field
• Separation efficiency increases
Samuila et al.
(2005)
• Corona electrode angle
increases
• Separation efficiency
decreases
Li et al.
(2007)
• Particle size • Optimum value of 0.6 – 1.2
mm for industrial application
Bendaoud et
al. (2008)
• Corona electrode
distance decreases
• Separation efficiency
decreases
Calin et al.
(2008)
• Mixture composition • Affects the separation
efficiency
Lu et al.
(2008)
• Particle shape • Affects the falling trajectory
Ravishankar
and Kolla
(2009)
• Particle size, humidity
and temperature
• Affects the separation
efficiency
Xue, Li and
Xu (2012)
• Rotational speed • Optimum value of 50 – 70 rpm

44
CHAPTER THREE
MATERIALS AND METHODS
3.1 Introduction
This chapter describes the properties of test sample and the operational
concept of the electrostatic separator, as well as, the experimental techniques
performed for validation. It also summarises the electrode construction,
separator design and calculation, calibration and quantification of errors for
the experimental work. The evaluation analysis presented in chapter 4 includes
the separation characterisation, the robustness assessment of the separator and
the process optimisation. The experimental work started with waste samples
preparation. Characterisation of the separation system was then carried out by
analysing the parameters of the separator under various operational conditions,
followed by the robustness assessment using Taguchi’s method, where the L-9
orthogonal array design was applied to limit the random errors caused by noise
factors. Larger-is-better and smaller-is-better types of objective functions were
employed for the yield of food waste and middling respectively. System
performance optimisation technique was then applied to determine the optimal
working conditions by utilising response surface methodology. The proposed
methods in this study are summarised into a flowchart as shown in Figure 3.1.

45
Figure 3.1: Flowchart of the proposed method
3.2 Waste Granule Preparation
The objectives of the project are to electrostatically treat the waste
mixture. Thus, the commonly available wastes were used. The sample of test
was typically a mixture of food waste particles, FW (fruits peel, 40 wt%) and
non-food waste particles, NF (glass, 10 wt% and plastic, 50 wt%) per each
experimental run. The fruit peel refers to the peel from carrot and apple with
water content ranged from 10% to 30%, whereas the plastic refers to the
polystyrene (PS) food box and polyethylene terephthalate (PET) mineral water
bottles. All particles were cut manually into sizes within 1.0 mm to 4.0 mm.
The physical and electrical properties of the samples are given in Table 3.1.

46
Table 3.1: Typical properties of test samples
Properties Symbol Unit FW Glass Plastic
Density
ρ kgm-3
1200
- 1400
2000
- 2500
1050
- 1360
Particle
thickness
t m 2.0×10⁻⁴
- 5.0×10⁻⁴
1.0×10⁻³
- 2.0×10⁻³
3.0×10⁻⁴
- 3.0×10⁻³
Electrical
Conductivity
σ Sm-1
> 1×10⁻⁴
1×10-11
- 1×10-15
< 1×10-20
Resistivity ρr Ωm < 1×10⁴
1×10¹¹
- 1×10¹⁵
> 1×10²⁰
The density ρ was calculated by weighting a known area of sample.
The volume was obtained by multiplying the measured area with the measured
thickness. In order to validate the calculation of volume, a known mass of
sample was put into a container filled with liquid medium and the liquid
height was measured. A total of 10 measurements were taken and the range of
density was determined. The resistivity was measured with a megaohm meter
and the electrical conductivity was the reciprocal of resistivity. All samples
were not reused in the electrostatic characterisation as the electrical properties
may change once being used. The corona in the vicinity of the electrode tip
may cause large molecules in the samples to break down to molecular
fragments, which produces smaller fragments with bigger ionic mobility and
thus changing the electrical conductivity. Note that the sample of test was
mixed with fruit peel with the highest electrical conductivity, plastic with the
largest thickness and glass with the largest density, thus it is impractical to
employ triboelectrostatic or cyclone type separator. The rotating roller type
separator was suggested instead, for its capability in treating the glass and
47
plastic independently. However, there is lack of literatures to treat these
samples at the same time and with mixture of food waste. To the best of our
knowledge, this is the first report of food waste-glass-plastic separation
process using roll-type separator.
Figure 3.2 shows the difference in conductivities of the waste particles,
when being put on a ground plate electrode exposed to a corona needle
electrode. It is apparent that the fruit peel is conductive as the corona
discharge penetrates through the particle to the grounding, whereas the glass is
relatively non-conductive (dissipative) and plastic (PS) is absolutely
insulative.
Figure 3.2: Different conductivities of particles (a) food, (b) plastic and (c)
glass
3.3 Electrostatic Separator Design and Setup
In this study, a roll-type electrostatic separator has been utilised to
segregate the food waste from a mixture of plastic and glass environmentally
friendly. The food appears more conductive for its high water content (Wang
et al., 2008), making it detachable from others during the rotational separation
process. The separator sorts the more conductive matter and less conductive

48
matter to different locations. However, some matter may fall in between as
middling product, resulting in a decline in separation efficiency (Wu, Li and
Xu, 2008). The main objectives of present study focus on determining the
efficiency of waste recovery by electrostatic process, identifying the dominant
empirical factors and building up the equations for optimal separation results
with respect to operational conditions.
3.3.1 Test rig
The test rig was constructed with the objective of producing
continuous corona discharges and to examine qualitatively and quantitatively
its efficiency for waste separation. A schematic of the experiment layout and
electrical connections of the experimental work is shown in Figure 3.3.
Figure 3.3: Diagram of electrostatic separator
49
The separation process utilised an earth-grounded roller type
electrostatic separator rotating in counter-clockwise direction. The samples in
the feeder were deposited onto the roller surface. An ionising needle electrode
powered by a high voltage direct current (DC) power supply
(InformationUnlimited, USA) with rated output up to 35 kV was placed at one
side of the separator for corona discharge generation. The connection from
power supply to the electrode was housed inside a polytetrafluoroethylene
(PTFE) tube for electrical insulation purpose. A set of insulated retort stand
was used to hold the needle electrode and provide flexibility to change the
electrode displacement. An electrostatic plate electrode was connected
downstream, providing the non-discharging electrostatic field. A non-
conductive brush was placed at another side to remove particles left on the
roller and to provide a clean roller surface for the next rotation cycle.
The output of high voltage power supply was calibrated using a
purpose built voltage divider with a 1: 301 ratio, forming by three 10 MΩ
resistors and a 100 kΩ resistor. The actual value of the resistors was measured
using a digital Multimeter model 8145 (GW-Instek, Taiwan), with rated
accuracy of ± 0.25% in the 20 MΩ resistance range and ± 0.10% in the 200
kΩ range. The resistors were connected in series and the output voltage across
the 100 kΩ resistor was measured, with rated accuracy of ± 0.03% in the 200
V range. The measurements were conducted one hour after the units were
switched on so that the equipment have sufficient time to warm up and were
carried out in triplicate as to assess the magnitude of random error sources.
The magnitude of the percentage error for the calibrated voltage due to the

50
accuracy of measuring instrument was calculated to be 0.38%.
The speed of the roller was controlled by a geared motor with a power
consumption of 40 W (PeeiMoger, Taiwan). Output of the motor was
controlled by an electronic speed controller to provide a speed range of 0 –
120 rpm. In order to avoid electromagnetic wave interference, the motor
controller was shielded with a metal plate and placed away from the power
source. The experiment was run in a ventilation room and the ambient was
recorded to be 24 – 28 °C with relative humidity (RH) of 55 – 65 %.
3.3.2 The separator design
A lab scale roll type separator, used as the starting point of the design
of the corona charge type separator as described by Figure 2.3 (c), was
fabricated. The separator in this study has a better control of rotary speed as
driven by the electronic speed controller, which marks the key improvements
over the traditional design. The roller surface, corona electrode and
electrostatic electrode were made of stainless steel. Stainless steel was chosen
over other cheaper electrical conductors such as aluminium since the latter
tends to form an oxide layer that is highly electrical resistant. The photo and
schematic of the separator design are shown in Figures 3.4 and 3.5,
respectively. Note that the metal plate that used as the shield has been
removed while preparing Figure 3.4.

51
Figure 3.4: Photograph of the separator
Figure 3.5: Design schematic of the separator
During the electrostatic separation process, various factors may affect
the separation performance. Referring to the section 2.7 discussed previously,
the factors included the rotation speed and electrode position. The system
parameters involved in this study are summarised in Table 3.2 and the effects
will be discussed in the following chapter.

52
Table 3.2: System parameters and their range
Variables Min. value Max. value
Voltage level, U (kV) 20 30
Rotation speed, N (rpm) 60 90
Corona electrode angle, α1 (°) 25 50
Corona electrode distance, d1 (mm) 50 60
Electrostatic electrode distance, d2 (mm) 40 50
Note: Electrostatic electrode angle, α2 = 90°, feed rate = 12 g/min.
The range of voltage level was selected based on the constraint of the
high voltage supply, which provides a maximum rated voltage of 35 kV. The
range of rotation speed was summarised in Table 3.2 by referring to the
literatures. The maximum speed of the motor can achieve to be 120 rpm. The
corona electrode must not be placed too close to the feeder outlet as the charge
may affect the feeding rate. Direct corona may also dispel the particles to
another side of the roller before they can travel along the counter-clockwise
rotational direction, thus resulting in a poor separation performance.
The electrostatic electrode was set at an angle of 90 degrees. The
interval between two electrodes was varied in a range of 25 – 50 degrees, or
approximately 31 – 61 mm on surface of the roller with a radius of 70 mm.
The distance of the corona electrode is preferred to be further away from the
roller surface in order to generate a wider pinning zone. It is to be noted,
however, that placing it too far may lead to a weak space charge on the
granules (Samuila et al., 2005). Thus, the range of corona electrode distance d1
was set as shown in Table 3.2. On the other hand, the distance for electrostatic
electrode d2 should be set within a range of 1.0 to 2.5 times of voltage level U
53
(Xu et al., 2009). These values were calculated to be sufficient for falling
trajectory deviation resulted from electrostatic force and prevention of high
risk spark discharge. Detailed calculation work will be described in Chapter 4.
3.4 Analytical Procedures
During the electrostatic separation process, the air surrounding the
ionising electrode was ionised by a high intense corona discharge, thus
forming an ionising zone. When the roller delivered the particles through the
zone, the more conductive food particles dissipated their charge through the
grounded roller, avoiding them from being pinned for a longer time than the
less conductive one. With the continuous rotation from the roller, the more
conductive particles were subjected to higher difference between centrifugal
force and pinning force, and thrown off the roller. The electrostatic electrode
induced an evenly distributed electric field and deviated the more conductive
particles from their natural falling trajectory. The less conductive particles
remained pinning onto the roller due to the larger pinning force applied on
them and they subsequently fell off at different locations. In chapter 4, the
separation mechanisms were analysed by referring to the force model. The
potential system factors were identified and effects of these factors on the
separation performance were determined during the characterisation process.
Nevertheless, some low moisture (<10% moisture content) food
particles may not able to detach from the roller to food tank due to poor
conductivity. Similarly, some oversize or overweight non-food particles may

54
drop earlier before falling into the non-food tank, when the centrifugal force
surpassed the pinning force. These hard-to-control factors, e.g. uniform
size/area of granule due to machinery constraint, limit the system performance
and affect the accuracy of the analysis. The unsorted particles tend to fall as
middling products (Figure 3.3). Thus, in addition to the characterisation, a
robust design created by employing Taguchi’s method is utilised to analyse
the robustness of the separation process control and to minimise the unwanted
effects of random factors. The characterised results were further evaluated by
employing response surface methodology as to identify the optimal conditions.
3.4.1 Efficiency and purity determination for OVAT evaluations
In electrostatic separation, food waste and non-food waste were
separated by electrostatic processes. However, misclassification may occur
undesirably as discussed earlier in section 3.4. Thus, OVAT evaluations were
necessary to analyse the efficiency and purity of the separation results. The
test sample of waste mixture was deposited onto the roller surface and
eventually dropped into three collection tanks, namely food waste tank, non-
food waste tank and middling (M) tank. The mass from each tank was
measured by a digital precision balance with a resolution of 0.01 g after each
run. The separation efficiencies, S (%) of food waste, SFW and non-food waste,
SNF were calculated by:
%100,%0
×=FW
mSSFW
FW
FW (3.1)
%100,%0
×=NF
mSSNF
NF
NF (3.2)

55
where mFW, FW0, mNF and NF0 are the mass in FW tank, initial food waste
mass in the feeder, mass in NF tank and initial non-food waste mass in the
feeder, respectively. Similarly, the purities of the food waste tank (PFW) and
non-food waste tank (PNF) were determined by:
%100'
,% ×=FW
FW
FW
m
mPPFW (3.3)
%100'
% ×==NF
NF
NF
m
mPPNF (3.4)
where m’FW and m’NF are the food waste mass in FW tank and non-food waste
mass in NF tank, respectively. Both m’FW and m’NF were determined by
manuall sorting.
3.5 Robust design with Taguchi’s method
Robust design is an engineering approach for reliable productions
under various controllable circumstances. The design enhances the quality and
diminishes the negative noise impact on the products. Robust design may not
produce the most optimal result. However, implementation of the design
improves the process and quality of the products (Camposeco-Negrete, 2013).
This study employed Taguchi’s method to assess the robustness of
food waste segregation process from the solid waste mixtures. The four
factors, namely voltage level, rotation speed, water content and particle size
were considered based on reports found in the literature. A signal-to-noise
ratio (SNR) was used as the objective function to determine the robustness.

56
SNR is viable for replicated experiments to facilitate the data filtration and
noise reduction process. It has been widely employed in stochastic screening
and optimisation problems as a performance measure (Besseris, 2014). In this
study, larger-is-better type of objective function was applied for maximal food
waste recovery, whereas smaller-is-better type of objective function was used
to yield minimal middling product.
In the robust design, voltage level and roller rotation speed were
selected as system factors (Dascalescu et al., 2005), whereas the water content
and size of food waste particles were defined as hard-to-control random
factors. Water content in food waste decides its conductivity and likelihood to
be moved to the food collection tank. However, this parameter is hard to
control in practical conditions (Hou et al., 2010). The size of particles, on the
other hand, varied due to the machinery limitation. This noise factor may
eventually lead to low recovery efficiency (Wu, Li and Xu, 2008). Robust
design using Taguchi’s method in present study targeted to limit the negative
impact of these hard-to-control random factors (i.e. water content and particle
size) on the separation process.
Four factors which varied within three levels have been selected as:
particle size (1.0 mm, 2.5 mm and 4.0 mm), moisture or water content (10 %,
20 % and 30 %), roller rotation speed (60 rpm, 70 rpm and 80 rpm) and
supplied voltage level (20 kV, 25 kV and 30 kV). Table 3.3 tabulates the
factors and their corresponding levels. The recovered waste and middling
product were selected as the responses. The maximisation of waste recovery

57
and meanwhile the minimisation of middling product are desirable in
enhancing the separation efficiency of the electrostatic separator.
Table 3.3: Factors and their levels
Factor Level
1 2 3
Particle size, D (mm) 1.0 2.5 4.0
FW water content, WC (%) 10 20 30
Rotation speed, N (rpm) 60 70 80
Voltage level, U (kV) 20 25 30
As this is a design of four factors with three levels, an orthogonal array
was built as shown in Figure 3.6. The orthogonal array was designed to
understand the impact of each factor by assuming that there is no interaction
between any two factors. A total of nine design points were selected for the
Taguchi’s method to form an L-9 array, as previously discussed in Table 2.2.
In general, the system factors (rotation speed, voltage level) have
significant effects on the average output of the process, whereas the random
factors (particle size, water content) may or may not have influences on the
values around the average of output. Effect of these factors was evaluated by
analysing the mean value of each array and the respective signal-to-noise ratio
(SNR) value. The parameters of the orthogonal array design were shown in
Table 3.4. Analytical discussion based on these parameters was performed in
the chapter 4.

58
Figure 3.6: Inner and outer arrays by Taguchi design
Table 3.4: L-9 orthogonal array and the factors
Exp.
no.
Particle size
(mm)
FW water content
(%)
Rotation speed
(rpm)
Voltage level
(kV)
1 1.0 10 60 20
2 1.0 20 70 25
3 1.0 30 80 30
4 2.5 10 70 30
5 2.5 20 80 20
6 2.5 30 60 25
7 4.0 10 80 25
8 4.0 20 60 30
9 4.0 30 70 20

59
3.6 Separation Process Optimisation using Response surface
methodology
Design of experiments and analysis of the variables were performed by
employing RSM using Design Expert 8.0.5 software (Stat-Ease Inc., USA). A
Plackett-Burman (PB) factorial design was applied as a screening
experimental design approach to navigate an n-dimensional design space with
n + 1 experiments. In present study, 11 factors with high/low values were
selected and led to a total of 12 experiments. Eight of them were practical
factors including applied voltage (F1), rotation speed (F2), corona electrode
angle (F3), corona electrode distance (F4), electrostatic electrode distance
(F5), %FW content in mixture (F6), mixture volume (F7), ambient
temperature (F8), and three of them were dummy factors (D1, D2 and D3).
The high and low values of each practical factor were determined by referring
to the discussion in Table 3.2 and OVAT (one variable at time) parametric
analysis in the following chapter.
Based on the PB design outputs, central composite design (CCD) was
employed for modelling. CCD is a factorial design with a central point and an
α-distance (α = 1.68) star topology. As CCD requires the extension of range
due to the α-distance, it comes as a consideration in choosing the appropriate
operational range and not exceeding the maximal rated output of the machines.
Separation efficiency and purity of both food and non-food waste, as discussed
previously in section 3.4, were used as responses in evaluating the influence of
the mentioned practical factors. In order to identify the main effects, the Pareto

60
analysis was applied to calculate the vital percentage of each significant factor
towards the response as follows:
1002
2
×
=∑ i
i
iB
β
β (3.5)
where Bi represents the importance level of each variable and βi represents
each polynomial coefficient.
Optimisation process was started with the mathematical and statistical
analyses of the experimental data. The polynomial models and the fitness of
the models were evaluated, in addition to the tests of significance. The optimal
operational conditions would thus be determined with respect to the optimum
values for each factor (Aggarwal et al., 2008).
3.7 Summary
The test rig and the electrostatic separator have been described and the
characteristics of the waste were defined in this chapter. The high voltage
power supply was calibrated by using a purpose built voltage divider. During
the separation process, an electrostatic field was produced by the corona and
electrostatic electrodes. Conductive food particles in this field are highly
subjected to electrostatic charge, whereas non-food particles are mainly
subjected to corona charge.

61
The selection of factors and their range were justified in this chapter.
The range of the applied voltage, U (20 - 30 kV) was selected based on the
output constraint of the high voltage supply at 35 kV. The range of rotation
speed (60 - 90 rpm) was chosen on the same reason. Distance of corona
electrode from the roller surface was set within a range of 50 and 60 mm, so as
to provide a wide pinning zone and meanwhile maintaining a strong space
charge on the particles. A simple rule was applied in determining the distance
of the electrostatic electrode, i.e. 1.0*U < distance (mm) < 2.5*U. The
distance was calculated to be sufficient for falling trajectory deviation and for
sparks prevention.
Performance of the separator was affected by the system factors, e.g.
applied voltage. However, the performance may also be influenced by some
hard-to-control random factors. A robust design employing an L-9 orthogonal
array was employed to minimise the negative impact from these random
factors. The system factors were analysed to identify their effects on the
separation efficiency and purity. Response surface methodology was then
employed to predict the optimal separation performance.

62
CHAPTER FOUR
RESULTS AND DISCUSSION
4.1 Characterisation of Recovery Efficiency
The theoretical discussion in the literature review suggested a number
of factors that could influence the separation performance of the separator. It
is equivalently critical to recognise their effects which govern the separation
process. The one-variable-at-time (OVAT) analytical method was employed to
assess the impacts of these effects. In an attempt to make a comprehensive
understanding on the process, this section explores the influence of the
operating conditions in terms of the applied voltage, roller rotation speed,
position of the electrodes and composition of the mixture. The waste samples
throughout the parametric study were prepared in 100 g and the size of each
particle was in average 4.0 mm.
4.1.1 Effect of applied voltage
The extent of electrostatic separation caused by applied voltage could
be quantified in terms of food waste recovery and yield of middling product.
The corona discharge from the corona electrode is generated continuously
once the power supply is turned on, and ceased immediately as soon as the
power is cut off. As illustrated in Figure 4.1, the separation and recovery of

63
food waste were related significantly to the applied voltage. A drastic
increment of purity (%PFW) along with a distinct rise of separation efficiency
(%SFW) was noted at the voltage level of above 15 kV. For instance, the
purity was improved from 51% to 89% when the voltage increased from 5 kV
to 15 kV. The observation suggests that the voltage can be set (i.e. 15 kV) as a
threshold for the parametric studies throughout section 4.1. Although high
separation efficiency can be observed at 5 kV, it in fact resulted in a very low
purity and consequently poor food waste recovery as shown in Figure 4.2,
mainly due to the weak electric field.
Figure 4.1: Effect of applied voltage on food waste recovery and purity
(rotation speed = 70 rpm; feed content FW:NF = 40:60)
To better understand the extent of applied voltage on separation
process, the weight of middling products and the recovered food waste were

64
measured. Recovered food waste (FW) refers to the multiplication product of
separation efficiency (%SFW) and purity (%PFW). As shown in Figure 4.2, it
can be observed that the recovered food waste increases with the increase of
applied voltage and reduction of middling products. This can be interpreted
that a stronger electric field enhances the detachment of food waste to the FW
tank and as well the separation purity, thus reducing the mass in the middling
collection tank. It has been established that the separation process is attributed
to the electrostatic force. As expressed by equation (2.19), the electrostatic
force Fe is directly proportional to the square of electric field. It can be
deduced that the higher the electric field, the higher the electrostatic force
acted to deviate food particles from falling trajectory which leads to better
separation efficiency and food recovery (Bendaoud et al., 2008).
Figure 4.2: Effect of applied voltage on mass of recovered food waste and
middling (rotation speed = 70 rpm; feed content FW:NF = 40:60)

65
Figure 4.3 illustrates the effect of applied voltage on the non-food
particles. It shows that high purity of non-food particles, more than 90% in
this case, was found inside the NF collection tank with insignificant
impurities. However, the recovered mass of NF, which derived from the
multiplication product of NF separation efficiency (%SNF) and purity
(%PNF), exhibited a comparatively low output when the applied voltage was
below 15 kV. This was due to the fact that the low electric field is insufficient
to generate strong pinning force to move NF particles into NF tank, as
previously expressed by equation (2.28). Besides, the results verified the
previous discussion that the minimal required voltage level should be set to
obtain effective separation results.
Figure 4.3: Effect of applied voltage on purity and recovered mass of non-food
waste (rotation speed = 70 rpm; feed content FW:NF = 40:60)

66
4.1.2 Effect of roller rotation speed
The relationship between the voltage and the separation efficiency at
different rotation speed is depicted in Figure 4.4. Interestingly, the separation
of food waste at slower rotation speed was found to be more effective. For
instance, at the same applied voltage of 30 kV, the FW separation efficiency
can reach about 87% at a speed of 20 rpm if compared to 77% at 80 rpm. It
appeared that the lowest level of rotation speed can prolong the time of waste
particles to stay within the ionising zone. Nevertheless, the slow processing
speed is impractical for energy cost optimisation. As such, the speed range of
40 rpm to 80 rpm could be considered for a rapid separation process on one
hand, and for maintaining a high recovery of waste on the other hand.
Figure 4.4: Effect of roller rotation speed on FW separation efficiency (feed
content FW:NF = 40:60)

67
As shown in Figure 4.5, in general, the middling mass reduced with
faster roller rotation, indicating an enhancement to the separation efficiency. It
is in contrast to the previous discussion. From equation (2.21), the centrifugal
force Fct relates positively to the rotation speed. A higher rotation speed
implies a larger centrifugal force to deviate the food particles to FW tank.
Nevertheless, results in this section exhibited that a slower rotation process
can also contribute to an effective separation. The separation performance in
this case can be regarded as a competition between centrifugal force and the
ionising time (Elder, Yan and Raiser, 2003; Xue, Li and Xu, 2012). There is
likely a critical roller rotation speed level, and it should be determined
specifically via an optimisation methodology, which would be discussed in the
section 4.3.
Figure 4.5: Effect of roller rotation speed on middling (feed content FW:NF =
40:60)
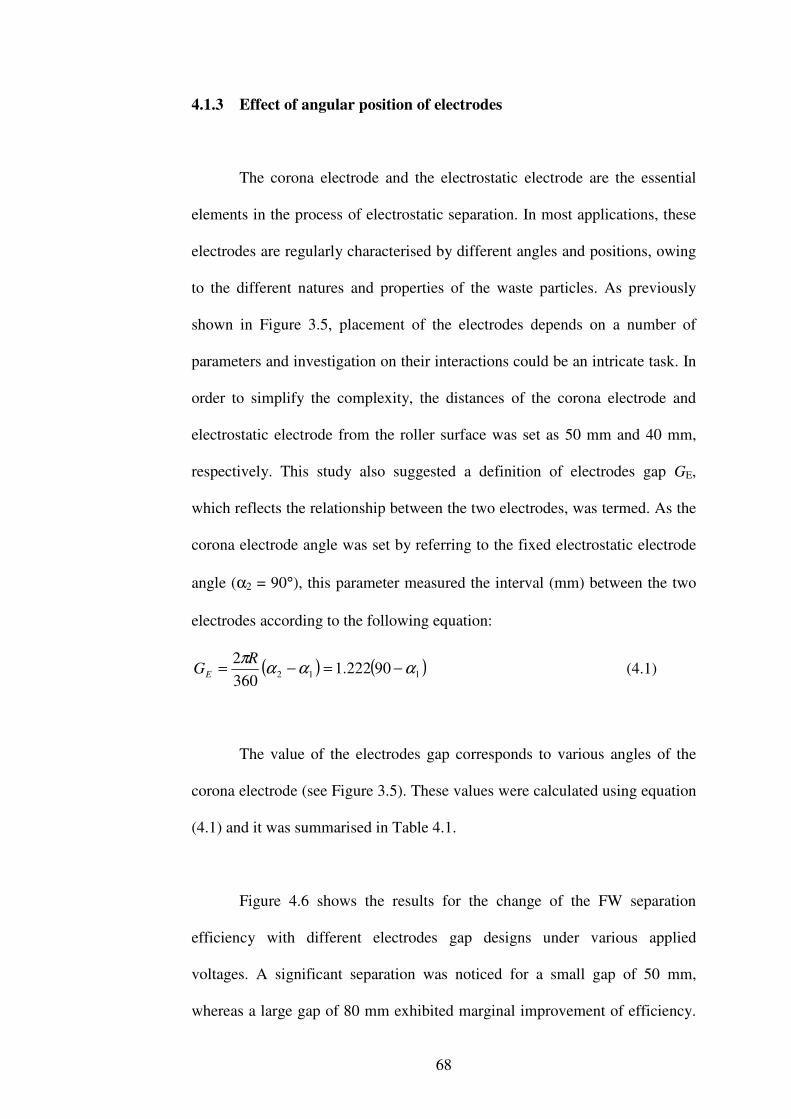
68
4.1.3 Effect of angular position of electrodes
The corona electrode and the electrostatic electrode are the essential
elements in the process of electrostatic separation. In most applications, these
electrodes are regularly characterised by different angles and positions, owing
to the different natures and properties of the waste particles. As previously
shown in Figure 3.5, placement of the electrodes depends on a number of
parameters and investigation on their interactions could be an intricate task. In
order to simplify the complexity, the distances of the corona electrode and
electrostatic electrode from the roller surface was set as 50 mm and 40 mm,
respectively. This study also suggested a definition of electrodes gap GE,
which reflects the relationship between the two electrodes, was termed. As the
corona electrode angle was set by referring to the fixed electrostatic electrode
angle (α2 = 90°), this parameter measured the interval (mm) between the two
electrodes according to the following equation:
( ) ( )112 90222.1360
2ααα
π−=−=
RGE
(4.1)
The value of the electrodes gap corresponds to various angles of the
corona electrode (see Figure 3.5). These values were calculated using equation
(4.1) and it was summarised in Table 4.1.
Figure 4.6 shows the results for the change of the FW separation
efficiency with different electrodes gap designs under various applied
voltages. A significant separation was noticed for a small gap of 50 mm,
whereas a large gap of 80 mm exhibited marginal improvement of efficiency.

69
Influence of electrodes gap on the separation process is also reflected from the
measurement of middling mass. As depicted in Figure 4.7, great reduction in
middling was accomplished with the electrodes gap of 50 mm at the same
applied voltage compared to that of 65 mm and 80 mm. When the corona
electrode was moved further from the electrostatic electrode, the gap increased
to 80 mm and the efficiency deteriorated below that with a smaller gap.
Table 4.1: Corona electrode angle and corresponding electrodes gap
α2 (°) Corona electrode angle, α1 (°) Electrodes gap, GE (mm)
90 25 80
90 37 65
90 50 50
Figure 4.6: Effect of electrodes gap on separation efficiency (rotation speed =
70 rpm; feed content FW:NF = 40:60)

70
It appears that the separation efficiency would enhance in term of
reduction of middling with small electrodes gap. Set on a basis that the
intensity of space charge between the electrodes increases with a closer
distance would yield higher efficiency. However, it is also possible that if the
electrodes are located too close, charge would gather around the electrodes
and to cause localised high electric field and pressure. This can lead to
operational interruption and a decline in machine lifespan. It is hence desirable
to establish an optimisation model for effective separation.
Figure 4.7: Effect of electrodes gap on middling (rotation speed = 70 rpm;
feed content FW:NF = 40:60)
Figure 4.8 shows the purity and mass of samples for FW and NF along
with the mass of middling under an applied voltage of 25 kV. It is noticeable
that the purity and separation efficiency decreased with the increment of gap

71
distance between the electrodes. It could be due to the fact that the corona
electrode is placed too close to the feeder output. Based on the experimental
observation when the angle of corona electrode was set at 25 degrees, the large
coverage of the induced ionising charge interfere the particles coming out
from the feeder. The charge repels the particle undesirably instead of pinning
it onto the surface of the roller. In other words, with electrodes gap of 80 mm,
the particle could be eventually fallen into the NF tank or classified as
middling if fallen outside any tank, thereby increasing the mass of middling
and affecting the purity of the NF collection.
Figure 4.8: Mass and purity with different electrodes gap (rotation speed = 70
rpm; feed content FW:NF = 40:60, applied voltage = 25 kV)

72
4.1.4 Effect of mixture composition
Besides the separator parameters discussed previously, the efficiency
of separation is also affected by the type of mixture in terms of mixing ratios.
Mixed samples derived from mixing the food (moisture 10% - 30%) and non-
food particles at different ratios as tabulated in Table 4.2 were investigated.
The groups G1, G2, G3, G4 and G5 for the FW:NF mixtures consisted of
mixing ratios of 50:50, 40:60, 30:70, 20:80 and 10:90 by volume, respectively.
Table 4.2: Mixture with different mixing ratios (particles were in same size)
Group Mixture
FW (%) NF (%)
G1 50 50
G2 40 60
G3 30 70
G4 20 80
G5 10 90
Figure 4.9 illustrates the separation efficiency and purity of the mixed
FW-NF samples. The outcomes indicated that the mixture in G5 exhibited the
most prevalent NF separation in term of purity. On the contrary, the FW
separation purity turned out to be highest. The result could be explained by the
fact that the separation purity is highly dependent on the mixing ratio. For
instance, the higher the mixing ratio of particular particles, the higher the
respective separation purity, and vice versa. On the other hand, small variance
of the separation efficiencies, for both FW and NF particles, signified the
trivial effect of the mixing ratio in this study.

73
Figure 4.9: Effect of mixing ratios on separation efficiency and purity (rotation
speed = 70 rpm; applied voltage = 25 kV)
Effect of the mixing ratio on the mass of middling and recovery is
depicted in Figure 4.10. As discussed previously, the influence of mixing ratio
on the separation efficiency of FW particle was insignificant. However, with
the drastically decline of purity from mixture G1 to G5, the recovered FW
particles were between the mass of 37.5 and 5.5 g out of the FW collection
tank with mass ranging from 40.6 to 7.8 g, respectively. Similarly, the NF
mass between 42.4 g (out of 44.2 g) and 80.1 g (out of 80.9 g) can be
extracted. The mass of middling lies in the range between 15.2 and 11.3 g. It is
likely that the high amount of NF particles in mixture G5 contributes to
frequent tribocharging activities, causing a great repellent effect which
improves the separation efficiency.

74
Figure 4.10: Effect of different mixing ratios (rotation speed = 70 rpm; applied
voltage = 25 kV)
4.1.5 Summary
The applied voltage, roller rotation speed, angular position of
electrodes and composition of the mixture were examined on their impacts to
the separation process. It can be summarised from the parametric studies and
theoretical consideration that the most superior effect of electrostatic
separation was associated with test sample under a high voltage level. The
separation process can be enhanced by determining the optimum values of

75
rotation speed and electrodes gap for creating an intensive charging coverage,
while keeping the process time short to save energy. The optimisation model
should be established as it would provide a comprehensive analysis on
separation efficiency and purity.
4.2 Robust Design
In addition to the influencing factors previously discussed, the
electrostatic separation process was sensitive to the effects of random
variability. Characteristic variation of samples and any source of natural
occurring were considered as random noise factors (Dascalescu et al., 2005).
Taguchi’s method provides an approach to assess the robustness of the
separation processes. The main purpose of robust design using Taguchi’s
method is to limit the variations of the hard-to-control random errors. The L-9
array design in this study consisted of two types of factors, namely dominant
design factors (i.e. applied voltage and rotation speed) and random noise
factors (i.e. size and water content of the particles).
4.2.1 Experimental results
The mass of the recovered food waste and middling products collected
from the tanks were used as the experiment responses of the L-9 array design.
This study was to decide the effective separation configurations for maximal
food waste recovery and meanwhile minimal middling products. Thus, larger-
is-better type and smaller-is-better type of objective functions were applied,

76
respectively. The former type is generally aligned with a positive sign,
whereas the latter type has a negative SNR. The recorded responses were
tabulated in Table 4.3 with their corresponding SNRs calculated using
equations (2.1) and (2.2).
Table 4.3: Experimental response and the corresponding SNR.
Exp.
no.
Food
waste,
FW (g)
% SFW SNR
(FW)
Middling,
M (g)
%
Recovery
SNR
(M)
1 28.9 72 29.22 16.0 27 -24.08
2 32.3 81 30.18 15.1 25 -23.58
3 30.1 75 29.57 14.5 24 -23.23
4 31.4 79 29.94 13.7 23 -22.73
5 30.0 75 29.54 16.8 28 -24.51
6 32.5 81 30.24 14.9 25 -23.46
7 31.5 79 29.97 15.1 25 -23.58
8 34.0 85 30.63 13.4 22 -22.54
9 31.3 78 29.91 15.3 26 -23.69
Table 4.4 shows the percentage impacts of the design factors. The
impact of each factor on the food waste recovery and the middling was
calculated using equation (2.4). It is noticeable that the voltage level has the
maximum effect (39.44 %) on effective recovery of food waste, followed by
the particle size (26.93 %), water content (17.90 %) and rotation speed (15.73
%) within the design range. On the other hand, the minimal middling product
was mostly influenced by the voltage level (79.78 %). The water content has a
negligible effect (0.78 %) compared to rotation speed (12.07 %) and particle
size (7.37 %).

77
Table 4.4: Percentage impact of different factors on food waste and middling.
Food waste, FW Middling, M Factor Level
SNR SNR %impact SNR SNR %impact
1 29.67 -23.64
2 29.91 -23.60
D (mm)
3 30.18
29.92 26.93
-23.29
-23.51 7.37
1 29.71 -23.48
2 30.13 -23.58
WC (%)
3 29.91
29.92 17.90
-23.46
-23.51 0.78
1 30.05 -23.39
2 30.01 -23.35
N (rpm)
3 29.69
29.92 15.73
-23.79
-23.51 12.07
1 29.56 -24.10
2 30.13 -23.54
U (kV)
3 30.06
29.92 39.44
-22.84
-23.49 79.78
It is not surprising at all that the applied voltage appears as a key factor
for electrostatic separation. High level of applied voltage implies that a large
number of food waste particles can be attracted towards food waste collection
tank. Meanwhile, the non-food waste particles were effectively pinned and
moved to the non-food waste tank. Therefore, the middling product dropped
within was consequently minimised. Similarly, high recovery rate and low
middling were observed on the particles with large size of 4.0 mm as shown in
Tables 3.4 and 4.3. This was due to the fact that particles with large surface
area were subjected to more attraction and pinning effects by ionisation
process, thus making them to drop to their respective collection tanks
effectively (Ruan and Xu, 2012).

78
Besides, it is worth noting that water content improves the conductivity
of food waste particles. Hence, this factor has much larger impacts on the
results of food waste recovery than that on middling. The rotation speed of the
separator also demonstrated perceptible influences on both responses. This can
be explained by the centrifugal force generated by the rotating roller.
Centrifugal force plays a certain role to detach the wastes at the right point, in
addition to the attraction and pinning forces induced by the electrodes.
4.2.2 SNR analysis
The graphical representation of the SNR effect of design factors on the
maximal food waste recovery was shown in Figure 4.11. It showed that the
best situation happened at large particle size (4.0 mm) with 20 % water
content under a 60 rpm rotation speed and 25 kV of applied voltage. Similarly,
by analysing the graphical representation of the effect of design factors on the
minimal middling product shown in Figure 4.12, it was observed that large
particle size is preferable for its highest SNR value within the experimental
range. However, the water content of 20 % is not good for middling
minimisation, though it contributes to the maximal recovery of food waste.
Considering the water content does not have much influence on the middling
product as shown in Table 4.4, 20 % water content of food waste is an
optimum selection.

79
Figure 4.11: Effect of factors on SNR for maximal food waste recovery.
By studying the system factors in Figures 4.11 and 4.12, it can be seen
that a applied voltage of 25 kV and rotation speed of 60 rpm yield the best
maximal food waste recovery. Likewise, an applied voltage of 30 kV produces
the minimal middling product at rotation speed of 70 rpm. Therefore, a robust
design of food waste separation process can be achieved at an applied voltage
of 25-30 kV at the roller rotation speed of 60-70 rpm with particles of 4.0 mm
in size and 20% of water content. Having this set of condition achieved using

80
Taguchi’s method, the variations from random factors can be minimised and
the separation efficiency can be eventually enhanced.
Figure 4.12: Effect of factors on SNR for minimal middling product.
4.2.3 Summary
The robust design targets to limit the negative impact of the hard-to-
control random factors. The impacts of four factors, namely applied voltage,
rotation speed, water content and particle size diagonal were determined. It
81
was noticeable that the applied voltage has a significant impact on effective
recovery of food waste and reduction of middling product within the design
range. Besides, the SNR analysis revealed that the abovementioned functions
can be attained with 4.0 mm particle size of food waste and 20 % water
content, which to result in less error from the variations of noise.
4.3 Optimisation and Modelling
The parametric studies described in previous section have been used to
examine a number of system parameters of the electrostatic separator along
with different mixing ratio. Nevertheless, it is impractical to study every
potential parameter as it would be time-consuming and not cost-effectively.
Optimisation plays a role for such purposes in this section so as to examine the
parameters with great reduction of required experimental work.
A screening procedure by applying Plackett-Burman (PB) factorial
design was performed to minimise the number of experiments for
optimisation, and to indicate the significant parameters which influence the
efficiency of the responses. The parameters of eight practical factors, namely
potential level (F1), rotation speed (F2), corona electrode angle (F3), corona
electrode distance (F4), electrostatic electrode distance (F5), %FW content in
mixture (F6), mixture volume (F7), ambient temperature (F8), and three
dummy factors (D1, D2 and D3) were depicted in Table 4.5. The responses of
the FW separation efficiency (R1), middling product (R2) and NF separation
efficiency (R3) were also tabulated in the table.

82
Table 4.5: Screening with PB factorial design
F1
(kV)
F2
(rpm)
F3
(°)
F4
(mm)
F5
(mm)
F6
(%)
F7
(g)
F8
(°C)
D1 D2 D3 R1
(%)
R2
(g)
R3
(%)
20 90 50 60 40 40 100 28 -1 1 1 74.5 18.5 86.2
30 60 50 60 50 40 100 24 1 -1 1 83.8 13.1 89.0
30 90 30 50 40 60 100 28 1 -1 1 59.7 36.7 68.8
20 90 30 60 50 40 200 28 1 -1 -1 57.5 37.1 66.6
20 90 50 50 50 60 200 24 -1 -1 1 74.8 20.6 86.4
30 60 50 60 40 60 200 28 -1 -1 -1 83.6 14.2 89.1
30 60 30 50 50 40 200 28 -1 1 1 64.5 33.2 68.4
20 60 30 50 40 40 100 24 -1 -1 -1 61.3 32.9 71.0
20 60 30 60 40 60 200 24 1 1 1 61.1 35.1 70.6
20 60 50 50 50 60 100 28 1 1 -1 76.5 18.3 89.5
30 90 50 50 40 40 200 24 1 1 -1 77.9 15.4 89.2
30 90 30 60 50 60 100 24 -1 1 -1 59.5 36.6 69.3
In order to identify the main effects on the responses, Pareto analysis
was used to determine the influence of the independent factors (Zarei et al.,
2010). As can be seen from the Pareto chart shown in Figure 4.13a, three
factors were found to be statistically significant and above the t-value limit of
the FW separation efficiency, i.e. the corona electrode angle, rotation speed
and potential level. Likewise, the results for the middling product and NF
separation efficiency were deduced. As shown in Figure 4.13b, the Pareto
chart showed that the corona electrode angle, rotation speed and potential level
account for majority of the total effect on the middling mass. The Pareto chart
for the NF separation efficiency demonstrated that only two factors, namely
the corona electrode angle and rotation speed, were significant and lied above
the t-value as shown in Figure 4.13c. The ANOVA tables (Table 4.6 – 4.8)
confirm the significance of the model for each response and its significant

83
factors at p-value less than 0.05 (Bashir et al., 2010). No outliers were found
in the normal probability test.
Figure 4.13: Pareto charts for (a) FW separation efficiency; (b) middling; (c)
NF separation efficiency.

84
Table 4.6: ANOVA table for FW separation efficiency in PB design.
Source Sum of
squares
Degree of
freedom
Mean square value F-value p-value
Model 1068.56 3 356.19 279.73 <0.0001
F1 45.24 1 45.24 35.53 0.0003
F2 60.30 1 60.30 47.36 0.0001
F3 963.02 1 963.02 756.30 <0.0001
Table 4.7: ANOVA table for middling product in PB design.
Source Sum of
squares
Degree of
freedom
Mean square value F-value p-value
Model 1078.06 3 359.35 169.51 <0.0001
F1 14.74 1 14.74 6.95 0.0299
F2 27.30 1 27.30 12.88 0.0071
F3 1036.02 1 1036.02 488.69 <0.0001
Table 4.8: ANOVA table for NF separation efficiency in PB design.
Source Sum of
squares
Degree of
freedom
Mean square value F-value p-value
Model 1106.61 2 553.30 359.96 <0.0001
F2 10.27 1 10.27 6.68 0.0295
F3 1096.34 1 1096.34 713.24 <0.0001
In particular, the potential level and corona electrode angle provided
positive effect whereas the rotation speed gave the negative effect to the
separation efficiency as shown in Figure 4.13a. However, in Figure 4.13b, the
three factors exhibited an overall opposite effect on the middling product, and
it indicated that the separation efficiency can be enhanced by minimising the
middling product. It is in close agreement with our experiments which show

85
that the recovery of food waste increases with decreasing amount of unsorted
middling for a given amount of each test sample. Therefore, the middling
response is not included for further discussion, whereas separation efficiency
is focused in the next section for performance optimisation.
4.3.1 Operational process design analysis and optimisation
The PB factorial design identified three significant factors to be
optimised. The five factors that were not considered significant in the PB
design were set to low level when performing the experiments for
optimisation. A total of four responses was measured, namely FW separation
efficiency (S1), NF separation efficiency (S2), FW separation purity (P1) and
NF separation purity (P2). This study focused on optimising the separation
conditions by employing the central composite design (CCD) approach.
Three independent variables, namely, electrical potential (A), rotation
speed (B) and electrodes gap (C) were selected for the optimisation process.
The CCD design of the experiment was used to evaluate the influence of the
variables in 20 experiments, which consisted of 8 factorial points, 6 replica
center points and 6 axial points. Table 4.9 shows the levels and ranges of the
three independent variables involved. The CCD design matrix and the
corresponding experimental results were summarised in Table 4.10.

86
Table 4.9: Experimental levels of independent process factors.
Variable
Levels A: Potential
level (kV)
B: Rotation
speed (rpm)
C: Electrodes
gap (mm)
-α 16.59 49.77 39.77
Low (-1) 20.00 60.00 50.00
Center (0) 25.00 75.00 65.00
High (+1) 30.00 90.00 80.00
+α 33.41 100.23 90.23
The CCD approach extends the α-distance to both low and high levels.
These critical values of the potential level and rotation speed are still within
the capability of experimental apparatus, whereas the electrodes gap is
adjusted accordingly. Table 4.10 lists the experimental design matrix with the
corresponding evaluated values for the separation efficiency and purity. The
ANOVA results for quadratic models of S1, S2, P1 and P2 were tabulated in
Tables 4.11 – 4.14, respectively, whereas the polynomial equations were
deduced as equations 4.13 – 4.16.
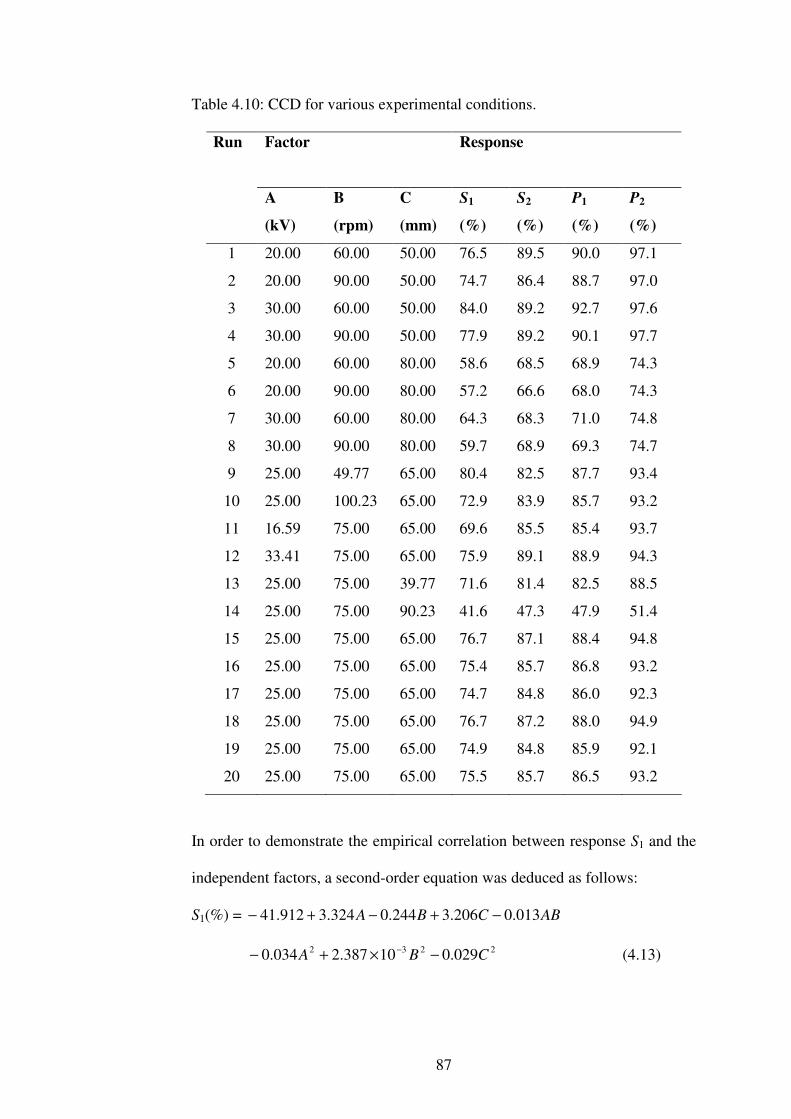
87
Table 4.10: CCD for various experimental conditions.
Factor Response
Run
A
(kV)
B
(rpm)
C
(mm)
S1
(%)
S2
(%)
P1
(%)
P2
(%)
1 20.00 60.00 50.00 76.5 89.5 90.0 97.1
2 20.00 90.00 50.00 74.7 86.4 88.7 97.0
3 30.00 60.00 50.00 84.0 89.2 92.7 97.6
4 30.00 90.00 50.00 77.9 89.2 90.1 97.7
5 20.00 60.00 80.00 58.6 68.5 68.9 74.3
6 20.00 90.00 80.00 57.2 66.6 68.0 74.3
7 30.00 60.00 80.00 64.3 68.3 71.0 74.8
8 30.00 90.00 80.00 59.7 68.9 69.3 74.7
9 25.00 49.77 65.00 80.4 82.5 87.7 93.4
10 25.00 100.23 65.00 72.9 83.9 85.7 93.2
11 16.59 75.00 65.00 69.6 85.5 85.4 93.7
12 33.41 75.00 65.00 75.9 89.1 88.9 94.3
13 25.00 75.00 39.77 71.6 81.4 82.5 88.5
14 25.00 75.00 90.23 41.6 47.3 47.9 51.4
15 25.00 75.00 65.00 76.7 87.1 88.4 94.8
16 25.00 75.00 65.00 75.4 85.7 86.8 93.2
17 25.00 75.00 65.00 74.7 84.8 86.0 92.3
18 25.00 75.00 65.00 76.7 87.2 88.0 94.9
19 25.00 75.00 65.00 74.9 84.8 85.9 92.1
20 25.00 75.00 65.00 75.5 85.7 86.5 93.2
In order to demonstrate the empirical correlation between response S1 and the
independent factors, a second-order equation was deduced as follows:
S1(%) = ABCBA 013.0206.3244.0324.3912.41 −+−+−
2232 029.010387.2034.0 CBA −×+−− (4.13)

88
where S1 was the separation efficiency of FW in terms of actual factors.
Besides, a polynomial equation was deduced for response S2:
S2(%) = CA 3.599+1.7151.364 −
2232 0.033-103.745-0.024+ CBA−
× (4.14)
where S2 was the separation efficiency of NF in terms of actual factors.
The purity of the FW separation, P1 was represented by a quadratic
polynomial in terms of the actual factors:
P1(%) = 20.034-3.647+0.0362-0.130+9.914- CCBA (4.15)
Concerning the purity of the NF separation, P2, the suggested model was
quadratic and the final equation in terms of actual factors was determined as:
P2(%) = 20.036-3.981+1.784- CC (4.16)
The factors with either synergistic or antagonistic effect on the
response were decided based on the positive or negative signs of the
regression coefficients. Tables 4.11 to 4.14 summarised the ANOVA results
for the efficiency and purity of the models. The model F-values of 258.17,
242.32, 373.69 and 332.84 for responses S1, S2, P1 and P2 respectively,
implied all the models were significant. The p-values were <0.0001 indicated
the adequacy of the models. The predicted R-Squared value of 0.9796 was in
close agreement with the adjusted R-Squared value of 0.9919 for S1. The
signal to noise ratio (adequate precision) of 65.257 indicated that the model

89
can be applied to navigate the design space. Like S1, the predicted R-Squared
of 0.9805 for S2 was close to the adjusted R-Squared of 0.9913. Adequate
precision of 58.178 (greater than 4) implied that the model S2 could also be
used in the design space navigation (Olmez, 2009). Regarding purity
responses P1 and P2, not much difference was observed between the R-
Squared values for both models.
Table 4.11: ANOVA results for quadratic model of S1.
Source Sum of
squares
Degree
of
freedom
Mean
square
value
F-value p-value Remarks
Model 1885.29 9 209.48 258.17 <0.0001 Significant
A 63.70 1 63.70 78.51 <0.0001 Significant
B 51.47 1 51.47 63.44 <0.0001 Significant
C 1121.41 1 1121.41 1382.10 <0.0001 Significant
AB 7.03 1 7.03 8.67 0.0147 Significant
A2 10.21 1 10.21 12.59 0.0053 Significant
B2 4.15 1 4.15 5.12 0.0471 Significant
C2 618.60 1 618.60 762.40 <0.0001 Significant
Residue 8.11 10 0.81
Lack of
fit
4.36 5 0.87 1.16 0.4370 Not
significant
Pure
error
3.75 5 0.75
Cor
Total
1893.41 19
R-squared: 0.9957; Adj R-Squared: 0.9919; Pred R-square: 0.9796; Adeq
precision: 65.257.

90
Table 4.12: ANOVA results for quadratic model of S2.
Source Sum of
squares
Degree
of
freedom
Mean
square
value
F-value p-value Remarks
Model 2274.32 9 252.70 242.32 <0.0001 Significant
A 8.31 1 8.31 7.97 0.0181 Significant
C 1421.86 1 1421.86 1363.45 <0.0001 Significant
A2 5.31 1 5.31 5.09 0.0477 Significant
B2 10.23 1 10.23 9.81 0.0106 Significant
C2 812.17 1 812.17 778.80 <0.0001 Significant
Residue 10.43 10 1.04
Lack of
fit
4.80 5 0.96 0.85 0.5672 Not
significant
Pure
error
5.63 5 1.13
Cor
Total
2284.75 19
R-squared: 0.9954; Adj R-Squared: 0.9913; Pred R-square: 0.9805; Adeq
precision: 58.178.

91
Table 4.13: ANOVA results for quadratic model of P1.
Source Sum of
squares
Degree
of
freedom
Mean
square
value
F-value p-value Remarks
Model 2351.64 9 261.29 373.69 <0.0001 Significant
A 13.12 1 13.12 18.76 0.0015 Significant
B 7.12 1 7.12 10.19 0.0096 Significant
C 1486.68 1 1486.68 2126.16 <0.0001 Significant
C2 823.34 1 823.34 1177.49 <0.0001 Significant
Residue 6.99 10 0.70
Lack of
fit
1.56 5 0.31 0.29 0.9016 Not
significant
Pure
error
5.43 5 1.09
Cor
Total
2358.63 19
R-squared: 0.9970; Adj R-Squared: 0.9944; Pred R-square: 0.9917; Adeq
precision: 74.855.

92
Table 4.14: ANOVA results for quadratic model of P2.
Source Sum of
squares
Degree
of
freedom
Mean
square
value
F-value p-value Remarks
Model 2718.60 9 302.07 332.84 <0.0001 Significant
C 1729.68 1 1729.68 1905.90 <0.0001 Significant
C2 959.35 1 959.35 1057.09 <0.0001 Significant
Residue 9.08 10 0.91
Lack of
fit
1.89 5 0.38 0.26 0.9158 Not
significant
Pure
error
7.19 5 1.44
Cor
Total
2727.68 19
R-squared: 0.9967; Adj R-Squared: 0.9937; Pred R-square: 0.9910; Adeq
precision: 68.008.
The good correlations R2 value for the efficiency and purity models
shown in Figures 4.14 and 4.15, respectively, indicated that there are only
minor difference between the real values and the theoretical values. The p-
values indicated the significance effect of the model, particularly when p-
value is less than 0.05. It is apparent that all the models were highly significant
as the p-values were <0.0001 (Tables 4.11 to 4.14). In addition, the
quantitative impact of three independent factors was determined by their p-
values. In the S1 model, the significant model terms were identified as A, B, C,
AB, A2, B
2, C
2 with p-values <0.05 (Table 4.11). All the independent factors,
i.e. A-potential level, B- rotation speed, C-electrode gap and second-order
effect of C-electrode gap have high significance effect on the separation
efficiency for p <0.0001. On the other hand, the parameters of A, C, A2, B
2, C
2

93
are significant variables for the S2 model. This model was mainly influenced
by the second-order but less significantly by the first-order effect of B-rotation
speed. The significant model terms for the P1 model were found as A, B, C, C2,
whereas the significant terms for the P2 model were C, C2. It is worth to note
that the purity models were mostly influenced by the C-electrode gap and its
second-order effect, but not the interaction effects amongst A-potential level,
B-rotation speed and C-electrode gap.

94
Figure 4.14: Predicted values versus actual values. (a) FW separation
efficiency; (b) NF separation efficiency.

95
Figure 4.15: Predicted values versus actual values. (a) FW separation purity;
(b) NF separation purity.
4.3.2 Surface plot analysis
Three-dimensional surface plots were generated to further study the
interactions between the independent factors A, B, C and the separation

96
conditions of the waste. The combined effects of factors A and B on the FW
separation efficiency was shown in Figure 4.16a. It showed that at an electrode
gap of 65 mm the separation efficiency increases with an increasing
magnitude of potential level and decreases with an increasing speed of roller
rotation. The surface plot indicated that the potential level has a synergistic
effect on corona charging of the waste granules. For instance, the separation
efficiency enhances from 69.6% to 76.7% with the increasing magnitude of
potential level from 16.59 kV to 25.0 kV when the rotation speed is
maintained at 75 rpm. The reason of this observation is that the size of the
particle test sample is not uniform, and thus a larger coulomb force is required
to treat the larger particles. It is generally known that Coulomb force relates
positively with potential supplied. Compared with the potential level, the
rotation speed demonstrated an antagonistic effect on the separation
performance. It was noted that the separation efficiency decreased from 80.4%
to 72.9% when the rotation speed increased from 49.77 rpm to 100.23 rpm and
the potential level was maintained at 25 kV. The reason is that the value of the
middling product increased with the increasing rotation speed (see Figure
4.13). The observed relation between the middling and rotation speed was in a
good agreement with the work from other researchers (Wu et al., 2008). The
highest value of separation efficiency of waste was obtained at the minimum
rotation speed and potential level closed to 30.0 kV.
Figure 4.16b demonstrates the correlated effects of factors A and B on
the FW separation efficiency with a constant speed of 75 rpm. It was obvious
that the separation efficiency increased with increasing potential level,

97
indicating a stronger electrostatic field enhances the induction charging of
conductive particles. For the electrode gap, the percentage of separation
efficiency firstly rose with increasing gap from 50 mm to 60 mm, and then
dropped progressively when the gap was beyond 60 mm. It indicated that 50
mm to 60 mm was the proper spacing to yield a uniformly extensive charge
distribution to enhance the separation efficiency (Xu et al., 2009). Therefore,
the efficiency dropped once it exceeded the proper range. Figure 4.16b also
demonstrates that the potential level and electrode gap have the synergistic
effect on the separation efficiency, and the highest value of efficiency could
achieve at the maximum potential level with a proper spacing of electrodes
approximately closed to 60 mm.
With a fixed potential level of 25 kV, the combined effects of factors B
and C on the FW separation efficiency was shown in Figure 4.16c. It was
apparent that the separation efficiency of waste decreased with increasing
rotation speed when the electrode gap was less than 60 mm. The reason is that
the unsorted middling increased with the rotation speed as discussed above.
Moreover, Figure 4.16c shows that the separation efficiency decreased with
increasing electrode gap after reaching the mentioned proper gap of 60 mm. It
is attributed to the weaker charge on the test particles. The highest value of the
FW separation efficiency was achieved at the minimum rotation speed with an
electrode gap of approximately closed to 60 mm.
Comparatively, surface plots for models S2, P1 and P2 were shown as
respective three-dimensional diagrams in Figures 4.17 - 4.19. The diagrams

98
exhibited how each of the models varied as a function of two-factor (A-
potential level and B-rotation speed, A-potential level and C-electrodes gap, B-
rotation speed and C-electrodes gap) interaction. It was apparent in Figure
4.17a that the NF separation efficiency did not increase continually with
increasing magnitude of potential level and rotation speed. This implies that
the optimal design points should be identified in order to determine the
optimal separation conditions.

99
Figure 4.16: Surface plots for combined effects of two independent factors on
FW separation efficiency. (a) Potential level and rotation speed (electrodes
gap = 65 mm); (b) Potential level and electrodes gap (rotation speed = 75
rpm); (c) Rotation speed and electrodes gap (potential level = 25 kV)

100
Figure 4.17: Surface plots for combined effects of two independent factors on
NF separation efficiency (a) Potential level and rotation speed (electrodes gap
= 65 mm); (b) Potential level and electrodes gap (rotation speed = 75 rpm); (c)
Rotation speed and electrodes gap (potential level = 25 kV)

101
Figure 4.18: Surface plots for combined effects of two independent factors on
FW separation purity (a) Potential level and rotation speed (electrodes gap =
65 mm); (b) Potential level and electrodes gap (rotation speed = 75 rpm); (c)
Rotation speed and electrodes gap (potential level = 25 kV)

102
Figure 4.19: Surface plots for combined effects of two independent factors on
NF separation purity (a) Potential level and rotation speed (electrodes gap = 65
mm); (b) Potential level and electrodes gap (rotation speed = 75 rpm); (c)
Rotation speed and electrodes gap (potential level = 25 kV)

103
4.3.3 Model optimisation and validation
Optimisation was performed to identify the optimum operational
conditions for electrostatic separation. This study defined the optimal
separation conditions so as to have maximisation models of the separation
efficiency (S1, S2) and purity (P1, P2). This allows the minimisation of
unsorted and misclassified products. Based on the design range tabulated in
Table 4.9, the optimal conditions were found at the potential level of 30 kV,
roller rotation of 60 rpm and electrode gap of 54 mm. The minimum middling
percentage of 12.7% (volume 100g) was also obtained. In order to validate the
statistical experimental strategies, a triplicate set of experiments was
performed at the specified optimum conditions and an average FW separation
efficiency of 84.2% was achieved. A comparison between the observed and
predicted values was summarised in Table 4.15. The experimental value
agreed well with the predicted value. It indicated the validity of the model and
the success of RSM in optimising the FW separation from waste mixture.
Table 4.15: Comparison results of observation and prediction.
Model Observed
value (%)
Predicted
value (%)
Percentage
of error (%)
FW separation efficiency 84.20 83.88 0.38
NF separation efficiency 88.70 89.51 0.91
FW separation purity 93.00 92.89 0.12
NF separation purity 98.50 97.97 0.54

104
4.3.4 Summary
The response surface methodology was used to optimise the separation
conditions and to decide on the significant terms. Prior to optimisation, the PB
screening procedure was applied to conclude that the separation conditions
were mainly influenced by three factors (in the order of statistical
significance): electrode gap, rotation speed and electrical potential level. Thus,
the determination of optimal conditions was performed by employing the CCD
approach. The CCD design shown that the three factors, namely A-potential
level, B-rotation speed and C-electrode gap were statistically significant to the
separation efficiency, whereas the C-electrode gap and its second-order effect
played a key role for the separation purity. The optimum separation conditions
were potential level / rotation speed / electrode gap = 30 kV / 60 rpm / 54 mm,
and the maximum FW efficiency / NF efficiency / FW purity / NF purity was
84.2% / 88.7% / 93.0% / 98.5% with a minimum middling product of 12.7%.
The quality control concerning the predictability of the model is very
satisfactory.

105
CHAPTER FIVE
CONCLUSION AND FURTHER WORKS
5.1 Introduction
The work has extended the knowledge from electrostatic
separator and provided discussion on improved separator
configurations, which enhances the separation quality of food waste
and non-food particles. The force model analysis which includes the
centrifugal force, electrostatic force and corona image force was
elucidated. The influential effects of the parameters on the separation
efficiency have been described, and the variations of undesired random
factors have been investigated. A mathematical surface model has been
derived in this study, and the optimal operational condition was
calculated from the model. Overall speaking, the results of this study
have contributed to the fundamental knowledge required for future
utilisation of practical electrostatically driven food waste separator.
5.2 Conclusion
The main findings of the study are summarised as follows:
1. Based on the force model, the applied voltage and rotation speed
are the dominant factors of the separation process. Theoretically,

106
the increment of either or both factors enhances the separation
efficiency of food waste at a predetermined angle of the corona
electrode, γ. For non-food separation, the change of the applied
voltage is associated with the value of the rotation speed, assuming
the surface charge density and corona electrode angle are fixed.
2. Above the applied voltage of 15 kV, the separation efficiency and
purity of both food and non-food particles enhanced with the
increment of voltage. The recovered mass of food particles
positively correlates to higher voltage and shorter angular position
of electrodes, whereas the middling mass decreases in the same
manner. The effect of the rotation speed is not able to predict from
the parametric study.
3. The size and moisture of the particles affect the density,
conductivity and surface resistivity, which in turn influent the
separation results. Thus, the values of hard-to-control parameters of
the particles should be fixed so as to minimise their impacts on the
analysis of the system design factors.
4. The prediction from the response surface methodology confirms
that the maximal separation result could be achieved at high
voltage level under the optimal speed and angle. Although one may
be able to further enhance the efficiency by utilising higher
voltage, the optimisation model provides an alternative to reduce

107
the dependent on the costly power supply for generating a
comparable outcome.
5.3 Further Work
The recommendations for further works are concluded as follows:
1. The electrostatic separator research could be extended to evaluate
and recover other waste samples, e.g. food grain in order to reduce
the waste disposal into the landfill. The relevant integrator system
shall thus be studied.
2. The separation efficiency may be improved by employing a double
roller design separator, or re-depositing the separated particles onto
the roller for a second round of process.
3. The Life-Cycle Assessment could be performed to assess the
balance point within the energy usage of the high voltage, energy
generation of the biogas from the separated food waste, and also the
return on investment of developing a large scale of separator based
on the electrostatical method as described.

108
LIST OF REFERENCES
Aggarwal, A., Singh, H., Kumar, P. and Singh, M., 2010. Optimizing power
consumption for CNC turned parts using response surface methodology and
Taguchi’s technique – A comparative analysis. Journal of Materials
Processing Technology, 200, pp. 373-384.
Aman, F., Morar, R., Kohnlechner, R., Samuila, A. and Dascalescu, L., 2004.
High-voltage electrode position: a key factor of electrostatic separation
efficiency. IEEE Transactions on Industry Applications, 40(3), pp. 905-910.
Aravind, J., Lenin, C., Nancyflavia, C., Rashika, P. and Saravanan, S., 2015.
Response surface methodology optimization of nickel (II) removal using
pigeon pea pod biosorbent. International Journal of Environmental Science
and Technology, 12, pp. 105-114.
Badgie, D., Samah, M.A.A., Manaf, L.A. and Muda, A.B., 2011. Assessment
of municipal solid waste composition in Malaysia: Management, practice and
challenges. Polish Journal of Environmental Studies, 21, pp. 539-547.
Basavarajappa, S., Chandramohan, G. and Davim, J.P., 2008. Some studies on
drilling of hybrid metal matrix composites based on Taguchi techniques.
Journal of Materials Processing Technology, 1(3), pp. 332-338.
Bashir, M.J.K., Aziz, H.A., Yusoff, M.S., Aziz, S.Q. and Mohajeri, S., 2010.
Stabilized sanitary landfill leachate treatment using anionic resin: Treatment
optimization by response surface methodology. Journal of Hazardous
Materials, 182, pp. 115-122.
Bashir, M.J.K, Aziz, H.A., Yusoff, M.S. and Adlan, M.N., 2010. Application of
response surface methodology (RSM) for optimizatio of ammoniacal nitrogen
removal from semi-aerobic landfill leachate using ion exchange resin.
Desalination, 254, pp. 154-161.
Bendaoud, A., Tilmatine, A., Medles, K., Rahli, M., Huzau, M. and
Dascalescu, L., 2008. Charaterization of dual corona-electrostatic electrodes
for electrostatic processes applications. IEEE Transactions on Industry
Applications, 44(3), pp. 692-698.

109
Besseris, G.J., 2014. Multi-response non-parametric profiling using Taguchi’s
qualimetric engineering and neurocomputing methods: Screening a foaming
process in a solar collector assembly. Applied Soft Computing, 22, pp. 222-
237.
Calin, L., Neamtu, V., Morar, R., Iuga, A., Samuila, A. and Dascalescu, L.,
2008. Tribocharging of granular plastic mixtures in view of electrostatic
separation. IEEE Transactions on Industry Applications, 44(4), pp. 1045-1051.
Camposeco-Negrete, C., 2013. Optimization of cutting parameters for
minimizing energy consumption in turning of AISI6061 T6 using Taguchi
methodology and ANOVA. Journal of Cleaner Production, 53, pp. 195-203.
Chang, J.S., Crowley, J.M. and Kelly, A.J., 1995. Handbook of Electrostatic
Processes, Marcel Dekker Inc.: New York.
Chian, E.S. and De Walle, F.B., 1976. Sanitary landfill leachates and their
treatment. Journal of Environmental Engineering (ASCE), 102, pp. 411-431.
Chiang, M.Y. and Hsieh, H.H., 2009. The use of the Taguchi method with grey
relational analysis to optimize the thin-film sputtering process with multiple
quality characteristic in color filter manufacturing. Computers & Industrial
Engineering, 2, pp. 648-661.
Chou, C.S., Ho, C.Y. and Huang, C.I., 2009. The optimum conditions for
combination of magnetic particles driven by a rotating magnetic field using
the Taguchi method. Advanced Powder Technology, 20(1), pp. 55-61.
Christensen, T.H., Kjeldsen, P., Bjerg, P.L., Jensen, D.L., Christensen, J.B.,
Baun, A., Albrechtsen, H.J. and Heron, G.., 2001. Biogeochemistry of landfill
leachate plumes. Applied Geochemistry, 16, pp. 659-718.
Chua, K.H., Sahid, E.J.M., Leong, Y.P., 2011. Sustainable municipal solid
waste management and GHG abatement in Malaysia. Green and Energy
Management, 04-02, pp. 1-8.
Comakli, K, Simsek, F., Comakli, O. and Sahin, B., 2009. Determination of
optimum working conditions R22 and R404A refrigerant mixtures in heat-
pumps using Taguchi method. Applied Energy, 86(11), pp. 2451-2458.

110
Dascalescu, L., Samuila, A., Mihalcioiu, A., Bente, S. and Tilmatine, A., 2005.
Robust design of electrostatic separation process. IEEE Transactions on
Industry Applications, 41(3), pp. 715-719
Dascalescu, L., 2008. Robust corona-electrostatic separation method for solid
waste recycling. International Journal of Environment and Waste
Management, 2(4/5), pp. 423-435.
Davidson, M.J., Balasubramaniam, K. and Tagore, G.R.N., 2008. Experimental
investigation on flow-forming of AA6061 alloys a Taguchi approach. Journal
of Materials Processing Technology, 1(3), pp. 283-287.
Desideri, U., Di Maria, F., Leonardi, D. and Proietti, S., 2003. Sanitary landfill
energetic potential analysis: A real case study. Energy Conversion and
Management, 44, pp. 1969-1981.
Elder, J., Yan, E. and Raiser, G., 2003. eForce - Newest generation of
electrostatic separator for the mineral sands industry. In: Heavy Minerals
Conference. South Africa Institute of Mining and Metallurgy.
FAOSTAT, 2012. Food Balance Sheets 2009. [online] Available at:
<http://faostat.fao.org/site/354/default.aspx> [Accessed 20 August 2012].
Galway Country Council, 2013. Waste Management. [online] Available at:
<http://www.galway.ie/en/Services/Environment/WasteManagement/>
[Accessed 22 March 2013].
Garnett, T., 2006. Fruit and vegetables and UK greenhouse gas emissions:
Exploring the relationship. UK: Food and Climate Research Network,
University of Surrey.
Gustavsson, J., 2010. The Climate Change Impact of Retail Waste from
Horticultural Products. MSc. University of Gothenburg, Sweden.
Harper, W.R., 1967. Contact and frictional electrification. Monographs on the
Physics and Chemistry of Materials. Clarendon Press: Oxford.
Holm-Nielsen, J.B., Al Seadi, T., Oleskowicz-Popiel, P., 2009. The future of
anaerobic digestion and biogas utilization. Bioresource Technology, 100, pp.
5478-5484.

111
Hou, S., Wu, J., Qin, Y and Xu, Z., 2010. Electrostatic separation for recycling
waste printed circuit board: a study on external factor and a robust design for
optimization. Environmental Science & Technology, 44, pp. 5177-5181.
Hsu, W.H., Chao, C.K., Hsu, H.C., Lin, J. and Hsu, C.C., 2009. Parametric
study on the interface pullout strength of the vertebral body replacement cage
using FEM-based Taguchi method. Medical Engineering & Physics, 31(3), pp.
287-294.
Iuga, A., Morar, R., Dascalescu, L., Samuila, A. and Rafiroiu, D., 1993. A new
type of corona electrode for high-tension separators. Magnetic and Electrical
Separation, 4, pp. 75–90.
Iuga, A., Morar, R., Samuila, A. and Dascalescu, L., 2001. Electrostatic
separation of metals and plastics from granular industrial wastes. IEE
Proceedings - Science, Measurement and Technology, 148(2), pp. 47–54.
Iuga, A., Cuglesan, I., Samuila, A., Blajan, M., Vadan, D. and Dascalescu, L.,
2004. Electrostatic separation of muscovite mica from feldspathic pegmatics.
IEEE Transactions on Industry Applications, 40(2), pp. 422-429.
Jaffrin, A., Bentounes, N., Joan, A.M. and Makhlouf, S., 2003. Landfill biogas
for heating greenhouses and providing carbon dioxide supplement for plant
growth. Biosystems Engineering, 86, pp. 113-123.
Kathirvale, S., Muhd Yunus, M.N., Sopian, K. and Samsuddin, A.H., 2004.
Energy potential from Municipal Solid Waste in Malaysia. Renewable Energy,
29(4), pp. 559-567.
Keles, O., 2009. An optimization study on the cementation of silver with
copper in nitrate solutions by Taguchi design. Hydrometallurgy, 95, pp. 333-
336.
Kiewiet, C., Bergougnou, M.A. and Brown, J.D., 1978. Electrostatic
separation of fine particle in vibrates fluidized beds. IEEE Transactions on
Industry Applications, 6, pp. 526-530.
Kjeldsen, P., Barlaz, M.A., Rooker, A.P., Baun, A., Ledin, A. and Christensen,
T.H., 2002. Present and long-term composition of MSW landfill leachate: A
112
review. Critical Reviews in Environmental Science and Technology, 32, pp.
297-336.
Kofoworola, O.F., 2007. Recovery and recycling practices in municipal solid
waste management in Lagos, Nigeria. Waste Management, 27, pp. 1139-1143.
Lawver, J.E. and Dyrenforth, W.P., 1973. Electrostatic separation in
electrostatics and its applications. New York: Wiley.
Le Man, H., Behera, S.K. and Park, H.S., 2010. Optimization of operational
parameters for ethanol production from Korean food waste leachate.
International Journal of Environmental Science and Technology, 7, pp. 157-
164.
Lee, C.-Y. and Lee, Z.-J., 2012. A novel algorithm applied to classify
unbalanced data. Applied Soft Computing, 12(8), pp. 2481-2485.
Li, J., Lu, H., Guo, J., Xu, Z. and Zhou, Y., 2007. Recycle technology for
recovering resources and products from waste printed circuit boards.
Environmental Science and Technology, 41, pp. 1995-2000.
Lin, C.S.K., Pfaltzgraff, L.A., Herrero-Davila, L., Mufobu, E.B., Abderrahim,
S., Clark, J.H. et al., 2013. Food waste as a valuable resource for the
production of chemicals, materials and fuels. Current situation and global
perspective, Energy & Environmental Science, 6(2), pp. 426-464.
Lin, Y.C., Chen, Y.F., Wang, D.A. and Lee, H.S., 2009. Optimization of
machining parameters in magnetic force assisted EDM based on Taguchi
method. Journal of Materials Processing Technology, 7, pp. 3374-3383.
Lindmark, J., Leksell, N., Schnürer, A. and Thorin, E., 2012. Effects of
mechanical pre-treatment on the biogas yield from ley crop silage. Applied
Energy, 97, pp. 498-502.
Lu, H., Li, J., Guo, J., Xu, Z., 2008. Movement behavior in electrostatic
separation: Recycling of metal materials from waste printed circuit board.
Journal of Materials Processing Technology, 197, pp. 101-108.
Magdalena, V. and Dana, A., 2014. Can vegetation indicate a municipal solid
waste landfill’s impact on the environment? Polish Journal of Environmental

113
Studies, 23(2), pp. 501-509.
Mahapatra, S.S., Patnaik, A. and Satapathy, A., 2008. Taguchi method applied
to parametric appraisal of erosin behaviour of GF-reinforced polyester
composites. Wear, 1(2), pp. 214-222.
Manaf, L.A., Samah, M.A.A., Zukki, N.I.M., 2009. Municipal Solid Waste
management in Malaysia: Practice and challenges. Waste Management, 29, pp.
2902-2906.
Masui, N., 1982. Electrostatic separation for removal from green tea of stems
and from food of impurities. Proceedings of the IEJ, 6(3), pp.159-162.
McMilan, J.D., 1997. Bioethanol production: status and prospects. Renewable
Energy, 10, pp. 295-302.
Meen-Chee, H. and Narayanan, S., 2006. Restoring the shine to a pearl:
Recycling behaviour in Penang, Malaysia. Development and Change, 37, pp.
1117-1136.
Mohabuth, N. and Miles, N., 2005. The recovery of recyclable materials from
waste electrical and electronic equipment (WEEE) by using vertical vibration
separation. Resources, Conservation and Recycling, 45(1), pp. 60-69.
Moukamnerd, C., Kawahara, H. and Katakur, Y., 2013. Feasibility study of
ethanol production from food Wastes by consolidated continuous solid-state
fermentation. Journal of Sustainable Bioenergy Systems, 3, pp. 143-148.
Murata, Y., Masui, N., Miyazawa, S. and Inculet, I.I., 1982. Non-uniform AC
field electrostatic separator. In: Conference paper of the IEJ, pp. 293-294.
National Solid Waste Management Department, 2013. [online] Available at:
<http://www.kpkt.gov.my/jpspn_en_2013/main.php> [Accessed 11 June
2013].
Parfitt, J., Barthel, M. and Macnaughton, S., 2010. Food waste within food
supply chains: quantification and potential for change to 2050. Philosophical
Transactions of the Royal Society, 365, pp. 3065-3081.

114
Periathamby, A., Hamid, F.S. and Khidzir, K., 2009. Evolution of solid waste
management in Malaysia: Impacts and implications of the solid waste bill,
2007. Journal of Material Cycles and Waste Management, 11, pp. 96-103.
Ravishankar, S.A. and Kolla, H., 2009. Chemical enhanced electrostatic
separation. In: 7th International Heavy Mineral Conference 'What next', The
South African Institute of Mining and Metallurgy, pp.203-206.
Renou, S., Givaudan, J.G., Poulain, S., Dirassouyan, F. and Moulin, P., 2008.
Landfill leachate treatment: Review and opportunity. Journal of Hazardous
Materials, 150, pp. 468-493.
Rezouga, M., Tilmatine, A., Ouiddir, R. and Medles, K., 2009. Experimental
modelling of the breakdown voltage of air using design of experiments.
Advances in Electrical and Computer Engineering, 9, pp. 41-45.
Ruan, J. and Xu, Z., 2012. Approaches to improve separation efficiency of
eddy current separation for removing aluminium from waste toner cartridges.
Environmental Science and Technology, 46, pp. 6214-6221.
Saeed, M.O., Hassan, M.N. and Mujeebu. M.A., 2009. Assessment of
municipal solid waste generation and recyclable materials potential in Kuala
Lumpur, Malaysia. Waste Management, 19, pp. 2209-2213.
Samsudin, M.D.M. and Don, M.M., 2013. Municipal solid waste management
in Malaysia: Current practices, challenges and prospect, Jurnal Teknologi,
62(1), pp. 95-101.
Samuila, A., Urs, A., Iuga, A., Morar, R., Aman, F. and Dascalescu, L., 2005.
Optimization of corona electrode position in roll-type electrostatic separators.
IEEE Transactions on Industry Applications, 41(2), pp. 527-534.
Schütze, A., James, Y.J., Steven, E.B., Park, J.Y., Gary, S.S. and Robert, F.H.,
1998. The atmospheric pressure plasma jet: A review and comparison to other
plasma sources. IEEE Transactions on Plasma Science, 26(6), pp. 1685-1694.
Senthilkumar, K., Senthikumaar, J.S. and Srinivasan, A., 2013. Reducing
surface roughness by optimising the turning parameters. The South African
Journal of Industrial Engineering, 24(2), pp. 78-87.

115
Srinu Naik, S. and Pydi Setty, Y., 2014. Optimization of parameters using
response surface methodology and genetic algorithm for biological
denitrification of wastewater. International Journal of Environmental Science
and Technology, 11, pp. 823-830.
Stuart, T., 2009. Waste - Uncovering the global food scandal. New York: W.W.
Norton and Company.
Tagaris, E., Sotiropoulou, R.E.P., Pilinis, C. and Halvadakis, C.P., 2003. A
methodology to estimate odors around landfill sites: The use of methane as an
odor index and its utility in landfill sitting. Journal of the Air and Waste
Management Association, 53, pp. 629-634.
Taguchi, G., 1986. Introduction to quality engineering: designing quality into
products and processes. Tokyo: Asian Productivity Organization.
Taherzadeh, M.J. and Karimi, K., 2008. Pretreatment of lignocellulosic wastes
to improve ethanol and biogas production: a review. International Journal of
Molecular Sciences, 9, pp. 1621–1651.
Tammemagi, H.Y. and Tammemagi, H., 1999. The waste crisis: landfills,
incinerators, and the search for a sustainable future. New York: Oxford
University Press.
Toraguchi, M. and Haga, K., 1982. Electrostatic separation of coal.
Proceedings of the IEJ, 6(3), pp.139-147
Van Wyk, J.P.H, 2001. Biotechnology and the utilization of biowaste as a
resource for bioproduct development. Trends in Biotechnology, 19(5), pp. 172-
177.
Vavouraki, A.I., Volioti, V. and Kornaros, M.E., 2014. Optimization of thermo-
chemical pretreatment and enzymatic hydrolysis of kitchen wastes. Waste
Management, 34, pp. 167-173.
Veit, H.M., Diehl, T.R., Salami, A.P., Rodrigues, J.S., Bernardes, A.M. and
Tenorio, J.A.S., 2005. Utilization of magnetic and electrostatic separation in
the recycling of printed circuit boards scrap. Waste Management, 25, pp. 67-
74.
Vlad, I., Campeanu, A., Enache, S. and Petropol, G., 2014. Operation

116
characteristics optimization of low power three-phase asynchronous motors.
Advances in Electrical and Computer Engineering, 14, pp. 87-92.
Wagenaars, E., 2006. Plasma breakdown of low-pressure gas discharges. PhD,
Technische Universiteit Eindhoven, Eindhoven.
Wang, Q., Ma, H., Xuc, W., Gong, L., Zhang, W. and Zou, D., 2008. Ethanol
production from kitchen garbage using response surface methodology.
Biochemical Engineering Journal, 39, pp. 604-610.
Weitz, K.A., Thorneloe, S.A., Nishtala, S.R., Yarkosky, S. and Zannes, M.,
2002. The impact of municipal solid waste management on greenhouse gas
emissions in the United States. Journal of the Air and Waste Management
Association, 52(9), pp. 1000-1011.
Whalen, S.C., Reeburgh, W.S. and Sandbeck, K.A., 1990. Rapid methane
oxidations in a landfill cover soil. Applied and Environmental Microbiology,
56, pp. 3405-3411.
Wu, J., Li, J. and Xu, Z., 2008. Electrostatic separation for multi-size granule
of crushed printed circuit board waste using two-roll separator. Journal of
Hazardous Materials, 159, pp. 230-234.
Xu, C., Chen, W. and Hong, J., 2014. Life-cycle environmental and economic
assessment of sewage sludge treatment in China. Journal of Cleaner
Production, 67, pp. 79-87.
Xu, Z.M., Li, J., Lu, H.Z. and Wu, J., 2009. Dynamics of conductive and
nonconductive particles under high-voltage electrostatic coupling fields.
Sciences in China Series E: Technological Sciences, 52(8), pp. 2359-2366.
Xue, M., Li, J. and Xu, Z., 2012. Environmental friendly crush-magnetic
separation technology for recycling metal-plated plastics from end-of-life
vehicles. Environmental Science and Technology, 46, pp. 2661-2667.
Yamane, L.H., de Moraes, V.T., Espinosa, D.C.R. and Tenório, J.A.S., 2011.
Recycling of WEEE: Characterization of spent printed circuit boards from
mobile phones and computers. Waste Management, 31(12), pp. 2553-2558.
Younes, M., Tilmatine, A., Medles, K., Rahli, M., and Dascalescu, L., 2007.

117
Numerical modeling of conductive particle trajectories in roll-type corona-
electrostatic separators. IEEE Transactions on Industry Applications, 43(5),
pp. 1130-1136.
Zarei, M., Niaei, A., Salari, D. and Khataee, A., 2010. Application of response
surface methodology for optimization of peroxi-coagulation of textile dye
solution using carbon nanotube-PTFE cathode. Journal of Hazardous
Materials, 173 (1–3), pp. 544–551.

118
LIST OF ORIGINAL PUBLICATIONS
Journal publications:
1. KoonChun Lai, SooKing Lim, PehChiong Teh, KimHo Yeap (2015).
Modeling and optimization of biowaste segregation from MSW: An
approach of landfills treatment and reduction, Research Journal of
Applied Sciences, Engineering and Technology. (Scopus indexed, in
press)
2. KoonChun Lai, SooKing Lim, PehChiong Teh (2015). Optimization
of electrostatic separation process for maximizing biowaste recovery
using Taguchi method and ANOVA, Polish Journal of Environmental
Studies, 24(3). DOI: 10.15244/pjoes/30927 (ISI indexed, in press)
3. KoonChun Lai, SooKing Lim, PehChiong Teh, Kimho Yeap (2014).
Key factors of the electrostatic separator for solid waste segregation,
ScienceAsia. (ISI indexed, in press)
4. KoonChun Lai, SooKing Lim, PehChiong Teh (2014). Electrostatic
separation in recovering the food from solid waste, World Applied
Sciences Journal, 32(7): 1296-1303. (Scopus indexed)
Conference papers:
1. KoonChun Lai, SooKing Lim, PehChiong Teh (2014). Optimization
of the electrostatic separator for food waste segregation, International
Conference on Mathematics, Engineering and Industrial Applications
(ICoMEIA 2014), Penang, Malaysia, 28 – 30 May 2014. (Paper ID 211)
2. KoonChun Lai, SooKing Lim, PehChiong Teh (2013). Application
and optimization of a plasma discharge bubble jet for water treatment,
Proceedings of 6th International Engineering Conference, Energy and
Environment (ENCON 2013), Sarawak, Malaysia, 1 – 4 July 2013,
ISBN: 978-981-07-6059-5, pp. 187 – 192.
3. KoonChun Lai, SooKing Lim, PehChiong Teh, KimHo Yeap,
YunThung Yong (2013). Study of a plasma discharge bubble jet:
Design and optimization in water treatment, 8th International

119
Conference on Multiphase Flow (ICMF), Jeju, South Korea, 26 – 31
May 2013.
4. Lai Koon Chun, Lim Soo King, Aissa Boudjella and Yeap Kim Ho
(2011). Protection against human body electrostatic discharge in
manufacturing, Advanced Process and System in Manufacturing
(APSIM), Kuala Lumpur, Malaysia, 14 – 15 December 2011, Paper
AP62.