Embed Size (px)
Citation preview

NREL is a national laboratory of the U.S. Department of Energy, Office of Energy Efficiency & Renewable Energy, operated by the Alliance for Sustainable Energy, LLC.
Contract No. DE-AC36-08GO28308
Design and Evaluation of a Net Zero Energy Low-Income Residential Housing Development in Lafayette, Colorado Jesse Dean and Otto VanGeet National Renewable Energy Laboratory
Scott Simkus Boulder County Housing Authority
Mark Eastment Mountain Energy Partnership
Technical Report NREL/TP-7A40-51450 March 2012

NREL is a national laboratory of the U.S. Department of Energy, Office of Energy Efficiency & Renewable Energy, operated by the Alliance for Sustainable Energy, LLC.
National Renewable Energy Laboratory 1617 Cole Boulevard Golden, Colorado 80401 303-275-3000 • www.nrel.gov
Contract No. DE-AC36-08GO28308
Design and Evaluation of a Net Zero Energy Low-Income Residential Housing Development in Lafayette, Colorado Jesse Dean and Otto VanGeet National Renewable Energy Laboratory
Scott Simkus Boulder County Housing Authority
Mark Eastment Mountain Energy Partnership
Prepared under Task No. PVC992Y6
Technical Report NREL/TP-7A40-51450 March 2012

NOTICE
This report was prepared as an account of work sponsored by an agency of the United States government. Neither the United States government nor any agency thereof, nor any of their employees, makes any warranty, express or implied, or assumes any legal liability or responsibility for the accuracy, completeness, or usefulness of any information, apparatus, product, or process disclosed, or represents that its use would not infringe privately owned rights. Reference herein to any specific commercial product, process, or service by trade name, trademark, manufacturer, or otherwise does not necessarily constitute or imply its endorsement, recommendation, or favoring by the United States government or any agency thereof. The views and opinions of authors expressed herein do not necessarily state or reflect those of the United States government or any agency thereof.
Available electronically at http://www.osti.gov/bridge
Available for a processing fee to U.S. Department of Energy and its contractors, in paper, from:
U.S. Department of Energy Office of Scientific and Technical Information P.O. Box 62 Oak Ridge, TN 37831-0062 phone: 865.576.8401 fax: 865.576.5728 email: mailto:[email protected]
Available for sale to the public, in paper, from:
U.S. Department of Commerce National Technical Information Service 5285 Port Royal Road Springfield, VA 22161 phone: 800.553.6847 fax: 703.605.6900 email: [email protected] online ordering: http://www.ntis.gov/help/ordermethods.aspx
Cover Photos: (left to right) PIX 16416, PIX 17423, PIX 16560, PIX 17613, PIX 17436, PIX 17721
Printed on paper containing at least 50% wastepaper, including 10% post consumer waste.

iii
Acknowledgments
The authors would like to thank all of the team members for their creativity, persistence and willingness to support this project. The members of the BCHA team who created the strategic vision for the project and successfully executed the demonstration include Scott Simkus, Frank Alexander, and Chuck Schloz. HB&A architects and Farnsworth group engineers worked with all of the project partners to integrate high performance building systems into an architecturally significant building design, including Steve Powell, Tino Leone, and Corey Chinn. Colorado School of Mines Geophysics Department conducted the very first EM tests in 2008 to verify a low risk of mine subsidence and prepared a critically important report for BCHA that illustrated low mine subsidence and the presence of an underground aquifer that substantiated the case to further explore GSHP for the main site. Major Geothermal provided GSHP design and modeling support. Various members of NREL’s residential buildings research team provided modeling and technology selection support, including Paul Norton, Craig Christensen, Scott Horowitz, and Neal Kruis. Mountain Energy Partnership provided assistance with the installation of the data acquisition system and analysis of metered performance data. Finally, the project would not have been possible without financial support from the City of Denver through the DOE Solar America Cities program and support from the City of Denver’s Greenprint Denver program, including Scott Morrissey and Steve Palmeri.
iv
Acronyms and Abbreviations
AHRI air conditioning, heating and refrigeration institute
AHU air handling unit
AFUE annual fuel utilization efficiency
BCHA Boulder County Housing Authority
Btu British thermal units
CFLs compact fluorescent lights
CT current transducer
DAS data acquisition system
DB dry bulb temperature
DC-kW direct-current kilowatt
DEER Database for Energy Efficient Resources
DHW domestic hot water
EAT entering air temperature
ELA effective leakage area (in2)
ERV energy recovery ventilator
EWT entering water temperature
GHG greenhouse gas
GSHP ground source heat pump
HERS Home Energy Rating System
HVAC heating, ventilating, and air conditioning
IBS Innovative Business Systems
IECC International Energy Conservation Code
kW kilowatt
kWh kilowatt-hour

v
L liter
LBNL Lawrence Berkley National Laboratory
MBtu million British thermal units
MEP Mountain Energy Partnership
MMBtu million British thermal units
NAHB National Association of Home Builders
NFRC National Fenestration Rating Council
NREL National Renewable Energy Laboratory
NZE net zero energy
PV photovoltaic
RESNET Residential Energy Services Network
s second
SAM Solar Advisor Model
SHGC solar heat gain coefficient
SLA standard leakage area
SWH solar water heating
VT visible transmittance
WB wet bulb temperature
yr year

vi
Contents
1 Introduction ....................................................................................................................... 1
1.1 Background ......................................................................................................................... 1
2 Paradigm Pilot Project ..................................................................................................... 3 2.1 Setting Performance Objectives .......................................................................................... 6 2.2 Building Envelope Characteristics .................................................................................... 12 2.2.1 Wall Construction ......................................................................................................... 12 2.2.2 Roof Construction ......................................................................................................... 12 2.2.3 Window Construction ................................................................................................... 13 2.2.4 PV Systems ................................................................................................................... 13 2.3 The Duplex Design ........................................................................................................... 13 2.4 The Single-Family Ranch Design ..................................................................................... 19 2.5 Manufactured Housing...................................................................................................... 27 2.6 Green Jobs Training Program ........................................................................................... 28
3 Performance Testing ....................................................................................................... 29 3.1 Short-Term Testing Procedure .......................................................................................... 29 3.2 Long-Term Testing Procedure .......................................................................................... 29 3.3 Single-Family Residence .................................................................................................. 31 3.3.1 Short-Term Test Results ............................................................................................... 31 3.3.2 Long-Term Test Results ............................................................................................... 33 3.3.3 GSHP Analysis ............................................................................................................. 35 3.3.4 DSH Analysis................................................................................................................ 38 3.3.5 Temperature Set-points ................................................................................................. 38 3.4 Duplex Analysis Results ................................................................................................... 40 3.4.1 Short-Term Test Results ............................................................................................... 40 3.4.2 Long-Term Test Results ............................................................................................... 41 3.4.3 Solar Domestic Hot Water Systems .............................................................................. 44 3.4.4 Natural Ventilation........................................................................................................ 46 3.5 PV Systems Duplex Analysis Results............................................................................... 48
4 Paradigm Pilot Lessons Learned ................................................................................... 50 4.1 Solar Hot Water System Fault .......................................................................................... 50 4.2 Solar Hot Water System Piping Issue ............................................................................... 50 4.3 Ground Source Heat Pump Air Handling Unit Nuance Trip ............................................ 51 4.4 Photovoltaic System Shading ........................................................................................... 51 4.5 Window Overhangs .......................................................................................................... 52 4.6 Oversized HVAC Systems ................................................................................................ 52 4.7 Programmable Thermostat ................................................................................................ 52
vii
5 Sub-metered energy performance ................................................................................. 54 5.1 Modeled versus Measured Energy Usage ......................................................................... 54
6 Josephine Commons Site ................................................................................................ 56 6.1 HVAC System Analysis ................................................................................................... 57 6.2 Energy Modeling .............................................................................................................. 58 6.3 Programmable Thermostats .............................................................................................. 60 6.4 Window Type.................................................................................................................... 60 6.5 Wall Insulation .................................................................................................................. 60 6.6 Final Recommendations.................................................................................................... 61 6.6.1 Wall Construction ......................................................................................................... 61 6.6.2 Roof Construction ......................................................................................................... 61 6.6.3 Window Construction ................................................................................................... 61 6.6.4 Window Overhangs ...................................................................................................... 62 6.6.5 Basement Walls and Floor ............................................................................................ 62 6.6.6 Infiltration ..................................................................................................................... 62 6.6.7 Thermostats ................................................................................................................... 62 6.6.8 Ground Source Heat Pump and Domestic Hot Water .................................................. 63 6.6.9 Balanced Energy Recovery Ventilator.......................................................................... 63 6.6.10 Lighting ..................................................................................................................... 64 6.6.11 Appliances................................................................................................................. 64 6.6.12 Roof Construction and PV System ........................................................................... 65 6.7 Conclusion ........................................................................................................................ 67
viii
List of Figures Figure 1. Josephine Commons residential community ................................................................... 1 Figure 2. Paradigm Pilot Project site plan ...................................................................................... 4 Figure 3. Building America benchmark versus baseline design source energy use ....................... 5 Figure 4. Source-energy savings and incremental costs of optimized design .............................. 10 Figure 5. Duplex PV panels, left, and duplex PV system layout, right ........................................ 13 Figure 6. Paradigm Pilot Project duplex rendering, south side..................................................... 14 Figure 7. Paradigm Pilot Project duplex, north side ..................................................................... 14 Figure 8. Duplex unit floor plan and elevation rendering ............................................................. 15 Figure 9. Automated window operator control sequence ............................................................. 16 Figure 10. Roof-mounted solar hot water system on each duplex unit ........................................ 17 Figure 11. Duplex building systems and energy efficiency features ............................................ 18 Figure 12. Single-story ranch rendering ....................................................................................... 19 Figure 13. Single-story ranch ........................................................................................................ 20 Figure 14. Ranch house floor plan and elevation rendering ......................................................... 21 Figure 15. GSHP loop field installation ........................................................................................ 22 Figure 16. Single-family ranch GSHP and DHW mechanical drawings ...................................... 24 Figure 17. Single-family home design elements........................................................................... 26 Figure 18. Manufactured housing assembly process .................................................................... 27 Figure 19. Green Jobs training crew installing PV panels ............................................................ 28 Figure 20. Single-family residence HERS rating ......................................................................... 31 Figure 21. Single-family residence energy use ............................................................................. 34 Figure 22. Single-family residence energy use ............................................................................. 34 Figure 23. Single-family energy use versus PV production ......................................................... 35 Figure 24. Heat pump runtime electric load ................................................................................. 36 Figure 25. Heating COP versus ground loop temperature from ground ....................................... 37 Figure 26. Cooling COP versus ground loop temperature from ground....................................... 37 Figure 27. Single-family August17th temperature profile ............................................................ 39 Figure 28. Single-family February 7th temperature profile .......................................................... 39 Figure 29. Duplex HERS rating .................................................................................................... 40 Figure 30. Duplex residence energy use ....................................................................................... 43 Figure 31. Duplex residence natural gas energy use breakout ...................................................... 43 Figure 32. Duplex energy use versus PV production ................................................................... 44 Figure 33. Duplex solar hot water production versus domestic hot water load ............................ 45 Figure 34. Duplex 1 August 17th temperature profile ................................................................... 47 Figure 35. Duplex 2 August 17th temperature profile ................................................................... 47 Figure 36. Solar radiation versus PV production, April 4–6, 2011 .............................................. 49 Figure 37. Rear view of duplex..................................................................................................... 50 Figure 38. Duplex photovoltaic system and SHW panel layout ................................................... 51 Figure 39. Annual utility bill comparison ..................................................................................... 54 Figure 40. Site energy use intensity comparison .......................................................................... 55 Figure 41. Josephine Commons Net Zero Energy Community .................................................... 56 Figure 42. Visual rendering of duplex unit in BEopt (south side – left, north side – right) ......... 58 Figure 43. Visual rendering of duplex unit in BEopt (basement view – left, first floor plan – right) .............................................................................................................................................. 59 Figure 44. Josephine Commons final net zero energy building.................................................... 66

ix
List of Tables Table 1: Baseline Duplex Design, Construction, and System Characteristics ............................... 4 Table 2: BEopt Optimization Parameters ....................................................................................... 7 Table 3: BEopt Optimization Parameters ....................................................................................... 8 Table 4: BEopt Optimization Parameters ....................................................................................... 8 Table 5: BEopt Optimization Parameters ....................................................................................... 9 Table 6: Final Design Recommendations for Paradigm Duplex .................................................. 11 Table 7: Single-Family Residence Building Envelope Characteristics ........................................ 12 Table 8: Mechanical Ventilation Characteristics .......................................................................... 17 Table 9: GSHP System Performance Specifications from Manufacturer’s Literature ................. 23 Table 10: Mechanical Ventilation Characteristics ........................................................................ 23 Table 11: Single-Family Unit Monthly Infiltration Rate Calculations for 2010 .......................... 32 Table 12: Single Family Residence Monthly Summary Data ...................................................... 33 Table 13: GSHP System Performance .......................................................................................... 36 Table 14: DSH/HWG Performance in 2010 ................................................................................. 38 Table 15: Duplex Unit Monthly Infiltration Rate Calculations for 2010 ..................................... 41 Table 16: Duplex Monthly Summary Data ................................................................................... 42 Table 17: Preheat Tank Contribution to DHW Load, Duplex Units ............................................ 45 Table 18: Window Overhang Sizing............................................................................................. 46 Table 19: PV System Comparisons .............................................................................................. 48 Table 20: HVAC System Comparison .......................................................................................... 57 Table 21: IECC 2009 and 2012 Comparison to Paradigm Pilot Project Construction Characteristics ............................................................................................................................... 60 Table 22: Window Overhang Sizing............................................................................................. 62 Table 23: Mechanical Ventilation Characteristics ........................................................................ 64 Table 24: Design Criteria for Baseline Building, the Paradigm Pilot, and the Josephine Commons Project ........................................................................................................................................... 67
1
1 Introduction
Affordable housing development authorities throughout the United States continually struggle to find the most cost-effective pathway to provide quality, durable, and sustainable housing. The challenge for these authorities is to achieve the mission of delivering affordable housing at the lowest cost per square foot in environments that may be rural, urban, suburban, or within a designated redevelopment district. With the challenges the U.S. faces regarding energy, the environmental impacts of consumer use of fossil fuels and the increased focus on reducing greenhouse gas emissions, housing authorities are pursuing the goal of constructing affordable, energy efficient and sustainable housing at the lowest life-cycle cost of ownership.
This report outlines the lessons learned and sub-metered energy performance of an ultra-low-energy single family ranch home and duplex unit, called the Paradigm Pilot Project and presents the final design recommendations for a 153-unit net zero energy residential development called the Josephine Commons Project. In addition to describing the results of the performance monitoring from the pilot project, this paper describes the recommended design process of (1) setting performance goals for energy efficiency and renewable energy on a life-cycle cost basis, (2) using an integrated, whole building design approach, and (3) incorporating systems-built housing, a green jobs training program, and renewable energy technologies into a replicable high performance, low-income housing project development model.
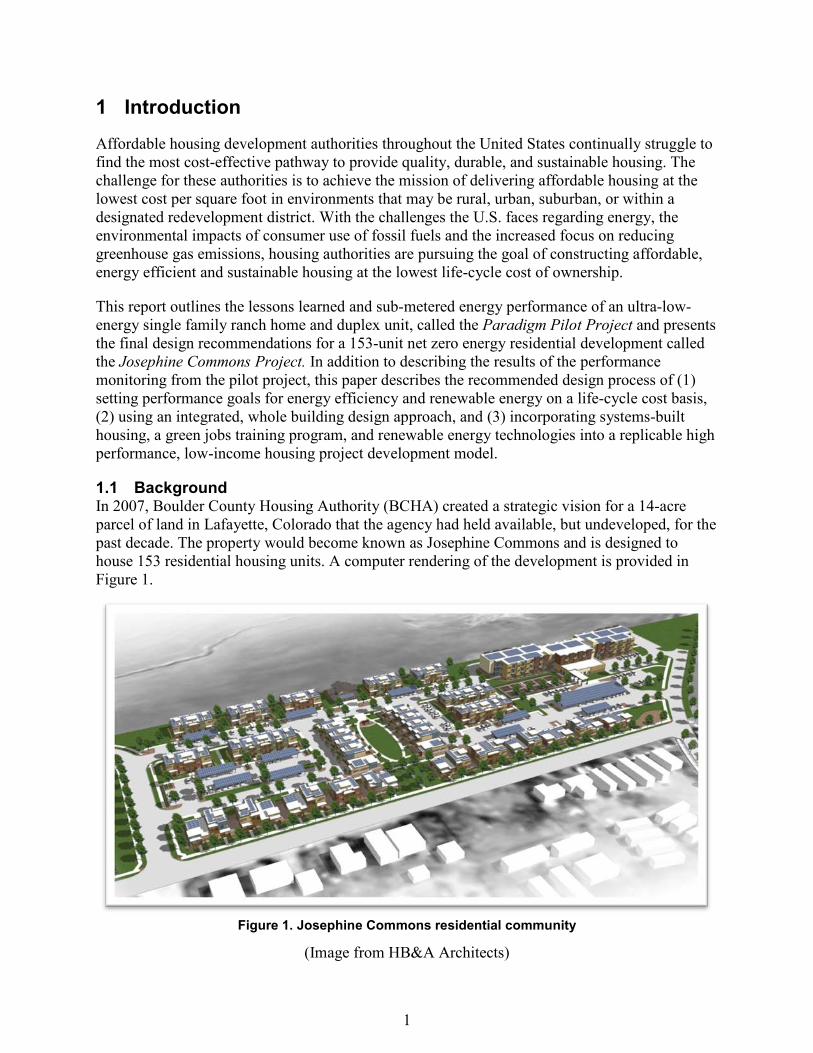
1.1 Background In 2007, Boulder County Housing Authority (BCHA) created a strategic vision for a 14-acre parcel of land in Lafayette, Colorado that the agency had held available, but undeveloped, for the past decade. The property would become known as Josephine Commons and is designed to house 153 residential housing units. A computer rendering of the development is provided in Figure 1.
Figure 1. Josephine Commons residential community
(Image from HB&A Architects)

2
The Josephine Commons development will consist of the following housing units:
• 70 senior units, 1- and 2-bedroom apartments
• 54 1 and 2-story townhouse units
• 22 1 and 2-story duplex units
• 7 single-family lots
In 2008, BCHA approached the City of Denver with the idea of collaborating under a grant application to the Department of Energy (DOE) Solar America Cities Initiative. The Solar America Cities Initiative is a partnership between DOE and a select group of cities across the country. Solar America Cities form teams with municipal, county, and state agencies, non-profit organizations, universities, utilities, developers, and solar companies to accelerate the adoption of solar energy. The Paradigm Pilot Project was awarded funding through the larger Solar America Cities grant with the City of Denver and named because of its potential to bring about a paradigm shift in reducing the cost of affordable housing and substantially changing the way large-infill affordable housing could be assembled.
The BCHA used the pilot project as a mechanism to revise design strategies and assess the design recommendations for the Josephine Commons Project. The process for designing, constructing, and testing the Paradigm Pilot Project and Josephine Commons Project consisted of three main steps:
1. The BCHA, in partnership with All American Group (Manufacturing Sector), HB&A Architects, Farnsworth Group engineers, and NREL designed and constructed a single-family ranch house and a two- story duplex using modular, systems-built construction in Lafayette, CO. The duplex unit was designed with the assistance of an optimization tool to maximize energy savings with the combined mortgage plus energy bill cost at parity with home built to code. The single-family house was designed to incorporate different energy systems than the duplex units to test the performance of the building energy systems over a one-year period.
2. The single-story house and duplex integrated a number of innovative building systems, such as ground source heat pumps with de-super-heaters for domestic hot water, condensing gas furnaces, energy recovery ventilators, automated natural ventilation, evacuated tube solar hot water systems, and building integrated photovoltaics with micro-inverters. All of these technologies were evaluated against one another over a one-year period and the modeled energy performance of the two homes was compared to short-term and long-term test data.
3. The sub-metered performance data and lessons learned from the pilot project were used to develop the design requirements for the residential units on the Josephine Commons site. This process included the following steps:
A. An isolated analysis of the HVAC systems performance based on measured performance data.
B. A revised energy-plus energy model was created and calibrated with measured energy usage data. This new model was used to determine the final design
3
modifications needed to achieve a net zero energy development at the Josephine Commons site.
C. A final set of prescriptive design specifications were created to achieve a net zero energy development at the Josephine Commons site.
Another goal of the Paradigm Pilot Project was to test and develop an affordable net zero energy residential building model that could be replicated at the main Josephine Commons site at a total construction cost between $90 to $125/ft2. This cost target was set by BCHA to ensure that the units met a local affordability threshold and incorporated four separate goals:
1. Minimize energy use on a life-cycle cost basis with the ultimate goal of developing a template for a net zero energy residence at the Josephine Commons site.
2. Incorporate manufactured or systems-built assembly methods to reduce the total installed costs of the development.
3. Create a local green jobs training program to assist with the construction of the homes and installation of the renewable energy systems.
4. Incorporate onsite renewable energy systems to achieve an ultra efficient/net zero energy development.
2 Paradigm Pilot Project
The Paradigm Pilot Project is located on a 0.5-acre parcel of land approximately one mile south of the Josephine Commons site. BCHA finalized the construction of the Paradigm Pilot Project homes towards the end of 2009. The site houses three residential units, a single family residence and a duplex. Figure 2 is a rendering of the Paradigm Pilot Project site plan.

4
Figure 2. Paradigm Pilot Project site plan
(Image from HB&A Architects)
In the beginning of 2009, the BCHA developed preliminary construction drawings and overall design plans with All American Group (Manufacturing Sector), HB&A Architects, and Farnsworth Group engineers. The NREL team conducted its first design review once the initial architectural and building construction drawings were in place near the end of the design process. Using the existing construction drawings and architectural plans, the NREL team developed a baseline energy model for the duplex. Table 1 lists the baseline construction and system characteristics for the duplex.
Table 1: Baseline Duplex Design, Construction, and System Characteristics
CHARACTERISTIC PERFORMANCE VALUE
Orientation North northeast (210 deg)
Aspect Ratio 1.5 (44 ft x 29.5 ft)
Thermostat Nonprogrammable
Ventilation Rate 100% of ASHRAE 62.2
Natural Ventilation Building America Benchmark
Roof R-Value 60
Above-Grade Wall R-Value 22.8
5
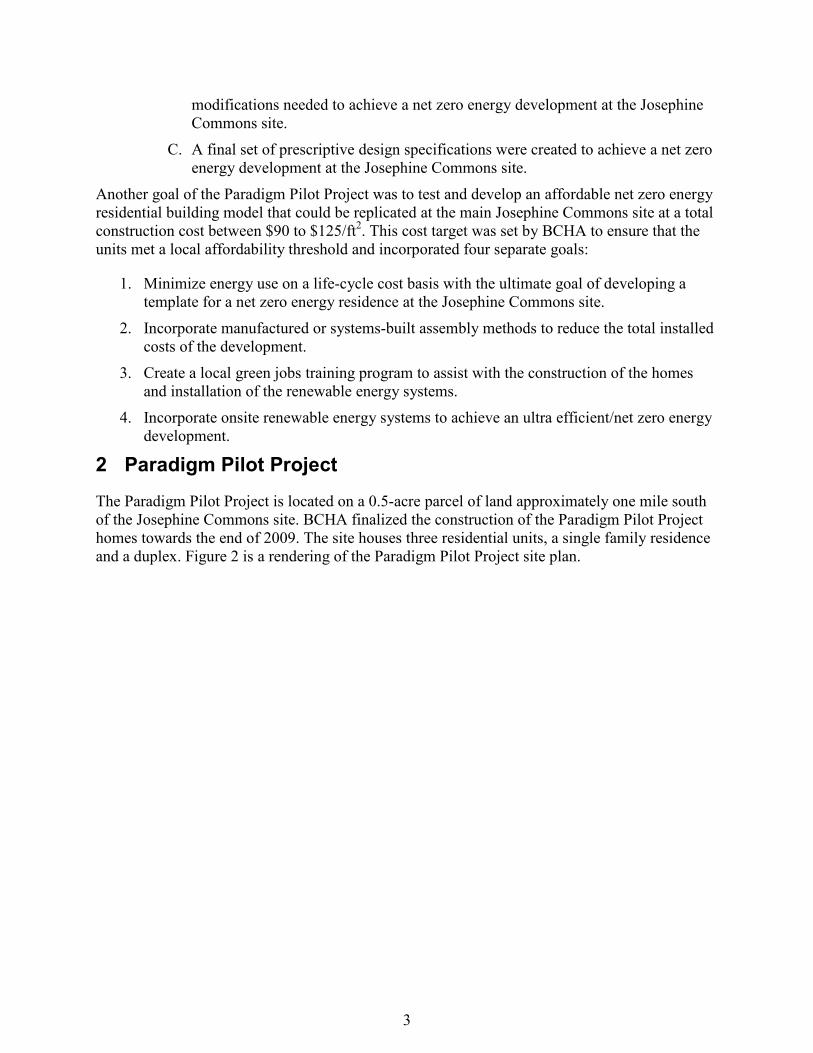
Foundation Wall R-Value 22
Under-Slab R-Value 5
Window U-Value 0.32
Window SHGC 0.28
Infiltration ELA 0.85 ft2
Window Area North (76 ft2), south (140 ft2), east
(15 ft2), west (72 ft2) Appliances ENERGY STAR®
Lighting Pin-base CFLs
Heating AFUE 80%
Mechanical Ventilation Bathroom exhaust
DHW Standard electric Note: ELA = Effective Leakage Area
The baseline design was analyzed in BEopt and compared to the 2008 baseline Building America Benchmark. The benchmark is consistent with mid-1990s standard practice, as reflected in the Home Energy Rating System (Figure 3).1 2
Figure 3. Building America benchmark versus baseline design source energy use
The baseline BCHA duplex model projected a source energy savings of 42% when compared to the Building America Benchmark. Source energy savings is represented as the amount of energy used at this site, as well as energy losses through the generation and distribution system. Thus, it captures the total amount of energy required to get the total energy to the site and accounts for
1 Hendron, R.; Engebrecht, C. (2010). Building America Benchmark Definition. NREL/TP-550-47246. Golden, CO: NREL. http://www.nrel.gov/docs/fy10osti/47246.pdf. 2 EPA. ENERGY STAR Program, Home Energy Rating, http://www.energystar.gov/index.cfm?c=bldrs_lenders_raters.nh_HERS
Note: MBtu = million British thermal units

6
source electricity use and source natural gas use. The initial design resulted in an incremental mortgage and utility cost of $2,481/year, whereas the baseline design had an annual utility bill of $4,202/year. Thus, before any type of building optimizations were performed, the homes were already projected to perform significantly better than a standard mid 1990’s home and projected to save $1,721 per year. This annual cost of $2,481 represents the cost per duplex; thus the total incremental mortgage and utility costs for one residence would be $1,240.5/year.
2.1 Setting Performance Objectives The next step in for BCHA was to define performance objects for the Paradigm Pilot project. Clearly defining energy savings targets and overall performance objectives drive the design decisions related to the energy systems in the building, including the building envelope and HVAC designs. A few examples of common energy performance targets include the following:
• Code Requirements. An energy performance target can be set based on a percent improvement above the local code requirements. The local code requirements for the BCHA project when the Paradigm Pilot Project was constructed were based on the International Energy Efficiency Code (IECC) 2006. BCHA could have set a goal of 30% energy savings over IECC 2006.
• Life-Cycle Costs. The energy performance target can be set to minimize the monthly combined mortgage plus energy bill costs. A more aggressive goal would be to maximize energy savings with the combined mortgage plus energy bill cost at parity with a code built home. This type of goal typically results in 30% to 50% energy savings over an IECC 2006 code built home.
• Home Energy Rating Score (HERS). The overall energy performance, including renewable energy production, can be set based on a local HERS score. For example, if a housing authority sets a requirement of a HERS score of 35 or lower, it would realize a 65% energy savings over an IECC 2006 code built home in Boulder, CO as of June 2010.
• Net Zero Energy. A housing authority could set a goal of net zero site energy, or net zero source energy. 3, 4, 5
• Net Zero Emissions. Similar to the Net Zero Energy (NZE) goal, the site can set a performance target of net zero energy related emissions.
• Nationally Recognized Performance Target. ENERGY STAR®, Building America Builders Challenge, and the 2030 Challenge also set performance targets that can be adopted by housing development authorities.6 7
3 Pless, S.; Torcellini, P. Net-Zero Energy Buildings: A Classification System Based on Renewable Energy Supply Options. NREL/TP-550-44586. Golden, CO: National Renewable Energy Laboratory, June 2010. 4 Carlisle, N.; Van Geet, O.; Pless, S. Definition of a 'Net Zero Energy' Community. NREL/TP-7A2-46065. Golden, CO: National Renewable Energy Laboratory, November 2009. 5 Horowitz, S.; Christensen, C.; Anderson, R. Searching for the Optimal Mix of Solar and Efficiency in Net Zero Energy Buildings: Preprint. NREL/CP-550-42956. Golden, CO: National Renewable Energy Laboratory, August 2008. 6 Building America Builders Challenge, http://www1.eere.energy.gov/buildings/challenge/ 7 Architecture 2030’s 2030 Challenge, http://www.architecture2030.org/2030_challenge/the_2030_challenge

7
The BCHA chose to set the performance objective of maximizing energy savings with the combined mortgage plus energy bill cost at parity with a code-built home for the Paradigm Pilot Project using the optimization tool BEopt. The BEopt software uses the DOE-2 and TRNSYS simulation engine and runs an hourly residential building, solar hot water, and photovoltaic system performance model. BEopt automates the process of identifying optimal building designs along the path to NZE using a sequential search technique. At each step, BEopt runs a series of simulations incorporating each user-selected option and searches for the most cost-effective combination of options. 8, 9
Once the design team was in agreement with the baseline model, it selected 41 optimization variables for the overall design. Each optimization variable has an energy implication and an associated incremental cost. Installed costs for each measure were updated with data from All American Homes and local contractors. Table 2 through Table 5 lists the optimization variables, incremental costs, project lifetimes, and performance values input into BEopt.
Table 2: BEopt Optimization Parameters
Notes: WWR = Window to wall ratio
8 Christensen, C.; Anderson, R.; Horowitz, S.; Courtney, A.; Spencer, J. BEopt™ Software for Building Energy Optimization: Features and Capabilities. NREL/TP-550-39929. Golden, CO: National Renewable Energy Laboratory, August 2006. 9 Christensen, C.; Horowitz, S.; Givler, T.; Courtney, A.; Barker, G. BEopt: Software for Identifying Optimal Building America Designs on the Path to Net Zero Energy. NREL/TP-550-37733. Golden, CO: National Renewable Energy Laboratory, August 2005.
Heating Set Point Life (years) Installed Cost ($) Night Setback Day Setback
71 F 30 0 None None71 F w/ setback 65 F 30 100 11pm-6am -
71 F w/ setback 65 F (wkdy) 30 100 11pm-6am 9am-5pm (M-F)
Wall Insulation Life (years)Installed Cost
($/sqft)R Assembly [hr-sqft-F/Btu]
Framing Factor
R21 batts, 2x6, 24"o.c. + 1" foam 30 7.65 22 0.2R19 batts, 2x6, 16"o.c. + 1/2" foam 30 7.61 21.2 25
Infiltration Life (years)Installed Cost
($/sqft)
Standard Leakage Area
(ft2)
Effective Leakage Area (ft2)
Tighter 13 1.08 0.0 0.84Tightest 13 1.62 0.00008 0.45
Wall Mass Life (years)Installed Cost
($/sqft)Thermal Cap. [Btu/F*sqft]
-
Exterior and Partition, 1/2" Drywall 30 0.6 0.42Exterior, 5/8" Drywall 30 0.65 0.52
Window Areas WWR (North) WWR (South) WWR (East) WWR (West)
BCHA Duplex 1 25% 46% 5% 24%BCHA Duplex 1 Reduced West Gl 28% 52% 6% 14%
8
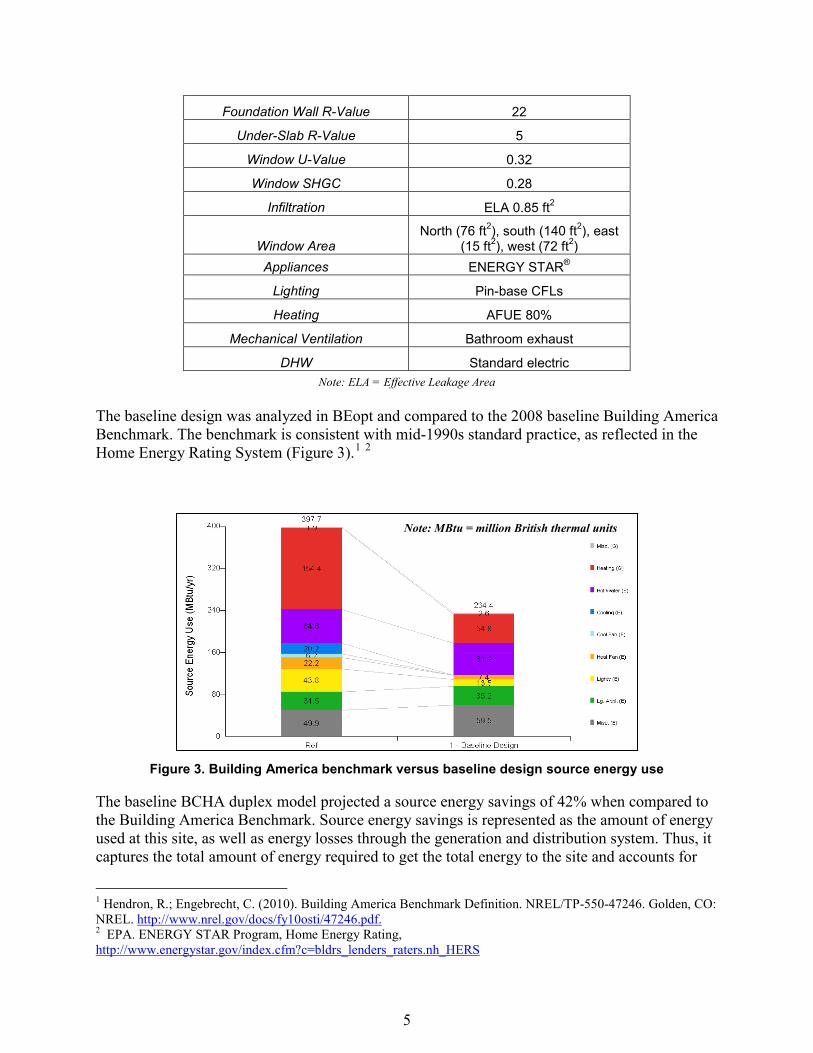
Table 3: BEopt Optimization Parameters
Notes: HM = Heat mirror, Low-E = Low emissivity
Table 4: BEopt Optimization Parameters
Note: V-Axis = Vertical axis, H-Axis = Horizontal axis, AFUE = annual fuel use efficiency
Window Type Life (years)Installed Cost
($/sqft)U-Value [Btu/fr-
sqft-F]SHGC
Double Clear 20 25 0.45 0.5473 pane, 1 HM 20 30 0.257 0.3464 pane, 2 HM 20 38 0.20 0.324
Double Ref Clear 20 24 0.39 0.26Triple Low-E, Clear 20 32 0.17 0.47
Refrigerator Life (years)Installed Cost
($/unit)- -
Standard 18 1,100Energy Star 18 1,242
Cooking Range Life (years)Installed Cost
($/unit)- -
Electric 13 350Gas 15 350
Dishwasher Life (years)Installed Cost
($/unit)- -
Standard 13 259EnergyStar 13 329
Clothes Washer Life (years)Installed Cost
($/unit)- -
Standard (V-Axis) 14 419EnergyStar (H-Axis) 14 799
Standard (V-Axis) - Cold Only 14 419EnergyStar (H-Axis) - Cold Only 14 799
Furnace Life (years)Installed Cost
($/unit)- -
AFUE 80% 18 1,315AFUE 96% 18 2,935
Mechanical Ventilation Life (years)Installed Cost
($/unit)- -
Upgraded Bathroom Exhaust 20 500Balanced Energy-Recovery Ventilator 20 3,700
Water Heater Life (years)Installed Cost
($/unit)- -
Electric Standard 15 251Electric Premium 15 369Electric Tankless 20 1,194
Gas Standard 13 360Gas Premium 13 551

9
Table 5: BEopt Optimization Parameters
If a software program like BEopt was not available, a total of 1,681 individual energy models would have to be created and compared against one another to develop an optimal solution. From a purely economic perspective, this number of simulations would not be feasible. The sequential search technique that BEopt uses automates the process of identifying optimal building designs along the path to NZE. At each step, BEopt runs a series of simulations incorporating each user-selected option one at a time and searching for the most cost-effective combination of options. The sequential search technique has several advantages. First, it finds intermediate optimal points along the entire path (i.e., minimum-cost building designs at different target energy savings levels, not just the global optimum or the NZE optimum). Second, it evaluates discrete rather than continuous building options, resulting in realistic construction options. Third, multiple near-optimal designs are identified at each particular energy savings level, offering design alternatives.
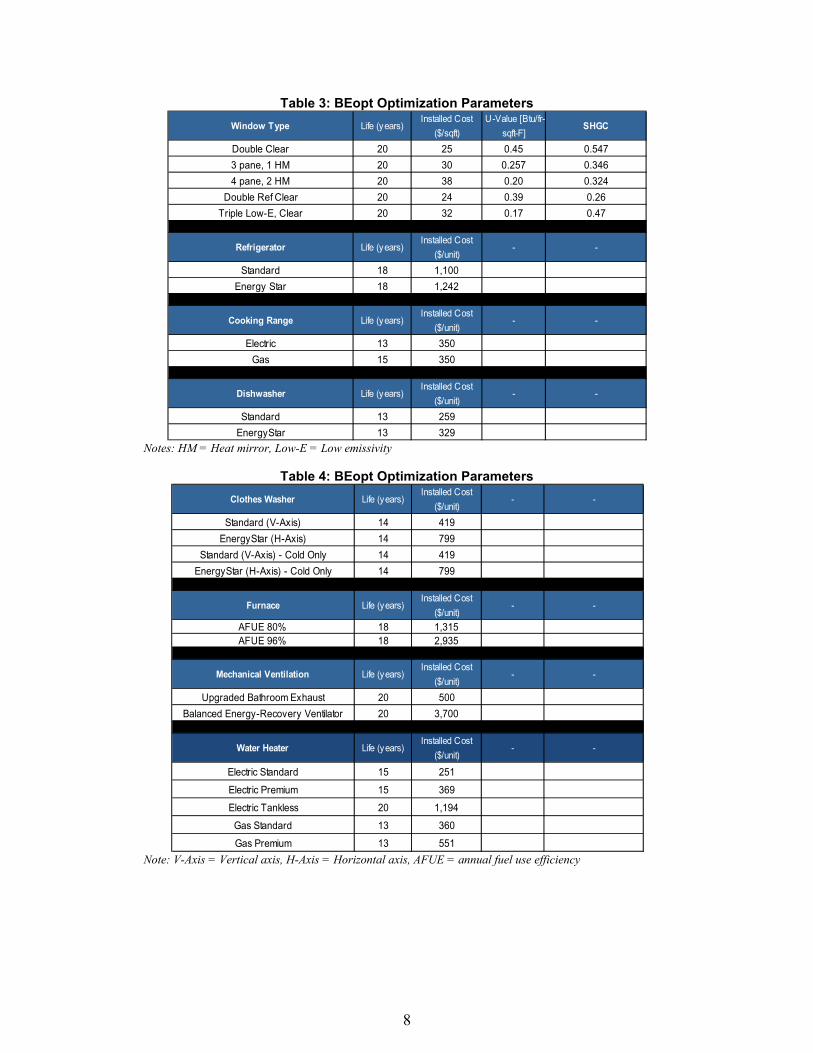
In Figure 4, each gray dot represents a different combination of the optimization variables and the results of an annual simulation. On the y-axis is a listing of the increased incremental cost amortized over the mortgage period plus the annual utility bill. The final design that was selected for BCHA yields the greatest energy savings on a life-cycle cost basis while maintaining a total cost of ownership that is lower than the baseline design.
Ducts Life (years)Installed Cost
($/ft2)- -
None 30 0.00Typical 18 0.45
Improved 18 0.69Inside 18 0.77
Solar DHW Life (years)Installed Cost
($/unit)No Solar DHW 30 0.00
40 sq ft closed loop 30 4,30764 sq ft closed loop 30 4,768
128 sq ft closed loop 30 9,000
10
Figure 4. Source-energy savings and incremental costs of optimized design
The proposed design results in a source-energy savings of 37% over the proposed BCHA baseline design and reduces the incremental mortgage and utility costs by approximately $166/yr.
Table 6 provides the final set of recommended design parameters.
11
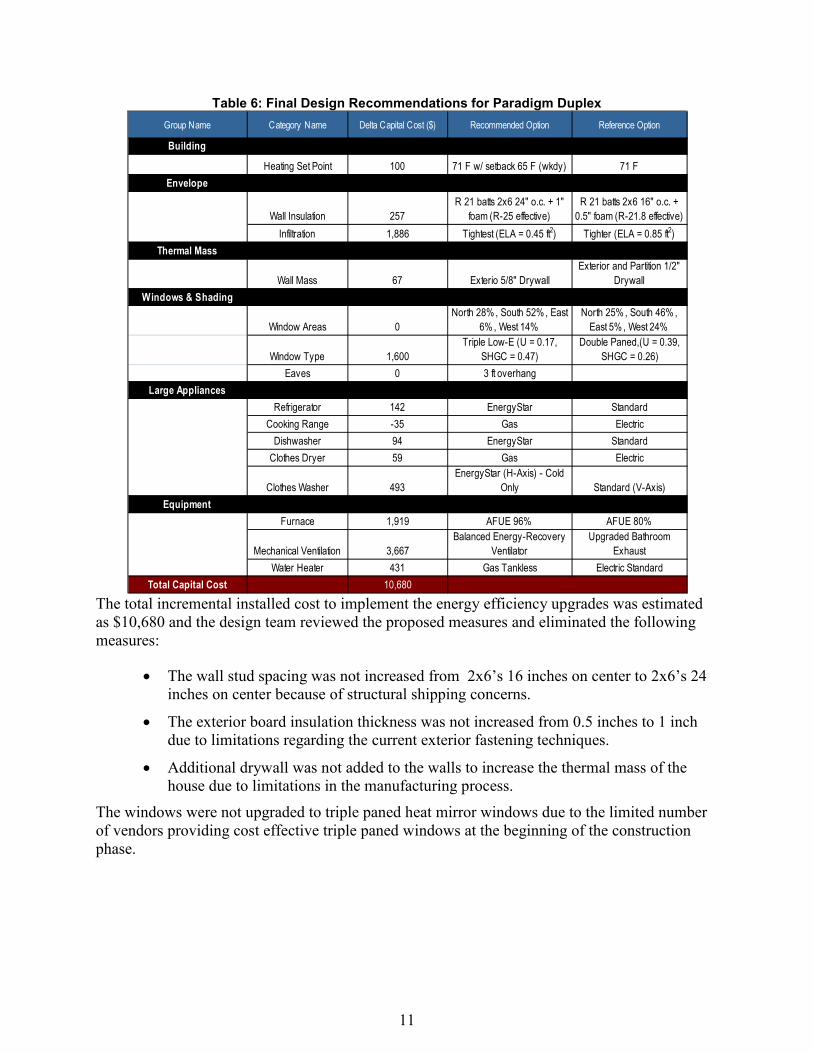
Table 6: Final Design Recommendations for Paradigm Duplex
The total incremental installed cost to implement the energy efficiency upgrades was estimated as $10,680 and the design team reviewed the proposed measures and eliminated the following measures:
• The wall stud spacing was not increased from 2x6’s 16 inches on center to 2x6’s 24 inches on center because of structural shipping concerns.
• The exterior board insulation thickness was not increased from 0.5 inches to 1 inch due to limitations regarding the current exterior fastening techniques.
• Additional drywall was not added to the walls to increase the thermal mass of the house due to limitations in the manufacturing process.
The windows were not upgraded to triple paned heat mirror windows due to the limited number of vendors providing cost effective triple paned windows at the beginning of the construction phase.
Group Name Category Name Delta Capital Cost ($) Recommended Option Reference Option
Building
Heating Set Point 100 71 F w/ setback 65 F (wkdy) 71 FEnvelope
Wall Insulation 257R 21 batts 2x6 24" o.c. + 1"
foam (R-25 effective)R 21 batts 2x6 16" o.c. +
0.5" foam (R-21.8 effective)Infiltration 1,886 Tightest (ELA = 0.45 ft2) Tighter (ELA = 0.85 ft2)
Thermal Mass
Wall Mass 67 Exterio 5/8" DrywallExterior and Partition 1/2"
DrywallWindows & Shading
Window Areas 0North 28% , South 52% , East
6% , West 14%North 25% , South 46% ,
East 5% , West 24%
Window Type 1,600Triple Low-E (U = 0.17,
SHGC = 0.47)Double Paned,(U = 0.39,
SHGC = 0.26)Eaves 0 3 ft overhang
Large AppliancesRefrigerator 142 EnergyStar Standard
Cooking Range -35 Gas ElectricDishwasher 94 EnergyStar Standard
Clothes Dryer 59 Gas Electric
Clothes Washer 493EnergyStar (H-Axis) - Cold
Only Standard (V-Axis)Equipment
Furnace 1,919 AFUE 96% AFUE 80%
Mechanical Ventilation 3,667Balanced Energy-Recovery
VentilatorUpgraded Bathroom
ExhaustWater Heater 431 Gas Tankless Electric Standard
Total Capital Cost 10,680

12
2.2 Building Envelope Characteristics The single-family ranch house and duplex were constructed with the same general building envelope characteristics in order to facilitate the direct comparison of the HVAC, DHW and renewable energy systems. The final construction characteristics, listed in Table 7, were compared to the IECC (2009) requirements for Boulder, Colorado. The residential building code in Lafayette County when the project was constructed was based on the IECC 2006 building code, but the IECC 2009 code was adopted in the spring of 2011. 10
Table 7: Single-Family Residence Building Envelope Characteristics
Characteristic Paradigm
Project IECC 2009
(Climate Zone 5B) Percent
Improvement
Roof R-Value 60 38 37%
Above-Grade Wall R-Value 22.8 20 12%
Foundation Wall R-Value 22 10 55%
Basement Floor R-Value 5 N/A -
Window U-Value 0.32 0.35 9%
Window SHGC 0.28 N/A - In all cases, the Paradigm Pilot Project building envelope characteristics were significantly better than the IECC 2009 code requirements. Specifically, the roof and foundation thermal performance ratings are 22% to 55% better than the IECC requirements.
2.2.1 Wall Construction The walls were constructed with 2 × 6 studs that are located at 16 in.on center (OC). The cavity is insulated with expanding Icynene foam and ½ in. of foam board was applied as exterior insulation.11 The construction characteristics for the walls follow:
• Wall assembly R-value: 22.8 h-ft2-°F/Btu
• Framing factor: 25%
• R-value insulated cavity: 26.4
• R-value plates, studs, and headers: 12.3 •
2.2.2 Roof Construction The sectional drawing for the Paradigm Pilot Project indicates 6" icynene insulation sprayed beneath the roof decking. The remainder of the attic space is completely filled with blown-in insulation, which varies in thickness according to the slope of the roof. The blown-in insulation ranges from R-31.5 to R-54, in addition to the R-22 icynene. The weighted average roof R value was estimated as an R 60 h-ft2-°F/Btu.
10 2009 International Energy Conservation Code (IECC), http://www.iccsafe.org/Pages/default.aspx 11 ICYNENE Spray Foam, http://www.icynene.com/

13
2.2.3 Window Construction The current windows are double-paned low-e windows with a U-value of 0.32 Btu/h-ft2-°F and a SHGC of 0.28. The window frames are made of vinyl and most of the windows are single hung. The windows have the following National Fenestration Rating Council (NFRC) energy performance ratings:
• Window assembly U-value: 0.32 Btu/hr-ft2-F
• SHGC: 0.28
• Visible transmittance (VT): 0.47
• Frame construction: Vinyl
2.2.4 PV Systems The rooftop PV systems have a rated capacity of 2.2 direct-current kilowatts (DC-kW). The systems consist of 12 Lumos 185-watt panels (monocrystalline silicon with an efficiency of 14.49%) and each panel has its own micro-inverter. The original shading projections estimated a 7% reduction in energy production for the duplex systems because of the construction and location of the clerestory. For this reason, the enphase micro-inverters were specified to reduce the shading impacts on the annual energy production. The PV system is integrated into the membrane roofing system through a SolarFrameWorks mounting system. Figure 5 shows the PV panels and their layout.
Figure 5. Duplex PV panels, left, and duplex PV system layout, right
(Photo from BCHA, Image from Lighthouse Solar)
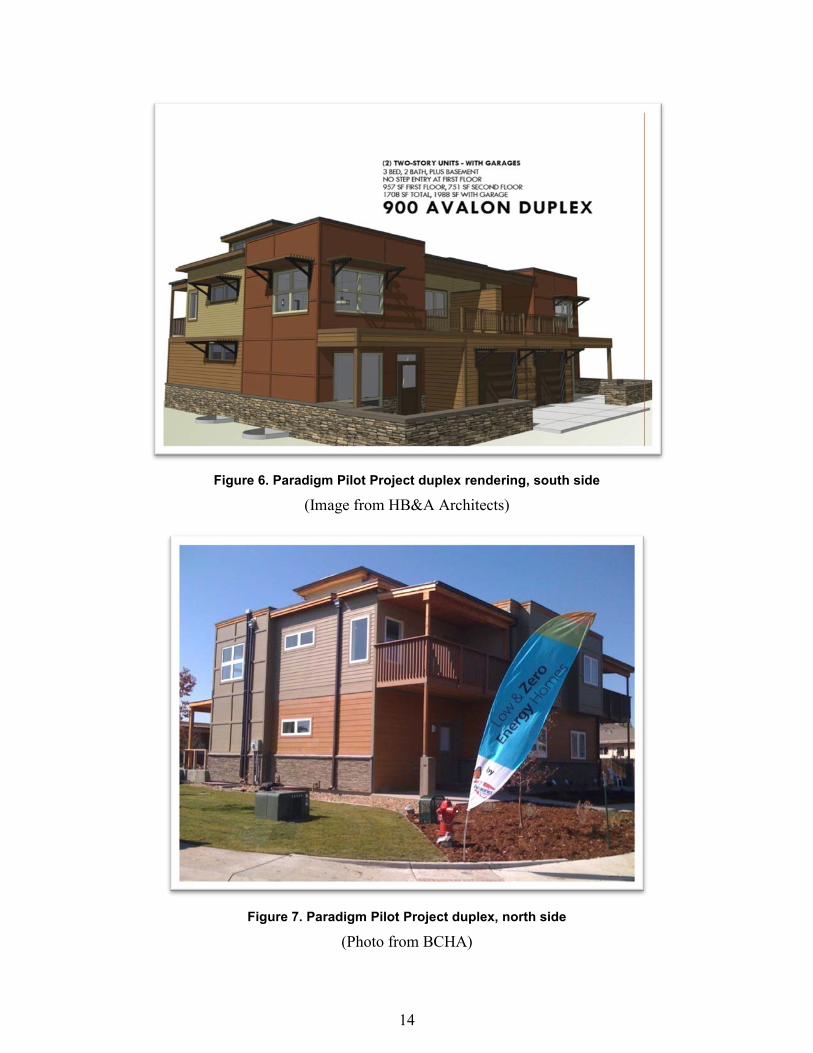
2.3 The Duplex Design The duplex was designed with three bedrooms, two bathrooms, and a total finished floor area of 2,458 ft2 (total square footage of 4,936 ft2 including the basement). A visual rending of the duplex unit is provided in Figure 6 and a photograph of the unit in Figure 7.
14
Figure 6. Paradigm Pilot Project duplex rendering, south side
(Image from HB&A Architects)
Figure 7. Paradigm Pilot Project duplex, north side
(Photo from BCHA)
15
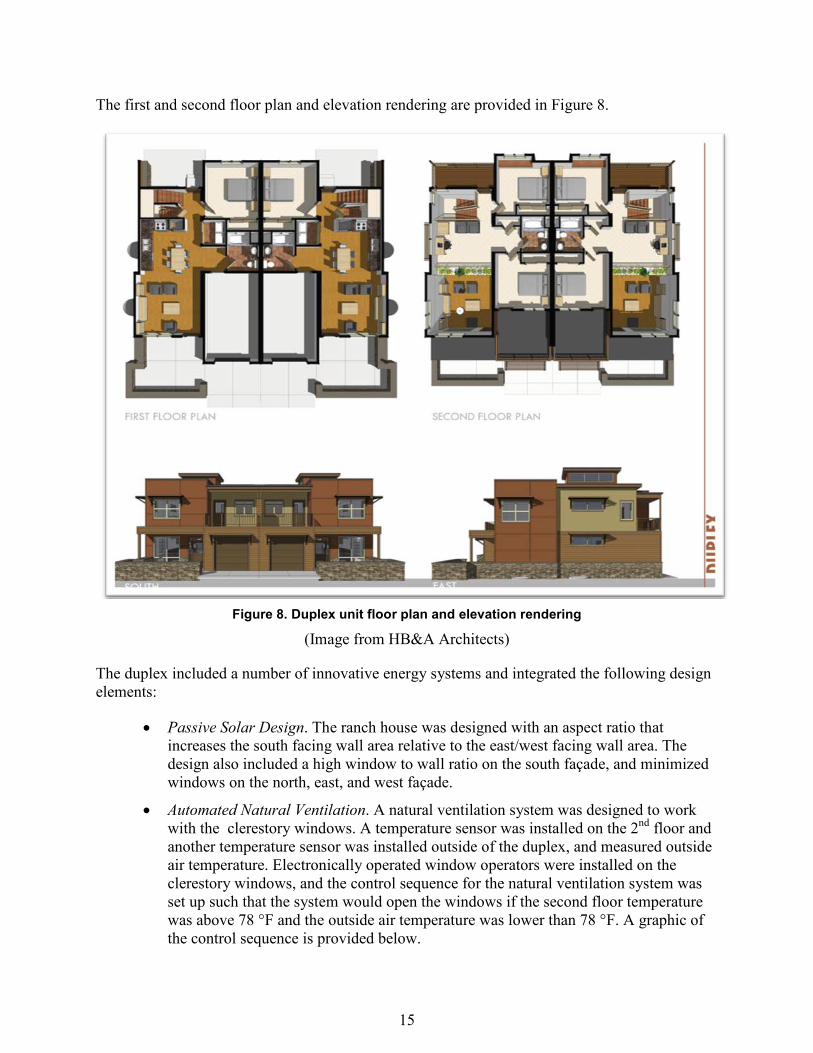
The first and second floor plan and elevation rendering are provided in Figure 8.
Figure 8. Duplex unit floor plan and elevation rendering
(Image from HB&A Architects)
The duplex included a number of innovative energy systems and integrated the following design elements:
• Passive Solar Design. The ranch house was designed with an aspect ratio that increases the south facing wall area relative to the east/west facing wall area. The design also included a high window to wall ratio on the south façade, and minimized windows on the north, east, and west façade.
• Automated Natural Ventilation. A natural ventilation system was designed to work with the clerestory windows. A temperature sensor was installed on the 2nd floor and another temperature sensor was installed outside of the duplex, and measured outside air temperature. Electronically operated window operators were installed on the clerestory windows, and the control sequence for the natural ventilation system was set up such that the system would open the windows if the second floor temperature was above 78 °F and the outside air temperature was lower than 78 °F. A graphic of the control sequence is provided below.

16
Figure 9. Automated window operator control sequence
(Image from McKusker Electric, Inc.) •
• Natural Daylighting. Clerestories bring in natural day-light into the kitchen, living room, and hallways.
• ENERGY STAR Lighting. Compact florescent lighting was used in 100% of the hard-wired lighting fixtures.
• ENERGY STAR Appliances. All of the appliances are ENERGY STAR rated, including the refrigerator, dishwasher, and clothes dryer.
• Condensing Furnace. Each duplex was heated with a condensing gas furnace, with an annual fuel use efficiency of 96%.
• Programmable Thermostats. A single programmable thermostat controlled the operation of the furnace, and had a seven day programming capability.
• Air Barrier. An infiltration requirement was defined as an ELA of 0.45 ft2 for the duplex. To achieve this,
o All trades involved took ownership of the infiltration requirement.
o A whole-house wrap was applied and taped correctly.
o All exterior penetrations were sealed with expanding foam insulation.
o Gasket joints were installed between modular units.
o Note that the preassembled construction also adds to the ability to achieve this low infiltration value.

17
• Energy Recovery Ventilator. Mechanical ventilation systems were upgraded to a balanced ERV with a sensible recovery effectiveness of 75%, and a total recovery effectiveness of 62% (Table 8).
Table 8: Mechanical Ventilation Characteristics Category Value Sensible Recovery Efficiency (%) 75 Total Recovery Efficiency (%) 62 Rate (cfm) 70 Hours/Day 8 Fan Watts 94 Cooling Ventilation Natural Ventilation
• The balanced ERV is set up to cycle on off and off for a total run time of 8 hours a day. In addition, a wall-mounted switch in each restroom will turn on the ERV for 10 minutes once the switch is activated.
• Domestic and Solar Hot Water. A SWH system with the following characteristics was installed on each residence in the duplex:
o Collector Loop Type: Active/Indirect glycol system
o Collector Type: 30 evacuated tubes
o Collector area: 56.11 ft2
o Collector Tilt in degrees: 20 degrees
o Storage tank volume: 80 gallons
On-demand water heater. A natural-gas-fired on-demand water heater provides supplementary hot water to each residence.
Figure 10. Roof-mounted solar hot water system on each duplex unit
(Photo from BCHA)
• Photovoltaics. A 2.2 kW roof-mounted PV array was installed on each residence. Figure 11 provides a visual representation of the design elements of the duplex.

18
Figure 11. Duplex building systems and energy efficiency features
(Image from HB&A Architects)

19
2.4 The Single-Family Ranch Design The single-family house was designed and built as an all-electric home with a ground-source heat pump (GSHP), a de-super heater (DSH) for domestic hot water (DHW) and a roof-mounted photovoltaic (PV) system. The single-family unit is a one-story residence with two bedrooms, one bathroom, and a no- step entry. The residence has a total square footage of 1,014 ft2 plus a partially finished basement (Figure 12 and Figure 13).
Figure 12. Single-story ranch rendering
(Image from HB&A Architects)

20
Figure 13. Single-story ranch
(Photo from BCHA)
The first floor plan and elevation rendering are provided in Figure 14.

21
Figure 14. Ranch house floor plan and elevation rendering
(Image from HB&A Architects)
The single-family house included a number of innovative energy systems and integrated the design of the following:
• Passive Solar Design. The ranch house was designed with an aspect ratio that increases the south facing wall area relative to the east/west facing wall area. The design also included a high window to wall ratio on the south façade, and minimized windows on the north, east, and west façade.
• Natural Daylighting. Clerestories bring in natural day-light into the kitchen, living room, and hallways.
• Energy Star Lighting. Compact florescent lighting was used in 100% of the hard wired lighting fixtures.
• Energy Star Appliances. All of the appliances are Energy Star rated, including the refrigerator, dishwasher, and clothes dryer.
• Ground Source Heat Pump. A GSHP provides heating and cooling to the house through a central heating/cooling coil and air handling unit. The GSHP is a 3-ton, Climate Master Tranquility 27 unit. The heat pump has a dual-stage compressor and is one of the most energy-efficient heat pumps on the market. The nameplate specifications for the geothermal heat pump system are as follows:
22
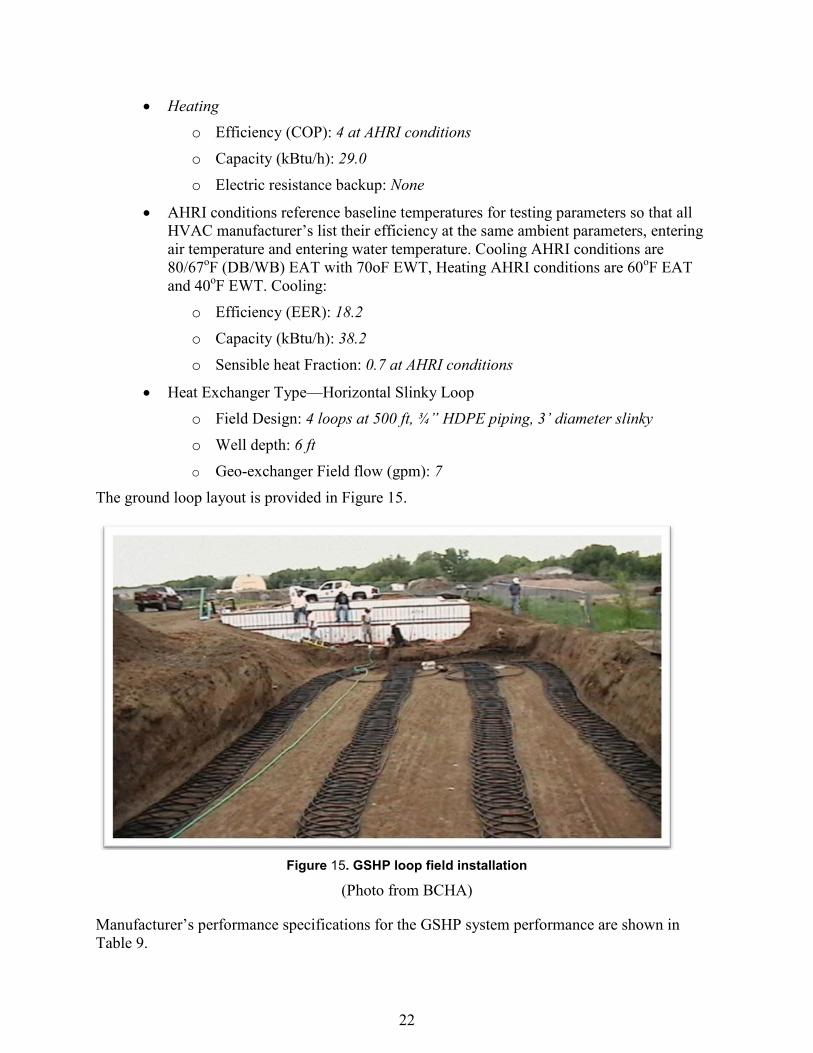
• Heating o Efficiency (COP): 4 at AHRI conditions
o Capacity (kBtu/h): 29.0
o Electric resistance backup: None
• AHRI conditions reference baseline temperatures for testing parameters so that all HVAC manufacturer’s list their efficiency at the same ambient parameters, entering air temperature and entering water temperature. Cooling AHRI conditions are 80/67oF (DB/WB) EAT with 70oF EWT, Heating AHRI conditions are 60oF EAT and 40oF EWT. Cooling:
o Efficiency (EER): 18.2 o Capacity (kBtu/h): 38.2 o Sensible heat Fraction: 0.7 at AHRI conditions
• Heat Exchanger Type—Horizontal Slinky Loop o Field Design: 4 loops at 500 ft, ¾” HDPE piping, 3’ diameter slinky
o Well depth: 6 ft o Geo-exchanger Field flow (gpm): 7
The ground loop layout is provided in Figure 15.
Figure 15. GSHP loop field installation
(Photo from BCHA)
Manufacturer’s performance specifications for the GSHP system performance are shown in Table 9.

23
Table 9: GSHP System Performance Specifications from Manufacturer’s Literature
• Domestic Hot Water. The domestic hot water is provided by a DSH and back-up
electric resistance hot water tank. The DSH pulls heat from the refrigeration cycle within the heat pump to offset part of the domestic hot load throughout the year. When the heat pump is operating to meet an internal heating or cooling load the DSH captures a portion of the superheated refrigerant vapor as it exits the compressor. This small amount of superheated gas is diverted through a heat exchanger and is used to pre-heat hot water for the domestic hot water system. The system is removing useful heat from the system when operating in heating mode and removing waste heat that would be discharged to the ground in cooling mode.
• Energy Recovery Ventilator. Mechanical ventilation systems were upgraded to a balanced ERV with a sensible recovery effectiveness of 75%, and a total recovery effectiveness of 62% (Table 10).
Table 10: Mechanical Ventilation Characteristics
Category Value
Sensible Recovery Efficiency (%) 75 Total Recovery Efficiency (%) 62 Rate (cfm) 70 Hours/Day 8 Fan Watts 94 Cooling Ventilation Natural Ventilation
The balanced ERV is set up to cycle on off and off for a total run time of 8 hours a day. In addition, a wall-mounted switch in each restroom will turn on the ERV for 10 minutes once the switch is activated. The mechanical schematic that shows the integration of the GSHP, DSH and ERV is provided in Figure 16.
-Capacity
(Tons)Efficiency
(COP) Capacity (Tons)Efficiency
(COP)Full Load 3.2 5.3 2.4 4.0Part Load 2.4 7.9 1.8 4.5
Capacity Cooling
Full Load (77 F)Heating
Full Load (32 F)

24
Figure 16. Single-family ranch GSHP and DHW mechanical drawings
(Image from Farnsworth Group, Inc.)

25
• Programmable Thermostat. A single programmable thermostat controls the operation of the furnace, and had a seven day programming capability.
• Air Barrier. An infiltration requirement was defined as an ELA of 0.45 ft2 for the duplex. To achieve this:
o All trades involved took ownership of the infiltration requirement.
o A whole-house wrap was applied and taped correctly.
o All exterior penetrations were sealed with expanding foam insulation.
o Gasket joints were installed between modular units.
o Note that the preassembled construction also adds to the ability to achieve this low infiltration value.
• Photovoltaics. A 2.2 kW roof-mounted PV array was installed on each residence. Figure 17 provides a visual representation of the design elements of the single family ranch.

26
Figure 17. Single-family home design elements
(Image from HB&A Architects)

27
2.5 Manufactured Housing BCHA chose to use manufactured or systems-built assembly methods in order to reduce the installed costs of the Paradigm Pilot Project duplex and ranch home. Systems-built homes are constructed off site in a controlled environment and delivered to the site for final assembly and the field application of certain internal and external finishes. The systems-built approach to building affordable housing can be accomplished through economies of scale. Large production manufacturing companies in the United States have access to high volume supply of residential building components and can purchase high performance paned windows, wall insulation materials, and other sustainable building materials in bulk. Leveraging the high production advantages of a systems-built manufacturer and using a high production affordable housing developer offers mutual economies of scale, bringing economic benefits to both parties.
The execution of large-scale residential construction using the systems-built process is inherently risky and often took developers through an unknown process and level of risk. This risk is real in the manufacturing sector for housing developers because of the vulnerabilities associated with untested assembly of modular-built homes. One error in design can have a ripple effect on the cost of an architectural or engineering oversight, thereby forcing a heavy front end investment on constructability due diligence and even fatal flaw analysis. The BCHA addressed this perceived risk through the execution of a proof of concept, the Paradigm Pilot Project. The field application of the pre-built modules is shown in Figure 18.
Figure 18. Manufactured housing assembly process
(Photo from BCHA)

28
2.6 Green Jobs Training Program The BCHA worked with Workforce Boulder County to train seven local residents on a number of residential construction trades. The trainees assisted with the following:
• Ground source heat pump installation tasks included assisting with the ground loop installation and heat pump installation.
• Insulated concrete form foundation tasks included helping lay the foundation. • Solar Hot Water and Photovoltaic Installation tasks included installing mounting
rack, running hot water piping, wiring the PV system, and general installation support (Figure 19).
Figure 19. Green Jobs training crew installing PV panels
(Photo from BCHA)

29
3 Performance Testing
A combination of short-term and long-term tests were conducted on both units in the duplex and the single family ranch home. The short-term tests are conducted to determine the performance of the house at a single point in time and the long-term tests were conducted over a one-year period. The performance of the single-family ranch and two-story duplex was monitored by NREL from January 01, 2010 to December 31, 2010.
3.1 Short-Term Testing Procedure The BCHA paid for a HERS rating for the single-family residence and one of the duplex units. A home energy rating involves an analysis of a home’s construction plans, on-site inspections, a blower door test (to test the leakiness of the house), and a duct test (to test the leakiness of the ducts). Based on the results of the tests and the home’s plans, the Home Energy Rater uses an energy efficiency software package to perform an energy analysis of the home design. This analysis yields a projected HERS Index. The HERS Index is a scoring system established by the Residential Energy Services Network (RESNET) in which a home built to the specifications of the HERS reference home (based on the 2006 IECC) scores a HERS Index of 100. A NZE home scores a HERS Index of 0. The lower a home’s HERS Index, the more energy efficient it is in comparison to the HERS reference home. Each one-point decrease in the HERS Index corresponds to a 1% reduction in energy consumption compared to the HERS Reference Home. A home with a HERS Index of 85, then, is 15% more energy efficient than the HERS Reference Home.12
3.2 Long-Term Testing Procedure In November 2009, MEP and NREL began installing instrumentation in the duplex and single-family ranch home. The data acquisition system (DAS) was set up with a main Campbell Scientific CR 1000 data logger in the basement of the ranch home that acts as the data collection hub for two data loggers in the duplex units, and weather station data logger.
The weather station data logger was located on the roof of the duplex and measures the following weather characteristics:
• Horizontal solar radiation (W/m2)
• Wind speed (m/s)
• Outdoor temperature (°C)
• Outdoor relative humidity (%). The duplex units each contain Campbell Scientific CR206 wireless data loggers. These data loggers measure the following whole-house performance characteristics common to both duplex units and report the data back to the main data logger:
• House power/energy from utility (kW, kWh)
• House power/energy to utility (kW, kWh) 12 Home Energy Rating System, http://www.resnet.us/home-energy-ratings

30
• PV power/energy produced (kW, kWh)
• Air handler fan power/energy (kW, kWh)
• Furnace gas consumption (ft3)
• Instantaneous gas water heater gas consumption (ft3)
• DHW consumption (L/s)
• DHW cold inlet temperature (°C), thermistor only
• Solar hot water preheat tank hot outlet temperature (°C), thermistor only
• Gas water heater hot outlet temperature (°C), thermistor only
• Indoor temperature (°C)
• Indoor relative humidity (%). Continental Controls WNB-3Y-208-P 100-Hz pulse output watt nodes and appropriately sized current transducers (CTs) measure whole-house electricity consumption. Natural gas end uses that contribute to the total house energy consumption for the duplex units are measured with standard utility style diaphragm Sensus model P275 gas meters with a pulse output.
These CR 1000 data logger for the single-family ranch house is set up to measure the following performance characteristics:
• House power/energy from utility (kW, kWh)
• House power/energy to utility (kW, kWh)
• PV power/energy produced (kW, kWh)
• Air handler fan power/energy (kW, kWh)
• Heat pump unit total power/energy (kW, kWh)
• Heat pump field/loop pump power/energy (kW, kWh)
• Electric water heater power/energy consumption (kW, kWh)
• DHW consumption (L/s)
• DHW cold inlet temperature (°C), thermistor and thermocouple
• De-superheater cold inlet temperature (°C), thermistor and thermocouple
• De-superheater hot outlet temperature (°C), thermistor only
• DHW preheat tank hot outlet temperature (°C), thermistor only
• DHW electric tank hot outlet temperature (°C), thermistor only
• Geothermal heat pump unit to ground loop temperature (°C), thermistor only
• Geothermal heat pump unit from ground loop temperature (°C), thermistor only
• Geothermal heat pump to and from ground loop line pressure differential (psi)

31
• Indoor temperature (°C)
• Indoor relative humidity (%). In addition, a one-time power measurement of the DSH pump was performed using a Fluke Model 39 power meter to establish the runtime power and energy use of the DSH pump that is part of the geothermal heat pump. Heat pump compressor power/energy is determined by subtraction. Each data collection system was set up to collect one-minute, 15-minute, 60-minute, and daily average data. The data acquisition systems (DAS) were set up to store and collect data on a five-second scan interval.
Measured data were used to calibrate existing energy models and to assist in weighing the value of the installed systems against each other. As a secondary benefit, detailed sub-metered data enable system performance issues to be identified. Installers can often remedy these issues or re-specify the systems for better performance in future developments.
3.3 Single-Family Residence 3.3.1 Short-Term Test Results The overall performance rating of the home was 37, as shown in Figure 20.
Figure 20. Single-family residence HERS rating
The HERS rating for the home represents a 63% reduction in energy uses versus a standard new home built to IECC 2006 specifications. This is a significant achievement and represents a notable accomplishment. Because the single-family home is all electric, a significantly larger PV system would be required to achieve a HERS rating of zero. Assuming no additional energy efficiency features were incorporated, an additional 5.5 kW of PV would be required to receive an NZE rating, bringing the total PV system size to 7.7 kW.
32
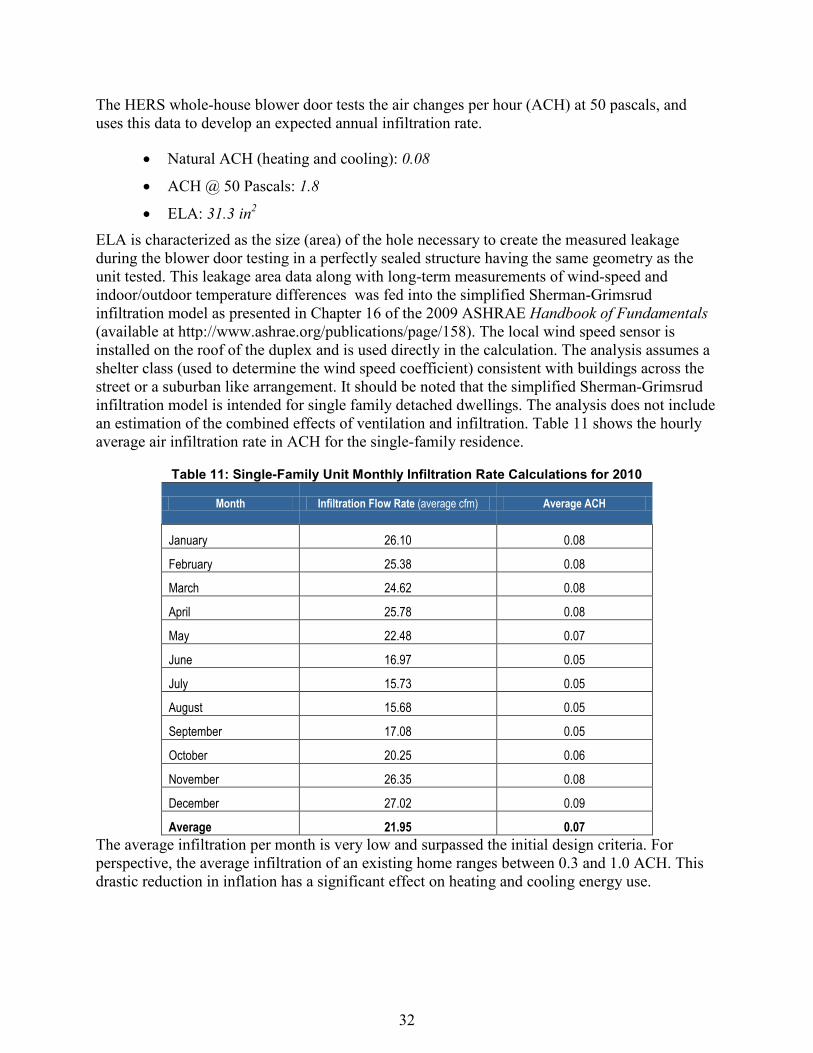
The HERS whole-house blower door tests the air changes per hour (ACH) at 50 pascals, and uses this data to develop an expected annual infiltration rate.
• Natural ACH (heating and cooling): 0.08
• ACH @ 50 Pascals: 1.8
• ELA: 31.3 in2 ELA is characterized as the size (area) of the hole necessary to create the measured leakage during the blower door testing in a perfectly sealed structure having the same geometry as the unit tested. This leakage area data along with long-term measurements of wind-speed and indoor/outdoor temperature differences was fed into the simplified Sherman-Grimsrud infiltration model as presented in Chapter 16 of the 2009 ASHRAE Handbook of Fundamentals (available at http://www.ashrae.org/publications/page/158). The local wind speed sensor is installed on the roof of the duplex and is used directly in the calculation. The analysis assumes a shelter class (used to determine the wind speed coefficient) consistent with buildings across the street or a suburban like arrangement. It should be noted that the simplified Sherman-Grimsrud infiltration model is intended for single family detached dwellings. The analysis does not include an estimation of the combined effects of ventilation and infiltration. Table 11 shows the hourly average air infiltration rate in ACH for the single-family residence.
Table 11: Single-Family Unit Monthly Infiltration Rate Calculations for 2010
Month Infiltration Flow Rate (average cfm) Average ACH
January 26.10 0.08
February 25.38 0.08
March 24.62 0.08
April 25.78 0.08
May 22.48 0.07
June 16.97 0.05
July 15.73 0.05
August 15.68 0.05
September 17.08 0.05
October 20.25 0.06
November 26.35 0.08
December 27.02 0.09
Average 21.95 0.07 The average infiltration per month is very low and surpassed the initial design criteria. For perspective, the average infiltration of an existing home ranges between 0.3 and 1.0 ACH. This drastic reduction in inflation has a significant effect on heating and cooling energy use.

33
The total duct leakage to outside was calculated as 0% for the single-family home by the HERS rater. In general the infiltration, duct leakage, and ventilation performance characteristics surpassed initial expectations.
3.3.2 Long-Term Test Results Table 12 lists the total monthly energy consumption by end use system, PV production, energy use intensity (MMBtu/ft2) and greenhouse gas (GHG) emissions.
Table 12: Single Family Residence Monthly Summary Data
The table shows the monthly total house electric, PV system production, air handler, heat pump, heat pump field pumps, water heater, and all other loads. In addition, it reports the total greenhouse gas emissions and equivalent greenhouse gas emissions per square foot of building. The annual energy use intensity of the house is very low and the total GHG are approximately one-quarter those of a typical American home. Figure 21 shows the monthly breakout in energy use to date.
MonthHouse Total
Electric Load (kWh)
PV Production
(kWh)
Air Handler (kWh)
Heat Pump (kWh)
Field Pumps (kWh)
Water Heater (kWh)
Other (kWh)Percent PV
(%)
Energy Intensity (kbtu/ft2)
CO2 Equiv.metric tons
(t)
CO2 Eqiv. (lbs/ft2)
Total Energy Use (Mmbtu)
Jan-10 920.4 145.9 56.9 492.7 119.9 107.9 142.9 16% 3.1 0.7 1.4 3.1Feb-10 685.6 131.8 88.6 376.5 79.1 85.8 55.5 19% 2.3 0.5 1.0 2.3
Mar-10 841.5 240.7 45.5 379.3 92.5 225.8 98.3 29% 2.8 0.5 1.1 2.9
Apr-10 745.7 308.1 22.9 195.7 46.8 250.4 229.9 41% 2.5 0.4 0.8 2.5
May-10 396.3 371.2 15.9 88.3 18.2 46.3 227.6 94% 1.3 0.0 0.0 1.4
Jun-10 101.9 337.3 6.5 55.4 11.6 1.9 26.5 331% 0.3 -0.2 -0.4 0.3Jul-10 718.8 334.8 41.1 348.0 98.7 59.2 171.8 47% 2.4 0.3 0.7 2.5
Aug-10 686.2 339.1 39.6 333.4 90.7 42.6 179.9 49% 2.3 0.3 0.6 2.3Sep-10 548.0 332.3 12.3 103.4 23.8 56.1 352.4 61% 1.8 0.2 0.4 1.9Oct-10 615.3 260.0 5.0 49.2 9.8 68.9 482.6 42% 2.1 0.3 0.7 2.1
Nov-10 919.5 182.9 32.8 270.1 33.3 82.6 500.7 20% 3.1 0.6 1.4 3.1Dec-10 1,251.7 146.5 49.3 397.0 48.9 190.4 566.0 12% 4.2 0.9 2.1 4.3
Totals 8,431.1 3,130.6 416.5 3,088.9 673.5 1,218.1 3,034.2 37% 28.4 4.6 9.9 28.8
Performance Data - Monthly Summary

34
Figure 21. Single-family residence energy use
Approximately 37% of the energy use of the home is associated with the heat pump. In addition, the field pumps, air-handling units and water heating equipment make up a significant portion of the remaining loads. All of the HVAC systems are combined and shown in Figure 22.
Figure 22. Single-family residence energy use
The HVAC system energy use includes the ground source heat pump, ground loop pump and air handler fan. The HVAC system components make up 50% of the total annual energy use, with
Air Handler (kWh)5%
Heat Pump (kWh)37%
Field Pumps (kWh)8%
Water Heater (kWh)14%
Other (kWh)36%
Ranch Energy Use Breakout
HVAC (kWh)50%
Water Heater (kWh)14%
Other (kWh)36%
Ranch Energy Use Breakout with HVAC Combined

35
water heating representing the second largest load. The portion of whole house energy use attributed to HVAC and DHW loads reiterate the need to make the building thermal envelope and air barrier as efficient as possible. The PV system produced 37% of the total energy use (Figure 23).
Figure 23. Single-family energy use versus PV production
It should be noted that the house was partially unoccupied during the month of April and completely unoccupied for almost all of June. If the house were occupied during these two months, the total energy use of the residence would be higher and the total PV system fraction would be lower.
3.3.3 GSHP Analysis The GSHP has a dual-stage compressor and is one of the most energy efficient heat pumps on the market. The Climate Master Model 038 unit is designed to have a maximum pressure drop across the ground loop that shall not exceed 5.7 PSI, per manufacturer’s recommendations. When the long-term metering equipment was installed, a 0-10PSI pressure transducer was installed across the ground loop. When the GSHP system was turned on, the pressure transducer immediately over ranged, indicating that the pressure drop between lines is greater than 10 PSI. Further investigation indicated that the installer had installed twice the pumping energy that was specified by the manufacturer. This resulted in a flow rate across the ground loop that was twice as high as the recommended design value, a very low temperature differential across the ground loop, and the system using twice the pumping energy use that was specified by the manufacturer.
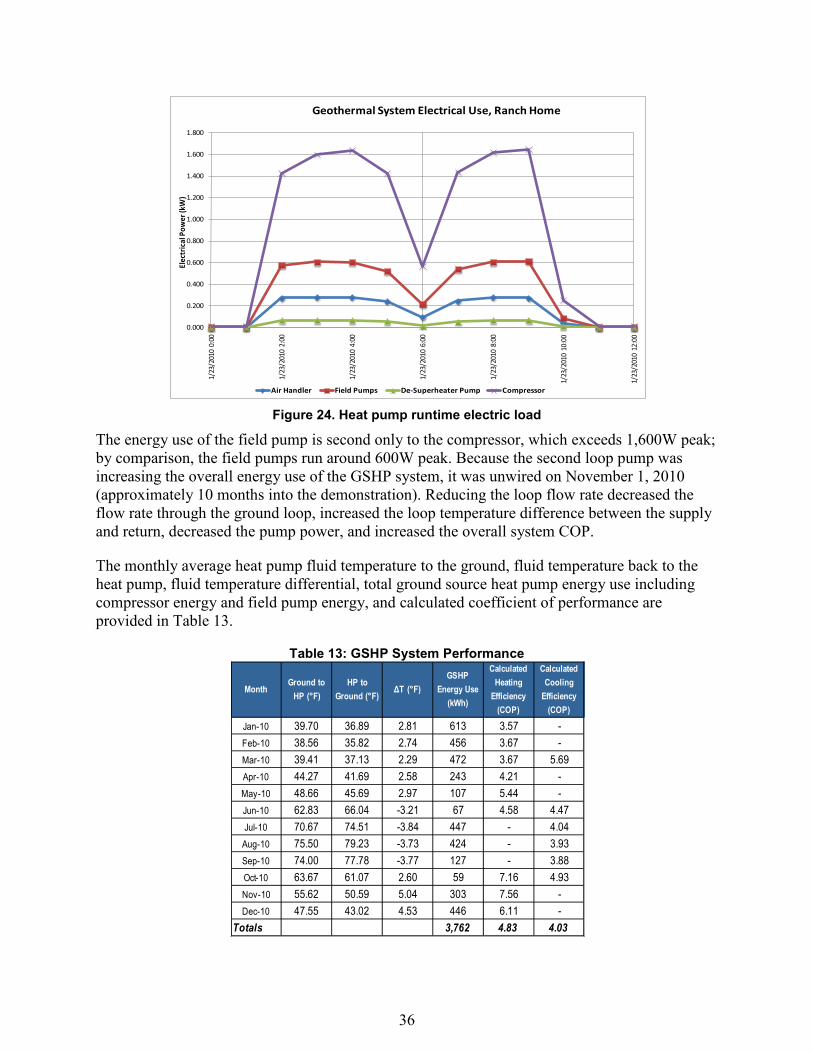
Figure 24 shows runtime data for the heat pump and the sub-metered components within the heat pump with double the pumping energy use.
0.0
200.0
400.0
600.0
800.0
1,000.0
1,200.0
1,400.0
Jan-
10
Feb-
10
Mar
-10
Apr-
10
May
-10
Jun-
10
Jul-1
0
Aug-
10
Sep-
10
Oct
-10
Nov-
10
Dec-
10
Elec
trici
ty (k
Wh)
Ranch Energy Use vs PV Production
PV Production (kWh)
House Total Electric Load (kWh)
36
Figure 24. Heat pump runtime electric load
The energy use of the field pump is second only to the compressor, which exceeds 1,600W peak; by comparison, the field pumps run around 600W peak. Because the second loop pump was increasing the overall energy use of the GSHP system, it was unwired on November 1, 2010 (approximately 10 months into the demonstration). Reducing the loop flow rate decreased the flow rate through the ground loop, increased the loop temperature difference between the supply and return, decreased the pump power, and increased the overall system COP.
The monthly average heat pump fluid temperature to the ground, fluid temperature back to the heat pump, fluid temperature differential, total ground source heat pump energy use including compressor energy and field pump energy, and calculated coefficient of performance are provided in Table 13.
Table 13: GSHP System Performance
0.000
0.200
0.400
0.600
0.800
1.000
1.200
1.400
1.600
1.800
1/23
/201
0 0:
00
1/23
/201
0 2:
00
1/23
/201
0 4:
00
1/23
/201
0 6:
00
1/23
/201
0 8:
00
1/23
/201
0 10
:00
1/23
/201
0 12
:00
Elec
tric
al P
ower
(kW
)
Geothermal System Electrical Use, Ranch Home
Air Handler Field Pumps De-Superheater Pump Compressor
MonthGround to
HP (°F)HP to
Ground (°F)ΔT (°F)
GSHP Energy Use
(kWh)
Calculated Heating
Efficiency (COP)
Calculated Cooling
Efficiency (COP)
Jan-10 39.70 36.89 2.81 613 3.57 -Feb-10 38.56 35.82 2.74 456 3.67 -Mar-10 39.41 37.13 2.29 472 3.67 5.69Apr-10 44.27 41.69 2.58 243 4.21 -May-10 48.66 45.69 2.97 107 5.44 -Jun-10 62.83 66.04 -3.21 67 4.58 4.47Jul-10 70.67 74.51 -3.84 447 - 4.04
Aug-10 75.50 79.23 -3.73 424 - 3.93Sep-10 74.00 77.78 -3.77 127 - 3.88Oct-10 63.67 61.07 2.60 59 7.16 4.93Nov-10 55.62 50.59 5.04 303 7.56 -Dec-10 47.55 43.02 4.53 446 6.11 -
Totals 3,762 4.83 4.03
37
In the January – October timeframe, the temperature differential across the ground loop was less than ½ of that specified by the manufacturer, and less than 4 °F. During this time, the runtime average ground loop flow rate in April was 13.4 gpm, over twice as high as the largest flow rate recommended by the manufacturer.
As a result of the reduction in pumping energy use and flow rate, the temperature difference across the ground loop approximately doubled for the months of October and December. During the same period of time, the ground temperature had significantly warmed up as part of the natural cycle of ground temperature swings. Both of these changes contributed to a significantly higher COP for the months of November and December.
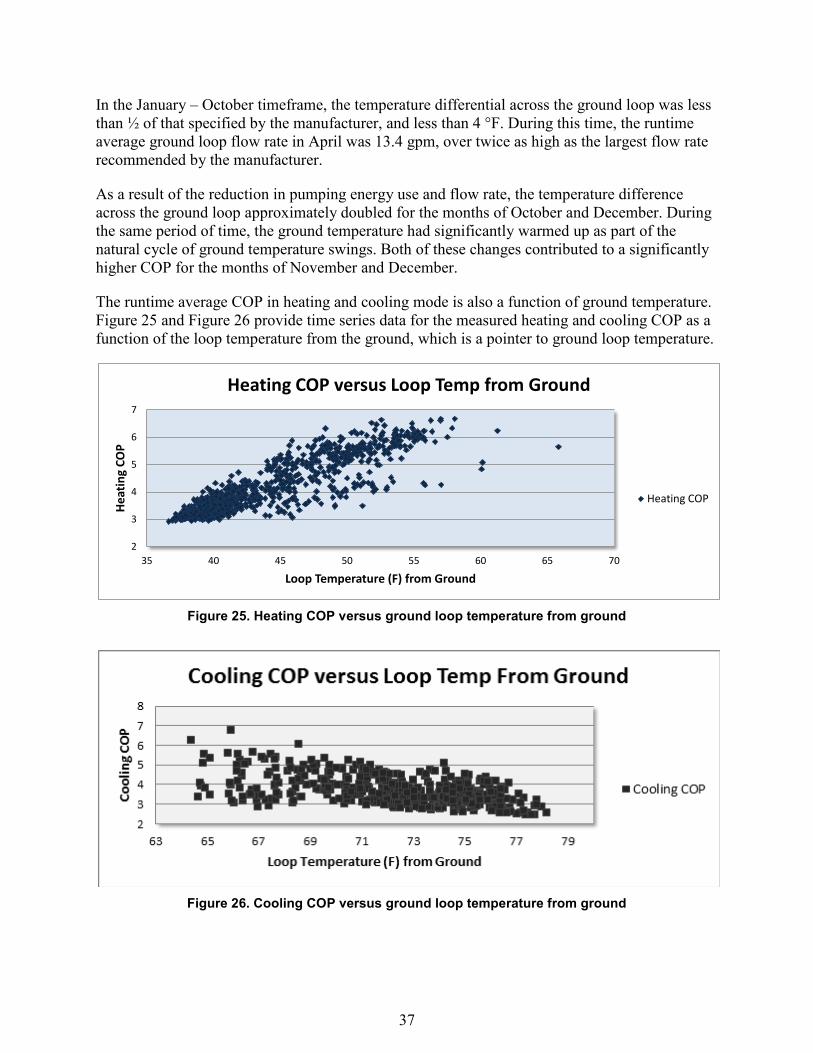
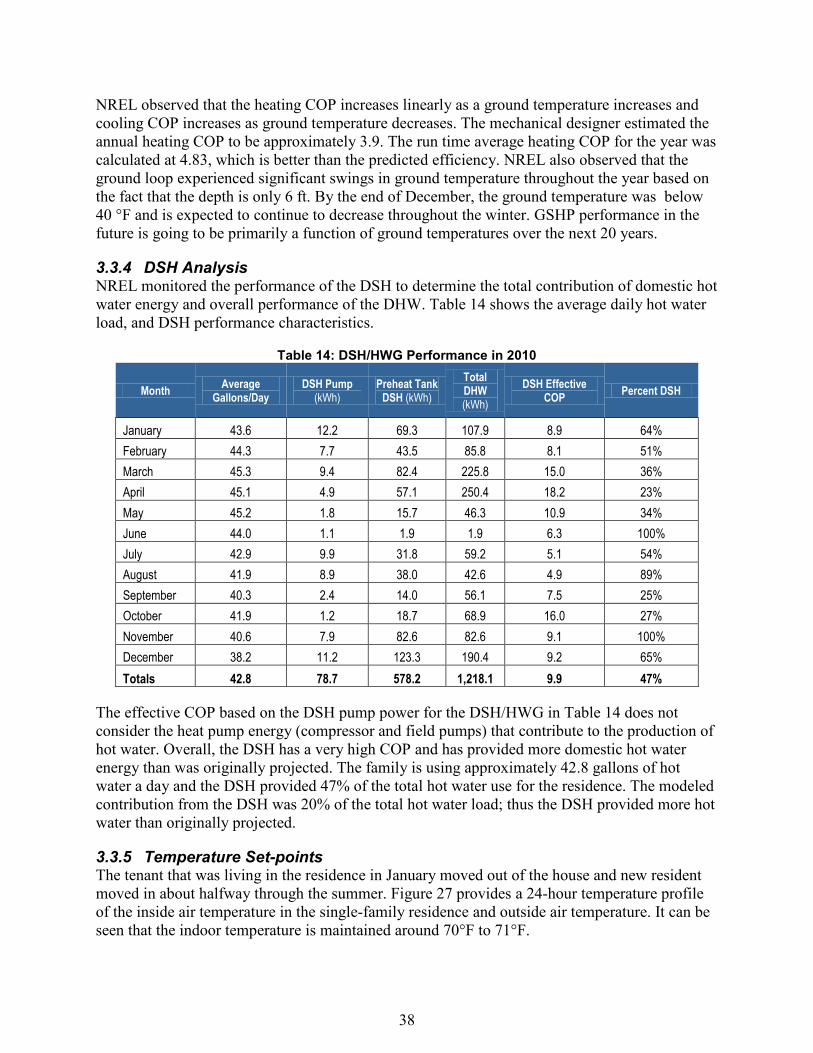
The runtime average COP in heating and cooling mode is also a function of ground temperature. Figure 25 and Figure 26 provide time series data for the measured heating and cooling COP as a function of the loop temperature from the ground, which is a pointer to ground loop temperature.
Figure 25. Heating COP versus ground loop temperature from ground
Figure 26. Cooling COP versus ground loop temperature from ground
2
3
4
5
6
7
35 40 45 50 55 60 65 70
Heat
ing
COP
Loop Temperature (F) from Ground
Heating COP versus Loop Temp from Ground
Heating COP
38
NREL observed that the heating COP increases linearly as a ground temperature increases and cooling COP increases as ground temperature decreases. The mechanical designer estimated the annual heating COP to be approximately 3.9. The run time average heating COP for the year was calculated at 4.83, which is better than the predicted efficiency. NREL also observed that the ground loop experienced significant swings in ground temperature throughout the year based on the fact that the depth is only 6 ft. By the end of December, the ground temperature was below 40 °F and is expected to continue to decrease throughout the winter. GSHP performance in the future is going to be primarily a function of ground temperatures over the next 20 years.
3.3.4 DSH Analysis NREL monitored the performance of the DSH to determine the total contribution of domestic hot water energy and overall performance of the DHW. Table 14 shows the average daily hot water load, and DSH performance characteristics.
Table 14: DSH/HWG Performance in 2010
Month Average Gallons/Day
DSH Pump (kWh)
Preheat Tank DSH (kWh)
Total DHW (kWh)
DSH Effective COP Percent DSH
January 43.6 12.2 69.3 107.9 8.9 64% February 44.3 7.7 43.5 85.8 8.1 51% March 45.3 9.4 82.4 225.8 15.0 36% April 45.1 4.9 57.1 250.4 18.2 23% May 45.2 1.8 15.7 46.3 10.9 34% June 44.0 1.1 1.9 1.9 6.3 100% July 42.9 9.9 31.8 59.2 5.1 54% August 41.9 8.9 38.0 42.6 4.9 89% September 40.3 2.4 14.0 56.1 7.5 25% October 41.9 1.2 18.7 68.9 16.0 27% November 40.6 7.9 82.6 82.6 9.1 100% December 38.2 11.2 123.3 190.4 9.2 65% Totals 42.8 78.7 578.2 1,218.1 9.9 47%
The effective COP based on the DSH pump power for the DSH/HWG in Table 14 does not consider the heat pump energy (compressor and field pumps) that contribute to the production of hot water. Overall, the DSH has a very high COP and has provided more domestic hot water energy than was originally projected. The family is using approximately 42.8 gallons of hot water a day and the DSH provided 47% of the total hot water use for the residence. The modeled contribution from the DSH was 20% of the total hot water load; thus the DSH provided more hot water than originally projected.
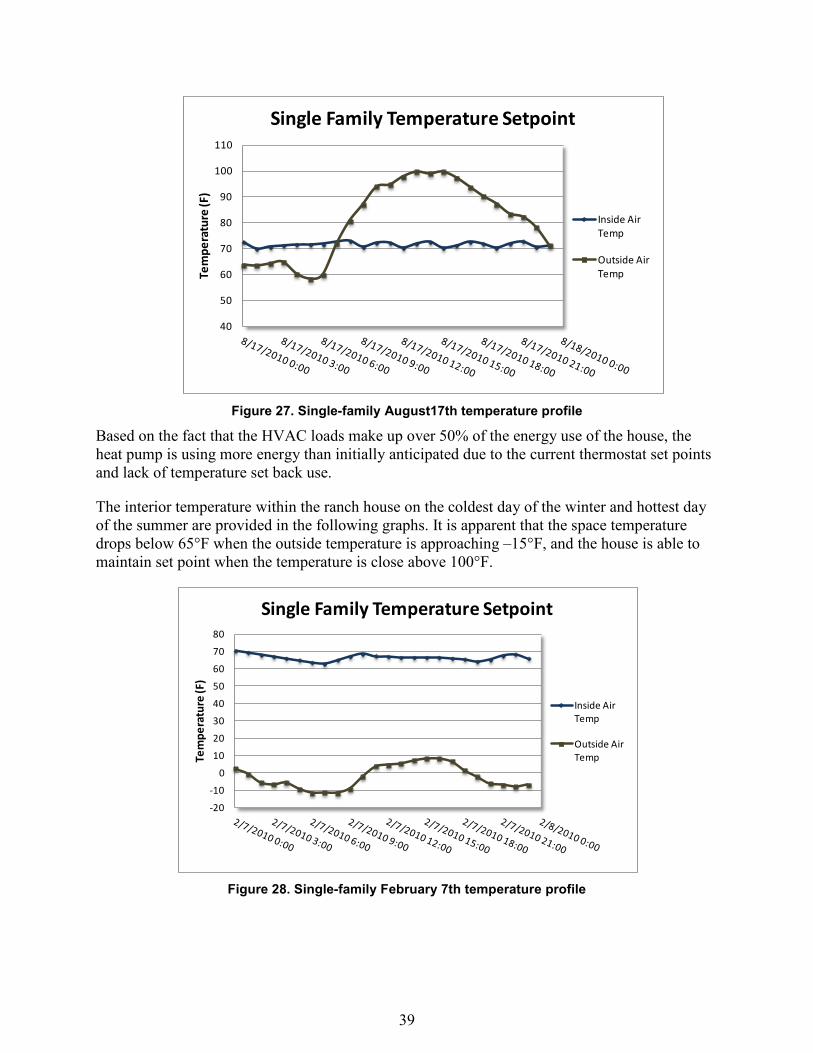
3.3.5 Temperature Set-points The tenant that was living in the residence in January moved out of the house and new resident moved in about halfway through the summer. Figure 27 provides a 24-hour temperature profile of the inside air temperature in the single-family residence and outside air temperature. It can be seen that the indoor temperature is maintained around 70°F to 71°F.
39
Figure 27. Single-family August17th temperature profile
Based on the fact that the HVAC loads make up over 50% of the energy use of the house, the heat pump is using more energy than initially anticipated due to the current thermostat set points and lack of temperature set back use.
The interior temperature within the ranch house on the coldest day of the winter and hottest day of the summer are provided in the following graphs. It is apparent that the space temperature drops below 65°F when the outside temperature is approaching –15°F, and the house is able to maintain set point when the temperature is close above 100°F.
Figure 28. Single-family February 7th temperature profile
40
50
60
70
80
90
100
110
Tem
pera
ture
(F)
Single Family Temperature Setpoint
Inside Air Temp
Outside Air Temp
-20
-10
0
10
20
30
40
50
60
70
80
Tem
pera
ture
(F)
Single Family Temperature Setpoint
Inside Air Temp
Outside Air Temp
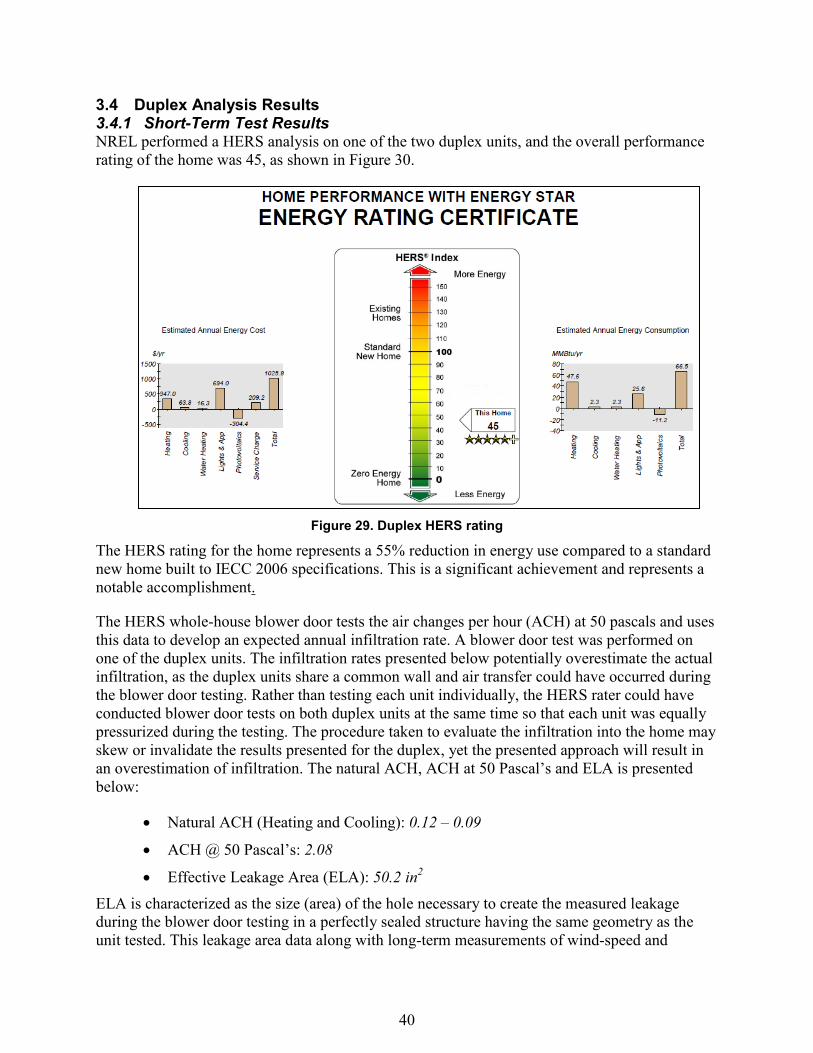
40
3.4 Duplex Analysis Results 3.4.1 Short-Term Test Results NREL performed a HERS analysis on one of the two duplex units, and the overall performance rating of the home was 45, as shown in Figure 30.
Figure 29. Duplex HERS rating
The HERS rating for the home represents a 55% reduction in energy use compared to a standard new home built to IECC 2006 specifications. This is a significant achievement and represents a notable accomplishment.
The HERS whole-house blower door tests the air changes per hour (ACH) at 50 pascals and uses this data to develop an expected annual infiltration rate. A blower door test was performed on one of the duplex units. The infiltration rates presented below potentially overestimate the actual infiltration, as the duplex units share a common wall and air transfer could have occurred during the blower door testing. Rather than testing each unit individually, the HERS rater could have conducted blower door tests on both duplex units at the same time so that each unit was equally pressurized during the testing. The procedure taken to evaluate the infiltration into the home may skew or invalidate the results presented for the duplex, yet the presented approach will result in an overestimation of infiltration. The natural ACH, ACH at 50 Pascal’s and ELA is presented below:
• Natural ACH (Heating and Cooling): 0.12 – 0.09
• ACH @ 50 Pascal’s: 2.08
• Effective Leakage Area (ELA): 50.2 in2 ELA is characterized as the size (area) of the hole necessary to create the measured leakage during the blower door testing in a perfectly sealed structure having the same geometry as the unit tested. This leakage area data along with long-term measurements of wind-speed and
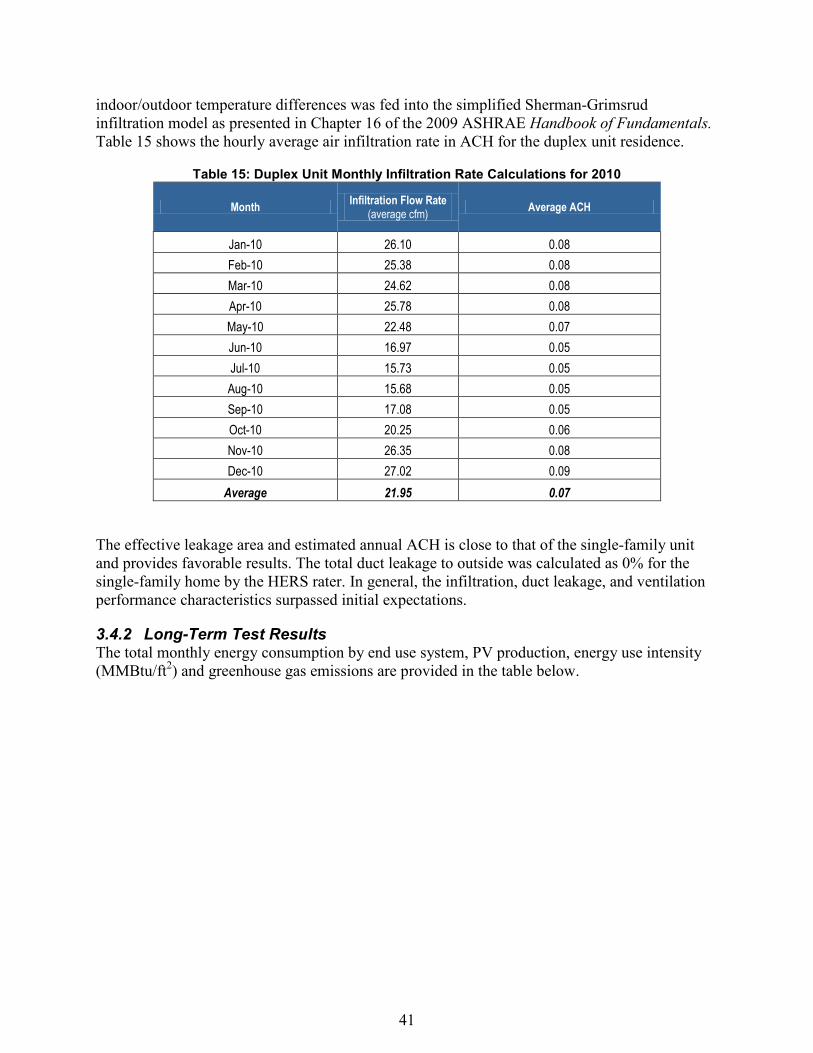
41
indoor/outdoor temperature differences was fed into the simplified Sherman-Grimsrud infiltration model as presented in Chapter 16 of the 2009 ASHRAE Handbook of Fundamentals. Table 15 shows the hourly average air infiltration rate in ACH for the duplex unit residence.
Table 15: Duplex Unit Monthly Infiltration Rate Calculations for 2010
Month Infiltration Flow Rate (average cfm) Average ACH
Jan-10 26.10 0.08 Feb-10 25.38 0.08 Mar-10 24.62 0.08 Apr-10 25.78 0.08 May-10 22.48 0.07 Jun-10 16.97 0.05 Jul-10 15.73 0.05 Aug-10 15.68 0.05 Sep-10 17.08 0.05 Oct-10 20.25 0.06 Nov-10 26.35 0.08 Dec-10 27.02 0.09
Average 21.95 0.07
The effective leakage area and estimated annual ACH is close to that of the single-family unit and provides favorable results. The total duct leakage to outside was calculated as 0% for the single-family home by the HERS rater. In general, the infiltration, duct leakage, and ventilation performance characteristics surpassed initial expectations.
3.4.2 Long-Term Test Results The total monthly energy consumption by end use system, PV production, energy use intensity (MMBtu/ft2) and greenhouse gas emissions are provided in the table below.

42
Table 16: Duplex Monthly Summary Data
The total monthly house electric, PV system production, air handler energy use, preheat from solar hot water, auxiliary tank hot water from the on demand heat, the gas to the furnace, gas to the hot water heater loads are reported in the table above. In addition, the total greenhouse gas emissions and equivalent greenhouse gas emissions per square foot of the building are reported. Note that although the site EUI is 34.4kBtu/ft2, and is higher than the single-family home EUI of 28.4 kBtu/ft2, the house emits significantly less emissions, on a lbs/ft2 basis. The duplex emits 2.31 tons/ft2 of greenhouse gases per year, whereas the single family unit emits 9.9 tons/ft2. This is an important point and illustrates that this house has the lowest greenhouse gas emissions per square foot of finished floor area.
The monthly breakout in energy use to date is shown in the following graphic.
MonthHouse In
(kWh)PV (kWh)
Air Hanlder (kWh)
Preheat Tank (kWh)
Aux Tank (kWh)
Gas to Furnace (Mmbtu)
Gas to Water Heater
(M bt )
Total Gas (Mmbtu)
Total Electric (Mmbtu)
Total House (MMBtu)
EUI (kBtu/ft2)
CO2 Equiv (Metric Ton)
CO2 Intensity (lbs/ft2)
House Electric (MMBtu)
Jan-10 417.4 123.7 82.7 151.5 173.8 11.1 1.2 12.3 1.0 13.3 7.7 0.32 0.41 1.42
Feb-10 400.3 121.2 68.1 129.9 156.5 8.6 1.1 9.7 1.0 10.7 6.2 0.31 0.39 1.37
Mar-10 429.0 202.6 46.9 205.3 84.4 5.5 0.8 6.4 0.8 7.1 4.1 0.24 0.31 1.46Apr-10 272.0 249.1 38.4 140.0 62.4 2.7 0.6 3.3 0.1 3.4 2.0 0.05 0.07 0.93May-10 366.1 298.0 37.5 231.5 57.7 1.7 0.5 2.2 0.2 2.4 1.4 0.09 0.11 1.25Jun-10 290.6 295.9 56.5 122.1 26.6 0.0 0.3 0.3 0.0 0.3 0.2 0.01 0.02 0.99Jul-10 401.1 279.7 130.9 2.9 190.4 0.0 1.4 1.4 0.4 1.8 1.0 0.18 0.23 1.37
Aug-10 491.3 274.0 157.3 1.2 149.8 0.0 1.2 1.2 0.7 1.9 1.1 0.26 0.33 1.68
Sep-10 391.2 263.7 133.8 142.8 0.0 0.0 0.2 0.2 0.4 0.6 0.3 0.12 0.15 1.33
Oct-10 350.4 206.7 55.4 138.9 1.0 0.8 0.3 1.0 0.5 1.5 0.9 0.14 0.18 1.20
Nov-10 323.0 134.7 43.7 99.2 82.7 5.0 0.7 5.7 0.6 6.4 3.7 0.21 0.26 1.10
Dec-10 480.5 107.0 59.2 77.5 115.3 8.1 0.9 9.0 1.3 10.3 5.9 0.37 0.48 1.64
Totals 4612.9 2556.5 910.5 1442.7 1100.6 43.5 9.2 52.6 7.0 59.7 34.4 2.31 2.94 15.74
Performance Data - Monthly Summary

43
Figure 30. Duplex residence energy use
Approximately 2/3 of the energy used in the house goes towards heating the home, with hot water heating making up 13% and the house electric representing 23%. The breakout of natural gas use between domestic hot water heating and heating for the house are provided in the following graph.
Figure 31. Duplex residence natural gas energy use breakout
Gas to Furnace (Mmbtu)
64%
Gas to Water Heater (Mmbtu)
13%
House Electric (MMBtu)
23%
Duplex #1 Energy Use Breakout
Gas to Furnace (Mmbtu)
83%
Gas to Water Heater
(Mmbtu)17%
Duplex #1 Gas Furnace and Gas Water Heater Breakout

44
Approximately 17% of the energy use is going towards domestic hot water heating, not including the contribution from the solar hot water system.
As stated above, of the total energy use, 77% is going towards natural gas and 23% towards electrical loads. This significant gas load is partially based on the fact that the units do not have any mechanical air conditioning systems and reinforce the need to reduce the thermal energy use requirements as much as possible through an efficient building envelope.
The PV system produced 55% of the total energy use of the house.
Figure 32. Duplex energy use versus PV production
3.4.3 Solar Domestic Hot Water Systems The preheat tank contribution to the domestic hot water heating load was directly measured for both solar domestic hot water (SDHW) systems. Cold water inlet, solar hot water preheat tank outlet to the on-demand hot water and the on-demand hot water heater outlet temperatures were monitored. The domestic hot water flow rate was measured, but the pumping power/energy for the glycol loop and SDHW system control unit were not monitored and the energy consumption for these portions of the system is unknown. The lack of these measurements limits the analysis to simply how much contribution to the domestic hot water load is met by the preheat tank from the SDHW system.
Table 17 provides a listing of the total domestic hot water load and contribution from the preheat tank/ SDHW system.
050
100150200250300350400450500
Jan-
10
Feb-
10
Mar
-10
Apr-
10
May
-10
Jun-
10
Jul-1
0
Aug-
10
Sep-
10
Oct
-10
Nov
-10
Dec-
10
Elec
tric
ity (k
Wh/
mon
.)
Electricity Use vs PV Production
House In
PV

45
Table 17: Preheat Tank Contribution to DHW Load, Duplex Units
Month Average Gallons/Day
DHW Mains Temperature in
(F)
DHW Pre-Heat Out
from SHW (F)
DHW to House (F)
Preheat Tank (kWh)
Aux Tank (kWh)
DHW Total (kWh)
Percent Contribution from Solar
Preheat Tank
Jan-10 58.984 51.96 81.66 106.11 151.5 173.8 325.3 47% Feb-10 60.538 52.55 96.27 102.32 129.9 156.5 286.3 45% Mar-10 59.542 59.79 108.18 113.58 205.3 84.4 289.7 71% Apr-10 60.080 60.77 115.94 116.48 140.0 62.4 202.5 69% May-
10 59.226 70.63 116.09 112.34 231.5 57.7 289.2 80% Jun-10 57.503 72.55 70.85 115.64 122.1 26.6 148.6 82% Jul-10 53.431 74.08 72.95 115.37 2.9 190.4 193.3 1% Aug-10 55.019 76.28 128.31 108.88 1.2 149.8 150.9 1% Sep-10 55.782 70.47 116.46 105.31 142.8 0.0 142.8 100% Oct-10 57.420 65.53 97.16 109.99 138.9 1.0 139.8 99% Nov-10 53.494 60.12 84.62 111.57 99.2 82.7 181.9 55% Dec-10 54.274 32.00 32.00 32.00 77.5 115.3 192.8 40% Total 57.11 62.23 93.37 104.13 984.3 901.5 1885.9 52%
The total DHW load on a monthly basis plotted against the SHW production on a monthly basis in the following graph.
Figure 33. Duplex solar hot water production versus domestic hot water load
It is apparent that the solar hot water system stopped operating during the months of July and August, and the total output from the SDHW system exceeded the total load in September and October. The loss of solar hot water during the months of July and August was the result of incorrectly wired outlets powering the control system and pump for the solar thermal collectors.
0.0
50.0
100.0
150.0
200.0
250.0
300.0
350.0
Jan-
10
Feb-
10
Mar
-10
Apr-
10
May
-10
Jun-
10
Jul-1
0
Aug-
10
Sep-
10
Oct
-10
Nov
-10
Dec-
10
Mon
thy
Ener
gy (k
Wh)
SHW vs Total DHW Use
Solar Hot Water
Total Hot Water

46
The electrician installed Ground Fault Circuit Interruption (GFCI) outlets and Arc Fault Circuit Interruption (AFCI) breakers for the basement outlets, which are not compatible and make the circuit powering the solar system prone to false trips. The solar contractor remedied the outlet issue and had to replace the glycol in Duplex 2 as the glycol had stagnated and was effectively cooked in the collectors for an extended period of time.
3.4.4 Natural Ventilation The duplex units are designed and constructed without any mechanical cooling. The units were designed with automated natural ventilation systems. In addition to the natural ventilation systems, exterior window shading elements were designed to minimize shade in the winter (<10%) and provide the greatest percent shade difference between heating and cooling seasons. It should be noted that the north facade does not require shading devices because it has no direct sunlight (Table 18).
Table 18: Window Overhang Sizing
Unfortunately, due to funding constraints the window overhangs were never installed. This design oversight had a significant impact on the indoor temperatures within the units and the units ended up over heating during the summer of 2010.
The natural ventilation system was installed to enable the sensor to read the indoor temperature on the 2nd floor and the outside air temperature. The control sequence for the units was set up so that the system would open the windows if the second floor temperature was above 78 °F and the outside air temperature was lower than 78 °F. The occupants were instructed to open the lower windows when the clerestory windows opened and to turn on the ventilation fan for the house when the clerestory windows opened. The maximum observed indoor air temperatures within the duplex units are provided in the two figures below and occurred on July 17th, 2010.
Façade Window Description Net DimensionRecommended
Length (in) Recommended Height
Above Window (in) Recommended Width
Beyond Window Edge (in)
SouthTwo 36in x 60in windows on w/ two 36in x 30in windows below 1st floor 72in x 90in 30 12 12
South Two 30in x 48in windows on 1st floor 60in x 48in 18 12 12
SouthTwo 36in x 30in windows w/ two 36in x 30in windows below on 2nd floor 72in x 60in 18 12 12
West Two 36in x 24in windows on 1st floor 72in x 90in 30 18 12West Two 36in x 24in windows on 2nd floor 72in x 90in 30 18 12
WestTwo 36in x 30in windows on w/ two 36in x 30in windows below 1st floor 72in x 60in 30 18 12
East Two 36in x 24in windows on 1st floor 72in x 24in 30 24 5East Two 36in x 24in windows on 1st floor 72in x 24in 30 24 5

47
Figure 34. Duplex 1 August 17th temperature profile
Figure 35. Duplex 2 August 17th temperature profile
The outside air temperatures peaked at 100 °F and the indoor air temperatures peaked at 87 °F. Additional details related to the operational problems of the natural ventilation system are provided below.
40
50
60
70
80
90
100
Tem
pera
ture
(F)
Duplex 1 Temperature Setpoint
Inside Air Temp
Outside Air Temp
40
50
60
70
80
90
100
Tem
pera
ture
(F)
Duplex 2 Temperature Setpoint
Inside Air Temp
Outside Air Temp

48
3.5 PV Systems Duplex Analysis Results NREL compared on-site solar measurements against typical meteorological year solar data and modeled energy production estimates in order to characterize the performance of each PV array. The annual average solar resource was measured with an on-site weather station and the global horizontal solar radiation was compared to historical averages for Boulder, Colorado. The measured solar resource for 2010 was significantly higher than the historical averages, with single months achieving 21% more solar energy and 10% more solar energy on an annual basis. The measured output of all three PV systems was compared to a PVWatts simulation and a component-based Solar Advisor Model (SAM).
NREL built the SAM model with the actual panel and inverter characteristics and represents the most accurate comparison model. The results show that the single-family residence PV system was within 1% of the production predicted by SAM and the two duplex systems produced 17% to 21% less energy than the SAM model predicted. The original shading projections had estimated a 7% reduction in energy production for the duplex systems, so the shading was more severe than initially anticipated. Given that the solar resource was 10% better than that used in the baseline SAM model and the two duplex units had significant shading implications, all of the systems produced less energy than initially projected.
Table 19 gives PV system characteristics, and Figure 37 shows the solar radiation compared to PV production for a three-day period in April 2011.
Table 19: PV System Comparisons
MonthAverage Incident Global
Horizontal Solar Rad (W/m2, NREL 183223)
Measured Average Incident Global
Horizontal Solar Rad (W/m2)
Percent Difference
(%)
PV Watts (kWh)
SAM (kWh) Ranch (kWh)Percent
Difference (%)
Duplex 1 (kWh)
Percent Difference
(%)
Duplex 2 (kWh)
Percent Difference
(%)
1 98.6 108.1 9% 166 176 146 -20% 124 -42% 113 -56%2 135.4 136.3 1% 179 190 132 -44% 121 -57% 103 -84%3 182.7 197.6 8% 271 285 241 -19% 203 -41% 197 -44%4 230.0 237.6 3% 287 303 308 2% 249 -21% 249 -21%5 257.6 304.3 15% 311 328 371 12% 298 -10% 315 -4%6 283.9 305.3 7% 308 326 337 3% 296 -10% 296 -10%7 278.7 296.2 6% 297 317 335 5% 280 -13% 299 -6%8 248.4 282.2 12% 287 306 339 10% 274 -12% 307 0%9 207.7 261.3 21% 261 278 332 16% 264 -5% 295 6%
10 157.7 175.8 10% 223 241 260 7% 207 -17% 218 -11%11 109.1 124.2 12% 167 180 183 2% 135 -34% 148 -22%12 88.1 98.3 10% 155 166 146 -13% 107 -55% 115 -44%
Total 2,277.9 2,527.1 10% 2,912 3,096 3,131 1% 2,556 -21% 2,656 -17%
PV System Comparisons
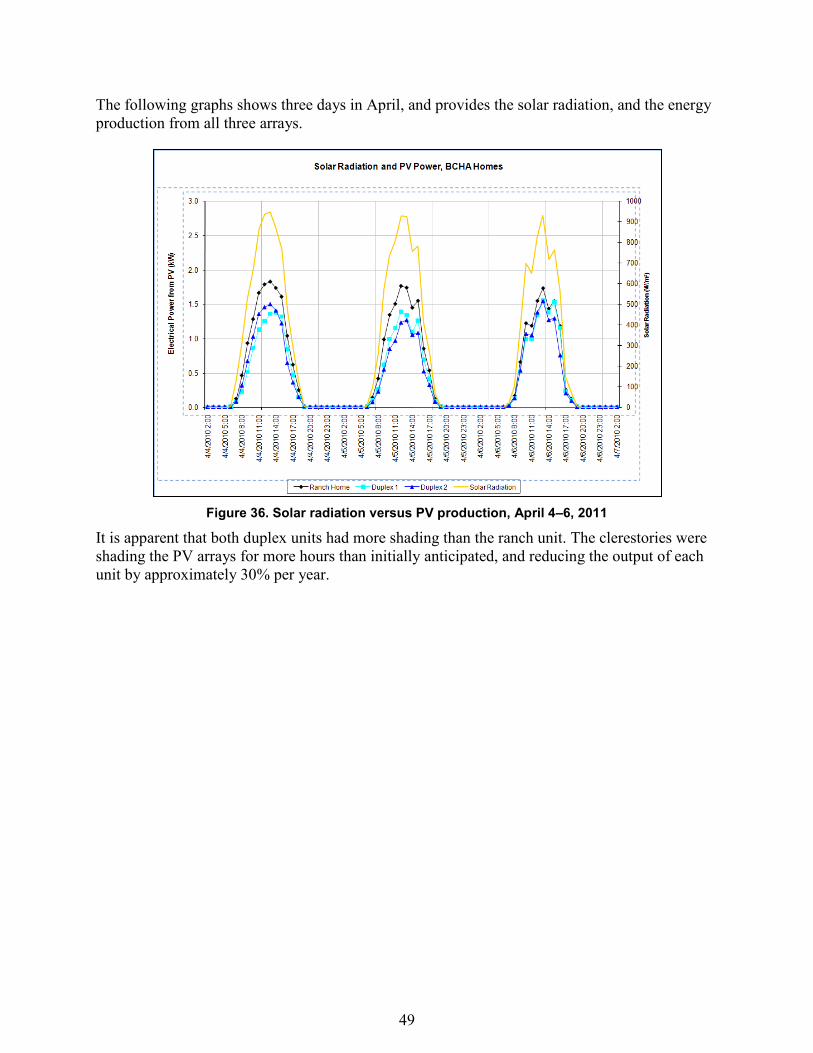
49
The following graphs shows three days in April, and provides the solar radiation, and the energy production from all three arrays.
Figure 36. Solar radiation versus PV production, April 4–6, 2011
It is apparent that both duplex units had more shading than the ranch unit. The clerestories were shading the PV arrays for more hours than initially anticipated, and reducing the output of each unit by approximately 30% per year.
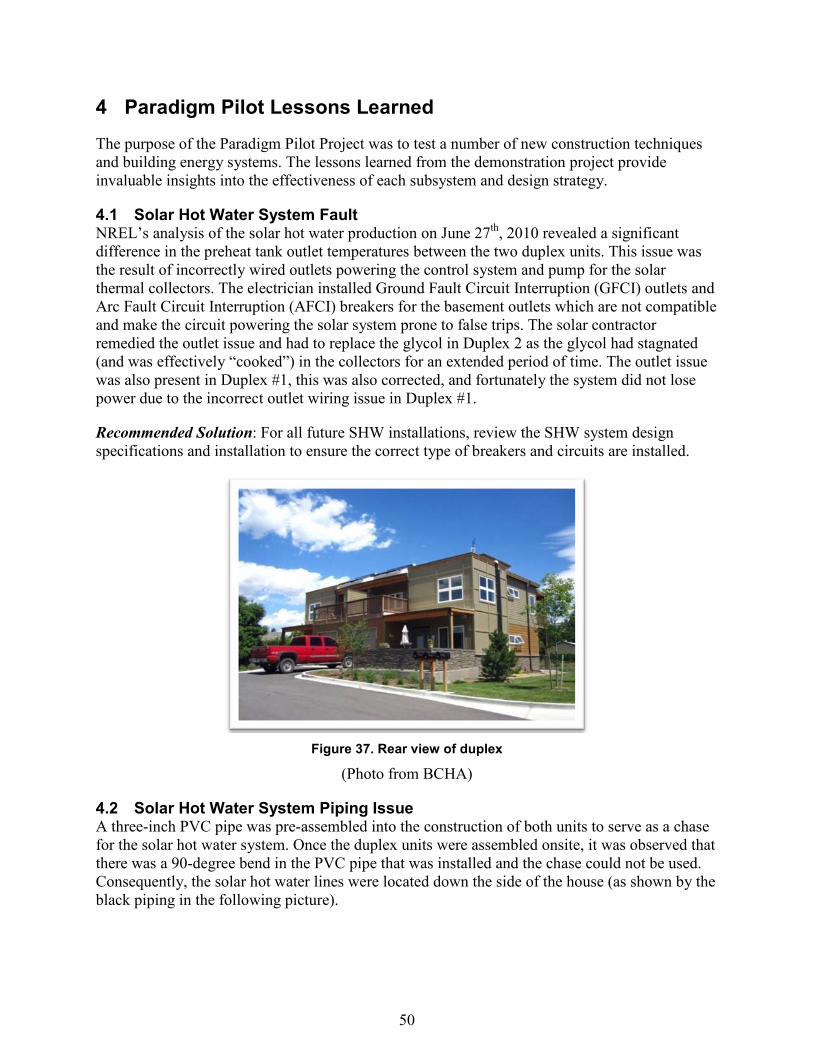
50
4 Paradigm Pilot Lessons Learned
The purpose of the Paradigm Pilot Project was to test a number of new construction techniques and building energy systems. The lessons learned from the demonstration project provide invaluable insights into the effectiveness of each subsystem and design strategy.
4.1 Solar Hot Water System Fault NREL’s analysis of the solar hot water production on June 27th, 2010 revealed a significant difference in the preheat tank outlet temperatures between the two duplex units. This issue was the result of incorrectly wired outlets powering the control system and pump for the solar thermal collectors. The electrician installed Ground Fault Circuit Interruption (GFCI) outlets and Arc Fault Circuit Interruption (AFCI) breakers for the basement outlets which are not compatible and make the circuit powering the solar system prone to false trips. The solar contractor remedied the outlet issue and had to replace the glycol in Duplex 2 as the glycol had stagnated (and was effectively “cooked”) in the collectors for an extended period of time. The outlet issue was also present in Duplex #1, this was also corrected, and fortunately the system did not lose power due to the incorrect outlet wiring issue in Duplex #1.
Recommended Solution: For all future SHW installations, review the SHW system design specifications and installation to ensure the correct type of breakers and circuits are installed.
Figure 37. Rear view of duplex
(Photo from BCHA)
4.2 Solar Hot Water System Piping Issue A three-inch PVC pipe was pre-assembled into the construction of both units to serve as a chase for the solar hot water system. Once the duplex units were assembled onsite, it was observed that there was a 90-degree bend in the PVC pipe that was installed and the chase could not be used. Consequently, the solar hot water lines were located down the side of the house (as shown by the black piping in the following picture).

51
Recommended Solution: For all future SHW installations, ensure that the solar hot water chase does not have any bends or obstructions and allows for a clean path to the basement.
4.3 Ground Source Heat Pump Air Handling Unit Nuance Trip By analyzing metered data, NREL found the ground source heat pump air handling unit to be operating continuously during a period of time when the tenants were on vacation. NREL determined that the excessive energy use was due to an air filter being completely obstructed. A local mechanical contractor had made a site visit in late February to diagnose this issue and replace the air filter. The control system was set up so that when the filter becomes obstructed, the unit will lock out the compressor on high refrigerant pressure due to the low airflow. This is a common control mechanism as excessive head pressure and excessive suction can damage the compressor. When this happens, the unit is supposed to turn the thermostat screen red and display a call for service message, but it also continues to run the air handler fan continuously when the compressor is locked out.
Recommended Solution: Commission all HVAC systems after they are installed and provide educational training to the tenants on the proper operation of the units, including training on the service alert through the thermostat.
4.4 Photovoltaic System Shading An attempt was made to mitigate the shading implications from the clerestory windows through proper PV system placement and the use of Enphase micro-inverters on the back of each panel by the solar installer. The performance implications on the two duplex units have been greater than expected and have resulted in both PV systems producing 20% to 22% less energy than the ranch PV systems.
Figure 38. Duplex photovoltaic system and SHW panel layout
(Photo from BCHA)

52
Recommended Solution: There are two approaches that can be taken to mitigate or eliminate shading from the clerestory units. The first option is to simply re-design the placement of the panels to mitigate shading. The site could consider moving four panels to the top of each clerestory and reducing the rooftop PV system size by one panel, to 2.0 kW.
Another solution is to remove the clerestory altogether. The main purpose of the clerestory was to allow for natural day-lighting and natural ventilation. Since the natural ventilation system did not function as designed and the lighting energy use only contributed to a small amount of the overall electrical energy use, NREL recommends removing the clerestory from future designs. This will not only eliminate the shading on the solar panels, but will also reduce the construction costs associated with building the house.
4.5 Window Overhangs The window overhangs that were designed for the units were never installed. The window overhangs were a critical design element that would serve as an enabling technology that would significantly reduce the interior temperature of the units during the summer months. Since these were never installed, the units heated up to temperatures that were significantly higher than acceptable.
Recommended Solution: Window overhangs should be installed on all south facing facades and designed to minimize winter shading and maximizing summer shading. Shading elements can also be installed on the east and west windows.
4.6 Oversized HVAC Systems During the initial design meetings, BCHA had asked the mechanical engineers to include the basement in the sizing calculations and consider the basement space conditioned space. The basements for all three residents were only partially finished and no supply air registers were installed to provide conditioned air to the basement. Thus, the systems were oversized to meet a load that did not exist.
Recommended Solution: Only include conditioned spaces in the load calculations and right size HVAC equipment. Note that the recorded outside air temperature was significantly lower than the recommended ASHRAE design condition, and the GSHP was barely able to meet the space temperature set point during the most extreme condition. Thus, it was beneficial to oversize the GSHP system in this case. In addition, small residential gas furnaces only come in certain sizes (i.e., 80 kBtu/hr to 60 kBtu/hr), making it difficult to install a furnace that is just 10% larger than the design size required based on ASHRAE design conditions. BCHA should take all of these design decisions and trade-offs into account when sizing the system, while minimizing over-designing the equipment.
4.7 Programmable Thermostat The sub-metered data showed that 50% to 70% of the energy used within each home went to heating and cooling the home. The most significant energy savings measure the occupant can control is related to programming the thermostat to set back the HVAC system during unoccupied periods. None of the tenants programmed their thermostat and, consequently, used significantly more energy than was initially projected for heating and cooling the facilities.
53
Recommended Solution: Implement an occupant education program to teach home owners about the energy implications of their actions and provide support for programming the thermostats.
Automated Natural Ventilation Systems The automated natural ventilation systems were not designed correctly and did not provide adequate cooling to the duplex units. The control sequence for the units was set up so that the system would open the windows if the second floor temperature was above 78 °F and the outside air temperature was lower than 78 °F. The main problem with this system is that it did not provide an automatic means of opening windows on the lower floors to provide a full relief air path. In addition, the tenants were instructed to turn on their HVAC system fans on when the windows were open to help move air throughout the residence. The residents ended up running the HVAC system fans 24/7 and using over 50% of the PV system power produced during the summer months, which did more harm than good. When the fans were operated 24/7, the fan motor heated the house more than the natural ventilation cooled the house. In addition, the temperatures within the space rose above 85 °F and the occupants were uncomfortable during the hottest months this summer.
Recommended Solution: A natural ventilation system is not recommended for the main development. If BCHA pursues a natural ventilation system in the future, NREL recommends an automated system similar to the Nightbreeze system.13 This system is set up to pre-cool the house at night, and deactivate the system during the day.
13 Davis Energy Group Nightbreeze, http://www.davisenergy.com/technologies/nightbreeze.php

54
5 Sub-metered energy performance
5.1 Modeled versus Measured Energy Usage The modeled and measured annual utility bills are provided in the following graph. Note that the duplex was the only residence that was modeled in BEopt. The ranch house is provided for consistency, but was not compared to a BEopt energy model.
Figure 39. Annual utility bill comparison
The measured utility data shows significant savings over all three baselines. Duplex #1 provided an energy cost savings of $757/year over a code compliant IECC 2006 home. The increased annual utility bill of duplex 2 was driven by increased occupant energy use. The residents in duplex #2 used 2.5 times the lighting and miscellaneous plug load energy use as duplex #1, emphasizing the importance of occupant education and training programs.
The site energy use intensity of each residence and the predicted energy intensity of each duplex is provided in the following graph. The baseline modeled EUIs are provided for each duplex and do not include any onsite renewable energy systems. The measured data for the duplex units and ranch house include the reduction in energy use associated with the production from the renewable energy systems. The EUI for the ranch house without the PV system was 39.4 kBtu/ft2 and would have been 44.5 kBtu/ft2 for Duplex 1, as 37% of the energy of the ranch home came from the PV system and 55% of the electricity for Duplex 1 was provided by the PV system.
$2,101
$1,347
$1,109 $961
$595 $583
$0
$500
$1,000
$1,500
$2,000
$2,500
BA Mid1990's
IECC 2006 BCHABaseline
Duplex 2 Duplex 1 Ranch
Annu
al U
tility
Bill
s ($
/yr)
Annual Utility Bill Comparison
Modeled Data Measured Data
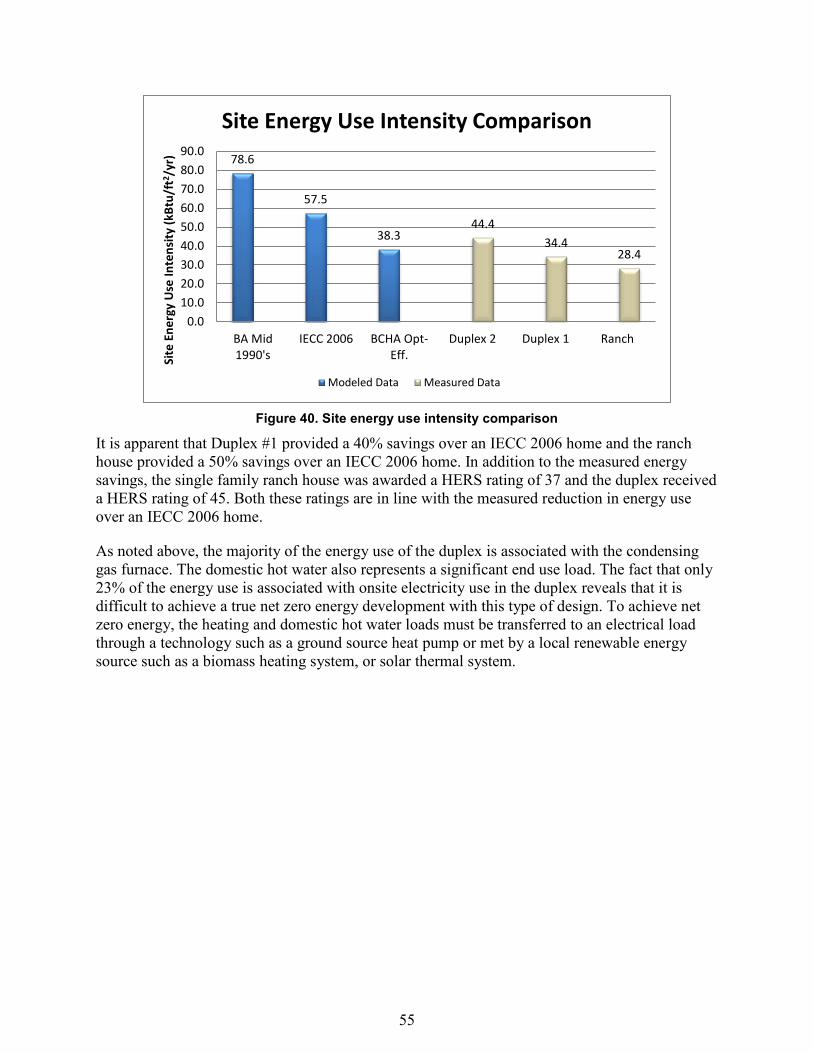
55
Figure 40. Site energy use intensity comparison
It is apparent that Duplex #1 provided a 40% savings over an IECC 2006 home and the ranch house provided a 50% savings over an IECC 2006 home. In addition to the measured energy savings, the single family ranch house was awarded a HERS rating of 37 and the duplex received a HERS rating of 45. Both these ratings are in line with the measured reduction in energy use over an IECC 2006 home.
As noted above, the majority of the energy use of the duplex is associated with the condensing gas furnace. The domestic hot water also represents a significant end use load. The fact that only 23% of the energy use is associated with onsite electricity use in the duplex reveals that it is difficult to achieve a true net zero energy development with this type of design. To achieve net zero energy, the heating and domestic hot water loads must be transferred to an electrical load through a technology such as a ground source heat pump or met by a local renewable energy source such as a biomass heating system, or solar thermal system.
78.6
57.5
38.3 44.4
34.4 28.4
0.010.020.030.040.050.060.070.080.090.0
BA Mid1990's
IECC 2006 BCHA Opt-Eff.
Duplex 2 Duplex 1 Ranch
Site
Ene
rgy
Use
Inte
nsity
(kBt
u/ft
2 /yr
)
Site Energy Use Intensity Comparison
Modeled Data Measured Data

56
6 Josephine Commons Site
NREL used the lessons learned and sub-metered energy performance of the Paradigm Pilot Project to inform the final design decisions for the Josephine Commons Project. The Josephine Commons development is located on a 14-acre parcel of land in Lafayette Colorado and will consist of the following housing units:
• 70 unit senior 1 and 2 bedroom apartments
• 54 1- and 2-story townhouse units
• 22 1- and 2-story duplex units
• 7 single-family lots. As a part of the strategic vision for the project, the BCHA set performance goals for energy efficiency and renewable energy on a life-cycle cost basis for the residential units. BCHA adopted the net zero site energy performance goal for all of the residential buildings on Josephine commons site. The goal was to design each residential unit to produce as much energy through onsite renewable energy systems as it used on an annual basis, including both electrical and thermal energy use. The site is located just northwest of the intersection of Highway 7 (Baseline Road) and 119th Street in Lafayette, Colorado. A graphic representation of the site is provided in the following graphic.
Figure 41. Josephine Commons Net Zero Energy Community
(Image from HB&A Architects)

57
In order to finalize the design of the Josephine Commons project, a final decision on the type of HVAC and DHW system was required, as well as additional analysis on the energy cost implications of modifying the building envelope.
6.1 HVAC System Analysis The current version of BEopt cannot directly model GSHP systems. Thus, NREl analyzed the HVAC and DHW systems using submetered performance data from the GSHP installed on the single family unit. The total hourly heating and cooling loads were summed over the course of the calendar year to provide a total annual cooling load of 2,226 kWh/yr and heating load of 40.39 Mmbtu/yr. The annual loads measured by the GSHP system were combined with the measured energy use of the GSHP in heating and cooling mode and the energy contribution from the DSH. The energy use of the GSHP system was directly compared to a traditional direct expansion cooling unit and forced air furnace. The traditional HVAC system was assumed to have the following characteristics:
• Furnace efficiency: 96%
• Cooling efficiency: 13 (SEER)
• Domestic Hot Water: 78% efficient on-demand natural gas NREL compared the traditional HVAC and DHW system to the GSHP installed at the Paradigm site.
Table 20: HVAC System Comparison
GSHP – Horizontal
Loop Field Furnace & SEER 13 AC
Heating Efficiency 4.83 96% Cooling Efficiency 4.03 3.8 Heating Cost $372 $210 Cooling Cost $58 DHW Efficiency - 0.78 DHW Save -$63 0 DHW Cost $57 $27 Gas Meter Fee $0 $127 Gas Utility $0 $1,500 HVAC Cost $8,200 $6,476 Annual Cost $366 $422 Initial Cost $8,200 $7,976 Incremental Cost $224 N/A Annual Cost Save $55.23 N/A Simple Payback 4.1 N/A
The capital costs for the HVAC system options were provided by Milender White, the construction company managing the construction of the project, are listed below:
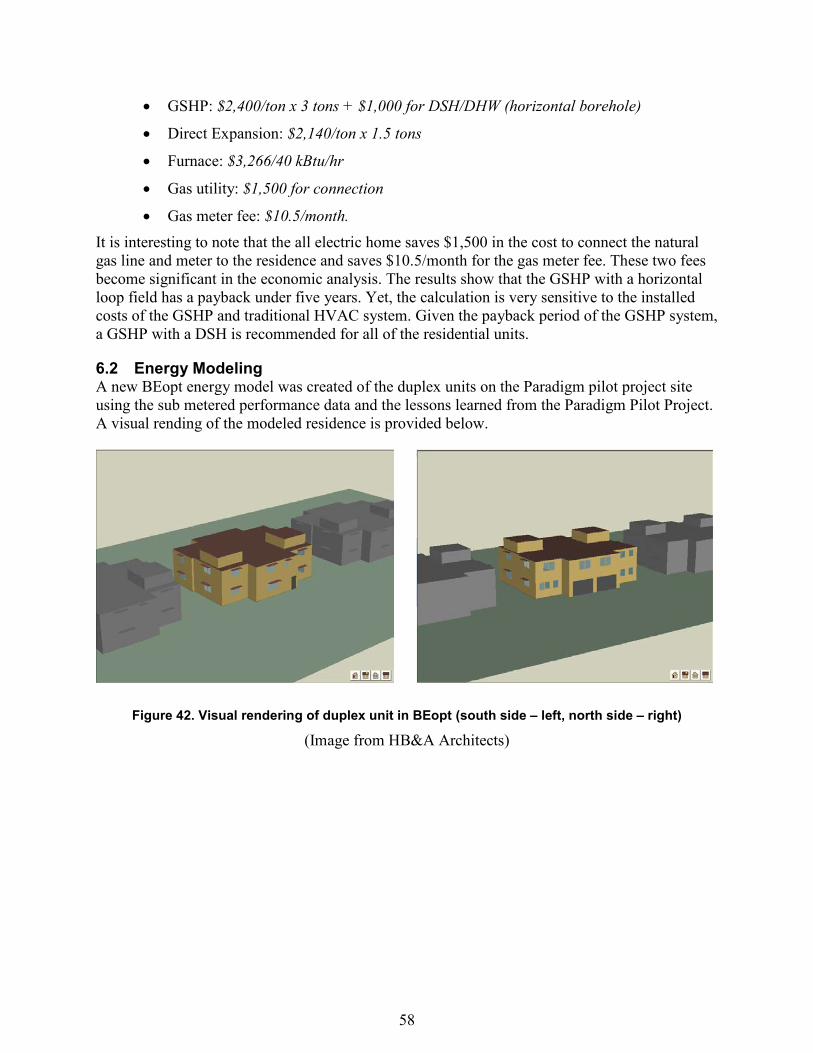
58
• GSHP: $2,400/ton x 3 tons + $1,000 for DSH/DHW (horizontal borehole)
• Direct Expansion: $2,140/ton x 1.5 tons
• Furnace: $3,266/40 kBtu/hr
• Gas utility: $1,500 for connection
• Gas meter fee: $10.5/month. It is interesting to note that the all electric home saves $1,500 in the cost to connect the natural gas line and meter to the residence and saves $10.5/month for the gas meter fee. These two fees become significant in the economic analysis. The results show that the GSHP with a horizontal loop field has a payback under five years. Yet, the calculation is very sensitive to the installed costs of the GSHP and traditional HVAC system. Given the payback period of the GSHP system, a GSHP with a DSH is recommended for all of the residential units.
6.2 Energy Modeling A new BEopt energy model was created of the duplex units on the Paradigm pilot project site using the sub metered performance data and the lessons learned from the Paradigm Pilot Project. A visual rending of the modeled residence is provided below.
Figure 42. Visual rendering of duplex unit in BEopt (south side – left, north side – right)
(Image from HB&A Architects)

59
Figure 43. Visual rendering of duplex unit in BEopt (basement view – left, first floor plan – right)
(Image from HB&A Architects)
NREL made the following changes the final energy model:
• The miscellaneous electric loads and lighting energy use were calibrated to match the annual energy use recorded for the lower energy use tenant in the duplex units.
• The infiltration rate was modified to match that recorded at the site.
• The HVAC system was modeled as a modified air source heat pump.
• The ERV specifications were modeled as designed.
• The window-to-wall ratio and construction characteristics were revised.
• The utility rates and escalation rates that were modeled are provided below: o Electric rate $0.09/kWh, $6.75/month fixed (0.36% annual escalation)
o Gas rate $0.5/therm, $10.28/month fixed (1.92% annual escalation)
The end use energy sub-metering presented above showed that 50% to 75% of the energy use of all three residences was associated with HVAC and DHW energy use. In addition, the IECC 2012 code requirements are projected to significantly increase the thermal performance requirements of the roof, windows, and walls. A comparison of the construction characteristics at the Paradigm pilot project compared to IECC 2009 and the proposed IECC 2012 values are provided in Table 21.

60
Table 21: IECC 2009 and 2012 Comparison to Paradigm Pilot Project Construction Characteristics
Building Envelope Analysis
Characteristic Paradigm Project
IECC 2009 (Climate Zone 5B)
Percent Improvement %
IECC 2012 (Climate Zone
5B) Percent Improvement
%
Ceiling R-Value 60 38 22% 49 18% Above Grade Wall R-
Value 22.8 20 12% 20 12% Foundation Wall R-
Value 22 10 55% 15/19
Under slab R-Value 5 N/A
N/A
Window U-Value 0.32 0.35 9% 0.32 0%
Window SHGC 0.28 N/A
N/A
The City of Lafayette adopted the 2009 International Building Code in the Spring of 2011 and it is apparent that if the Josephine commons site is constructed with the same building envelope characteristics as the paradigm pilot project, the BCHA would be essentially constructing a code minimum facility when compared to the IECC 2012 building envelope requirements for climate zone 5B. Thus, the final energy modeling analysis focused on a series of parametric runs to determine the cost effectiveness of increasing the performance of the building envelope characteristics and using a programmable thermostat. NREL modified the following parameters to increase the performance of the building envelope and HVAC system:
6.3 Programmable Thermostats NREL modeled programmable thermostats with an assumed cost premium of $100 for the duplex. The programmable thermostat measure resulted in an additional 5% EUI savings.
6.4 Window Type The window performance was increased to an R-5 window, with a higher SHGC. The modeled U value was 0.20 with a SHGC of 0.45. Based on the window area, the cost premium was assumed to be $5.00/ft2 and resulted in an installed cost of $3,785 and produced an EUI savings of 6.6%
6.5 Wall Insulation The wall insulation R vale was increased to ~ R 29.4 by increasing the external foam board thickness from 0.5 inches to 2 inches. This resulted in a 3.8% EUI savings at a cost premium of $2,580.

61
6.6 Final Recommendations The final recommendations for the Josephine Commons site were developed through the iterative process of building a pilot project, testing different energy systems, and revising the modeled energy usage data with measured data.
6.6.1 Wall Construction The walls in the Paradigm Pilot Project are currently constructed with 2 x 6 studs that are located at 16 in OC. The cavity is insulated with an icenyne-based expanding foam and ½ inch of foam board is applied as exterior insulation. The construction results in an effective R value of 25 for the insulated cavity and an R value of 12.34 for the wall plates, studs and header. With the studs located at 16 in OC the overall framing factor is 25% and results in an effective R value of the assembly of R 21.8.
Recommendation: Specify a minimum R value for the wall assembly of R-30 (including framing factor). The site has the option of placing the 2 x 6 studs at 24 in OC and increasing the exterior wall insulation thickness to 2 inches, or as an alternative option the site can use a spray foam with a higher R value per inch. For example, a polyurethane spray foam has an R value per inch above R-6/inch, which is approximately double the current spray foam. This higher performance spray foam can be combined in a hybrid wall with batt insulation to reduce the installation costs and still achieve an R-30 wall assembly.
6.6.2 Roof Construction The sectional drawing for the Paradigm Pilot Project indicate 6" icynene insulation sprayed beneath the roof decking, for an approximate value of R-22. The remainder of the attic space is completely filled with blown-in insulation, which varies in thickness according to the slope of the roof. The narrowest section of the roof is 15", and the highest section is 21.5". The blown-in insulation ranges from R-31.5 to R-54, in addition to the R-22 icynene.
Recommendation: Specify a roof construction that has minimum R value that is equivalent to the current construction at the Paradigm Pilot project.
6.6.3 Window Construction The current windows are double paned low-e windows with a U value of 0.32 (Btu/hr-ft2-F) and a SHGC of 0.28. The window frames are made of vinyl and the majority are single-hung windows.
Recommendation: To take advantage of passive solar heating in the winter months, install windows with high solar heat gain coefficient (SHGC). Specify a window with the following characteristics:
• Center of Glass U-value: ≤ 0.215 [Btu/hr-ft2-F]
• SHGC: ≥ 0.5
• Vis T: ≥ 0.6
• Frame Construction: Fiberglass

62
6.6.4 Window Overhangs Window overhangs were not installed and the demonstration overhang was not sized based on the recommendations provided by NREL.
Recommendation: Specify a window overhang with the following dimensions. Note that the overhang should be placed above the window at the height provided in the table below.
Table 22: Window Overhang Sizing
6.6.5 Basement Walls and Floor The basement walls are constructed with an ICF frame and an R value of 22. A one-inch layer of board insulation was placed underneath the floor of one duplex unit, resulting in a floor R value of R 5.
Recommendation: Specify a minimum R value for the ICF walls of 22.
6.6.6 Infiltration The effective leakage areas for the ranch and duplex were measured as 31.3 in2, and 50 in2, respectively. The value of the duplex infiltration is somewhat questionable based on the fact that it shares a common wall with the adjacent unit, and is probably lower than that stated.
Recommendation: Specify a maximum effective leakage area for each unit of 40 in2 per unit. All trades must take ownership of the infiltration requirement and meet the following requirements:
• House wrap shall be overlapped and taped correctly.
• All exterior penetrations shall be sealed.
• Gasket joints shall be installed between modular units.
• Additional infiltration points shall be filled spray foam.
6.6.7 Thermostats The thermostats that were installed in each residence were programmable thermostats.
Façade Window Description Net Dimension Recommended Length (in) Recommended Height
Above Window (in) Recommended Width
Beyond Window Edge (in)
SouthTwo 36in x 60in windows on w/ two 36in x
30in windows below 1st floor 72in x 90in 18-24 6 6South Two 30in x 48in windows on 1st floor 60in x 48in 18-24 6 6
SouthTwo 36in x 30in windows w/ two 36in x
30in windows below on 2nd floor 72in x 60in 18-24 6 6West Two 36in x 24in windows on 1st floor 72in x 90in 18-24 6 6West Two 36in x 24in windows on 2nd floor 72in x 90in 18-24 6 6
WestTwo 36in x 30in windows on w/ two 36in x
30in windows below 1st floor 72in x 60in 18-24 6 6East Two 36in x 24in windows on 1st floor 72in x 24in 18-24 6 6East Two 36in x 24in windows on 1st floor 72in x 24in 18-24 6 6

63
Recommendation: Specify programmable thermostat with the following characteristics:
• Minimum of 7 day scheduling capability
• Easy to program
• Adjustable dead-band (differential where thermostat remains neutral – no heating or cooling).
6.6.8 Ground Source Heat Pump and Domestic Hot Water Recommendation: NREL recommends a GSHP with a DSH for the Josephine Commons site. BCHA should specify the highest efficiency unit that is available and ensure the total installed costs are less than $3,500/ton, including the cost of the ground loop heat exchanger. Due to the larger scope of the facility with over 80 heat pump units, each facility will use a decoupled ground loop system. Each facility will load share between heat pumps using a VFD controlled by pressure differential, which will substantially reduce the pumping energy use. In addition, a DSH and a preheat tank should be installed in each residence.
6.6.9 Balanced Energy Recovery Ventilator Recommendation: BCHA should install a balanced energy recovery or heat recovery ventilator in each residence. The same energy recovery ventilator that was installed at the Paradigm pilot project can be specified for the Josephine commons site:

64
Table 23: Mechanical Ventilation Characteristics
Mechanical: Balanced
Sensible Recovery Eff. (%): 75
Total Recovery Eff. (%): 62
Rate (cfm): 70
Hours/Day: 8
Fan Watts: 94
Cooling Ventilation: Natural Ventilation
BCHA should set up the balanced energy recovery ventilator to cycle on off and off for a total run time of eight hours a day. A wall-mounted switch in each restroom should turn on the ERV for 10 minutes once the switch is activated.
6.6.10 Lighting Specify compact fluorescent or LED lighting for all hard wired interior lighting systems. The site should specify LED lighting for all exterior accent lighting systems.
6.6.11 Appliances BCHA should specify appliances with the following characteristics:
• Refrigerator o Specify an ENERGY STAR, top-mount refrigerator that uses less than 374
kWh/yr.
• Oven o Specify an electric induction cooking range.
• Dishwasher o Specify an ENERGY STAR dish washer.
o Although NREL cannot endorse a specific product, Bosh makes a line of energy star appliances that use 50% less energy than an average new dishwasher. The model numbers are SHE68, SHV68, SHX68 and will use approximately 180 kWh/yr.
• Clothes Washer o Specify a horizontal axis, energy star clothes washer. The washer should
contain a weight sensing element and the site can potentially specify a cold-only dishwasher.
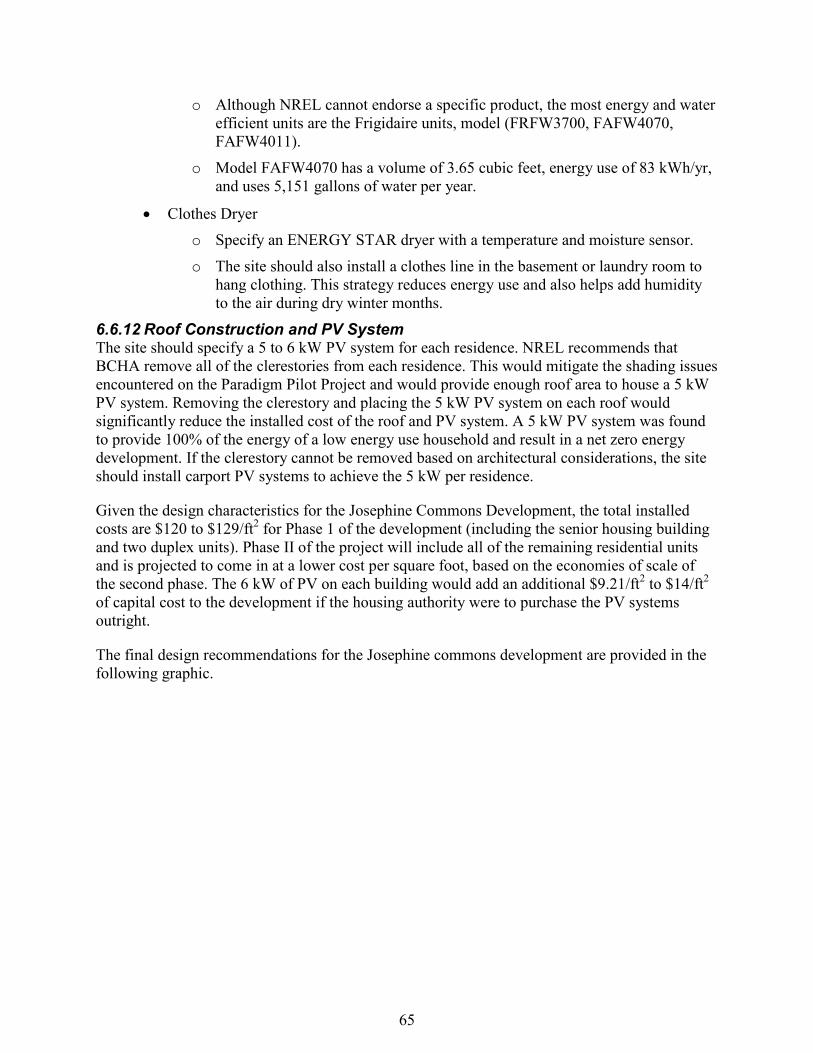
65
o Although NREL cannot endorse a specific product, the most energy and water efficient units are the Frigidaire units, model (FRFW3700, FAFW4070, FAFW4011).
o Model FAFW4070 has a volume of 3.65 cubic feet, energy use of 83 kWh/yr, and uses 5,151 gallons of water per year.
• Clothes Dryer o Specify an ENERGY STAR dryer with a temperature and moisture sensor.
o The site should also install a clothes line in the basement or laundry room to hang clothing. This strategy reduces energy use and also helps add humidity to the air during dry winter months.
6.6.12 Roof Construction and PV System The site should specify a 5 to 6 kW PV system for each residence. NREL recommends that BCHA remove all of the clerestories from each residence. This would mitigate the shading issues encountered on the Paradigm Pilot Project and would provide enough roof area to house a 5 kW PV system. Removing the clerestory and placing the 5 kW PV system on each roof would significantly reduce the installed cost of the roof and PV system. A 5 kW PV system was found to provide 100% of the energy of a low energy use household and result in a net zero energy development. If the clerestory cannot be removed based on architectural considerations, the site should install carport PV systems to achieve the 5 kW per residence.
Given the design characteristics for the Josephine Commons Development, the total installed costs are $120 to $129/ft2 for Phase 1 of the development (including the senior housing building and two duplex units). Phase II of the project will include all of the remaining residential units and is projected to come in at a lower cost per square foot, based on the economies of scale of the second phase. The 6 kW of PV on each building would add an additional $9.21/ft2 to $14/ft2 of capital cost to the development if the housing authority were to purchase the PV systems outright.
The final design recommendations for the Josephine commons development are provided in the following graphic.
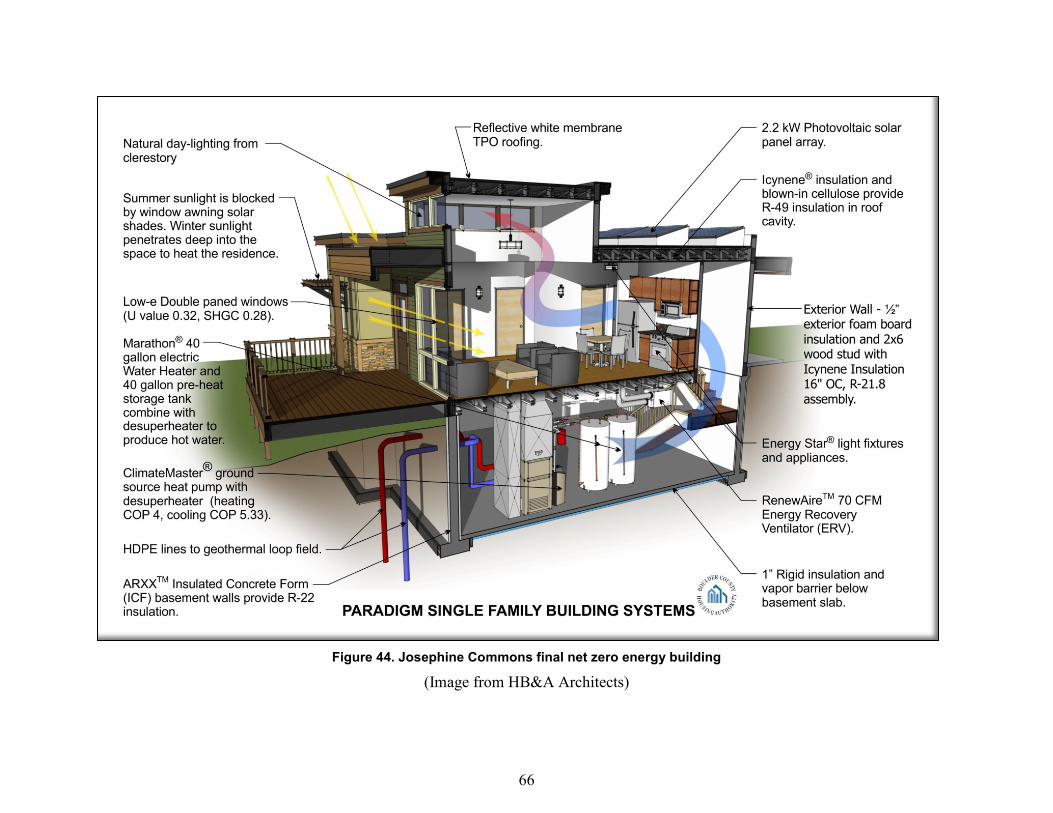
66
Figure 44. Josephine Commons final net zero energy building
(Image from HB&A Architects)
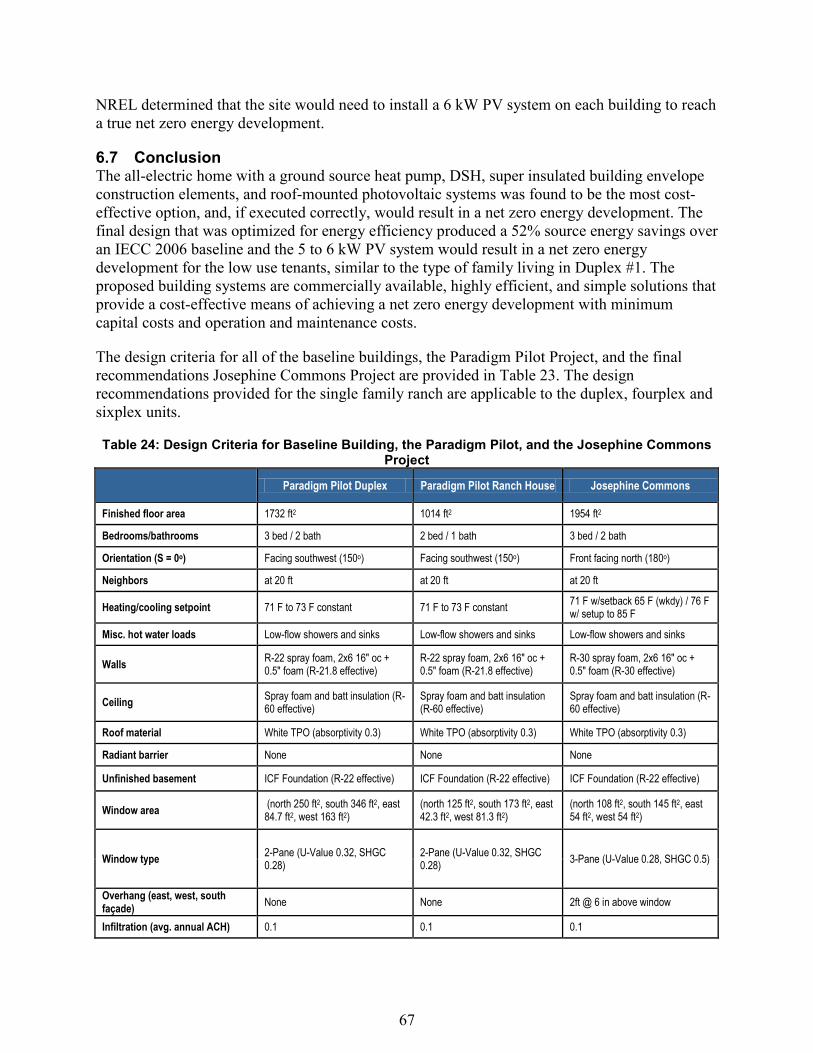
67
NREL determined that the site would need to install a 6 kW PV system on each building to reach a true net zero energy development.
6.7 Conclusion The all-electric home with a ground source heat pump, DSH, super insulated building envelope construction elements, and roof-mounted photovoltaic systems was found to be the most cost-effective option, and, if executed correctly, would result in a net zero energy development. The final design that was optimized for energy efficiency produced a 52% source energy savings over an IECC 2006 baseline and the 5 to 6 kW PV system would result in a net zero energy development for the low use tenants, similar to the type of family living in Duplex #1. The proposed building systems are commercially available, highly efficient, and simple solutions that provide a cost-effective means of achieving a net zero energy development with minimum capital costs and operation and maintenance costs.
The design criteria for all of the baseline buildings, the Paradigm Pilot Project, and the final recommendations Josephine Commons Project are provided in Table 23. The design recommendations provided for the single family ranch are applicable to the duplex, fourplex and sixplex units.
Table 24: Design Criteria for Baseline Building, the Paradigm Pilot, and the Josephine Commons Project
Paradigm Pilot Duplex Paradigm Pilot Ranch House Josephine Commons
Finished floor area 1732 ft2 1014 ft2 1954 ft2
Bedrooms/bathrooms 3 bed / 2 bath 2 bed / 1 bath 3 bed / 2 bath
Orientation (S = 0o) Facing southwest (150o) Facing southwest (150o) Front facing north (180o)
Neighbors at 20 ft at 20 ft at 20 ft
Heating/cooling setpoint 71 F to 73 F constant 71 F to 73 F constant 71 F w/setback 65 F (wkdy) / 76 F w/ setup to 85 F
Misc. hot water loads Low-flow showers and sinks Low-flow showers and sinks Low-flow showers and sinks
Walls R-22 spray foam, 2x6 16" oc + 0.5" foam (R-21.8 effective)
R-22 spray foam, 2x6 16" oc + 0.5" foam (R-21.8 effective)
R-30 spray foam, 2x6 16" oc + 0.5" foam (R-30 effective)
Ceiling Spray foam and batt insulation (R-60 effective)
Spray foam and batt insulation (R-60 effective)
Spray foam and batt insulation (R-60 effective)
Roof material White TPO (absorptivity 0.3) White TPO (absorptivity 0.3) White TPO (absorptivity 0.3)
Radiant barrier None None None
Unfinished basement ICF Foundation (R-22 effective) ICF Foundation (R-22 effective) ICF Foundation (R-22 effective)
Window area (north 250 ft2, south 346 ft2, east 84.7 ft2, west 163 ft2)
(north 125 ft2, south 173 ft2, east 42.3 ft2, west 81.3 ft2)
(north 108 ft2, south 145 ft2, east 54 ft2, west 54 ft2)
Window type 2-Pane (U-Value 0.32, SHGC 0.28)
2-Pane (U-Value 0.32, SHGC 0.28) 3-Pane (U-Value 0.28, SHGC 0.5)
Overhang (east, west, south façade) None None 2ft @ 6 in above window
Infiltration (avg. annual ACH) 0.1 0.1 0.1

68
Paradigm Pilot Duplex Paradigm Pilot Ranch House Josephine Commons
Mechanical ventilation ERV, 100% of ASHRAE 62.2 ERV, 100% of ASHRAE 62.2 ERV, 100% of ASHRAE 62.2
Furnace 96% eff. Condensing None None
Air conditioner None None None
Ground source heat pump None 4.0 COP heating, 18.2 EER cooling, forced air system
4.0 COP heating, 18.2 EER cooling, forced air system
Water Heater On-demand natural gas Conventional electric tank, 0.94EF, 40 gallons with de-super heater
Conventional electric tank, 0.94EF, 40 gallons with de-super heater
Refrigerator ENERGY STAR ENERGY STAR ENERGY STAR
Cooking range Electric Electric Electric induction
Dishwasher ENERGY STAR Electric ENERGY STAR Electric ENERGY STAR Electric
Clothes washer ENERGY STAR Electric ENERGY STAR Electric ENERGY STAR Electric
Clothes dryer Electric Electric Electric
Hardwired lighting 100% CFL 100% CFL 100% CFL
Plug-in lighting 100% CFL 100% CFL 100% CFL
Renewable energy 2.2 kW PV system, 30 evacuated tube solar hot water 2.2 kW PV system 6.0 kW PV system