Embed Size (px)
Citation preview
Team Members: Joshua Close, Bryan Perschbacher, Sean Reilly, Hunter Stevens, Jonathan
Thong, Etienne Viaud-Murat, Stephen Wormald
Faculty Advisor: George Qin, Ph.D.
School of Engineering & Computer Science, Cedarville University, Cedarville, OH 45314
Design and Fabrication of a Remote-Controlled Hydrofoil
Prototype
ABSTRACT
A remote-controlled hydrofoil prototype has
been designed, fabricated and tested by the
2018-2019 Cedarville University hydrofoil
senior design team. This project was the first
step toward a human-powered hydrofoil boat.
The prototype adopted a catamaran
configuration of two hulls connected to a middle
frame. A canard layout of three hydrofoils were
used to generate lift. Two Shutt struts were
employed to adjust the angle of attack of the two
front hydrofoils for pitch and roll control. An
above-water fan powered by an electric motor
was utilized to drive the prototype. The motor
was remote-controlled. The prototype design is
shown in Figure 1.
Figure 1: Cedarville Hydrofoil Prototype
In the design phase, extensive analytical and
numerical analyses were carried out to evaluate
the performance of the prototype designs.
Parameters including weight, buoyancy, lift,
drag, thrust, power, and takeoff speed were
calculated for each iteration of design.
Once the design was finalized, proper materials
were selected to fabricate the prototype
components. The manufacturing process was
made efficient with the aid of advanced CAD
tools like SolidWorks and modern
manufacturing techniques such as CNC
machining and 3D printing.
Numerous tests were then carried out and the
prototype subsystems worked as designed.
Stable flight was realized with the prototype.
INTRODUCTION
The MIT human-powered hydrofoil boat
Decavitator set the world-record of speed in
1991 (Wall, 1995). It is desirable to create a
similar boat that is comparable with or even
outperform Decavitator at Cedarville University.
As the first step toward this end, the 2018-2019
Cedarville hydrofoil senior design team decided
to design and build a half-scale hydrofoil boat
prototype. The goal of the project was to realize
steady flight with the prototype.
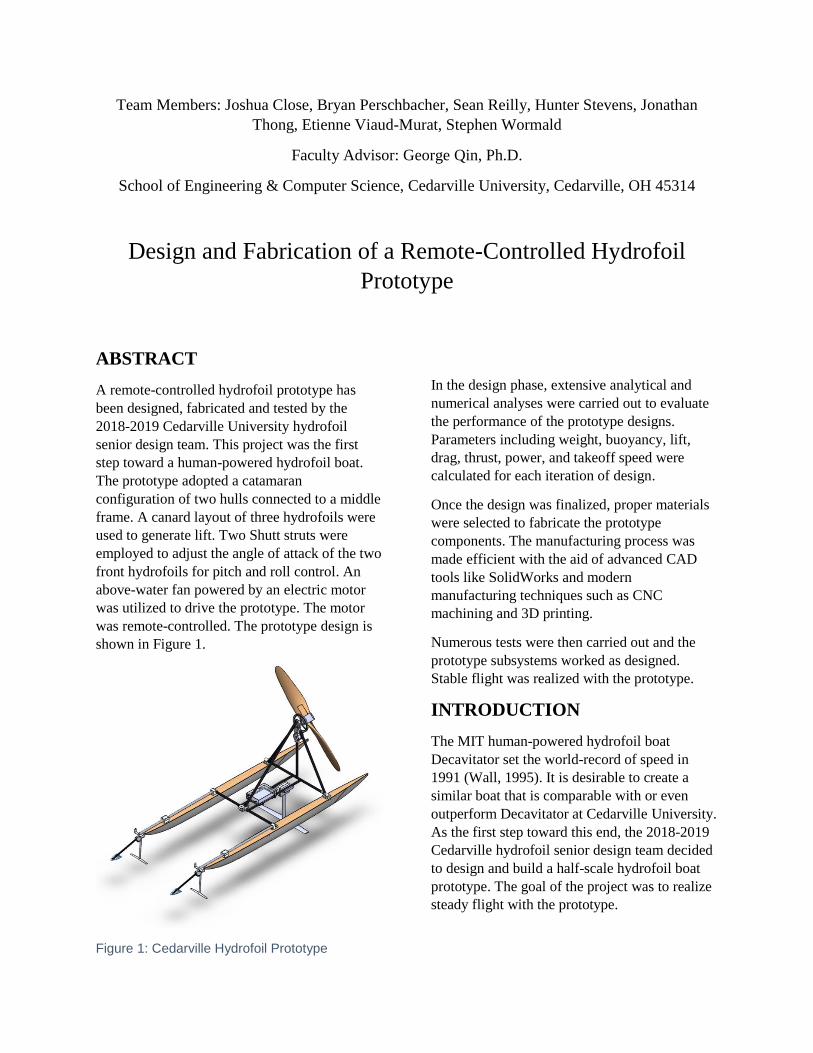
Before more details of the project are discussed,
it should be helpful to overview the relationship
of the various forces involved in the operation of
the hydrofoil prototype.
Figure 2: Lift vs. Velocity
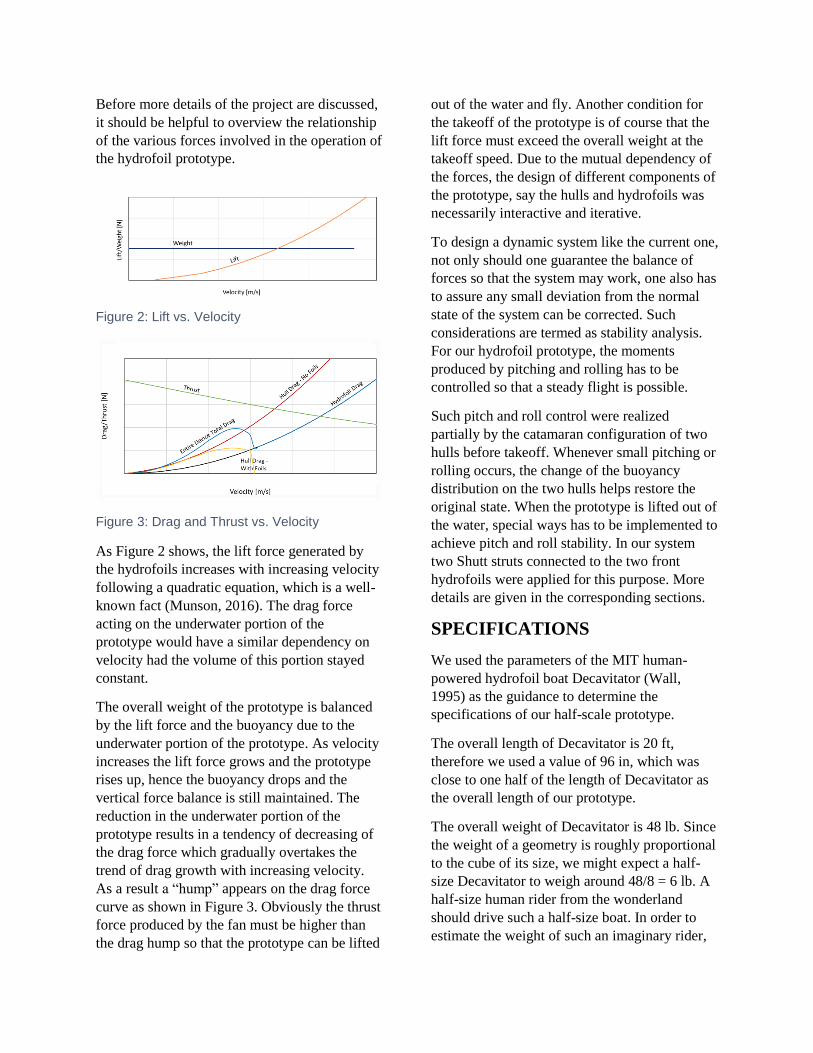
Figure 3: Drag and Thrust vs. Velocity
As Figure 2 shows, the lift force generated by
the hydrofoils increases with increasing velocity
following a quadratic equation, which is a well-
known fact (Munson, 2016). The drag force
acting on the underwater portion of the
prototype would have a similar dependency on
velocity had the volume of this portion stayed
constant.
The overall weight of the prototype is balanced
by the lift force and the buoyancy due to the
underwater portion of the prototype. As velocity
increases the lift force grows and the prototype
rises up, hence the buoyancy drops and the
vertical force balance is still maintained. The
reduction in the underwater portion of the
prototype results in a tendency of decreasing of
the drag force which gradually overtakes the
trend of drag growth with increasing velocity.
As a result a “hump” appears on the drag force
curve as shown in Figure 3. Obviously the thrust
force produced by the fan must be higher than
the drag hump so that the prototype can be lifted
out of the water and fly. Another condition for
the takeoff of the prototype is of course that the
lift force must exceed the overall weight at the
takeoff speed. Due to the mutual dependency of
the forces, the design of different components of
the prototype, say the hulls and hydrofoils was
necessarily interactive and iterative.
To design a dynamic system like the current one,
not only should one guarantee the balance of
forces so that the system may work, one also has
to assure any small deviation from the normal
state of the system can be corrected. Such
considerations are termed as stability analysis.
For our hydrofoil prototype, the moments
produced by pitching and rolling has to be
controlled so that a steady flight is possible.
Such pitch and roll control were realized
partially by the catamaran configuration of two
hulls before takeoff. Whenever small pitching or
rolling occurs, the change of the buoyancy
distribution on the two hulls helps restore the
original state. When the prototype is lifted out of
the water, special ways has to be implemented to
achieve pitch and roll stability. In our system
two Shutt struts connected to the two front
hydrofoils were applied for this purpose. More
details are given in the corresponding sections.
SPECIFICATIONS
We used the parameters of the MIT human-
powered hydrofoil boat Decavitator (Wall,
1995) as the guidance to determine the
specifications of our half-scale prototype.
The overall length of Decavitator is 20 ft,
therefore we used a value of 96 in, which was
close to one half of the length of Decavitator as
the overall length of our prototype.
The overall weight of Decavitator is 48 lb. Since
the weight of a geometry is roughly proportional
to the cube of its size, we might expect a half-
size Decavitator to weigh around 48/8 = 6 lb. A
half-size human rider from the wonderland
should drive such a half-size boat. In order to
estimate the weight of such an imaginary rider,

who was assumed to be an athlete, we collected
the weight and height data of about 200 Olympic
game players, as summarized in Figure 4 and
Figure 5.
Figure 4: Weight and Height Data of Olympic Cyclists
Figure 5: Weight and Height Data of Olympic Runners
We then concluded from the curve fitting of
these data that the weight of this imaginary half-
size (about 3 ft tall) athlete would be about 42
lb. Therefore the overall weight of our hydrofoil
prototype should be close to 42 + 6 = 48 lb so
that it could simulate the half-size boat and the
wonderland rider on board. To be prudent, we
required that our prototype should weigh 50 lb.
The peak cruise speed of Decavitator is about 9.5
m/s, we used 60% of it, that is 5.7 m/s as the target
takeoff speed of our full-size hydrofoil boat. To
specify the takeoff speed of the half-scale
prototype, we used Froude number similarity
between the full-size boat and the prototype,
which requires the Froude numbers to be the
same for each of them at similar operational states.
For most cases involving fluid flow, Reynolds
number similarity is the best choice (Munson,
2016). For surface vessels like catamaran hulls,
Froude number similarity is a better choice
because the Froude number captures the effects
of wave drag (Munson, 2016). The Froude
number 𝐹𝑟 is defined based on the hull depth 𝑙,
the gravitational acceleration 𝑔 , and the boat
speed 𝑉 (Munson, 2016):
𝐹𝑟 =𝑉
√𝑔𝑙 (1)
The Froude number similarity thus implies 𝑉 ∝
√𝑙. Therefore the takeoff speed of the half-scale
prototype should be about 5.7 𝑚/𝑠
√2= 4 𝑚/𝑠.
Another specification needed to be determined
was the fan power at the drag hump. For the full-
size human-powered hydrofoil device, the power
source is the human power. A professional athlete
can output a peak power between 1200 W and
1500 W (Ikonen, 2011). The fan power is equal
to
𝑃 =𝑇 ⋅ 𝑉
𝜂≈
𝐷 ⋅ 𝑉
𝜂=
𝐶𝑑 ⋅12
𝜌𝑉2𝐴 ⋅ 𝑉
𝜂 (2)
where 𝑇 is the thrust force; 𝐷, 𝐶𝑑 and 𝐴 are the
drag force, the drag coefficient, and the wetted
area of the prototype, respectively; 𝜌 is the water
density and 𝜂 is the fan efficiency. Since 𝐴 ∝ 𝑙2,
𝑉 ∝ √𝑙 , we may conclude that 𝑃 ∝ 𝑙7
2 if we
ignore the variation of 𝜂 with the fan size. Hence
the power budget for the half-scale prototype
should be about 0.5(1200+1500) 𝑊
23.5 = 120 𝑊 . It
was also clear that the maximum drag force the
hull experiences close to takeoff should not
exceed 120 𝑊
4 𝑚
𝑠
= 30 𝑁.
HULL DESIGN
To design the hull shape, we had to find the drag
force on the hull. Once we knew the drag force,
we could modify the hull shape until the required
drag force specification was met.
In order to calculate the drag force on the hull, we
had to first know the water surface location
(water level) at different boat speeds. This
information was obtained by applying the vertical
force balance, that is lift 𝐿 plus buoyancy 𝐵

equals weight 𝑊. As lift equals weight at takeoff,
one may easily find that
𝐿
𝑊=
𝐶𝑙 ⋅12
𝜌𝑉2𝐴
𝐶𝑙 ⋅12
𝜌𝑉𝑡𝑎𝑘𝑒𝑜𝑓𝑓2 𝐴
= (𝑉
𝑉𝑡𝑎𝑘𝑒𝑜𝑓𝑓
)
2
(3)
So the buoyance force is
𝐵 = 𝑊 [1 − (𝑉
𝑉𝑡𝑎𝑘𝑒𝑜𝑓𝑓
)
2
] (4)
which equals the weight of water displaced by the
underwater portion of the hull:
𝑊 [1 − (𝑉
𝑉𝑡𝑎𝑘𝑒𝑜𝑓𝑓
)
2
] = 𝜌𝑉𝑢𝑛𝑑𝑒𝑟𝑤𝑎𝑡𝑒𝑟 (5)
It was then straightforward to find the volume of
the underwater portion of the hull and in turn the
water level at any given velocity.
We calculated the drag force with three methods.
The first method was using the computational
fluid dynamics (CFD) software FLUENT to
simulate the flow over the prototype. The second
method was using the CFD package of
SolidWorks called Flow Simulation to do the
flow field calculation. FLUENT is generally
believed to be more accurate than SolidWorks
Flow Simulation as FLUENT simulates both the
water flow and the air flow above the water yet
SolidWorks Flow Simulation can only handle a
single phase flow, say the water flow. However a
FLUENT simulation takes much longer time to
run than a SolidWorks simulation. Therefore we
used SolidWorks to quickly iterate hull shapes
and using FLUENT only for the final hull design
to give accurate force predictions. The last
method to predict the drag force was an analytical
method which is described with the following
example.
Figure 6 shows one of the hull designs. In order
to model the drag on the hull analytically,
several assumptions were made. Firstly we
treated the sides of the hull as flat plates of the
same length as the hull. This assumption is
justified because the length of the hull is much
large than its width. The bottom of the boat was
modeled as a flat plate with 75% of the length of
the hull to take into account the curvature of the
bow.
Figure 6: A Hull Design (Top: Top View, Bottom: Side View)
Using this model, we found the friction drag on
the hull with the friction drag coefficient
formulas for flow over flat plate surface which
can be found in any standard fluid mechanics
textbook like (Munson, 2016).
We also found the form drag on the hull. To do
this, we assumed that the form drag coefficient
of the hull would be the average of the drag
coefficients of the airfoil and the ellipse at the
same Reynolds number because the hull shape
was more streamlined than the ellipse but less
than the airfoil. The form drag coefficient of
different geometries again can be found from
(Munson, 2016).
These two components of drag were then added
together to produce our analytical drag prediction
for the hull.
The analytical predictions were compared to the
numerical data from SolidWorks simulation
results in Table 1. The percent difference between
the predictions of these two methods was less
than 5% over the velocity range between 1 m/s
and 7 m/s.
Table 1: Comparison between SolidWorks Simulation and Analytical Prediction of Drag
Speed
(m/s)
Drag (N)
Predicted
by
SolidWorks
Simulation
Drag (N)
Predicted
by
Analytical
Model
Percent
Difference
1 2.8 2.9 4.6

2.5 15.7 15.9 1.1
3 22.0 22.4 1.8
4 36.9 38.4 4.1
5 59.0 58.5 0.9
6 80.3 82.5 2.7
7 107.5 110.4 2.7
With the help of the SolidWorks Flow
Simulation and the analytical model, we were
able to iterate numerous hull shapes as shown in
Figure 7.
Figure 7: Iterations of Hull Shape Designs
FLUENT was then used to investigate the final
hull design. For this purpose, a mesh system was
created for the CFD simulation. A relatively
coarse mesh was used except close to the
prototype, where a very fine mesh was applied.
In this way the simulation could be made both
time efficient and accurate. The mesh system is
shown in Figure 8 and Figure 9.
Figure 8: The Coarse Mesh
Figure 9: The Fine Mesh
The results are shown in Figure 10. As one
may observe, the FLUENT results agree
relatively well with the theoretical predictions of
the drag and lift forces. And the final design of
the hull shape satisfied all the specifications we
set: the takeoff speed was 3.9 m/s < 4 m/s and
the drag hump was at 22 N < 30 N.
Figure 10: FLUENT Simulation Results
HYDROFOIL DESIGN
We decided to use a canard hydrofoil
configuration consisting of three hydrofoils to
support the boat. One main hydrofoil sat slightly
behind the center of gravity of the entire boat and
two smaller hydrofoils sat at the very front of
each hull. The main rear hydrofoil was designed
to do most of the lifting work, ranging anywhere
from eighty to ninety percent of the load. The two
front hydrofoils bore the remaining load while

acting as pitch and roll control devices when
attached to the surface finding mechanisms.
We used the hydrofoil theory equations to
evaluate the lift and drag of various hydrofoil
profiles. These equations like Equations (2) and
(3) could be found from (Vellinga, 2009). Using
these equations, we were able to give
approximate values of lift and drag based on
hydrofoil characteristics such as chord length,
span, taper ratio, aspect ratio, and angle of attack
as well as fluid characteristics such as density,
viscosity and flow velocity.
The NACA 4412 profile was chosen for all our
hydrofoils because it gave a balance between
high lift to drag ratio and manufacturability.
Taper was adopted to reduce the induced drag due
to wing tip vortices.
The final design of the hydrofoils is summarized
in Table 2.
Table 2: Hydrofoil Dimensions and Performance Data
Parameter Front
hydrofoil
Rear
hydrofoil
Airfoil Section NACA
4412
NACA
4412
Average Chord
Length 2.85 cm 7.0 cm
Span 26.0 cm 66.5 cm
Aspect Ratio 9.1 9.5
Taper Ratio 0.63 0.71
Lift Coefficient 0.462 0.636
L/D Ratio
during Cruise 13.3 13.0
Angle of
Attack during
Cruise
6.7° 6°
The final hydrofoil design would be able to
support the estimated 50lb prototype in flight,
which was verified by the SolidWorks CFD
simulation. The simulated flow field around the
rear hydrofoil is shown in Figure 11.
Figure 11: SolidWorks Simulated Flow Field
The drag and lift forces of the rear hydrofoil at
the takeoff speed predicted by SolidWorks are
shown in Figure 12, which agree well with the
hydrofoil theory and FLUENT simulation
results.
Figure 12: Drag (Top) and Lift (Bottom) of the Rear Hydrofoil at Takeoff Velocity
For the hydrofoil strut design we decided to
choose a symmetrical hydrofoil cross-section
shape in order to reduce the strut drag. To
calculate the stress experienced by the struts, we
modeled the strut cross-sections as rectangular
beams as shown in Figure 13 and used the Euler
criteria for buckling to estimate the approximate
strut thickness needed given the expected weight

and length of the struts (Vellinga, 2009). Based
on the analysis we decided on the NACA 0020
section profile which minimized the strut drag
and maximized the ability of the strut to
withstand stresses.
Figure 13: Strut Model
SURFACE FINDING
MECHANISM DESIGN
As mentioned in the introduction section,
stability of our boat prototype was a big concern.
The largest stability problems came from
controlling the moments created by pitching and
rolling of the boat.
To control pitch, usually devices with some
form of a height adjuster that manipulates the
amount of lift of the hydrofoils were used. The
most common solution to height adjustment
involves using a fixed angle joint between the
hydrofoil strut and an arm connected to a water
surface following body. At the chosen cruising
height, the variable-angle hydrofoils are at their
designed angle of attack. If the boat goes above
or below the desired height, the surface finder
mechanically adjusts the angle of attack of the
hydrofoils and their resultant lift to bring the
boat back to the target height.
In order to determine the arm length and the
angle between the arm and strut, we used a two-
dimensional geometric analysis including the
desired flying height, the strut length, and the
range of angle of attacks needed to get anywhere
from no lift to maximum lift. We designed a
system as shown in Figure 14 to control the
pitch and height of the prototype by controlling
the angle of attack of the front hydrofoils. The
system is essentially a Shutt strut (Vellinga,
2009).
Figure 14: Surface Finding Mechanism Design
At the lowest height of the hull when the boat is
motionless, the surface finder gives the front
hydrofoil an angle of attack of 13.5°. This is less
than the stall angle of the hydrofoil, which is
approximately 16°. When flying at the cruise
height, the surface finder gives the front
hydrofoil an angle of attack of approximately 7°.
This value provides enough lift to keep the hulls
out of the water.
This mechanism is also used for roll control
when the prototype is lifted out of the water. As
one side of the boat rises higher than the other
side, the surface finder on the rising side will
reduce the angle of attack and the lift of the
hydrofoil on that side which lowers that side.
Similarly the surface finding mechanism will
raise the lower side. These actions help restore
the original state of the boat. However, in order
to make sure that this mechanism alone is
enough to control rolling, the distance between
the two front hydrofoils must be properly
calculated with a roll stability analysis.
Figure 15 sketches the front view of the boat
prototype and the roll control mechanism.

Figure 15: Sketch of Roll Control
As the boat rolls for a small angle 𝜃 from the
desired upright state, the surface finders
immediately cause the lift forces of the two front
hydrofoils to change. The lower side front
hydrofoil then has a greater lift 𝐿1 than the
higher side front hydrofoil, which has a smaller
lift 𝐿2. If we focus on the lower side front
hydrofoil, we may find that this lift adjustment is
realized by the surface finder increasing the
angle of attack of the hydrofoil from its original
value 𝛼 to 𝛼 + 𝛿 as shown in Figure 15. 𝛿 is the
rotation angle of the surface finder arm in this
process. At the same time the angle of attack of
the rising side hydrofoil changes from 𝛼 to 𝛼 −
𝛿. To be roll stable, the restoring moment has to
exceed the rolling moment:
(𝐿1 − 𝐿2)𝑠 ≥ 𝑊𝐻 ⋅ sin 𝜃 ≈ 𝑊𝐻 ⋅ 𝜃 (6)
in which 𝑠 is the half distance between the two
front hydrofoils and 𝐻 is the distance between
the center of gravity and the rear hydrofoil.
From geometric consideration, one may find that
the displacement of each surface finder in this
process is
𝑙 ⋅ cos 𝛽 ⋅ 𝛿 ≈ 𝑠 ⋅ sin 𝜃 ≈ 𝑠 ⋅ 𝜃 (7)
where 𝑙 is the surface finder arm length and 𝛽 is
the angle between the surface finder arm and the
water surface.
Therefore
𝛿 ≈𝑠
𝑙 ⋅ cos 𝛽⋅ 𝜃 (8)
Since
{𝐿1 = 𝐶𝑙1 ⋅
1
2𝜌𝑉2𝐴 ≈ 𝜋(𝛼 + 𝛿) ⋅ 𝜌𝑉2𝐴
𝐿2 = 𝐶𝑙2 ⋅1
2𝜌𝑉2𝐴 ≈ 𝜋(𝛼 − 𝛿) ⋅ 𝜌𝑉2𝐴
(9)
as the lift coefficient of a thin hydrofoil is 𝐶𝑙 ≈
2𝜋𝛼 (Katz & Plotkin, 2001), the roll stability
condition becomes
(𝐿1 − 𝐿2)𝑠 ≈ 2𝜋𝛿𝜌𝑉2𝐴𝑠
≈ 2𝜋𝑠
𝑙 ⋅ cos 𝛽⋅ 𝜃 ⋅ 𝜌𝑉2𝐴𝑠 ≥ 𝑊𝐻 ⋅ 𝜃
(10)
which infers a condition for the half-distance
between the two front hydrofoils 𝑠:
𝑠 ≥ √𝑊𝐻𝑙 cos 𝛽
2𝜋𝜌𝑉2𝐴 (11)
One may easily find that the parameters like 𝛽
and 𝑉 at takeoff give the most conservative
criterion for 𝑠. For example, if 𝑊 = 50 𝑙𝑏 =
223 𝑁, 𝐻 = 0.7 𝑚, 𝑙 = 0.7 𝑚, 𝑉 = 4 𝑚/𝑠, 𝛽 =
10° and 𝐴 = 0.007 𝑚2, the roll stability is only
possible as 𝑠 ≥ 0.39 𝑚. That is the distance
between the two front hydrofoils must be greater
than 0.78 m to ensure roll stability.
FAN DESIGN
When designing the propulsion system for our
boat, we first had to choose which propulsion
method we would use. Our research showed that
most vessels equipped with hydrofoils had used
underwater propellers to drive their designs
(Vellinga, 2009). Yet MIT Decavitator used an
above-water fan to set the world-record for
speed. For this reason, we decided to take a
closer look at the three different options: a
propeller, a dual fan and a single fan. The
propeller had the advantage of being easily
bought or manufactured on campus while being
lightweight. We didn’t pursue this option as we
deemed having to attach both the main hydrofoil
and the propeller system to the back strut would
be too complicated for our manufacturing skills.
A dual, counter rotating fan can provide rotating
moment balance to the boat when in flight but
once again, such a solution was too complex to
manufacture on campus. Finally, we decided to
take the simplest solution of a single fan.

Once the decision was made, we started looking
at the fan dimension we would go for.
According to the actuator disk theory of fan
(Johnson, 2013), the power of a fan is
𝑃 =1
2𝑇 ⋅ 𝑉 [√
𝑇
12
𝜌𝑉2𝐴𝑑𝑖𝑠𝑘
+ 1 + 1] (12)
And its efficiency therefore is
𝜂 =2
√𝑇
12
𝜌𝑉2𝐴𝑑𝑖𝑠𝑘
+ 1 + 1
(13)
where 𝑇 is the thrust force; 𝑉 is the boat speed;
𝜌 is the air density and 𝐴𝑑𝑖𝑠𝑘 is the area of the
fan “disk” as what one sees as the fan rotates.
From this equation it is obvious that the larger
the fan is, the more efficient it will be. Yet
considerations such as overall weight,
complexity of manufacturing, and negative
effects of a high center of gravity on stability
prevent us from pursuing a too large fan.
Knowing the MIT Decavitator used a 3 m
diameter fan, we decided to design a fan with a
diameter of 1.25 m for our hydrofoil prototype.
According to the CFD results (see Figure 10) we
knew we had to overcome about 22N of drag at
takeoff. For this reason we decided to design a
1.25 m diameter fan that would output 30N of
thrust at the boat speed of 4 m/s. With these
specifications, one may find from Equation (12)
the efficiency of such a fan would be close to
70%. Although very helpful to our design this
result is only a good estimate as the actuator disk
theory does not consider the effects of fan blade
cross-section profile and flow rotation
downstream the fan. For this reason we used
OpenProp to design our fan as this software
takes into consideration all the aforementioned
effects.
We used the simple NACA 0010 profile as fan
blade cross-section shape due to its easiness of
manufacturing. The fan design OpenProp
created is shown in Figure 16.
Figure 16: Fan Design
The fan efficiency curve is shown in Figure 17.
The peak efficiency is 76% at the rotation speed
600 RPM, which was set as the target fan
rotation speed.
The only problem of this design was that the
power consumption of the fan was about
30 𝑁⋅4𝑚
𝑠
76%= 158 𝑊, which was higher than the
power budget of 120 W due to the relatively low
fan efficiency and the large margin in thrust
force we required the fan to produce. This
should not be a problem in the future as a fan is
designed for the full-size boat as the fan
efficiency increases with the fan size.
Figure 17: Fan Efficiency vs. Rotation Speed
A U8 Lite KV190 motor was used to drive the
fan. The motor speed was remotely controlled
by a FLYSKY remote control system. This
motor produces 30 N of thrust at about 2000
RPM. We therefore needed a pulley system that
would decrease our motor speed from 2000
RPM to 600 RPM for the fan.
To design such a system, the main variables
were belt length, motor pulley diameter, fan
pulley diameter, and distance between the
pulleys. A TK Solver program was created to
implement the geometric relationship between
these variables. Our design sought to minimize
the weight of the system by decreasing the
component sizes. As the motor pulley could
have a minimum diameter of about 2 in due to
the fixture holes, a belt length of 29 in was
selected as this minimized the distance between
the pulleys while still allowing for a pulley ratio
of 2000:600. The fan mount was designed as in
Figure 18.
Figure 18: Fan Mount Design
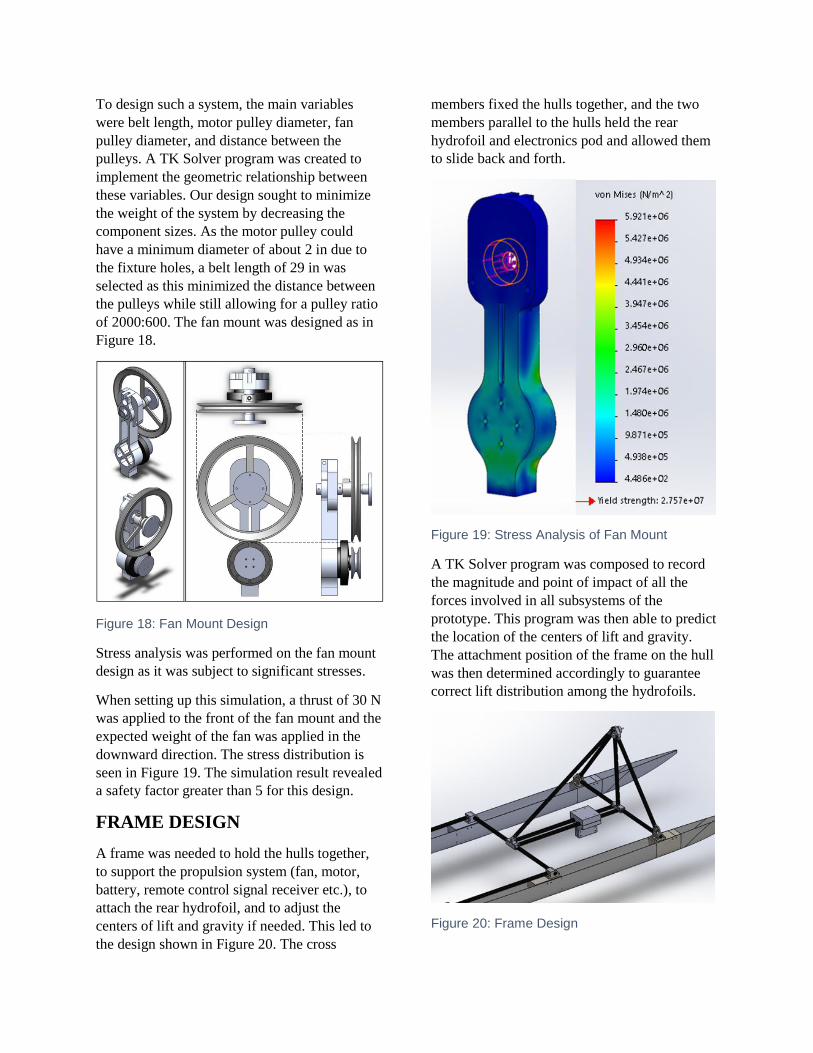
Stress analysis was performed on the fan mount
design as it was subject to significant stresses.
When setting up this simulation, a thrust of 30 N
was applied to the front of the fan mount and the
expected weight of the fan was applied in the
downward direction. The stress distribution is
seen in Figure 19. The simulation result revealed
a safety factor greater than 5 for this design.
FRAME DESIGN
A frame was needed to hold the hulls together,
to support the propulsion system (fan, motor,
battery, remote control signal receiver etc.), to
attach the rear hydrofoil, and to adjust the
centers of lift and gravity if needed. This led to
the design shown in Figure 20. The cross
members fixed the hulls together, and the two
members parallel to the hulls held the rear
hydrofoil and electronics pod and allowed them
to slide back and forth.
Figure 19: Stress Analysis of Fan Mount
A TK Solver program was composed to record
the magnitude and point of impact of all the
forces involved in all subsystems of the
prototype. This program was then able to predict
the location of the centers of lift and gravity.
The attachment position of the frame on the hull
was then determined accordingly to guarantee
correct lift distribution among the hydrofoils.
Figure 20: Frame Design

A connector that held the rear hydrofoil strut
to the frame was also designed, see Figure
20. For simplicity of manufacturing, we decided
to 3D print this part with ABS plastic.
When the boat is flying, the rear hydrofoil
creates most of the lift. Therefore, the rear
strut and connector hold most of the weight
of the boat. A stress analysis was performed
on this connector to ensure that it could
withstand the stress. The load we gave on
the rear strut in the analysis was 90% of the
weight of the boat. A friction force 1.2 times
the maximum expected value was applied to
the connector’s face. The results of this
analysis are shown in Figure 21.
Figure 21: Stress Analysis of Rear Strut Connector
The maximum stress in the connector is only
about 0.7 MPa, which is much less than the
tensile strength of the ABS plastic which is
about 20 MPa.
HULL FABRICATION
We began to manufacture the hull based on the
design we had completed. We investigated
several materials including fiberglass, balsa
wood, and foam for our hull fabrication. The
main manufacturing objectives were to minimize
the weight and cost of the hulls and maximize
the strength and surface finish quality. Each
material has pros and cons.
Balsa wood is very light and is moderately
expensive in standard sizes. However, for our
eight-foot boat hulls, the wood would have to be
custom made by laminating many smaller pieces
of wood together. This would both make the
wood much more expensive and increase the
chances that the hull would fail by adding more
joints. Foam is extremely light and inexpensive.
However, it does not have the same strength as
wood or fiberglass. It is much more likely to
crack and break, unless it is reinforced with a
coating of another material. Fiberglass was the
material we chose for manufacturing. It is more
expensive than foam, but comparable to balsa
wood. It is slightly heavier than either of the
other options, but it is much stronger than foam
and has less laminations compared to balsa
wood. This made fiberglass the best choice for
our hulls.
Once we selected fiberglass, we had to choose a
manufacturing method. We chose to create a
female mold for our hull directly with the CNC
router. We made two mold halves and clamped
them together to create one mold. To cut the
mold we laminated MDF boards into a feedstock
larger than our hull size and used the router to
cut the shape of the mold into the feedstock.
Once the material had been cut, we sanded and
smoothed the surface with an epoxy fairing
putty. The fiberglass was then laid up into the
mold and polyester resin was transferred to it by
hand. Before the resin completely set, we rolled
the fiberglass to eliminate air bubbles and
surface imperfections.
The hulls are extremely long compared to the
cross-sectional area, and this made them
susceptible to deformation, especially in the
transverse and torsional directions. To reduce
such deflections and create a stronger hull, we
added to it a 0.25 in thick foam core and an
inner layer of fiberglass. A diagram of the
completed cross section is shown in Figure 22.
The outer and inner layers of fiberglass were
connected at the top of the hull above the foam
core. A sheet of 0.25 in thick plywood was glued

down to the top of the hull. This plywood sealed
the hull, making it waterproof, and provided a
surface for us to attach the hull to the frame. At
the stern of the hull, a small hole was made, and
a flexible tube and cork assembly was inserted
into the hole in order to drain the hulls in case
they did leak water.
Figure 22: Diagram of Hull Cross Section
The completed hulls are shown in Figure 23.
HYDROFOIL FABRICATION
We researched aluminum, wood, and carbon
fiber for hydrofoil fabrication. After considering
factors such as cost, manufacturability, and
strength to weight ratio we decided to produce
the struts and hydrofoils out of aluminum using
the CNC router at Cedarville as it was relatively
easy and cost efficient. Making the hydrofoils
and struts out of aluminum also gave us the
ability to weld them together which avoided the
need to design a more complicated attachment
required for wood or carbon fiber hydrofoils and
struts.
To manufacture the hydrofoils and struts we
used aluminum stock at least 2 in longer and 1 in
thicker than the strut or hydrofoil being
manufactured. We would run a flat end mill with
Figure 23: Hulls
adaptive clearing to remove most of the
material. And then a ball mill was used to give a
nice finish to the strut. In order to machine the
hydrofoils and struts properly we run the CNC
on the top side of the stock and then flip it over
and rerun the CNC on its bottom side.
The completed hydrofoils and struts are shown
in Figure 24.
Figure 24: Hydrofoils and Struts
SURFACE FINDER
FABRICATION

We used carbon fiber tubes to build surface
finder arms as they are extremely strong yet very
light.
Figure 25: Shutt Strut Joint
We had to design a joint that could connect the
arm and strut rigidly to each other while
allowing the entire assembly to pivot freely
about a point on the hull to let the surface finder
direct the movement of the hydrofoils. To keep
the design simple, we designed the joint to be
cut out of a metal sheet and bent it into a
bracket-type joint, as shown in Figure 25. This
design allowed us to use threaded fasteners to
clamp the strut and arm tightly to their position.
This design also allowed for a change in angle of
the arm if needed.
The surface finder itself was made of fiberglass.
The outer surface was created in the same way
as the hulls: a female mold was created from
MDF stock and was cut using the CNC router.
The fiberglass was laid up by hand in two layers.
The contour of the finder was then filled with
foam to eliminate the possibility of water
entering the finder (see Figure 14).
FAN FABRICATION
To build the entire propulsion system on
campus, we decided to create the fan out of
wood using the CNC router at Cedarville
University. We decided to use Birch plywood
because it is easily accessible and a previous
senior design team (2015-2016 EPL fan team)
had good results when creating their fan blades
out of the same wood.
Using the SolidWorks guide curves output
option of OpenProp, we quickly generated our
blades in SolidWorks. We then glued 5 layers of
0.75 in plywood together into a feedstock.
Afterwards the CNC was used to cut the
feedstock into the fan blade shape. The
procedure was very alike the one described in
the hydrofoil fabrication section. The completed
fan blade is shown in Figure 26.
Figure 26: Fan Blade (Left) and Assembly (Right)
We then used 3 mm sheet metal brackets to keep
two blades together. The final fan assembly can
be seen in Figure 26.
The fan mount (see Figure 27) was also
manufactured by the CNC router out of
aluminum.

Figure 27: Fan Mount
FRAME FABRICATION
We initially looked into using PVC or aluminum
tubes to form the frame in order to keep the cost
low. Upon advice from various professors, we
began to consider carbon fiber tubing, which has
a very high strength to weight ratio. This would
be more expensive but would allow us to bring
the weight of the hull down significantly and
have more strength than either PVC of
aluminum would give.
When beginning manufacturing, we cut carbon
fiber tubes to desired length, and then prepared
their ends. This meant either sanding a curve
into the end so that it could sit flush to another
tube or using epoxy to fasten connectors to
allow connection to the fan mount (see Figure
27). To connect the tubes to each other, we used
carbon fiber wrap and epoxy to harden it in
place. Difficulties with this method were that the
tape tended to unravel and had to be put into the
proper position very carefully. Once hardened,
this created a very strong joint, as shown in
Figure 28.
Figure 28: Carbon Fiber Tube Joint
ELECTRONICS POD
FABRICATION
The electronics pod served to hold both our
electronics (battery, remote control signal
receiver) and extra weight (to bring the boat up
to its target weight). It should be able to slide
along the frame to affect the center of gravity.
We went with a basic box design which was
easily produced with plywood. The design and
completed pod are shown in Figure 29.
Figure 29: Electronics Pod
PROTOTYPE TESTING
Once the prototype was built, numerous tests
were performed to confirm the subsystems as
well as the whole prototype working as
designed. Most of these tests were carried out in
Cedar Lake, which is conveniently located on
the campus of Cedarville University.
Firstly, the overall weight of the completed
prototype was only 35 lb. The original 50 lb
weight target was achieved by adding extra
weights into the electronics pod.

Simply observing the waterline on the hulls
when the prototype was placed in the lake water
revealed the design provided enough buoyancy
force to keep the device floating on the water.
The electronic system being controlled remotely
worked flawlessly. When testing our remote
control, we found it had a working range
exceeding the longest distance across the Cedar
Lake.
In order to test the drag acting on both the hulls
and the hydrofoils, the hydrofoil prototype was
pulled behind a boat with a fishing line. The
drag force along the fishing line lifted a weight
on a scale sit on the boat which was being
recorded on video. This drag test setup is shown
in Figure 30.
Figure 30: Drag Test Setup
The drag values were then taken by inspecting
the video frames at half-second intervals.
Velocity data of the boat were recorded using
the data acquisition unit available on-board the
boat.
Figure 31: Comparison between Test Data (Red Curve) and Predictions (Blue Curve and Symbols)
Surprising agreement between our test data,
CFD simulation results, and theory was
observed as shown in Figure 31.
Unfortunately, during testing the wake induced
by the boat influenced the flight of the prototype
which prevented us from obtaining valid data
after takeoff.
Finally we tested the complete fully-functioning
hydrofoil prototype in Cedar Lake and it
successfully achieved stable flight with the hulls
being lifted out of the water, as shown in Figure
32.
Figure 32: Steady Flight of the Hydrofoil Prototype
CONCLUSION
We achieved the initial goal of designing a half-
size remote-controlled hydrofoil prototype and
realized steady flight with the prototype. We are
confident that we will be able to build a full-size
human-powered hydrofoil boat in the coming
years. Based on the experience we gained, we
concluded that
The SolidWorks Flow Simulation and
the analytical drag model are accurate enough
for drag prediction and hull design
The roll stability analysis presented in
the current paper seems to be valid
A similar pitch stability analysis should
be developed to better direct the surface finding
mechanism design

Fan is a simple yet effective method of
propulsion. Its advantage will be more
appreciable when we design the full-size boat
A fan section profile with high lift to
drag ratio is preferred in the future full-size boat
design
Joshua Close was responsible for the hull
design. He received his bachelor’s degree in
Mechanical Engineering from Cedarville
University in 2019.
Bryan Perschbacher was responsible for the
CFD simulation. He received his bachelor’s
degree in Mechanical Engineering from
Cedarville University in 2019.
Sean Reilly was the team leader and was
responsible for the hydrofoil and surface finder
design. He received his bachelor’s degree in
Mechanical Engineering from Cedarville
University in 2019.
Hunter Stevens was responsible for the frame
and electronics pod design. He received his
bachelor’s degree in Mechanical Engineering
from Cedarville University in 2019.
Jonathan Thong was responsible for the
hydrofoil and strut design. He received his
bachelor’s degree in Mechanical Engineering at
Cedarville University in 2019.
Etienne Viaud-Murat was responsible for the
fan design. He received his bachelor’s degree in
Mechanical Engineering from Cedarville
University in 2019.
Stephen Wormald was responsible for the
testing. He received his bachelor’s degree in
Mechanical Engineering from Cedarville
University in 2019.
George Qin, Ph.D. was the faculty advisor of
the team. He received his Ph.D. in Mechanical
Engineering from Iowa State University in 2007.
REFERENCES Ikonen, M. (2011). About the Possibilities to
Power Vehicles with Human Muscles.
Terrassa, Spain.
Johnson, W. (2013). Rotorcraft Aeromechanics.
Cambridge.
Katz, J., & Plotkin, A. (2001). Low-Speed
Aerodynamics. Cambridge.
Munson. (2016). Fundamentals of Fluid
Mechanics. Wiley.
Vellinga, R. (2009). Hydrofoils: Design, Build,
Fly . Peacock Hill Publishing.
Wall, M. (1995). Decavitator - Human-Powered
Hydrofoil. Retrieved from
http://lancet.mit.edu/decavitator/