Embed Size (px)
Citation preview

Design and Implementation of a Campus
Navigation Application with Augmented
Reality for Smartphones
Benjamin Lautenschläger
Bachelor Thesis
Studiengang Informatik
Fakultät für Informatik
Hochschule Mannheim
13.07.2012
Matrikelnummer: 823577
Betreuer: Prof. Dr. Miriam Föller-Nord
Zweitkorrektor: Prof. Dr. Astrid Schmücker-Schend
Durchgeführt bei: Prof. Dr. Frank Maurer
Agile Software Engineering Group
University of Calgary
Department of Computer Science
2500 University Dr NW
Calgary, Alberta
Canada

i
Abstract
Mobile phones are nowadays far more than merely devices to communicate with. Especially,
smartphones are products that help to make our work and everyday life easier. Along with the
advance in technology and popularity of these devices, the use of mobile applications increased
enormously in the last years. Based on new techniques like GPS and sensors, like compass and
accelerometer, that can determine the orientation of the device, location-based applications coupled
with augmented reality views are possible.
In the context of this work a mobile navigation application for the University of Calgary is developed.
This thesis describes the initial thoughts on this application and the process that led to the final system
environment. The approach on designing a graphical user interface for pedestrian use on mobile
devices is described, as well as the actual implementation of it. To provide users with location based
information a location tracking algorithm based on wireless network signals is created, which
determines the geographical position inside buildings.
The resulting application enables the user finding paths to specific locations on campus and offers him
the ability to explore the campus environment via augmented reality.

ii
Statutory Declaration (German)
Ich versichere, dass ich die vorliegende Arbeit selbständig und ohne Benutzung anderer als der
angegebenen Hilfsmittel angefertigt habe. Alle Stellen, die wörtlich oder sinngemäß aus
veröffentlichten und nicht veröffentlichten Schriften entnommen wurden, sind als solche kenntlich
gemacht. Die Arbeit hat in dieser oder ähnlicher Form keiner anderen Prüfungsbehörde vorgelegen.
Calgary, 10.07.2012 ____________________________________
Benjamin Lautenschläger

iii
Acknowledgements
I would like to take this opportunity to thank everyone that helped and supported me throughout my
studies and especially this thesis.
I want to thank my supervisors Prof. Dr. Frank Maurer and Prof Dr. Ehud Sharlin for their guidance
and their always helpful advices.
Many thanks to my German supervisor Prof. Dr. Miriam Föller-Nord for the feedback and for helping
me with the organizational parts of this thesis. I would also like to thank Prof. Dr. Schmücker-Schend
for offering me this opportunity and introducing me to Prof. Dr. Frank Maurer.
To all the members of the ASE group, thank you for the really nice and interesting time at the
University of Calgary.
To Jennifer Ferreira, thank you for proof-reading this thesis.
I would like to thank all my friends from the University of Applied Sciences Mannheim, especially
Dominik, Roy, Harald and Nico. Thank you for the help and support before exams and also for the
fun times we had during our entire studies.
Finally, to my girlfriend Nadine, thank you for all the support you gave me over the past years and for
encouraging me to take the opportunity writing this thesis in Calgary. Thank you for always being
there for me.

iv
Table of Contents
Abstract ....................................................................................................................................... i
Statutory Declaration (German) ................................................................................................. ii
Acknowledgements .................................................................................................................. iii
Table of Contents ...................................................................................................................... iv
List of Figures ........................................................................................................................... vi
List of Tables ......................................................................................................................... viii
List of Abbreviations ................................................................................................................ ix
1 Introduction ...................................................................................................................... 1
1.1 Motivation ............................................................................................................................... 1
1.2 Goal ......................................................................................................................................... 1
1.3 Structure of Thesis .................................................................................................................. 2
2 Background ....................................................................................................................... 4
2.1 Geographic Information System ............................................................................................. 4
2.1.1 Describing Geographical Data ........................................................................................ 4
2.1.2 Esri ArcGIS ..................................................................................................................... 6
2.2 Location Tracking of Mobile Devices .................................................................................... 6
2.2.1 GPS-based Positioning .................................................................................................... 6
2.2.2 Wi-Fi-based Positioning ................................................................................................. 7
2.3 Augmented Reality ................................................................................................................. 9
2.4 Related Work ........................................................................................................................ 10
2.4.1 Oregon University App ................................................................................................. 10
2.4.2 Project Glass ................................................................................................................. 11
2.4.3 Google Maps Indoor ..................................................................................................... 12
3 Interaction Design........................................................................................................... 13
3.1 Navigation ............................................................................................................................. 13
3.1.1 Basic Adjustments for Pedestrian Navigation ............................................................... 13
3.1.2 Navigation Views .......................................................................................................... 14
3.2 Explore .................................................................................................................................. 19
3.2.1 Information Types in Augmented Reality View ........................................................... 19
3.2.2 Displaying Information ................................................................................................. 21

v
4 Software Design and Concept ........................................................................................ 23
4.1 Indoor Location Tracking ..................................................................................................... 23
4.1.1 Collecting Wi-Fi Information ....................................................................................... 24
4.1.2 Free Space Path Loss .................................................................................................... 25
4.1.3 Trilateration ................................................................................................................... 27
4.1.4 Evaluation of the Results .............................................................................................. 27
4.2 Data Sources ......................................................................................................................... 29
4.2.1 University of Calgary LDAP directory ......................................................................... 29
4.2.2 Esri ArcGIS Server ....................................................................................................... 31
4.2.3 Airuba AirWave Wireless Management Suite .............................................................. 34
4.2.4 Roomfinder Database .................................................................................................... 36
4.3 Technical Decisions .............................................................................................................. 37
4.3.1 Operating System .......................................................................................................... 37
4.3.2 ArcGIS Interface ........................................................................................................... 38
4.4 System Architecture .............................................................................................................. 40
5 Implementation ............................................................................................................... 42
5.1 Server Side Implementation .................................................................................................. 42
5.1.1 Data Sources ................................................................................................................. 42
5.1.2 Data Processing ............................................................................................................. 47
5.1.3 Web Services ................................................................................................................ 49
5.2 Client Side Implementation .................................................................................................. 51
5.2.1 Location Handling......................................................................................................... 51
5.2.2 ArcGIS Integration ........................................................................................................ 53
5.2.3 AR Integration............................................................................................................... 54
5.2.4 Multithreading ............................................................................................................... 56
5.2.5 Graphical User Interface ............................................................................................... 58
6 Conclusion ....................................................................................................................... 66
6.1 Summary and Evaluation ...................................................................................................... 66
6.2 Problems ............................................................................................................................... 67
6.3 Limitations ............................................................................................................................ 69
6.4 Future Work .......................................................................................................................... 70
References .................................................................................................................................. x
Example of a REST Map Server Query ................................................................................. xiii
Example CSV Data for Wi-Fi Access Points .......................................................................... xv

vi
List of Figures
Figure 2-1 - GIS - Latitude and Longitude [1] ........................................................................................ 4
Figure 2-2 - GIS - Projection Surfaces [1] .............................................................................................. 5
Figure 2-3 - GIS - Projection Problems [1] ............................................................................................. 5
Figure 2-4 - GPS - Intersecting Spheres [3] ............................................................................................ 7
Figure 2-5 - Augmented Reality View on a Smartphone [4] .................................................................. 9
Figure 2-6 - Screenshots of Oregon University App [5] ....................................................................... 10
Figure 2-7 - HUD of Project Glass [6] .................................................................................................. 11
Figure 2-8 - Google Glass Explorer Edition [7].................................................................................... 11
Figure 2-9 - Map of the “Mall of America” in Minneapolis with and without Indoor Maps [9] .......... 12
Figure 3-1 - Navigation - Map View .................................................................................................... 15
Figure 3-2 - Route Navigation Bar: a) with Textures, b) with accurate Position ................................. 16
Figure 3-3 - Route Navigation Bar: a) Symbol, b) Cross Section, c) Top View .................................. 16
Figure 3-4 - Navigation - AR (Markers) ............................................................................................... 17
Figure 3-5 - Navigation AR (Arrow) .................................................................................................... 17
Figure 3-6 - Navigation - Rear Mirror Approach ................................................................................. 18
Figure 3-7 - Explore - Indoor Markers .................................................................................................. 20
Figure 3-8 - Explore - Social Markers .................................................................................................. 20
Figure 3-9 - Explore - Information Layers ............................................................................................ 21
Figure 3-10 - Explore - Highlighted Center Marker ............................................................................. 22
Figure 3-11- Explore - Highlighted Center Marker (moved) ................................................................ 22
Figure 3-12 - Explore - Occluded Markers ........................................................................................... 22
Figure 4-1 - Trilateration: a) Perfect Signals, b) Imperfect Signals ...................................................... 27
Figure 4-2 - Data Flow Diagram v0.3 by Marc Wrubelewski .............................................................. 29
Figure 4-3 - Building Map .................................................................................................................... 31
Figure 4-4 - Floor Map ......................................................................................................................... 32
Figure 4-5 - Aerial Image ..................................................................................................................... 32
Figure 4-6 - Screenshots of 3D Network Dataset ................................................................................. 33
Figure 4-7 - Screenshot of a Floor Plan in the AirWave Management Platform .................................. 35
Figure 4-8 - System Architecture .......................................................................................................... 40
Figure 5-1 - Class Diagram of the DAO pattern [15] ........................................................................... 43
Figure 5-2 - Sequence diagram of DAO pattern [15] ........................................................................... 43
Figure 5-3 - Code - PreparedStatement ................................................................................................. 44
Figure 5-4 - Code - Initial context LDAP ............................................................................................. 45
Figure 5-5 - Example Result Set for a Route ........................................................................................ 47
Figure 5-6 - Route Entering a Building ................................................................................................ 47

vii
Figure 5-7 - Route changing Elevator on third Floor ............................................................................ 48
Figure 5-8 - Information flow of a search query ................................................................................... 48
Figure 5-9 - Code - Example of REST Service .................................................................................... 50
Figure 5-10 - Code - Initialize MapView .............................................................................................. 53
Figure 5-11 - Multitouch Gestures: a) Pinch, b) Spread, c) Scroll [17] ................................................ 53
Figure 5-12 - Mixare JSON Format ...................................................................................................... 55
Figure 5-13 - Code - AsyncTask Skeleton ............................................................................................ 56
Figure 5-14 - Code - Thread Example .................................................................................................. 57
Figure 5-15 - Code - MapActivity ........................................................................................................ 58
Figure 5-16 - Code - Android XML Layout of CampusMapView ....................................................... 59
Figure 5-17 - Main Menu ...................................................................................................................... 60
Figure 5-18 - a) Search Form, b) Search Results .................................................................................. 61
Figure 5-19 - a) Map View with Building Plan, b) Map View with Floor Plan ................................... 62
Figure 5-20 - a) Map view with option menu, b) Map view with search result .................................... 63
Figure 5-21 - a) Navigation View 1st Segment, b) Navigation View 2nd Segment ............................. 63
Figure 5-22 - a) AR View with Building Markers, b) AR View with Option Menu ............................ 64
Figure 5-23 - a) AR Text Input, b) AR view With Graffiti Markers .................................................... 64
Figure 5-24 - a) AR View with Waypoints, b) AR View with Arrow Marker ..................................... 65
Figure 5-25 - AR View with Friend Markers ....................................................................................... 65
viii
List of Tables
Table 4-1 - Raw Wi-Fi data .................................................................................................................. 24
Table 4-2 - Wi-Fi data from database ................................................................................................... 24
Table 4-3 - Results for distances with FSPL equation using n=2 ......................................................... 25
Table 4-4 - Measured distances to access points based on floor plan ................................................... 26
Table 4-5 - Results for distances with FSPL equation using n=5.3 ...................................................... 26
Table 4-6 - Worldwide Smartphone Sales to End Users in 1Q12 (Thousands of Units) [12] .............. 37

ix
List of Abbreviations
Symbol
Definition
AMF Action Message Format
API Application Programming Interface
AR Augmented Reality
BSSID Basic Service Set Identifier
CSS Cascading Style Sheets
CSV Comma-Separated Value
DAO Data Access Object
DTO Data Transfer Object
FSPL Free Space Path Loss
GIS Geographic Information Service
GPS Global Positioning System
GUI Graphical User Interface
HTML Hypertext Markup Language
HTTP Hypertext Transfer Protocol
JDBC Java Database Connection
JNDI Java Naming and Directory Interface
JSON JavaScript Object Notation
KML Keyhole Markup Language
LDAP Lightweight Directory Access Protocol
REST Representational State Transfer
RF Radio Frequency
RSSI Received Signal Strength Indication
SDK Software Development Kit
SOAP Simple Object Access Protocol
SSID Service Set Identifier
TDOA Time Difference Of Arrival
UI User Interface
URL Uniform Resource Locator
Wi-Fi Wireless Fidelity
WSDL Web Services Description Language
XML Extensible Markup Language

Chapter 1: Introduction - Motivation 1
1 Introduction
This chapter introduces the reader to the topic of this thesis. The motivation for this work is explained
as well as the goals which should be accomplished in this project. It also describes the structure of this
thesis.
1.1 Motivation
A university campus is a complex infrastructure. Especially new students and people who are on it for
the first time have a hard time to orientate themselves and find places.
The campus of the University of Calgary occupies more than two square kilometers and thus is even
larger than Calgary’s entire downtown. The campus has many different buildings with up to 15 floors.
Most of the buildings are connected to each other, some of them even by underground walkways.
Even if there are maps at some points on the campus, users do not have continuous help to get to their
destination. They can try to figure out a way to get to their target on these static maps, but as soon as
they start walking in the target direction they have no help any more.
Whereas it is very common to use navigation systems in cars to reach designated locations, systems
for pedestrian navigation are quite hard to find.
So, how is it possible to help freshmen and other inexperienced people orientate themselves on the
university campus and support them finding places on campus with the help of modern techniques?
1.2 Goal
As mobile devices like smartphones become ever more powerful and affordable for a majority of
people, they are starting to access all different parts of life. The use of smartphones which comes
along with the excessive use of mobile applications is becoming more and more common, especially
in the university domain.
Besides the functionality of surfing the web, reading and writing emails, smartphones offer the ability
of context aware applications. The majority of these mobile devices have built-in techniques to
determine their geographical position. These techniques combined with the right software can provide
the user with location-based information, which can help a user in different ways.

Chapter 1: Introduction - Structure of Thesis 2
The goal of this thesis is to create an application prototype for a smartphone, which supports people
on a university campus. Just like a car navigation system, a navigation system for pedestrians at the
University of Calgary should be developed. Whereas paths computed by car navigation systems are
just two dimensional, paths on campus can consist of segments on different building floors and so are
in most cases three dimensional. Considering that, a new user interface which is suitable for 3D
navigation has to be designed.
In addition to the navigation feature the user’s current location can be used to show him nearby points
of interest and help him get to know the campus. To make the application more interesting and fun to
use, social content like user posted comments or the position of friends will be part of the information
that is displayed in the application. For displaying this information, an augmented reality view is
integrated.
Given the fact that a high percentage of university life happens inside buildings, a suitable indoor
location tracking method is part of the implementation, too.
To realize these features the existing information environment of the University of Calgary has to be
investigated. A system architecture has to be designed, which handles different data sources and
makes it simple to access them from client applications. There should be an easy way to exchange
data sources or add new ones to the existing model. The main logic of the system has to be part of the
server, so that it is easy to port the resulting application to other mobile platforms.
Although the prototype is focused on the campus of the University of Calgary, it should be easily
portable to other areas.
1.3 Structure of Thesis
This thesis describes the entire process of developing a mobile application for pedestrian navigation
purposes. It is divided into six parts.
After this introduction chapter, basic techniques and related work are briefly explained in chapter 2.
The third chapter is about the user interface. It describes the basic thoughts of adapting the user
interface of car navigation systems and enhancing it with certain features that are helpful for
pedestrian use. Different approaches are shown in sketches.
In chapter 4 the software concept is explained. Data sources that are useful for this application, as well
as different methods to integrate them into the system, are evaluated. Technical decisions regarding
the platform for the prototype are made along with others, which lead to the final system architecture.

Chapter 1: Introduction - Structure of Thesis 3
After designing user interface and software architecture, chapter 5 describes the implementation
process of server and client software. The management of data sources, as well as the interfaces of the
server, are shown. Besides the integration of different information sources from the server, the main
focus on the client side lies on the implementation of the graphical user interface.
Finally, Chapter 6 summarizes this work. It gives an overall conclusion, shows the problems that
came up and the limitations of the resulting application. In the end of this chapter future tasks to
enhance this application are listed.
Chapter 2: Background - Geographic Information System 4
2 Background
Before designing the application and the system environment, this chapter gives insight into
techniques used in this project. Furthermore, a short overview of applications that are related to this
project is given in the end of this chapter.
2.1 Geographic Information System
A geographic information system (GIS) is a system which is used to store, retrieve, map and analyze
geographical data. These systems store any kind of information which is related to a geographical
location. These spatial features are stored in a coordinate system which references a certain place on
the surface of the earth.
The main use of geographic information systems is resource management, development planning and
scientific research.
2.1.1 Describing Geographical Data
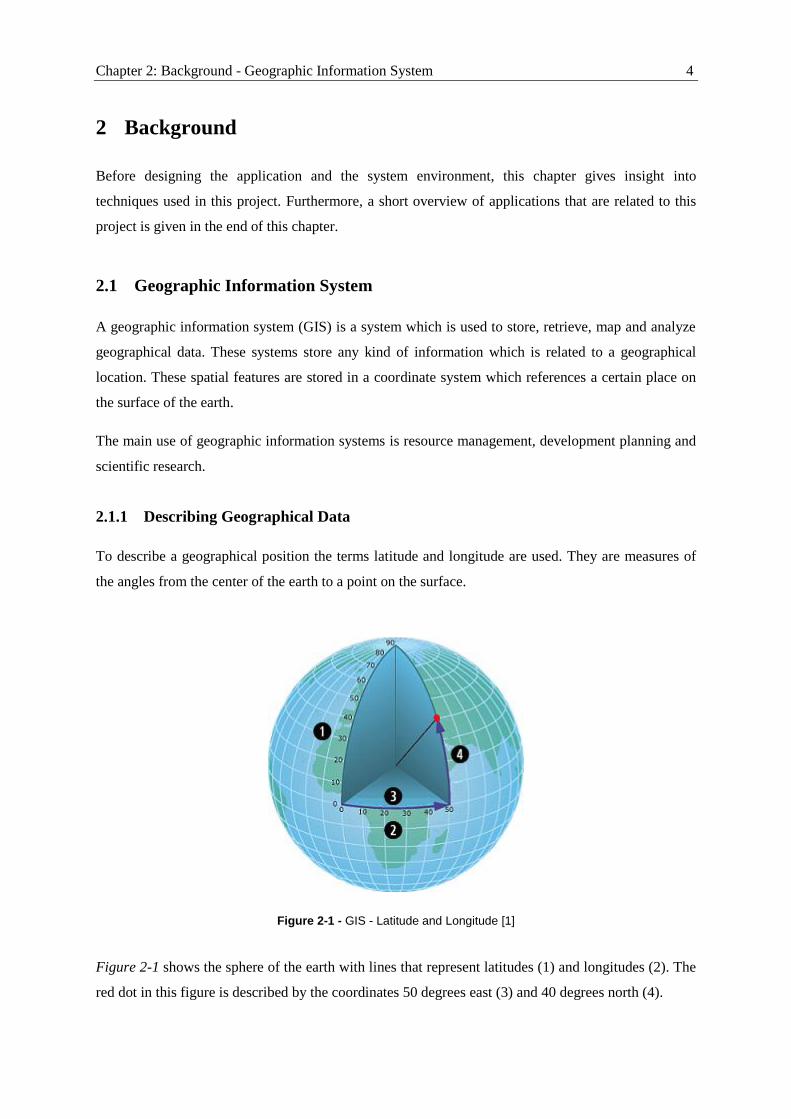
To describe a geographical position the terms latitude and longitude are used. They are measures of
the angles from the center of the earth to a point on the surface.
Figure 2-1 shows the sphere of the earth with lines that represent latitudes (1) and longitudes (2). The
red dot in this figure is described by the coordinates 50 degrees east (3) and 40 degrees north (4).
Figure 2-1 - GIS - Latitude and Longitude [1]
Chapter 2: Background - Geographic Information System 5
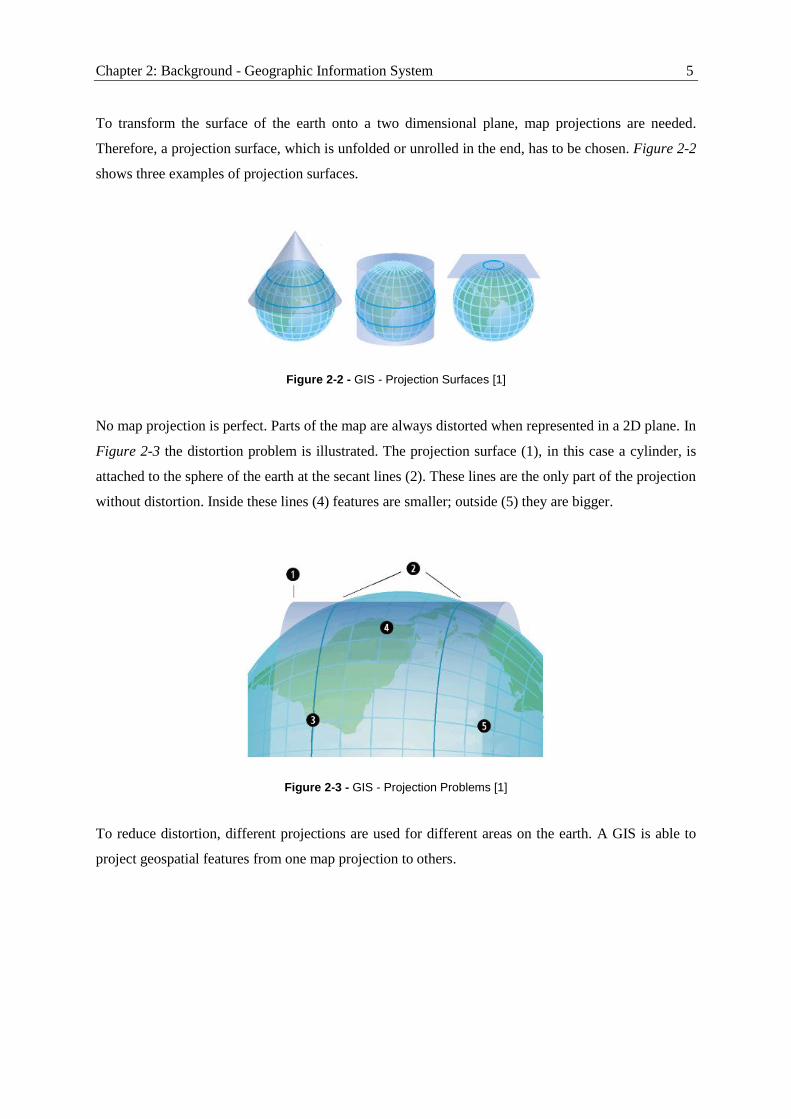
To transform the surface of the earth onto a two dimensional plane, map projections are needed.
Therefore, a projection surface, which is unfolded or unrolled in the end, has to be chosen. Figure 2-2
shows three examples of projection surfaces.
No map projection is perfect. Parts of the map are always distorted when represented in a 2D plane. In
Figure 2-3 the distortion problem is illustrated. The projection surface (1), in this case a cylinder, is
attached to the sphere of the earth at the secant lines (2). These lines are the only part of the projection
without distortion. Inside these lines (4) features are smaller; outside (5) they are bigger.
To reduce distortion, different projections are used for different areas on the earth. A GIS is able to
project geospatial features from one map projection to others.
Figure 2-2 - GIS - Projection Surfaces [1]
Figure 2-3 - GIS - Projection Problems [1]

Chapter 2: Background - Location Tracking of Mobile Devices 6
2.1.2 Esri ArcGIS
At the University of Calgary the geographic information system of Esri is used. Esri ArcGIS is one of
the biggest GIS on the market and has a share of over 30%. [2]
ArcGIS refers to an entire software suite around geographic information systems. It contains products
for server and desktop use, as well as for mobile platforms. ArcGIS Server is used to deploy GIS
functionality at a central point. It is used for creating and managing GIS data and applications. It also
offers a variety of web services.
ArcGIS Desktop is a software suite which provides functionality to access GIS data stored locally on
a PC or on a server. It offers methods to create cartography, edit them and do advanced analysis and
geoprocessing. Furthermore, there are software products that enable 3D analyses and creation of
network datasets to simulate real world networks, which can be used for routing.
Esri also offers a huge palette of developer tools for their system including mobile APIs1 and APIs for
web development.
2.2 Location Tracking of Mobile Devices
As location-based services have increased in popularity over the last years, the need for positioning of
mobile devices becomes more and more important.
2.2.1 GPS-based Positioning
The Global Positioning System (GPS) is the leading technology to determine locations on mobile
devices. Almost every smartphone on the market has the capability to receive GPS signals. GPS is a
freely accessible system based on satellites. To determine a position the GPS receiver needs a line of
sight to four or more satellites. Given this fact, GPS only works outdoors.
Each satellite is equipped with a highly accurate atomic clock and sends out this time along with
position data of the satellites and error correction data. A GPS receiver compares the satellite time
with its own clock and computes based on the difference the distance to the satellite. The distance to
the satellite and its absolute position defines a sphere, centered at the satellite (see Figure 2-4). The
position of the receiver has to be at one point on this surface. Adding data from a second satellite,
another sphere can be drawn. Not considering the unlikely event they intersect in one point, both
spheres intersect in a circle. A third sphere, computed by the data of the third satellite narrows the
1 Application Programming Interface

Chapter 2: Background - Location Tracking of Mobile Devices 7
position of the receiver down to two points on this circle. For position determination used by
smartphones, the intersection point closest to the earth’s surface is the correct position of the receiver.
The fourth satellite is to correct the error which arises by the fact that the clock of the receiver is not
as accurate as the atomic clocks of the satellites.
The accuracy of a position determined by GPS depends on the receiver. Most consumer receivers
have an accuracy of 5 to 10 meters.
2.2.2 Wi-Fi-based Positioning
While the GPS method for positioning works great outdoors it is not usable indoors, due to the fact
that it needs a line of sight to at least four satellites. With an accuracy of 50 - 300 meters, the location
tracking method using the mobile phone network is also not suitable.
To determine a usable indoor location estimate, different approaches based on Wi-Fi technology can
be used.
Nearest Sensor
The easiest way to get a location estimate based on wireless networks is to use the nearest access
point. This system is integrated into most of the access point management systems. It determines the
access point to which a client is connected. Under the assumption that this is the closest access point
and based on the information of it, it computes how far the signal of this access point radiates. The
client has to be in range of this area.
Figure 2-4 - GPS - Intersecting Spheres [3]
Chapter 2: Background - Location Tracking of Mobile Devices 8
Received Signal Strength Indication (RSSI)
Similar to the computation of the GPS-based position, a location estimate can be calculated by the
received signal strength of the nearby wireless networks.
Whereas the time difference of arrival (TDOA) was used to determine the distance to the satellite, the
distance to Wi-Fi access points can be deduced from the RSSI. With the outgoing power level of the
access point and signal strength received by the client, the absolute loss of the signal strength is
calculated. With the free space path loss2 equation this leads to the distance to a specific access point.
With the distance to three access points and their absolute position, the position of the client can be
computed by using a trilateration algorithm. More precise information to this algorithm can be found
in chapter 4.1.3.
Radio Frequency Fingerprinting
A relatively high effort is needed for the initial setup of this method. A physical walk around with
special spectrum analysis units is needed to create radio frequency (RF) fingerprints for different
points of the area where the location should be tracked. A fingerprint identifies locations by measures
of the radio frequency setting, which is created by the wireless network access points.
Management systems from different vendors include functionality to manage these fingerprints.
Based on the measured fingerprints these systems have the ability to compute fingerprints for every
other point of the needed area with sophisticated interpolation algorithms.
To determine the position of a mobile device, the device sends the current RF fingerprint of its
environment to a server. The server compares this real-time fingerprint with the ones in the database
and computes a position based on the fingerprints which are similar to it.
The benefit of this system is that it also takes environmental effects like reflections on walls or other
objects into account.
2 relation of signal loss of an electromagnetic wave and the distance to the transmitter (described in chapter
4.1.2)

Chapter 2: Background - Augmented Reality 9
2.3 Augmented Reality
Augmented Reality (AR) is a type of virtual reality where a live view of a real-world environment is
displayed on a device like a smartphone with a layer of additional data attached to it. This additional
information (e.g. names and reviews of nearby restaurants as seen in Figure 2-5) augments the view
of the real world by using the sensors of the device.
AR is a combination of different techniques. It requires a device with a camera to show the direct
view of the environment. To determine the position and the orientation of the device several sensors
are used. In most cases the GPS receiver of the smartphone is used for determining the current
position. Compass and accelerometer help to determine the direction in which the device is facing.
AR also needs an internet connection to receive data for the information layer.
In the end, everything is combined by software, e.g. an application on a smartphone.
There are not only augmented reality applications for mobile devices, AR also works on desktop
computers with a camera attached to it. A user can hold objects (e.g. products from a specific
company) in front of the camera and then see an information layer on the screen.
Figure 2-5 - Augmented Reality View on a Smartphone [4]
Chapter 2: Background - Related Work 10
2.4 Related Work
In this part applications are described, which are related to the topic of this thesis.
2.4.1 Oregon University App
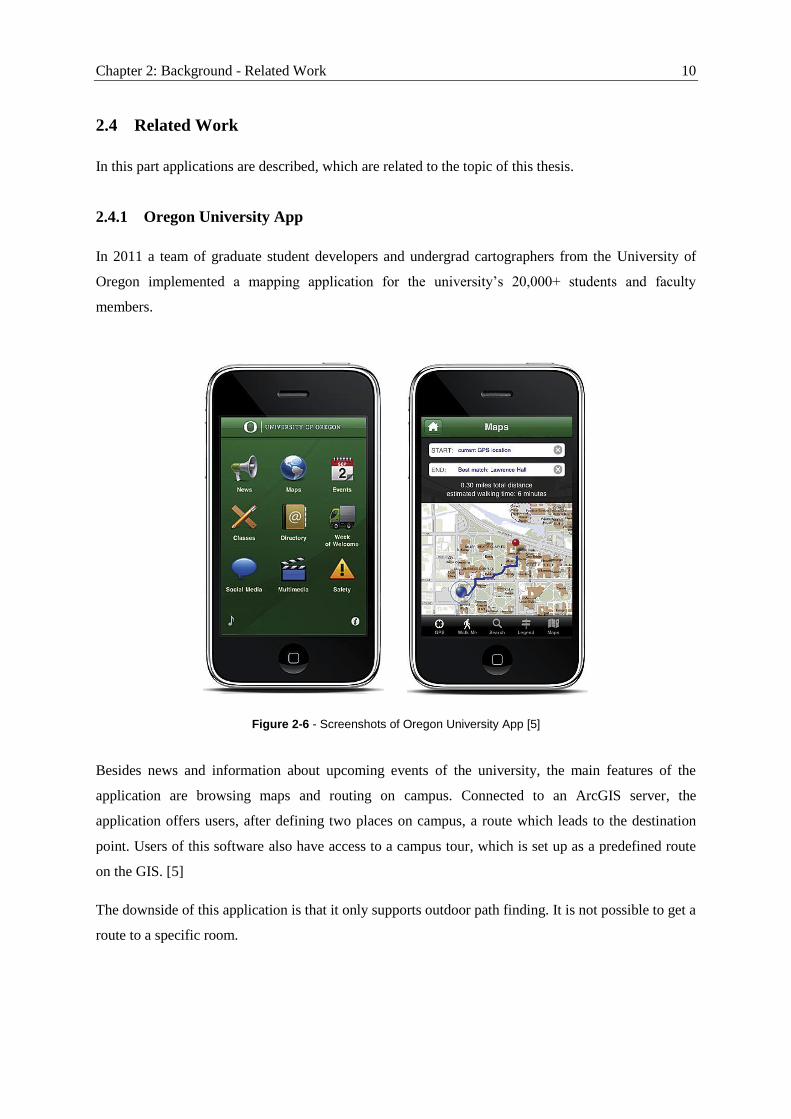
In 2011 a team of graduate student developers and undergrad cartographers from the University of
Oregon implemented a mapping application for the university’s 20,000+ students and faculty
members.
Besides news and information about upcoming events of the university, the main features of the
application are browsing maps and routing on campus. Connected to an ArcGIS server, the
application offers users, after defining two places on campus, a route which leads to the destination
point. Users of this software also have access to a campus tour, which is set up as a predefined route
on the GIS. [5]
The downside of this application is that it only supports outdoor path finding. It is not possible to get a
route to a specific room.
Figure 2-6 - Screenshots of Oregon University App [5]
Chapter 2: Background - Related Work 11
2.4.2 Project Glass
Project Glass is a program of Google for research and development of an augmented reality
application using glasses as a head mounted display.
Basically this device enables a user to do things that are normally only possible with a smartphone.
The user is, for example, able to look up context based information, take pictures and videos, get
directions to stores or other locations or do video chats with this device. Information is displayed on a
heads-up display as seen in Figure 2-7.
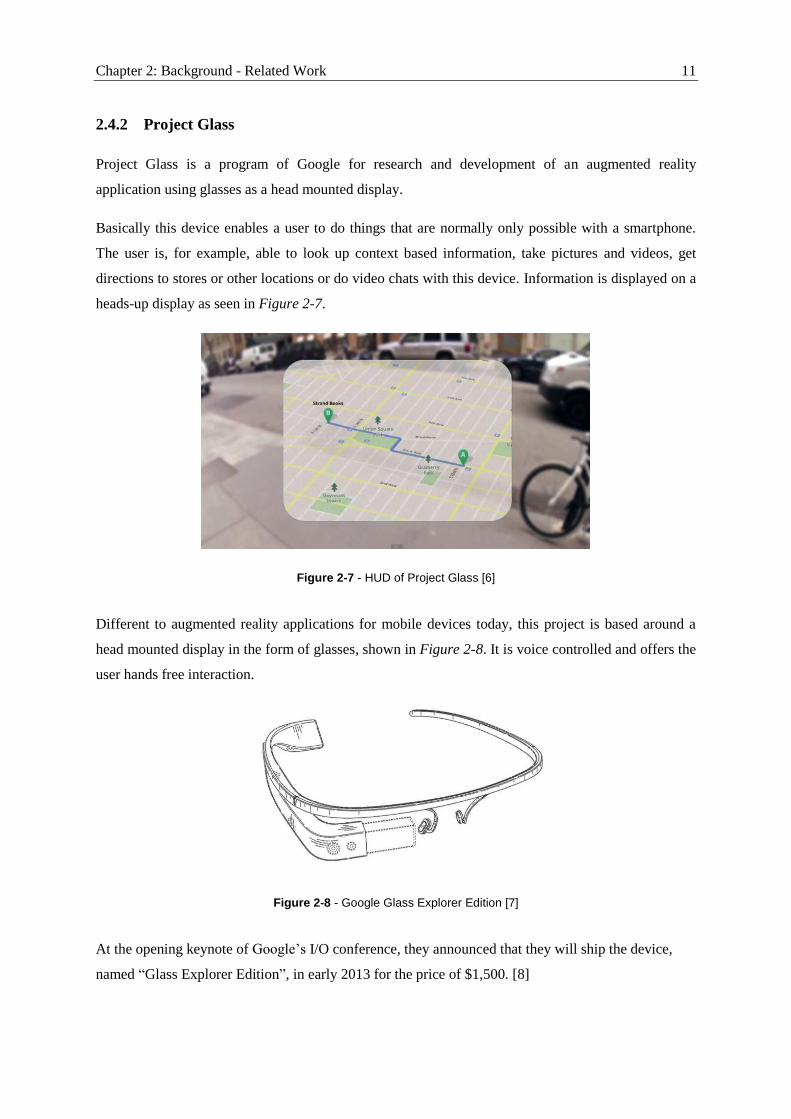
Different to augmented reality applications for mobile devices today, this project is based around a
head mounted display in the form of glasses, shown in Figure 2-8. It is voice controlled and offers the
user hands free interaction.
At the opening keynote of Google’s I/O conference, they announced that they will ship the device,
named “Glass Explorer Edition”, in early 2013 for the price of $1,500. [8]
Figure 2-7 - HUD of Project Glass [6]
Figure 2-8 - Google Glass Explorer Edition [7]

Chapter 2: Background - Related Work 12
2.4.3 Google Maps Indoor
In the end of 2011 Google started to integrate indoor maps into the Google Maps3 application for
Android. Instead of just showing the outdoor map with few details (see left screen of Figure 2-9),
detailed floor plans are shown (see right screen of Figure 2-9). On the right side of this screen a floor
selector is shown, which enables the user to switch between the different floor maps.
By now, indoor maps are available for some of the biggest retailers in the United States (e.g. Mall of
America, IKEA, The Home Depot), airports (e.g. Chicago O’Hare, San Francisco International
Airport) and transit stations.
Indoor location tracking is also part of the application. Google claims 5 to 10 meters accuracy by
using radio frequency fingerprinting technique.
3 feature is available since version 6.0
Figure 2-9 - Map of the “Mall of America” in Minneapolis with and without
Indoor Maps [9]

Chapter 3: Interaction Design - Navigation 13
3 Interaction Design
This chapter deals with different approaches on how to create an intuitive application for a mobile
device to support a person on campus in different situations.
As described in the introduction chapter there are two main goals for this application prototype. The
first goal is to provide the user with an on campus navigation system that helps him to get from his
current position to a designated building or room. The second feature of this application focuses on
presenting different kinds of useful information in an augmented reality view.
Different ideas to achieve these goals are discussed in this chapter. To better demonstrate the concepts
and designs, low fidelity prototypes are created. These prototypes act as a model for the graphical user
interface (GUI) of the application, which is created in the next chapter.
3.1 Navigation
Pedestrian navigation differs in many ways from the conventional navigation system used in a car. In
this chapter main differences between these two systems are worked out and adapted for pedestrian
use.
3.1.1 Basic Adjustments for Pedestrian Navigation
A route on campus of the University of Calgary can be very long and thus very confusing for a person
who is not familiar with this area. To simplify the route, it has to be broken down into smaller
segments that provide an easy overview. Regarding the low travel speed of a pedestrian, the route
segments should not be longer than a few hundred meters. With those small segments the user can
track his progress better and is more motivated to get to the next waypoint, because it is achievable in
a shorter period of time.
There are three main criteria that define important waypoints on a campus route on which it would be
useful to divide the route into different segments:
Entering or leaving a building
If a pedestrian enters a building his complete perception will change. To reflect the user’s
perception change the view on his mobile device should also change. For example, the map
view should change from an outdoor map (only showing ground plans of buildings) to an
indoor map (showing the map of the current floor).

Chapter 3: Interaction Design - Navigation 14
On height change
If the path uses more than one floor it has to be split, because it is not possible to display
more than one floor on a 2D map at the same time. Therefore, the route is segmented at every
elevator or staircase.
Landmarks
such as sculptures, big signs
3.1.2 Navigation Views
For different situations while navigating on campus there have to be separate views.
The basic mode, which appears after defining the route, is called map mode and displays an overview
of the entire route, the different segments and the user’s progress on it. A screen is designed with a
map that covers the route segment and displays basic information on it.
In case of car navigation, the navigation device is in the driver’s field of view all the time. In case of
pedestrian navigation it is different. While it is okay to hold the device vertical and look at the display
for a short time to explore nearby points of interest, it is not possible to do so while walking. Beside
the fact that there is a danger of colliding with other people due to a lack of attention, it would not be
very comfortable for users to hold up their device and walk around on campus with it. The walk
mode has to be designed in a way so that it can be used in a more natural way while walking.
In situations where it is very crowded, or when the user has to cover a large distance he does not want
to look at the display of his mobile device all the time. A third mode which notifies the user in a non-
visual way has to be created. This mode is named invisible mode.
Search View
Defining a route should be as easy as possible. It should only display one input field, where the user
can insert free text. The underlying algorithm should be sophisticated enough to analyze different
types of destination inputs such as:
building and room (e.g. “Math Science 680”)
building abbreviation and room (e.g. “MS 680”)
university staff (e.g. “Vaughn Ravenscroft”)
points of interest (e.g. “Tim Hortons”)
If the search returns more than one result a list with all results should be shown. Through a single tap
on a list item the user can choose his destination.
Chapter 3: Interaction Design - Navigation 15
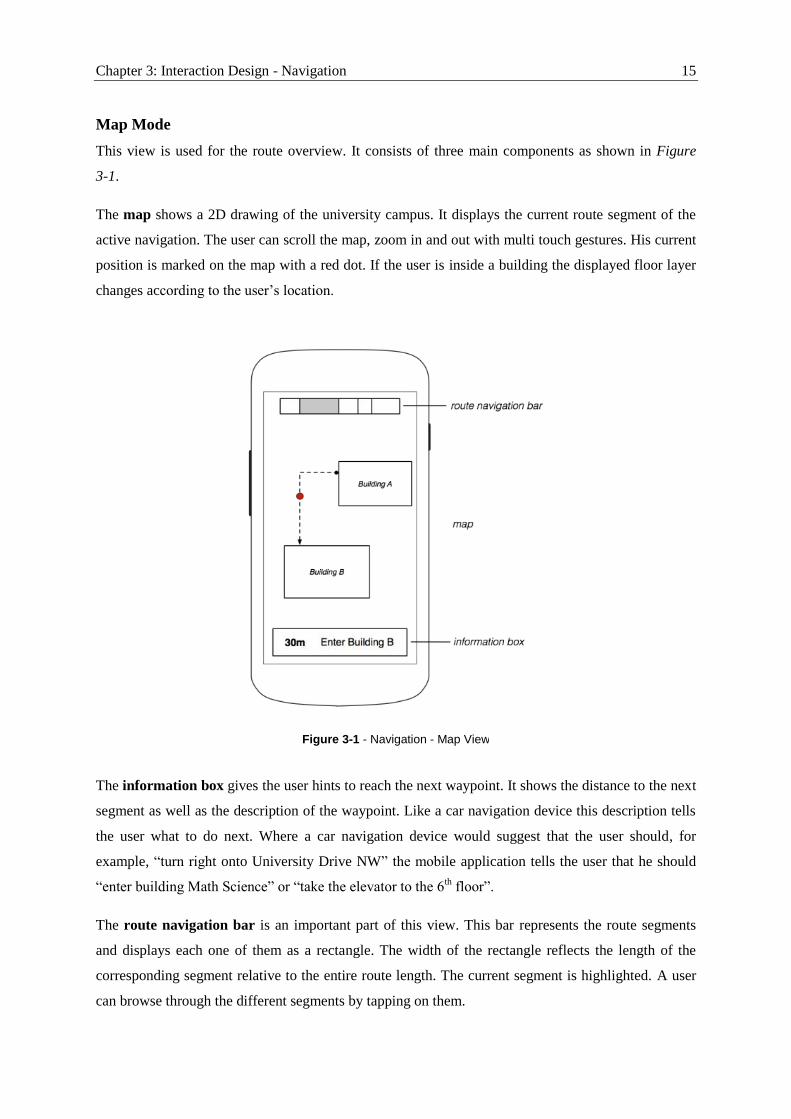
Map Mode
This view is used for the route overview. It consists of three main components as shown in Figure
3-1.
The map shows a 2D drawing of the university campus. It displays the current route segment of the
active navigation. The user can scroll the map, zoom in and out with multi touch gestures. His current
position is marked on the map with a red dot. If the user is inside a building the displayed floor layer
changes according to the user’s location.
The information box gives the user hints to reach the next waypoint. It shows the distance to the next
segment as well as the description of the waypoint. Like a car navigation device this description tells
the user what to do next. Where a car navigation device would suggest that the user should, for
example, “turn right onto University Drive NW” the mobile application tells the user that he should
“enter building Math Science” or “take the elevator to the 6th floor”.
The route navigation bar is an important part of this view. This bar represents the route segments
and displays each one of them as a rectangle. The width of the rectangle reflects the length of the
corresponding segment relative to the entire route length. The current segment is highlighted. A user
can browse through the different segments by tapping on them.
Figure 3-1 - Navigation - Map View

Chapter 3: Interaction Design - Navigation 16
There are a few enhancements which could improve the route navigation bar.
To enrich this bar with more information, the segments could get a background color which represents
the type of segment. As it is shown on the left in Figure 3-2, the outdoor segment could be displayed
with a grass texture whereas the indoor segment is displayed in cement gray. To highlight a segment it
would simply get another shade of the segment texture.
Instead of only highlighting the segment in which the user currently is located, a symbol could be
displayed at the exact point on the route to show the user his progress more accurately. In Figure 3-2
(right) you can see a red dot displaying the current location on the route.
The main difference to navigation systems used in cars is that pedestrian navigation on a campus can
be three dimensional due to different building floors. The segments where the elevation gain occurs
(elevators and staircases) could be displayed in another way than the flat segments of the route. The
next sketches show different approaches to visualize elevation gain on a route.
The first approach shown in Figure 3-3 a) suggests that the segment illustrating the elevation gain
could be represented as a symbol on top of the route navigation bar. Instead of drawing the elevation
gain segment as a normal rectangle this approach indicates in an intuitive way that something special
is happening. The next two figures demonstrate other designs of the route navigation bar to illustrate
3D paths in a more intuitive way. Figure 3-3 b) shows a cross section of the route, which roughly
displays the elevation profile. In Figure 3-3 c) the same data is shown in a top view.
Figure 3-2 - Route Navigation Bar: a) with Textures, b) with accurate Position
Figure 3-3 - Route Navigation Bar: a) Symbol, b) Cross Section, c) Top View

Chapter 3: Interaction Design - Navigation 17
Walk Mode
To give the user a more dynamic way of finding his route, views based on augmented reality could be
offered to him. In this mode the user would see the camera feed of his smartphone. On top of it
additional helpful information for his current routing segment would be displayed. He would see at
least one next waypoint and his final target (see Figure 3-4).
In addition to this view there could be another perspective, which is activated when pointing the
camera of the smartphone to the ground.
A compass-based arrow could be shown in this view. According to the device’s orientation it always
points to the next waypoint. A basic description of the next waypoint, as well as the distance to it,
could be illustrated in a small box at the top of the display (see Figure 3-5). The user is able to get the
most important information to reach the next waypoint with just a quick look.
Figure 3-4 - Navigation - AR (Markers)
Figure 3-5 - Navigation AR (Arrow)

Chapter 3: Interaction Design - Navigation 18
As a slight modification of this view a map of the user’s location could be displayed on top of the
augmented reality view. This would combine both advantages of the map mode and the explore mode
(see Figure 3-6). The downside of this approach is the limited space on a smartphone. To have an
adequate area on the screen for the camera feed and the augmented reality layer, there is not much
space left for the map view.
Invisible Mode
On long walking parts of the route there is no need to look permanently on the device. Especially
more experienced users do not need to look at the map and the navigation descriptions all the time.
That is why there should be a third navigation mode which is more passive.
This mode – the invisible mode – is activated when the user turns off his display. He can put his
mobile device in his pocket and still gets notifications. There are two types of notifications in this
mode.
The first one uses the vibration motor in the smartphone. Whenever the user’s location drifts too far
away from the active route, the phone vibrates to attract the user’s attention. The same happens if the
user reaches a waypoint so that the application can give him new instructions. If the mobile device
does not support vibration a short acoustic signal could be sent out.
Voice controls are the other type of notification. The user gets the navigation hints, normally
displayed in the information box on the map view and via notes in the augmented reality view,
Figure 3-6 - Navigation - Rear Mirror Approach

Chapter 3: Interaction Design - Explore 19
through text-to-speech messages. These messages are only available when ear phones are plugged in,
so that it does not disturb other people.
3.2 Explore
The Explore mode of the mobile App should help the user to obtain information of his close
environment. Therefore, the augmented reality technique is used. As introduced in chapter 2.3,
augmented reality adds additional location-based information to the camera feed of a mobile device.
3.2.1 Information Types in Augmented Reality View
There are different types of information which could be useful for a user to know about.
A big help for a user who walks on outdoor paths of the campus would be to show him which
buildings are close to him. This would be the basic information everybody on campus needs to
improve his orientation.
Inside of buildings this layer is not useful at all. It should be swapped for more detailed information
about the specific building. The offices, lecture halls and nearby points of interest (e.g. stores, cafes or
shops at the food court) could be displayed as well as details to these entities like:
details of the person in a room like name, contact details (telephone number, email
address) or a link to his page on the University of Calgary webpage
next classes in lecture halls
information provided by authorized university staff like the research field of a lab, the
responsibilities of specific people in an office
opening hours of shops
special deals at the food court

Chapter 3: Interaction Design - Explore 20
Besides these static kinds of information (see Figure 3-7) several dynamic notes could be added to
this mode. The application should offer users the ability to create location-based content. Each user
should be able to add notes on walls of buildings or rooms like drawing graffiti on walls, but in a
virtual way without the vandalistic aspect. Students could add comments to stores in the food court or
upload geo-referenced pictures.
In addition to these user-created notes, the current position of the user’s friends on campus could be
added to the augmented reality layer. Each user who wants to use this feature would submit his own
coordinates in regular intervals to a central database. In return he would see the last known position of
his friends on the map.
Figure 3-7 - Explore - Indoor Markers
Figure 3-8 - Explore - Social Markers

Chapter 3: Interaction Design - Explore 21
3.2.2 Displaying Information
Without limiting the displayed information in this view, the user would be overwhelmed and not be
able to distinguish between essential and additional information.
To reduce the amount of notes in this view the user should be able to browse and limit those different
kinds of data in an easy way.
Information Filtering
The different types of information suggested in chapter 3.2.1 could be arranged in layers. In a separate
settings menu each layer could be turned on and off to reduce the overall amount of data displayed in
the augmented reality view.
In addition to disabling entire layers the radius of displayed notes could be used to limit data on the
view. A user could set the desired radius of displayed information and thus hide data which is farther
away and most likely not as important.
Intelligent Selecting
Even though the user has the ability to filter and reduce the displayed data, the amount of notes in the
augmented reality can be confusing. An intelligent way has to be designed to display details to each
augmented reality entity.
In case of five or more augmented reality notes on screen it is not possible to display a text box with
details to each one of them.
To reduce the amount of notes on the screen, only details to the center note could be shown. The
marker for the entity would be highlighted and a textbox is shown in the bottom center of the screen
with details to it.
Figure 3-9 - Explore - Information Layers

Chapter 3: Interaction Design - Explore 22
To get information on other augmented reality entities the user has to pan his mobile device to get
those into the center of the screen. The text box changes its content accordingly to the selected marker
(see difference from Figure 3-10 to Figure 3-11).
Occlusion
Another method to separate more important augmented reality notes from less important ones, is to
occlude the ones that are farther away from the user’s current location. Buildings in the back get
occluded behind buildings in the front, the shapes displaying the augmented reality information are
illustrated in the same way. Given the fact that the more distant buildings are most likely less
important than the closer ones, it is not a severe loss of information if a shape gets fully hidden by a
closer one.
The shapes should be transparent so that the camera feed underneath is not completely covered (see
Figure 3-12).
Figure 3-10 - Explore - Highlighted Center Marker Figure 3-11- Explore - Highlighted Center Marker (moved)
Figure 3-12 - Explore - Occluded Markers

Chapter 4: Software Design and Concept - Indoor Location Tracking 23
4 Software Design and Concept
In the software design chapter different decisions regarding used techniques and the software structure
are made. The available data sources are analyzed. It is evaluated whether they offer the information
that is needed and how they can be integrated into the application environment.
Furthermore, the challenge of determining a usable indoor position will be discussed. With the
received signal strength of the wireless network and the help of the FSPL4 equation the distance to a
Wi-Fi access point is estimated. This information is then converted to an approximation of the indoor
coordinate with the method of trilateration. Aberrations and measurement errors are identified and
tried to reduce. In the end the result of this technique is compared to the location information based on
GPS and cell tower triangulation provided natively by the Android operating system.
4.1 Indoor Location Tracking
For an application which is mainly used inside of buildings, indoor location tracking is very
important. Section 2.2.1 describes why GPS is not able to provide an accurate position indoors.
Therefore, Wi-Fi location tracking is used in this project.
For Wi-Fi based indoor location tracking there are different methods, as described in section 2.2.2. In
this thesis the device location will be estimated on the basis of nearby wireless networks and their
received signal strength. The distance from the Wi-Fi receiver to at least three transmitters has to be
determined. With these distances and the geographical position of the access points, the location of
the smartphone can be estimated with a trilateration algorithm.
A complicating factor of this method is that the known coordinates of the Wi-Fi access points and the
computed distance from the smartphone to them includes measurement errors.
This procedure and an approach to handle those measurement errors are described in the next
subchapters.
4 Free Space Path Loss (see chapter 4.1.2)

Chapter 4: Software Design and Concept - Indoor Location Tracking 24
4.1.1 Collecting Wi-Fi Information
The first step to determine the geographical position of the mobile device is to gather the relevant Wi-
Fi information. The smartphone scans the Wi-Fi environment for all accessible wireless network
signals. For the RSSI approach the BSSID, the received signal strength and the frequency of the
signal is needed (example data is shown in Table 4-1).
ID BSSID RSSI in
dBm
frequency
in MHz
AP1 00:0b:86:d6:ab:a0 -63 2437
AP2 00:0b:86:d6:ab:d0 -72 5220
AP3 00:0b:86:dc:de:40 -91 2437
For trilateration of the smartphone position this data has to be enriched with geospatial data. The
absolute position of the Wi-Fi access point has to be added to each dataset. In addition to that, the
outgoing power level is needed to determine the absolute signal loss, which is used for estimating the
distance to the transmitter (see Table 4-2).
ID BSSID outgoing signal
strength in dBm
longitude latitude altitude
AP1 00:0b:86:d6:ab:a0 15 -114.1303676 51.08024832 12
AP2 00:0b:86:d6:ab:d0 40 -114.1301293 51.08028129 16
AP3 00:0b:86:dc:de:40 15 -114.130464 51.08041162 16
To achieve this, the BSSIDs of Table 4-1 are joined with the database containing the Wi-Fi access
point data.
Table 4-1 - Raw Wi-Fi Data
Table 4-2 - Wi-Fi Data from Database

Chapter 4: Software Design and Concept - Indoor Location Tracking 25
4.1.2 Free Space Path Loss
Before the trilateration algorithm can be used, the distances to three access points is needed. One
method to determine this distance is to use the relation between signal loss and distance to the
transmitter as shown in equation (1). [10]
(
) (
) ( 1 )
where:
Pr is the power level of the receiver (in dBm)
Pt is the power level of the transmitter (in dBm)
is the wavelength
n is the pass loss exponent (n=2 in free space)
d is the distance between receiver and transmitter
Given the fact that the signal frequency differs for multiple access points the wavelength has to be
calculated for each one with formula (2).
( 2 )
The wavelength is the result of the velocity of propagation of the wave (in case of electromagnetic
waves: the speed of light c5) divided by the frequency of the signal .
With equation (1) and the three datasets out of table Table 4-2, we get the following distances as a
result:
d1 77.76m
d2 1819.50m
d3 1953.29m
Since the value 2 for the pass loss exponent n is the value for free space it is not surprising that the
results are much too high. A more accurate value for n has to be approximated.
5 c = 299,792,458 m/s
Table 4-3 - Results for Distances with FSPL Equation using n=2
Chapter 4: Software Design and Concept - Indoor Location Tracking 26
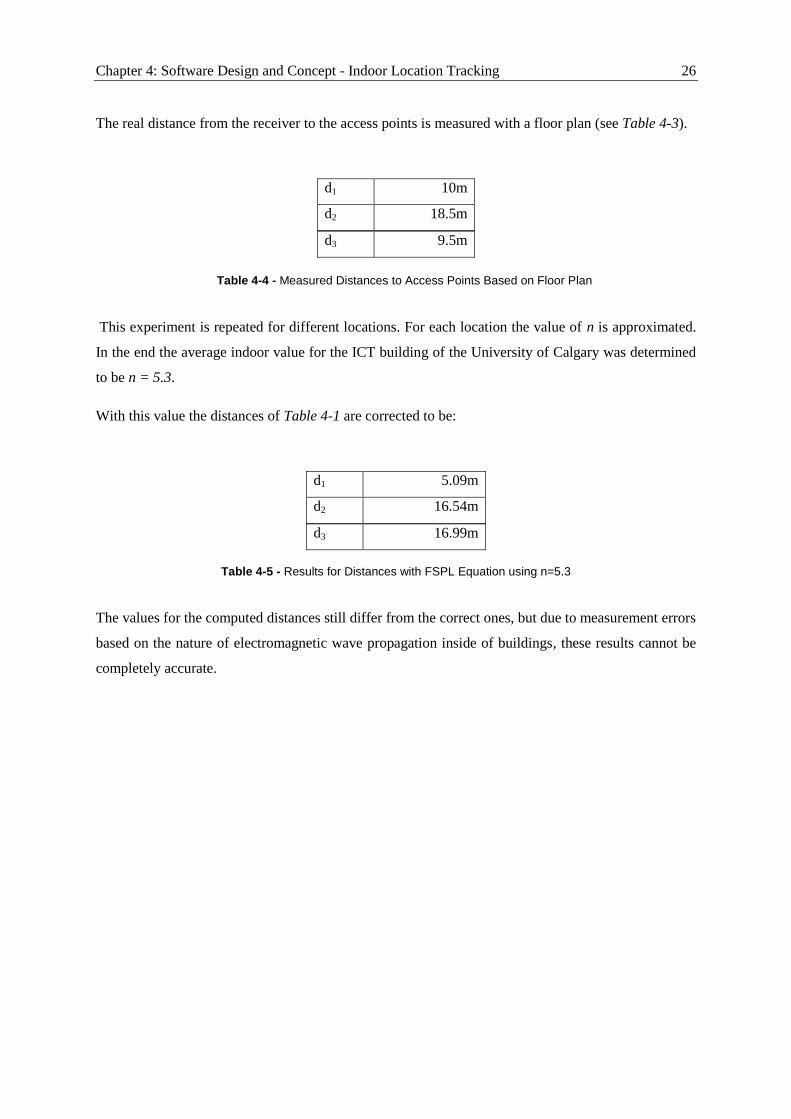
The real distance from the receiver to the access points is measured with a floor plan (see Table 4-3).
d1 10m
d2 18.5m
d3 9.5m
This experiment is repeated for different locations. For each location the value of n is approximated.
In the end the average indoor value for the ICT building of the University of Calgary was determined
to be n = 5.3.
With this value the distances of Table 4-1 are corrected to be:
d1 5.09m
d2 16.54m
d3 16.99m
The values for the computed distances still differ from the correct ones, but due to measurement errors
based on the nature of electromagnetic wave propagation inside of buildings, these results cannot be
completely accurate.
Table 4-4 - Measured Distances to Access Points Based on Floor Plan
Table 4-5 - Results for Distances with FSPL Equation using n=5.3

Chapter 4: Software Design and Concept - Indoor Location Tracking 27
4.1.3 Trilateration
The distance calculated with equation (1) in section 4.1.2 can be used to draw circles around the
known position of the access points.
With perfect information the three circles overlap in one single point as shown in Figure 4-1 a). Due
to measurement errors the circles will not intersect in a single point.
For this situation an algorithm is needed that determines the position which minimizes the distance to
all circles. With the computed distances out of Table 4-5 and the position of the access points out of
Table 4-2 the x- and y-coordinate can be computed. ([11], page 97ff)
The z-coordinate of the estimated position is the median of the altitude values. In this example the
three altitude values are 12, 16, and 16, which implies that the z-coordinate is 16.
4.1.4 Evaluation of the Results
Wireless network signals are very variable, especially indoors where they are reflected on obstacles
and weakened through walls. The received Wi-Fi signal strength differs from scan to scan even
though the position of the receiving device stays the same. Small variations in the RSSI value result in
distance discrepancies of several meters.
Another error source is the absolute position of the Wi-Fi access points which is part of the basic
computing data. As described in section 4.2.3 the position in the database is anything but exact. It
depends on the center of the room which is closest to this device, which can differ from the correct
position by less than one meter in the best, up to 20 meters in the worst case.
Figure 4-1 - Trilateration: a) Perfect Signals, b) Imperfect Signals

Chapter 4: Software Design and Concept - Indoor Location Tracking 28
Given these two facts it is not surprising that the result is not completely accurate. A couple of tests in
different locations resulted in an accuracy of 10 to 20 meters. The average GPS accuracy that can be
achieved with consumer GPS receiver is 5 to 10 meters.
The big advantage of this technique over the location provided by GPS is that the z-coordinate is
much more accurate. Especially indoors where the z-coordinate represents the floor on which the user
is located, this information is very important to display the correct floor plan. With the correct floor
plan and a position with an accuracy in the range 10 to 20 meters the user should be able to orientate
himself.

Chapter 4: Software Design and Concept - Data Sources 29
4.2 Data Sources
Every data source which is used in this project is listed in this section. The level of information and
the method how it can be accessed is described.
4.2.1 University of Calgary LDAP directory
The Information Technologies department of the University of Calgary is running a general purpose
LDAP service. Data in this directory is obtained from a variety of different data sources as shown in
Figure 4-2.
Figure 4-2 - Data Flow Diagram v0.3 by Marc Wrubelewski

Chapter 4: Software Design and Concept - Data Sources 30
The service consists of two distinct LDAP directories.
The “master” directory contains 3 main trees:
"people", containing one entry per issued UCID6 (about 600,000 entries)
"uidauthent", containing one entry per valid IT user account (about 35,000 entries)
"eid", containing one entry per valid myUofC Portal7 ID
[10]
This directory is password protected and is not open to the public. The other directory - the “public”
directory – can be accessed by anyone. It contains a subset of the “master” directory and has a limit of
100 result sets per search. This LDAP directory contains the following information of staff and
students marked as world publishable8:
sn (surname)
givenname (preferred given name)
cn (common name, i.e. givenname + sn)
telephoneNumber
facsimileTelephoneNumber
roomNumber
department (department or faculty name according to TeleWeb or SIS)
labeledURI (URL of homepage)
mail (preferred e-mail address)
userclass (staff, student)
Since these data elements include everything that is needed for the application and 100 results per
search is enough, it is not required to access the “master” directory.
LDAP is a widely supported protocol and APIs for almost every programming language are available.
In the case of this project the directory will be accessed through the JNDI9.
6 University of Calgary Identification number
7 central web service of the University of Calgary to provide information and manage personal data
8 based on internal guide-lines
9 Java Naming and Directory Interface

Chapter 4: Software Design and Concept - Data Sources 31
The long term goal of the IT department is to rearrange the entire database architecture so that
everything can be accessed via the data warehouse ADW. The application should be able to exchange
the current LDAP data source for this new data source easily.
4.2.2 Esri ArcGIS Server
As described in section 2.1.2 the Esri ArcGIS server handles everything that has to do with maps and
geospatial data. Furthermore, it is the source of the paths on campus and used for routing. The GIS
server hosted by the IT department of the University of Calgary offers a couple of different services.
The main service that is used in this project is the map server. It provides any client that can access
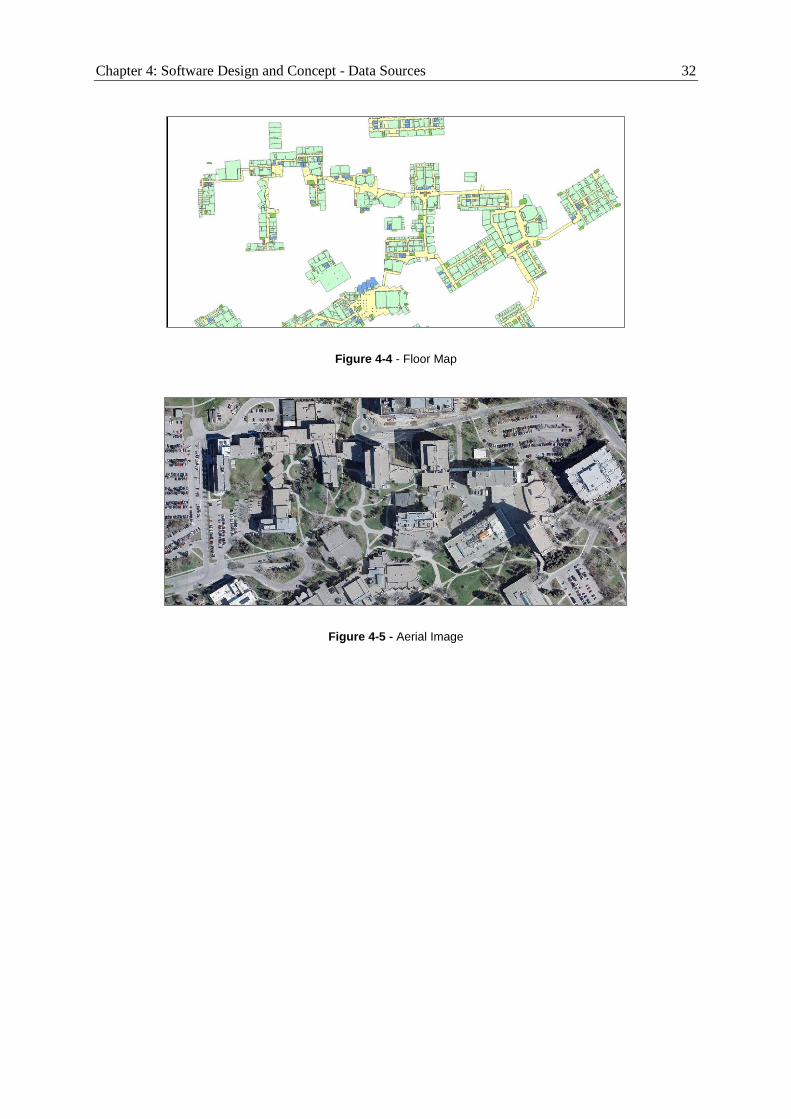
this data with different maps. Besides a building map (see Figure 4-3) where only the ground plan of
each building is available, there are also maps for each floor of on-campus buildings (see Figure 4-4).
On these maps each room with its doors and its basic equipment, the elevators, the staircases and the
hallways can be seen. As a third map there is an aerial image (see Figure 4-5) which can be used to
provide the user with a more detailed view of the campus.
Figure 4-3 - Building Map
Chapter 4: Software Design and Concept - Data Sources 32
Figure 4-4 - Floor Map
Figure 4-5 - Aerial Image

Chapter 4: Software Design and Concept - Data Sources 33
The other important part handled by the ArcGIS server is the path finding. For that purpose, there is
the ArcGIS Network Analyst module. It is used for modeling real world networks and is able to
compute the shortest route from one location to another one.
The server can be accessed through many different interfaces. There are native and web APIs which
can be used on almost every mobile device:
ArcGIS for iOS
ArcGIS for Android
ArcGIS for Windows Phone
ArcGIS for Silverlight/WPF
ArcGIS for Flex
ArcGIS for JavaScript
[11]
Furthermore, there are REST and SOAP web services provided by the server which can be integrated
in every application system independently. The Roomfinder server will mainly focus on these web
service interfaces. For querying geospatial data stored on the ArcGIS server the REST interface is
used. It is very easy to handle and the queries via the REST URL can be tested directly in a browser.
For computing the shortest path between two locations, there is currently only one way which returns
3D coordinates as a result. Neither the native Android API nor the JavaScript API service returns a z-
coordinate, which is required for displaying the route on the correct floor layer. The REST web
service is also unable to process 3D routing information. Only the SOAP web provides x-, y- and z-
coordinates in the resulting route.
Figure 4-6 - Screenshots of 3D Network Dataset

Chapter 4: Software Design and Concept - Data Sources 34
4.2.3 Airuba AirWave Wireless Management Suite
Everything that has to do with the wireless network infrastructure is managed in the Airuba AirWave
Wireless Management Suite. Each Wi-Fi access point on campus with its specific data is stored in this
system.
An excerpt of the data stored in this system:
name of the access point (e.g. ICT_52410
)
SSID11
BSSID12
outgoing signal strength
channel
frequency
history of connected clients
(x- and y-coordinate)
As shown in chapter for trilateration purposes the following information of the wireless network
infrastructure is needed:
frequency of the signal to determine wavelength
outgoing signal level of the Wi-Fi transmitter to determine the FSPL value
mac address of the access point to join the received signal information on the mobile device
with the datasets out of this system
absolute position of Wi-Fi access points
The first three bullet points are exactly in the AirWave Management Platform. The problem is the
absolute position of the access point. The x- and y- coordinate stored in this system represents the
pixel position of an access point on a floor plan. This floor plan is stored as a small image13
which
does not even have to be in a correct scale. Each access point is placed on this picture manually by a
10
references the building and the room number in which the access point is installed 11
Service set identifier, it names and identifies a wireless network 12
Basic service set identification, the mac address of the Wi-Fi access point 13
width and height are maximum 200px

Chapter 4: Software Design and Concept - Data Sources 35
person of the information technology department based on the information they got from the person
who installed the device.
An example of such a floor plan is shown in Figure 4-7. The red and green symbols in this picture
represent the access points. The text box under them displays the name, the power levels, the channel
and the Wi-Fi standard.
The picture has no reference points so that the x- and y-coordinates of the access points cannot be
translated to an absolute geographical location. That is why the only geospatial information that can
be used in this system is the name of the access points which refers to the building and the room in
which it is installed.
The next problem with this system is that there is no way to access this database directly. Currently
there is no web service interface and direct database connection is not possible due to security
restrictions. The most up-to-date data that is accessible is a CSV14
export on a daily basis (see
Appendix: Example CSV Data for Wi-Fi Access Points).
The problem that emerges out of the daily export is that there is no access to the live power levels of
the access points. The outgoing power level of them is not constant at all. It changes according to the
amount of the connected clients and the power levels of the nearby access points. With this out of date
14
Comma-separated values, a file format
Figure 4-7 - Screenshot of a Floor Plan in the AirWave Management Platform

Chapter 4: Software Design and Concept - Data Sources 36
data the FSPL value cannot be determined accurately, which results in an even more inaccurate
distance from the signal receiver to the transmitter.
To use this CSV data a program has to be written which reads the data out of the file and inserts it into
the Roomfinder database. In addition, each data set has to be enriched with the geographic coordinates
of the room (referenced by the access point name), which is the best estimate of the transmitter
location.
4.2.4 Roomfinder Database
For organizing data created on the server or client side, a central data storage is needed.
A MySQL 5.515
database is set up on an Ubuntu 10.04 LTS16
system running on a virtual machine at
Amazon’s Elastic Compute Cloud (EC2)17
. Everything is set up so that the Roomfinder server
(implemented in section 5.1) and only this machine can access this database.
In this database everything that has to do with user data (like last known positions of users), the
graffiti-like notes and the connected friends to a user are stored. The wireless access point data
described in the last chapter is also part of this data collection.
The Roomfinder server, which has read and write access to this database connects to it via JDBC
interface.
15
open source relational database management system 16
computer operating system based on the Debian Linux distribution 17
cloud computing platform, part of the Amazon Web Services (AWS)

Chapter 4: Software Design and Concept - Technical Decisions 37
4.3 Technical Decisions
One of the main parts of the software design is technical decisions that lead to the system environment
for the application prototype. The platform on which this prototype will be implemented as well as the
interface to the ArcGIS server has to be evaluated.
4.3.1 Operating System
Currently there is a large variety of operating systems for smartphones. However two systems cover
almost 80% of the entire market as shown in Table 4-6. On the one hand there is Google’s operating
system Android. And on the other hand iOS developed and distributed by Apple Inc. Comparing the
market share in 1Q11 to the share in 1Q12 verifies that those two operating systems are the most
important platforms for smartphones at the moment. The next operating system Symbian constantly
lost big shares in the last couple of years and thus will not be a platform that would make sense to
create the prototype for. The only other operating system at this moment that has over 5% market
share is the BlackBerry OS developed by RIM18
. Given the fact that the target group of this platform
is business users it also does not fit this project.
Operating
System
1Q12
1Q12 Market
Share (%)
1Q11
1Q11 Market
Share (%)
Units Units
Android 81,067.40 56.1 36,350.10 36.4
iOS 33,120.50 22.9 16,883.20 16.9
Symbian 12,466.90 8.6 27,598.50 27.7
RIM 9,939.30 6.9 13,004.00 13
Bada 3,842.20 2.7 1,862.20 1.9
Microsoft 2,712.50 1.9 2,582.10 2.6
Others 1,242.90 0.9 1,495.00 1.5
Total 144,391.70 100 99,775.00 100
To narrow the two choices - Android and iOS - down to one for the application prototype other
aspects have to be evaluated.
18
Research in Motion
Table 4-6 - Worldwide Smartphone Sales to End Users in 1Q12 (Thousands of Units) [12]

Chapter 4: Software Design and Concept - Technical Decisions 38
Given the fact that there are native ArcGIS APIs for both platforms, this is not an elimination
criterion.
The trilateration algorithm described in section 4.1.3 needs the signal strength and the MAC address
of nearby wireless network access points.
In the current release of iOS19
there is no method to access this kind of information. The CoreWLAN
framework that is used for retrieving this data on Mac OS X is not available as a public API for iOS.
The only wireless network information that is available via a public API is the SSID of the nearby
networks. Since the SSID at the campus of the University of Calgary is the same for each access point
managed by the IT department no location estimate can result from this information.
Contrary to iOS, it is possible to access more specific wireless network information on Android. The
class WifiManager, which is available since API Level 1, is able to retrieve information of the
nearby Wi-Fi networks. Via the API call getScanResults() a list of the entire reachable wireless
networks is returned. [13]
Each dataset of this list contains the SSID as well as the BSSID, the frequency in MHz and the
received power level in dBm. [14]
Given the fact that it is not possible to access wireless network data on the iOS platform, and for this
reason no indoor location can be estimated, Android will be the target platform for the application
prototype.
4.3.2 ArcGIS Interface
There are two ways in which an ArcGIS server can be accessed from an Android device.
The first method is the ArcGIS JavaScript API. It is possible to create an HTML page and display
maps via this API on it. With JQTouch20
and dojox.mobile21
there are different frameworks which
provide lightweight widgets optimized for mobile devices. CSS22
can be used to easily give the
mobile application a native look and feel. The resulting JavaScript enriched HTML page can be
displayed in the Android application via a WebView23
.
19
iOS 5.1.1 Build 9B208 (May 7, 2012) 20
JQuery based framework for optimized controls of web pages on mobile devices [21] 21
CSS3 based framework for optimized controls of web pages on mobile devices [22] 22
Cascading Style Sheets, a style sheet language used for formatting documents written in a markup language 23
a view that displays web pages in an Android Activity [30]

Chapter 4: Software Design and Concept - Technical Decisions 39
The big benefit of this technique is that it is platform independent. It almost needs no effort to include
the HTML page with a UIWebview24
into an iOS application or a WebBrowser25
control on a
Windows Phone device.
The downside of using the JavaScript API is that even though there is a compact build26
of the API
the user experience is limited due to latency issues. Scrolling a map view on a mobile device with this
API is slow and it takes quite a long time to render new parts of the map. In addition to the latency
issue there is no “pinch”-gesture27
available to zoom the map, which reduces the user experience
further.
The other approach to display ArcGIS server data can be achieved by using the native ArcGIS API for
Android. This API includes methods to display maps, query information from the server and offers
the ability to modify the view of the map by drawing graphics and shapes on it.
Compared to the JavaScript API the performance is considerably better. It has multi touch support as
well as a good caching mechanism. Each native client API provided by Esri is designed to have a
similar structure. That decreases the effort to port an application to other mobile platforms at a later
date.
After comparing prototypes for both APIs the conclusion is that the far better user experience of the
native Android API outweighs the bigger effort to port an application written with the native API to
other operating systems.
24
alternative to WebView on iOS 25
alternative to WebView on Windows Phone 26
an API build that is designed for slower internet connections and network latency issues [24] 27
multi touch gesture for zooming on a touchscreen device (more details see chapter 5.2.2)

Chapter 4: Software Design and Concept - System Architecture 40
4.4 System Architecture
To sum up the technical decisions made in this chapter, the resulting system architecture is shown in
Figure 4-8. It gives a quick overview of all components of the system environment and shows how
they interact with each other. Arrows indicate the communication direction. Labels on the arrows
represent the interface between both nodes.
Figure 4-8 - System Architecture
The LDAP directory of the University of Calgary is an open directory, which provides any kind of
address information regarding university staff (e.g. name, telephone numbers and offices). It is
accessed by the Roomfinder server via JNDI.
The Roomfinder database is the main data source of the Roomfinder server. It stores data that cannot
be accessed through the ArcGIS server like the Augmented Reality annotations or the Wi-Fi access
point data. It is accessed by the server via JDBC.
The Roomfinder server is the central information source for the clients. It provides different REST
interfaces (e.g. search for university staff, get specific augmented reality marker) for the clients. It
connects to the ArcGIS server via SOAP web service to get routing data. The server processes this
route (segmentation and refining) and provides the result as a REST method to the client. This server
also handles the computation of the indoor location based on the Wi-Fi signal strength.
Chapter 4: Software Design and Concept - System Architecture 41
As described in the introduction chapter, the system should be easy portable to other platforms. If the
iOS platform at some point offers an interface which provides more detailed information on the
nearby wireless networks, it could be considered to port the application to this platform. ArcGIS also
offers an API for the Windows Phone platform, so it would be a possible target platform, too.
For making the clients in this system as interchangeable as possible, all computations and business
logic should be placed on a central server.
The ArcGIS server handles everything that has to do with maps and the underlying geospatial data. It
provides the building maps, the floor maps as well as an aerial picture of the campus. Besides map
data the server is responsible for the path finding on campus. Therefore, it can access a network
dataset which contains every path on campus.
Clients in this system are smartphones. They consume the information of the servers and display it to
the end user.

Chapter 5: Implementation - Server Side Implementation 42
5 Implementation
After design and concept of the application have been developed in the last two chapters, this chapter
will show the main steps to realize it. This chapter is divided into two parts. The first part describes
the server side implementation, followed by the description of the client side implementation for the
Android platform.
Used techniques are described, as well as how they interact with each other. To show results,
screenshots of the prototype are shown.
5.1 Server Side Implementation
The Roomfinder server acts as the central part of the system. As mentioned in chapter 4.4, the server
connects to different data sources, processes the data and exposes the data through a RESTful web
service for the smartphone clients.
The application server is based on the Java platform. It uses an Apache Tomcat server as a servlet
container.
5.1.1 Data Sources
In this chapter the basic approach of accessing data sources is described.
Design Pattern - Data Access Objects
Given the fact that several data sources are used in this project a structured way to access them is
necessary. As mentioned in section 4.2.1, the contact database (currently the public LDAP directory)
is restructured and access to it can change within the next year. For that reason the access to the data
sources should be encapsulated so that it can be replaced easily.
To fulfill these requirements the Data Access Objects (DAO) design pattern is used. A DAO provides
an abstract interface for creating, updating and getting information for specific objects without
exposing details of the underlying data source. For each entity in the system (e.g. buildings, AR
marker, users) one DAO is created which handles the communication with its data source. The basic
structure of the DAO pattern is shown in Figure 5-1.

Chapter 5: Implementation - Server Side Implementation 43
Business objects create DAOs and use them to get information about specific objects. The DAO
handles the communication to the data source and stores the queried data in a data transfer object
(DTO) which is given back to the business object.
Considering that DAOs encapsulate the data source, the data source can be exchanged very easily by
just implementing a new data access object. The DTO stays the same and in the business object only
the type of DAO has to be changed.
Figure 5-1 - Class Diagram of the DAO pattern [15]
Figure 5-2 - Sequence diagram of DAO pattern [15]

Chapter 5: Implementation - Server Side Implementation 44
Roomfinder Database
In order to connect to the Roomfinder database the Java Database Connectivity (JDBC) is used. It is
the common way to create a connection to a relational database using the Java programming
language.
To retrieve a connection to the database the JDBC driver for MySQL has to be loaded. Loading the
driver with the method Class.forName("com.mysql.jdbc.Driver") instantiates the driver and
registers it to the DriverManager. From there on a connection can be obtained through the
DriverManager by calling the method getConnection(String connectionString). The
connection string is specific for each database vendor. For MySQL it has the form:
"jdbc:mysql://<DB_URL>:<PORT>/<DB_NAME>?user=<USER>&password=<PASSWORD>"
([18], page 1188f)
PreparedStatements are used for querying the database. A PreparedStatement is a
precompiled SQL statement that has a question mark for each variable (see line 4 in Figure 5-3). It is
very efficient if executed multiple times. Another benefit of this type of statement is that it is
protected against SQL injections.
DAOs and DTOs are created for each table of the database which represents an object.
CSV Files with Information about the Wi-Fi Infrastructure
To access the data in the CSV files they have to be transferred into the database. A Java program is
developed, which reads the data of the file through a file stream.
First it checks whether the dataset is already in the Roomfinder database. Based on this result, it
inserts the new dataset or updates the corresponding dataset which is already in the database. In a
second step the location of each Wi-Fi access point is queried from the ArcGIS server and added to
the dataset in the database.
Figure 5-3 - Code - PreparedStatement

Chapter 5: Implementation - Server Side Implementation 45
LDAP Directory of the University of Calgary
In order to access the LDAP directory of the University of Calgary the Java Naming and Directory
Interface (JNDI) is used. It is an API for Java that offers developers to discover directories and look
up entries in different directory systems.
The JNDI API uses contexts to specify where to look for entries. The initial context for the public
LDAP directory of the University of Calgary is obtained with the following source code:
After defining the context, search parameters have to be specified and passed to the method
DirContext.search(Name name, Attributes matchAttribs). This method searches on a
single context for objects that contain the specified attributes. It returns them as a
NamingEnumeration which can be iterated and transferred into a DTO. In the end the DTO is
forwarded to the business object by the DAO.
Esri ArcGIS Server
There are two different types of information which have to be accessed on the GIS server by the
Roomfinder server. Basic room and building information is provided by the map server and path
finding information by the network analyst module of the GIS server.
The REST interface is used for querying data from the ArcGIS map server. To use this interface a
URL has to be constructed. The basic format of a REST URL is “http://<resource-
url>?<parameter1=value1>&<parameter2=value2>“, where <resource-url> is the destination
of the queried layer on the map server. The question mark denotes the beginning of the parameter list
and <parameter1=value1> is a key-value pair to define parameters.
Figure 5-4 - Code - Initial context LDAP

Chapter 5: Implementation - Server Side Implementation 46
In order to specify the response of the server several search parameters have to be specified. The
parameter outSR defines the spatial reference system28
of the result and should match the spatial
reference on the clients map.
To limit results returned by the server a where parameter can be set. Any legal SQL “where clause”
operating on the fields in the layer is allowed. An example “where clause”, which queries rooms in
the ICT building starting with “5” would be “where=Building_Room.BLD_ID='ICT' AND
Building_Room.RM_ID like '5%’”.
Furthermore, it is possible to apply a spatial filter to define a specific search extent. Only results
within this search extent are returned by the server. The format of the response is set with parameter f.
The formats provided by the ArcGIS server are HTML29
, JSON, KML30
or AMF31
. An example of a
REST URL and the corresponding JSON result can be found in the appendix.
Since the REST interface in the current release of the ArcGIS server is not able to provide results with
three dimensional coordinates, routing has to be done via the SOAP interface.
To connect to the SOAP service it is necessary to add the arcgis_agsws_stubs.jar of the
ArcGIS Web Application Developer Framework (Web ADF) to the Java project. It contains pre-
generated SOAP proxies for each module of the ArcGIS server. SOAP proxies handle the
communication with the web service over HTTP. The proxy class in case of the network analyst
module is named NAServerBindingStub. [16]
To initialize this class the URL of the XML file containing the Web Services Description Language
(WSDL) has to be specified. The WSDL describes in a hierarchical structure the functionality of the
web service and how services can be called on it.
Routing parameters are set to an NAServerRouteParams object which is passed to the solve()
method of the NAServerBindingStub instance. It returns an object representing a route. It contains
three dimensional points defining the path and basic information of the route like length and estimated
time.
28
a spatial reference system is a specific coordinate system to describe geographical entities 29
HyperText Markup Language, main markup language for displaying web pages 30
Keyhole Markup Language, XML notation for expressing geographic features 31
Action Message Format, a binary format to serialize objects
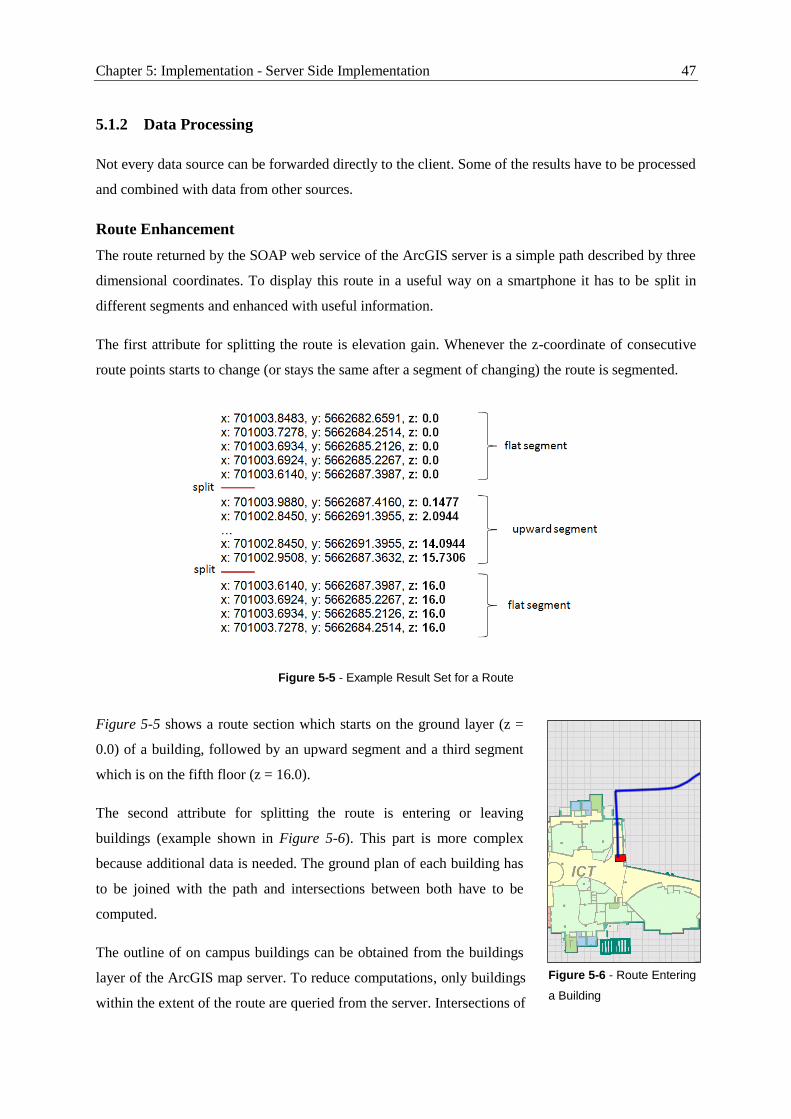
Chapter 5: Implementation - Server Side Implementation 47
5.1.2 Data Processing
Not every data source can be forwarded directly to the client. Some of the results have to be processed
and combined with data from other sources.
Route Enhancement
The route returned by the SOAP web service of the ArcGIS server is a simple path described by three
dimensional coordinates. To display this route in a useful way on a smartphone it has to be split in
different segments and enhanced with useful information.
The first attribute for splitting the route is elevation gain. Whenever the z-coordinate of consecutive
route points starts to change (or stays the same after a segment of changing) the route is segmented.
Figure 5-5 shows a route section which starts on the ground layer (z =
0.0) of a building, followed by an upward segment and a third segment
which is on the fifth floor (z = 16.0).
The second attribute for splitting the route is entering or leaving
buildings (example shown in Figure 5-6). This part is more complex
because additional data is needed. The ground plan of each building has
to be joined with the path and intersections between both have to be
computed.
The outline of on campus buildings can be obtained from the buildings
layer of the ArcGIS map server. To reduce computations, only buildings
within the extent of the route are queried from the server. Intersections of
Figure 5-5 - Example Result Set for a Route
Figure 5-6 - Route Entering
a Building

Chapter 5: Implementation - Server Side Implementation 48
buildings and the route are determined using the GeometryEngine provided by the ArcGIS API. The
method crosses() takes two geometries as parameters and returns a Boolean value which indicates
if both geometries intersect in at least one point.
Given the fact that the underlying network dataset is not entirely correct
and the path finding algorithm of the network analyst module does not
always produce the best route, further enhancements have to be made.
In some cases the routing algorithm suggests to switch elevators (see
Figure 5-7) on a floor in between the start floor and the destination floor
instead of taking the elevator directly to the destination floor. For this
case an algorithm that observes the elevator usage is created. If the
suggested route uses more than one elevator within a certain distance the
different routing segments are merged to one segment so that the user
does not get confused.
Room and Building Search
As mentioned in section 3.1.2, the search for places on campus should be as easy as possible. The
result should contain information regarding university staff stored in the LDAP directory of the
University of Calgary as well as geographical data of their offices.
Lecture halls as well as other rooms without reference in the LDAP directory should also be returned
by the search.
Figure 5-8 - Information flow of a search query
Figure 5-7 - Route
changing Elevator on
third Floor

Chapter 5: Implementation - Server Side Implementation 49
If the data warehouse of the University of Calgary offers public access to its data, lecture data (e.g.
name of the lecture, start time) could also be integrated into the search result.
5.1.3 Web Services
To communicate with clients the server exposes different REST web services. These interfaces can be
used by the client to either send or retrieve data. JSON is used for the data interchange between server
and client.
JavaScript Object Notation
As an exchange format to communicate between server and client JSON is used. It is a structured way
to store data in a text based format. The media type of JSON is application/json and is the only return
type the Roomfinder server produces.
To transform Java objects into a JSON format and vice-versa the GSON32
library developed by
Google is used. It offers serialization and deserialization of basic JSON and Java objects. It can be
extended with custom classes for handling the serialization (or deserialization) of more complex
objects used in the project. This is achieved by implementing the JsonSerializer (or the
JsonDeserializer) interface.
Given that the embedded augmented reality framework Mixare (see section 5.2.3) needs a specific
JSON format, the option for custom serialization is very helpful.
REST Interfaces
JAX-RS33
is an API for creating RESTful web services. To simplify development of web services the
API uses annotations like:
@Path: relative path for a resource
@GET, @PUT, @POST, @DELETE, @HEAD: request type
@Produces: response media type
With annotations such as @PathParam or @QueryParam, POST and GET parameter can be passed to
a Java method. Based on these parameters and the resource path the server gathers the requested
information from one or more data sources and returns the result in JSON back to the client.
32
GSON V2.2.1 [20] 33
Java SE API, introduced in Java SE 5

Chapter 5: Implementation - Server Side Implementation 50
To implement functionality for these REST web services a method is created and described with the
mentioned annotations. For example, the source code for the REST service that returns a single
annotation by its ID is shown in Figure 5-9.
The request type of the interface is set with the @GET annotation. After that the definition of the
returned media type is set to JSON, followed by the resource path for this web service. With
@PathParam("annotationId") the URL parameter is set to a Java method parameter. Inside this
method, the annotation DAO handles the retrieval of the requested object, which is then transformed
into JSON format and returned to the client.
A list of exposed REST interfaces:
/contacts/<search_string>
returns contacts considering search parameters in the search string
/route/<routing_parameter>
returns a route describing the path to the specified destination
/location/<wireless_network_information>
returns an estimated indoor position based on Wi-Fi data
/annotation/id/<ID_of_annotation>
returns a single annotation
/annotation/cat/<category_of_annotation>
returns multiple annotations of specific categories (e.g. building annotations, room
annotations, position of friends)
/annotation/navigation
returns annotations used for the augmented reality navigation mode
Figure 5-9 - Code - Example of REST Service

Chapter 5: Implementation - Client Side Implementation 51
5.2 Client Side Implementation
The fundamental steps of creating the client application are described in this chapter. As mentioned in
section 4.3.1 the prototype is based on the Android platform.
5.2.1 Location Handling
In case of this application where both main features are location based, the handling of these locations
plays a big role.
Outdoor Location Tracking
The Android API has three location providers which are directly built-in.
To use them, the application has to take reference of the LocationManager class by calling
getSystemService(Context.LOCATION_SERVICE). This location manager is used for
requesting location updates from the following three providers:
GPS_PROVIDER
This location provider determines the location using satellites. It needs a line of sight to the
satellites and thus only works outdoors. Depending on the amount of satellites in the field of
vision of the device, the accuracy differs. For the first location fix it can take up to 60
seconds.
NETWORK_PROVIDER
The network location provider is based on cell towers and Wi-Fi access points. It is less
accurate than the GPS provider (100-500m).
PASSIVE_PROVIDER
The passive provider is a special location provider. It returns stored values generated by the
other location providers.
For the outdoor location tracking in this project the GPS location provider is used. It is more accurate
than the provider based on cell towers.
To receive certain callbacks from this location provider, it is necessary to create a location handler by
implementing the LocationHandler interface and registering it by calling the
requestLocationUpdates() method on the location manager.

Chapter 5: Implementation - Client Side Implementation 52
The permission ACCESS_FINE_LOCATION has to be added to the AndroidManifest.xml34
in order to
receive callbacks from the GPS location provider.
Indoor Location Tracking
To determine indoor positions a custom location provider has to be implemented.
As mentioned in section 4.1 the sources of an indoor location estimate are the received wireless
network signals (RSSI approach). By referencing the WifiManager object using the
getSystemService() call, similar to LocationManager described in the last chapter, the
application gets access to different Wi-Fi services. To receive information about the wireless
networks which are in range of the smartphone the BroadcastReceiver interface has to be
implemented and registered via the WifiManager.
A background thread is set up to query the necessary wireless network data in continuous intervals.
The method WifiManager.startScan() is called on the thread, which invokes the onReceive()
method implemented by the custom BroadcastReceiver class. This event triggers the computation
of the indoor position estimate using the FSPL equation and the trilateration algorithm described in
section 4.1.3 and section 4.1.4.
To receive Wi-Fi data CHANGE_WIFI_STATE and CHANGE_WIFI_STATE permissions have to be
added to the AndroidManifest.xml.
Handling location data
Another background thread is set up for updating the map based on the current location. This thread
draws a point on the map representing the estimated position of the user.
The standard source of the user’s position is the GPS location provider. If the GPS accuracy falls
under 20m it is assumed that the user is inside a building. In this case the Wi-Fi based position
estimate is shown on the map. To indicate the less accurate position a Wi-Fi symbol is shown on the
screen.
Furthermore, the thread changes the displayed floor map according to the z-coordinate of the user’s
position.
34
XML file for basic application settings used by the Android platform

Chapter 5: Implementation - Client Side Implementation 53
5.2.2 ArcGIS Integration
For adding ArcGIS capabilities to the application the ArcGIS SDK for Android35
is used.
One of the basic functions of this SDK is adding maps to an Android application via the MapView
class. Different layers (listed in section 4.2.2) are added to this view (see Figure 5-10).
The floor layer, which is initialized in line 4 of Figure 5-10, contains maps for floors in each building
on campus. Based on the user’s position the floor map is switched during runtime so that it always
presents the floor on which the user walks.
The view allows the user to zoom in on the map using pinch (Figure 5-11 a)) and spread (Figure 5-11
b)) gestures. To change the map extent a scroll (Figure 5-11 c)) gesture is used.
Via a GraphicsLayer (line 13 of Figure 5-10) shapes can be drawn on the map. This is used for
displaying the route on the screen.
For querying information from the ArcGIS server (e.g. room coordinates) the API provides different
types of tasks. Similar to the REST interface several parameters can be set for these tasks, making it
35
ArcGIS SDK V 1.0 (released in December 2011)
Figure 5-10 - Code - Initialize MapView
Figure 5-11 - Multi-touch Gestures: a) Pinch, b) Spread, c) Scroll [17]

Chapter 5: Implementation - Client Side Implementation 54
very powerful to specify the search result. To detach these queries from the UI thread they are run in
an AsyncTask (described in section 5.2.4).
5.2.3 AR Integration
A fundamental goal of this project was to integrate augmented reality into the application. As
described in section 2.3 this technique is quite new and therefore poses a big challenge.
Augmented Reality on Android
The concept of this technique is to augment the live data of the smartphone with additional meta data.
Accessing the live data of the smartphone is quite easy. The Android SDK offers a camera API that
can be accessed by the package android.hardware.Camera and the determination of the location
of the device is described in section 5.2.1. To compute the orientation of the device, access to the
following sensors is offered via the android.hardware.SensorManager class:
Sensor.TYPE_MAGNETIC_FIELD
Sensor.TYPE_ACCELEROMETER
Sensor.TYPE_ROTATION_VECTOR
The difficult part of the augmented reality technique is to combine those different parts of the
smartphone live data and compute the position of the meta data in a way that it overlaps with the real
world entities seen in the camera feed.
Mixare - An Augmented Reality Browser
To display information in the correct position of the camera feed the open source augmented reality
engine Mixare36
is embedded into the client application. Mixare is mainly developed by Daniele
Gobbetti and published under the GPLv3. [20] As described on the Mixare project page there are four
ways to use this augmented reality browser:
1. Mixare as an autonomous application37
(displaying predefined data sources such as
Wikipedia, Twitter or OpenStreetMap)
2. launching the Mixare application by a link on an HTML page (whereby the data source is
transferred to the application)
3. launching Mixare application from a custom Android application and passing a data source to
it
4. direct integration into a custom Android application [18]
36
Mixare V 0.8 (released in April 2012), Mixare stands for mix Augmented Reality Engine [20] 37
available on Google Play and Apple App Store

Chapter 5: Implementation - Client Side Implementation 55
Considering that the Mixare framework does not cover the requirements for this project in regard to
showing different markers on the screen, the fourth option, which offers the possibility to extend this
engine in every way, is used.
Integration and Enhancement of Mixare
The source code can be accessed via Github [19] and is integrated into the Roomfinder application as
an Android library project.
The main feature of the Mixare library is the class, which displays augmented reality information on
the screen. To start this Activity38 an Intent39 has to be sent to the Android system. Activities
can be registered to certain Intents in the AndroidManifest.xml so if the system gets a request for a
specific Intent the defined Activity will be initialized.
The entry point of the augmented reality browser in this framework is the org.mixare.MixView
class. It can be started by creating a new Intent and passing a URL to it. This URL has to point to a
resource which contains data in a Mixare specific JSON format. The format looks like:
38
an application component in Android which represents a single screen (further description in chapter 5.2.5) 39
a certain operation screen (further description in chapter 5.2.5)
Figure 5-12 - Mixare JSON Format

Chapter 5: Implementation - Client Side Implementation 56
The Mixare API only supports one single data source calling it by Intents. For this project the
functionality of supporting multiple data sources is added to this API. An option menu40
is added to
handle switching between these data sources.
As a further enhancement to the API, different augmented reality markers were added. Each created
marker represents a single data source. To help the user differentiate between different data sources,
each marker has a different design (see figures in chapter 5.2.5).
5.2.4 Multithreading
The GUI framework in Android is like most of the modern GUI frameworks single threaded. Given
this fact, each long-running process, such as queries on the ArcGIS server or web service calls, should
run in separate threads.
Otherwise, the UI cannot update the Activities or respond to user inputs. Different methods of
multi-threading are provided by the Android API.
AsyncTask
One way to detach a long-running task from the UI thread is to use the android.os.AsyncTask. It
is mainly used for querying any kind of information from a remote data source. The skeleton of the
implementation for the ArcGIS server query is shown in Figure 5-13.
40
a menu which appears by pressing the menu button on an Android device (further description in chapter 5.2.5)
Figure 5-13 - Code - AsyncTask Skeleton

Chapter 5: Implementation - Client Side Implementation 57
The first called method is onPreExecute(). Basic initialization is handled in this method. In case of
the server query in this project, the background animation (a simple loading animation) is installed. It
runs on the UI thread.
The method doInBackground(String...) runs in a new thread. In this method the actual work is
done. A query of the type com.esri.core.tasks.ags.query.Query is instantiated and specified
with the parameters passed to the method via arguments.
When the task created in the doInBackground(String...) method finishes, the
onPostExecute(FeatureSet) method is invoked. The background thread gets deleted and the
result of the computation is passed to this method as an argument. This method runs on the UI thread
again. ([23], page 143f)
Threads
Whereas an AsyncTask is used for single queries, java.lang.Thread is used for continuous tasks
in the application. Tasks like drawing the current coordinate on the map view or switching the
displayed floor map according to the current position have to run the entire time the map view is
active.
One way to create a thread in Java is to implement the Runnable interface (see Figure 5-14).
The interface Runnable only contains the method run() which is called by starting the thread. In
this method a loop can be created in which the required functionality is executed.
Figure 5-14 - Code - Thread Example

Chapter 5: Implementation - Client Side Implementation 58
5.2.5 Graphical User Interface
This section explains the basic approach of implementing user interfaces on the Android platform and
shows some of the major interfaces created in this project.
Implementing GUIs on Android
The basic element of a user interface on Android is the Activity class. It takes up the entire area of
the display. Typically each Activity represents one screen.
Internally Activities are stored on a stack. Whenever a new Activity is created it gets pushed on
top of the stack. The back button on Android devices pops the top Activity off the stack and
resumes the previous one.
To create a new Activity for the map screen, a class has to be implemented which extends
Activity (see Figure 5-15).
The basic user interface components like text fields, buttons or images are subclasses of View. Views
occupy a rectangle area on the screen and are responsible for drawing themselves and event handling.
The Activity created in Figure 5-15 comes without any interface components. In order to add
Views to an Activity a layout XML file is created. For each View a specific XML tag is added to
the XML structure. XML attributes define the behavior (e.g. position, color, visibility) of those
components. XML tags can be arranged in view containers such as LinearLayouts for single row or
single column presentation or TableLayouts for a table structure.
The basic XML layout of the MapActivity used in the application is shown in Figure 5-16.
Figure 5-15 - Code - MapActivity
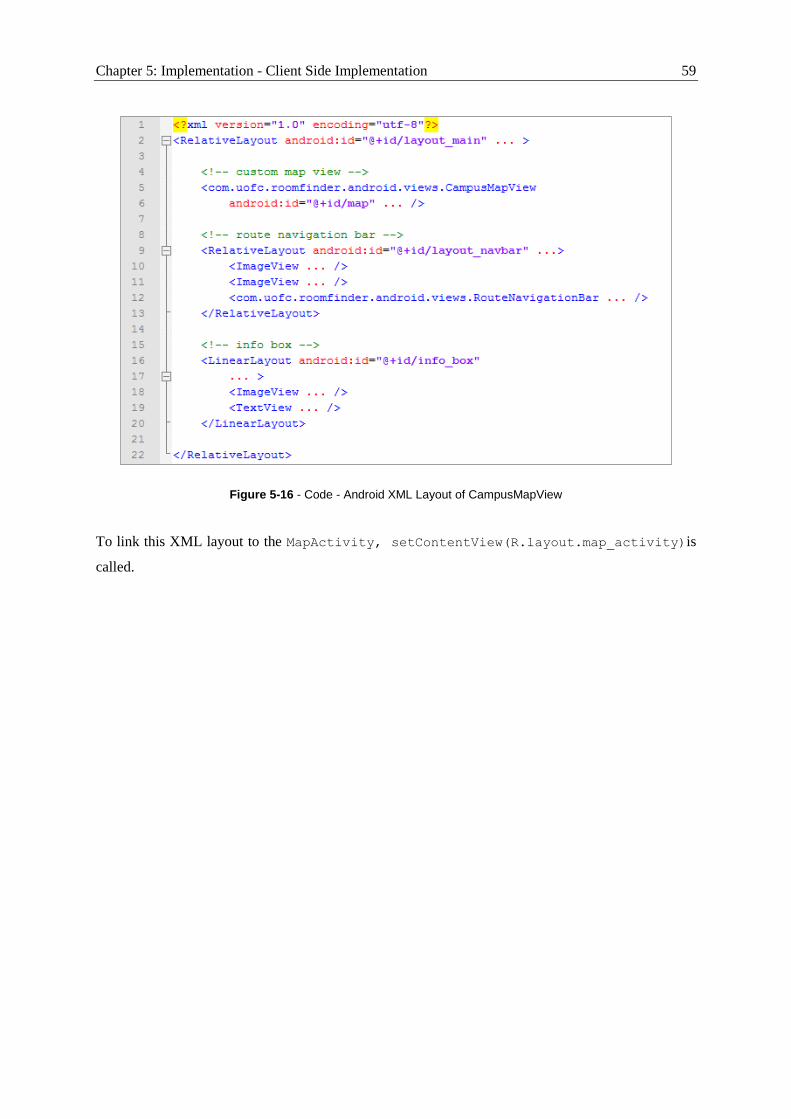
Chapter 5: Implementation - Client Side Implementation 59
To link this XML layout to the MapActivity, setContentView(R.layout.map_activity)is
called.
Figure 5-16 - Code - Android XML Layout of CampusMapView

Chapter 5: Implementation - Client Side Implementation 60
Main Menu
The main menu shown in Figure 5-17 is the entry point of this application. It offers four self-
explanatory options to the user.
Figure 5-17 - Main Menu

Chapter 5: Implementation - Client Side Implementation 61
Search Form
This search form can be accessed by a click on the two first menu items of the main menu (see Figure
5-17) or the corresponding items in the options menu of the MapActivity (see Figure 5-20 a)).
As suggested in the user interaction chapter the search form only contains one input field for the
search request (see Figure 5-18 a)). For navigation purposes a drop down box (named Spinner on
the Android platform) with the following three routing options is added:
Shortest Path (default)
Prefer Indoor
Prefer Outdoor
With the standard Android keyboard the user can specify his search criteria and with a tap on the
“Search” button he submits his query.
If the search query returns exactly one result, the user gets forwarded to the map screen to display the
result on there. If there is more than one result he gets those displayed on a list screen (see Figure
5-18 b)). In the case of no match, the search form stays present and displays a message telling the user
that his search was not successful.
Figure 5-18 - a) Search Form, b) Search Results

Chapter 5: Implementation - Client Side Implementation 62
Map View
The main Activity of this application is the MapActivity.
It displays the campus map of the University of Calgary (see Figure 5-19 a)). The user can zoom and
scroll this map with multi touch gestures as mentioned in section 5.2.2. The building map is the basic
layer of this screen. If zoomed in, the floor plans of the buildings (see Figure 5-19 b)Figure 5-20) will
be displayed on top of the building plans.
To interact with this Activity the user can click on the Android menu button. An option menu
appears as seen in Figure 5-20 a). The “Satellite View” menu item exchanges the building and floor
plans with a satellite image of the campus, the “Explore” leads to the augmented reality mode, which
is explained in the following section.
The “Search” item in Figure 5-20 a), as well as the “Search” item in the main menu (see Figure 5-17)
lead to the search form, described in the last section. After submitting the search query the user is
redirected to the map view and gets the searched result highlighted as it is shown in Figure 5-20 b).
Basic information of his result is displayed in an information box (see bottom of Figure 5-20 b)).
Figure 5-19 - a) Map View with Building Plan, b) Map View with Floor Plan

Chapter 5: Implementation - Client Side Implementation 63
With the menu items “Directions to...” and “Quick Routes” the user has access to the navigation
feature of this application. After defining a target with the search form, the route navigation bar (see
top in Figure 5-21 a) and b)) and the information box (see bottom in Figure 5-21 a) and b)) are added
to the MapActivity.
Figure 5-20 - a) Map view with option menu, b) Map view with search result
Figure 5-21 - a) Navigation View 1st Segment, b) Navigation View 2nd Segment

Chapter 5: Implementation - Client Side Implementation 64
The route navigation bar gives the user an overview of his route. It contains rectangles representing
sections of his path to his destination. By clicking on them, the user can change the active segment,
which is shown by a blue line on the campus map. The info box describes in a short text what the
destination of the active segment is.The blue dot in Figure 5-21 a) indicates the current location of the
user.
Augmented Reality View
Figure 5-22 a) displays the standard view for augmented reality information. The text in the rectangle
box describes the object which is represented by the marker. In this figure the nearby buildings are
shown.
To change the displayed data source there is an options menu integrated in this Activity (see
Figure 5-22 b)).
The “Write something” item on the menu leads to the screen shown in Figure 5-23 a). Users can post
geo-referenced texts on the campus which are displayed as shown in the Figure 5-23 b). To separate
these user created markers from the building markers, they are displayed with different background
colors.
Figure 5-22 - a) AR View with Building Markers, b) AR View with Option Menu
Figure 5-23 - a) AR Text Input, b) AR view With Graffiti Markers

Chapter 5: Implementation - Client Side Implementation 65
Figure 5-24 a) and b) show the augmented reality navigation mode. The left screen has two markers.
The marker with the white border (“Enter KNB (130m)”) shows the next waypoint, the one with red
border (“Olympic Oval (320m)”) shows the destination of the route. The screen of Figure 5-24 b)
shows a compass based arrow pointing to the next waypoint.
When selecting the “Friends” item on the option menu of Figure 5-22 b) the last known position of
the user’s friends is drawn onto the camera feed as it is shown in Figure 5-25.
Figure 5-24 - a) AR View with Waypoints, b) AR View with Arrow Marker
Figure 5-25 - AR View with Friend Markers
Chapter 6: Conclusion - Summary and Evaluation 66
6 Conclusion
In this chapter the results of the thesis are discussed. Problems which occurred during this work and
the limitations that came along with them are listed here. Furthermore, a brief look-out on future work
is given.
6.1 Summary and Evaluation
The goal of this thesis was to create a mobile application which helps people on the campus of the
University of Calgary to orientate themselves and find their destination.
In order to achieve this, a system environment was designed based on the requirements from chapter 1
and the techniques described in chapter 2. Different data sources have been analyzed and integrated
into this system. A server that acts as a central point was implemented so that clients based on
different platforms can access information in an easy way via RESTful web services. Finally, a
prototype for the Android platform was developed which connects to these data sources and supports
users on the campus with routing features and other information.
The source code of this project is released under the GPLv3 and can be accessed via SVN on Google
Code Project Hosting41
.
Roomfinder server: http://code.google.com/p/uofc-roomfinder-server/
Android client: http://code.google.com/p/uofc-roomfinder-android-app/
The strength of this application is the easy to use navigation feature which is able to find paths on
campus to user-defined locations. With the indoor location tracking feature the application always
knows where the user is located and shows him context based information about his environment.
The augmented reality feature is an innovative addition to this application. It invites the user to play
with the application and explore the university campus from another point of view.
A lot of different techniques and data sources were integrated into this application. Although not
every feature could be implemented, the application offers a fully functional routing feature which is
enhanced by augmented reality and an indoor location tracking algorithm.
41
http://code.google.com/hosting/

Chapter 6: Conclusion - Problems 67
6.2 Problems
Several problems came up during this work. They are described in this section.
Indoor Location Tracking
In one of the first project meetings it came up that a group of people at the University of Calgary are
working on an indoor location tracking framework. This framework should be integrated into the
application developed in this project. Unfortunately the framework was not supposed to be finished
before the end of this project. A method for indoor location tracking had to be created from scratch.
The data of the wireless network infrastructure which is needed for the trilateration was the next
obstacle. On a more precise evaluation of the data source, it turned out that there is no useable
location information of the access points in the management system. In addition to that problem the
vendor of the management software does not support any direct connection to the database. The only
way to export data was to create CSV reports which led to the problem that additional effort was
needed to transfer this data into a database. The other downside of not having a direct connection to
the database was that there was no way to access the live power levels of the access points, which
significantly reduced the accuracy of the indoor location tracking.
Integration of Data Sources
The application uses a range of different information sources. To find out where to get this kind of
information from and how it can be accessed was also a time consuming factor.
Meetings with several people from the IT department of the University of Calgary were arranged,
where topics like content of these data sources and access to them were discussed.
ArcGIS SDK for Android
The ArcGIS SDK for Android, which is needed for features that require geospatial information and
show maps, is quite new. It was released in December 2011, so at the beginning of the project it was
not even two months old. Due to this fact, the developer community for this SDK was really small. It
was hard to find useful tutorials and source code examples that demonstrated how to work with this
SDK. The documentation from the vendor Esri is also relatively small and especially when it comes to
more complex components it was nearly impossible to find information about the usage of specific
methods.
Another downside of V1.0 of this SDK was that it did not support the built-in Android emulator. So
before getting an Android smartphone the application could not be tested.

Chapter 6: Conclusion - Problems 68
ArcGIS Server and the Network Analyst Extension
The ArcGIS server and the entire ArcGIS software suite is a complex software package.
Before data could be displayed on the client, different services had to be set up on the server. Settings
had to be adjusted and modules activated. Learning how to set up a map server with a network analyst
module which uses a predefined network data set took a long time.
The integration of server features into the Android application, especially the routing provided by the
network analyst module, caused more problems. The native Android SDK offers no way to directly
access this service and the next preferred way to get information from the server, the REST web
service, was only capable to return two dimensional coordinates, which is not sufficient for indoor
navigation.
In addition to the integration problems of the routing feature it turned out, that the underlying data for
the path finding was not entirely correct and caused inaccurate routes.

Chapter 6: Conclusion - Limitations 69
6.3 Limitations
Based on the problems described in the last chapter and the limited timeframe of this thesis, not every
feature described in the design chapter could be implemented.
Augmented Reality
Although the basic features of the augmented reality part was implemented, a couple of compromises
to the suggestions made in the design chapter had to be made.
Given the fact that the indoor location tracking and most notably the orientation of the device could
not be determined with a suitable accuracy, the displaying of augmented reality markers indoors was
not implemented into the application prototype.
In addition to that, not every part of the information filtering (see section 3.2.2) could be added to the
prototype.
Navigation
Due to the lack of a database containing information about stores and other points of interest at the
moment, it could not be integrated into the search query. A workaround was created where users can
navigate to a limited amount of hard coded POIs via the “quick link” view.
The “silent navigation mode” suggested in the design chapter in section 3.1.2 was not implemented at
all.
Indoor Location Tracking
Considering the inaccurate position of the access points by approximating them over their name
(room number) and the fact that the live outgoing power levels of the Wi-Fi access points could not be
accessed, the accuracy of the indoor location estimate is limited. The ideal value for an accuracy of
less than ten meters could not be achieved.

Chapter 6: Conclusion - Future Work 70
6.4 Future Work
As mentioned in section 6.3, not every feature, described in the design chapter, could be implemented
in the Android prototype.
To give the user the opportunity to find more places on campus, more data sources (e.g. for the food
court and other stores) could be integrated.
Indoor location tracking in the current version of the application is not very accurate. With more exact
information about the location of the access points and a direct access to the database that stores the
Wi-Fi infrastructure details, a more accurate indoor position could be estimated. The current plan of
increasing the access point density on campus would enhance the accuracy even further.
Another huge benefit for the application would be to refine the network dataset for the campus of the
University of Calgary. As described in section 5.2.2 there are several problems with the basic routing
data which led to incorrect routing paths.
Besides eliminating these limitations, new features to help users on campus could be added to this
application. For example people could get access to helpful institutions on campus like the university
library. Students could access information about their loaned books or get notifications if a required
book is available. An integration of the university recreation center could help students to check for
fitness classes or outdoor courses. They would be able to book outdoor equipment or facilities like the
squash court through this mobile application.
Considering that the limitations for accessing wireless network information on the iOS platform will
be removed in future, it would be possible to create a client application for this platform. The
Windows Phone platform, which is increasing in popularity, would also be suitable operating system.
The technology used in smartphones is relatively new and makes great steps forward every year. A
long term perspective, based on more accurate location sensors, could offer users better interaction
with their environment in the augmented reality view. Whereas in the current version of the prototype
users just post comments based on their current position, in later releases with an accurate method to
determine the orientation of the device indoors, users could post comments directly to walls or other
real life objects.

x
References
[1] Esri, "Map projections," [Online]. Available:
http://webhelp.esri.com/arcgisexplorer/900/en/map_projections.htm. [Accessed 29 6 2012].
[2] "Directions Magazine," [Online]. Available: http://apb.directionsmag.com/entry/esri-has-40-of-
gis-marketshare/215188. [Accessed 27 06 2012].
[3] "GPS Theorie 2," [Online]. Available: http://theoxymoron.wordpress.com/category/gps-
geotagging/. [Accessed 27 06 2012].
[4] "Layar," [Online]. Available: http://www.smartphonetracker.co.uk/software-app-
reviews/android-os/android-navigation/342270/layar_reality_browser_review.html. [Accessed
27 06 2012].
[5] "University of Oregon App," [Online]. Available: http://www.uoregon.edu/mobile. [Accessed
27 06 2012].
[6] Google, "Video - Project Glass," [Online]. Available:
https://www.youtube.com/watch?v=9c6W4CCU9M4. [Accessed 27 6 2012].
[7] "Google patents Project Glass," [Online]. Available:
http://pmanewsline.com/2012/05/16/google-patents-project-glass/. [Accessed 3 7 2012].
[8] Engadget, "Google unveills Project Glass," [Online]. Available:
http://www.engadget.com/2012/06/27/google-unveils-project-glass-explorer-edition/.
[Accessed 3 7 2012].
[9] Google, "A new frontier for Google Maps: Mapping the indoor," [Online]. Available:
http://googleblog.blogspot.ca/2011/11/new-frontier-for-google-maps-mapping.html. [Accessed
28 6 2012].
[10] A.-Z. Saunders, Antennas and Propagation for Wireless Communication Systems (2nd
Edition), John Wiley & Sons, 2007.
[11] T. E. Tuncer, Classical and Modern Direction-of-Arrival Estimation, Elsevier, 2009.
[12] University of Calgary, "LDAP directory services," [Online]. Available:

xi
http://www.ucalgary.ca/it/directories/identity/ldap. [Accessed 3 7 2012].
[13] Esri, "ArcGIS for Mobile," [Online]. Available:
http://www.esri.com/software/arcgis/about/mobile-gis-for-you. [Accessed 29 6 2012].
[14] Gartner, "Smartphone Marketshare 2012 Q1," [Online]. Available:
http://www.gartner.com/it/page.jsp?id=2017015. [Accessed 28 6 2012].
[15] Google, "Android API - WifiManager," [Online]. Available:
http://developer.android.com/reference/android/net/wifi/WifiManager.html. [Accessed 3 7
2012].
[16] Google, "Android API - ScanResult," [Online]. Available:
http://developer.android.com/reference/android/net/wifi/ScanResult.html. [Accessed 03 07
2012].
[17] Oracle, "Core J2EE Pattern Catalog - Data Access Objects," [Online]. Available:
http://java.sun.com/blueprints/corej2eepatterns/Patterns/DataAccessObject.html. [Accessed 19
6 2012].
[18] C. Ullenboom, Java ist auch eine Insel, Galileo Press, 2012.
[19] ESRI, "ArcGIS Server SOAP API Overview," ESRI, [Online]. Available:
http://edndoc.esri.com/arcobjects/9.2/Java/java/server/webservices/soap_api/overview.htm.
[Accessed 19 6 2012].
[20] "Multi-touch Gestures," [Online]. Available: http://en.wikipedia.org/wiki/Multi-touch#Multi-
touch_gestures. [Accessed 3 7 2012].
[21] "Homepage of the Mixare Project," [Online]. Available: http://www.mixare.org/. [Accessed 20
6 2012].
[22] "Mixare Usage," [Online]. Available: http://www.mixare.org/usage/. [Accessed 20 6 2012].
[23] "Mixare on Github," [Online]. Available: https://github.com/mixare/mixare. [Accessed 20 5
2012].
[24] L. D. Zigurd Mednieks, Programming Android, O'Reilly, 2011.

xii
[25] "Java GSON library," Google, [Online]. Available: http://code.google.com/p/google-gson/.
[Accessed 20 6 2012].
[26] "JQTouch," [Online]. Available: http://www.jqtouch.com/. [Accessed 3 7 2012].
[27] "Dojo - dojox.mobile," [Online]. Available:
http://dojotoolkit.org/documentation/tutorials/1.6/mobile/tweetview/getting_started/. [Accessed
3 7 2012].
[28] Esri, "ArcGIS API for Javascript - Compact Build," [Online]. Available:
http://help.arcgis.com/EN/webapi/javascript/arcgis/help/jshelp_start.htm#jshelp/inside_compac
tbuild.htm. [Accessed 3 7 2012].
[29] C. Balanis, Antenna Theory - Analysis and Design (3rd Edition), John Wiley & Sons, 2005.
[30] Google, "Android API - WebView," [Online]. Available:
http://developer.android.com/reference/android/webkit/WebView.html. [Accessed 3 7 2012].

xiii
Example of a REST Map Server Query
URL of a sample REST query:
http://136.159.24.32/ArcGIS/rest/services/Rooms/Rooms/MapServer/111/query?
text=&geometry=&geometryType=esriGeometryPoint&inSR=&spatialRel=esriSpatial
RelIntersects&relationParam=&objectIds=
&where=SDE.DBO.Building_Room.RM_ID%3D%27550%27+AND+SDE.DBO.Building_Room.BL
D_ID%3D%27ICT%27
&time=&returnCountOnly=false&returnIdsOnly=false&returnGeometry=true&maxAll
owableOffset=
&outSR=4326
&outFields=SDE.DBO.Building_Room.RM_ID%2C+SDE.DBO.Building_Room.FLR_ID%2C+S
DE.DBO.Building_Room.BLD_ID
&f=pjson
The result in JSON format:
{
"displayFieldName" : "SDE.DBO.Room_Info.RM_NAME",
"fieldAliases" : {
"SDE.DBO.Building_Room.RM_ID" : "Room_ID",
"SDE.DBO.Building_Room.FLR_ID" : "Floor ID",
"SDE.DBO.Building_Room.BLD_ID" : "Building ID"
},
"geometryType" : "esriGeometryPolygon",
"spatialReference" : {
"wkid" : 4326
},
"fields" : [
{
"name" : "SDE.DBO.Building_Room.RM_ID",
"type" : "esriFieldTypeString",
"alias" : "Room_ID",
"length" : 8
},
{
"name" : "SDE.DBO.Building_Room.FLR_ID",
"type" : "esriFieldTypeString",
"alias" : "Floor ID",
"length" : 16
},
{
"name" : "SDE.DBO.Building_Room.BLD_ID",
"type" : "esriFieldTypeString",
"alias" : "Building ID",
"length" : 25
}
],
"features" : [
{
"attributes" : {
"SDE.DBO.Building_Room.RM_ID" : "550",
"SDE.DBO.Building_Room.FLR_ID" : "05",
"SDE.DBO.Building_Room.BLD_ID" : "ICT"
},
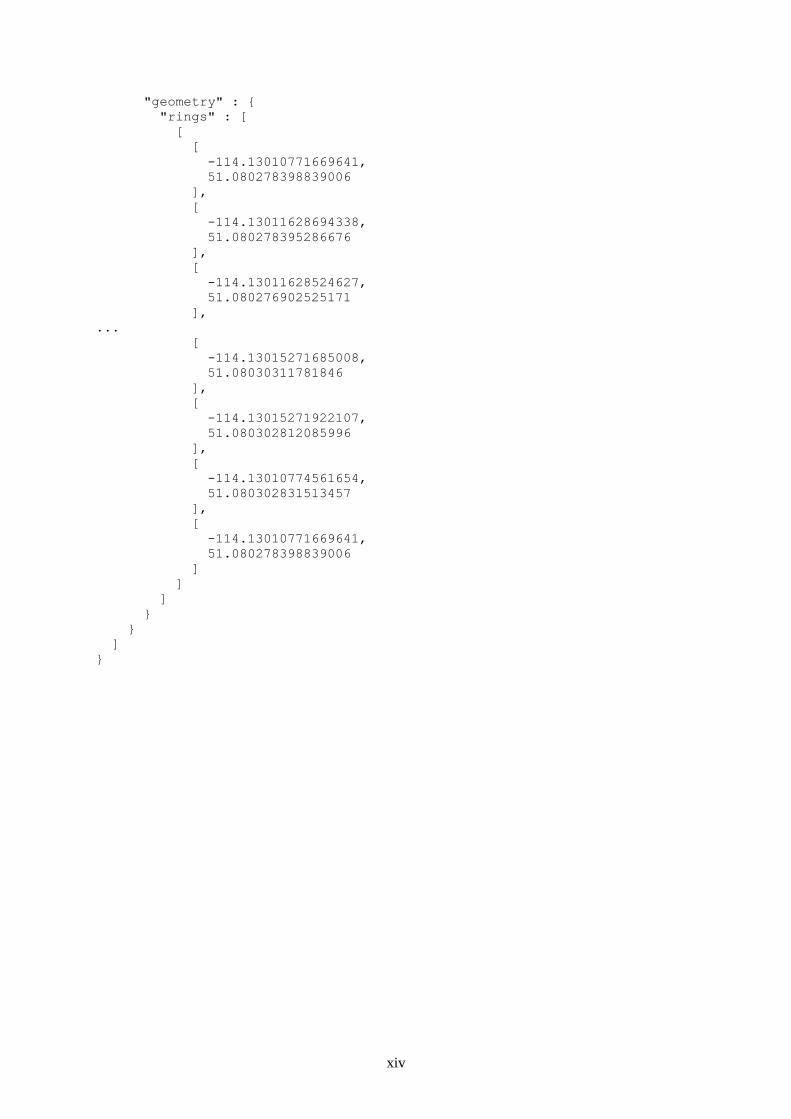
xiv
"geometry" : {
"rings" : [
[
[
-114.13010771669641,
51.080278398839006
],
[
-114.13011628694338,
51.080278395286676
],
[
-114.13011628524627,
51.080276902525171
],
...
[
-114.13015271685008,
51.08030311781846
],
[
-114.13015271922107,
51.080302812085996
],
[
-114.13010774561654,
51.080302831513457
],
[
-114.13010771669641,
51.080278398839006
]
]
]
}
}
]
}

xv
Example CSV Data for Wi-Fi Access Points
Excerpt out of the .csv file, which contains ~2000 data sets.
Name,1st MAC,1st Ch,1st TxP,2nd MAC,2nd Ch,2nd TxP
PF_4240,00:0B:86:C8:01:C0,11,37,00:0B:86:C8:01:D0,36,40
ST_29n,00:1A:1E:15:FA:20,6,38,00:1A:1E:15:FA:30,60,40
PF_2291,00:0B:86:CB:94:A0,1,37,00:0B:86:CB:94:B0,153,40
EDC_363U,00:0B:86:CA:C5:00,6,37,00:0B:86:CA:C5:10,157,40
PF_1140,00:0B:86:D6:CA:A0,6,37,00:0B:86:D6:CA:B0,149,40
MFH_3342,00:0B:86:DC:BA:40,6,37,00:0B:86:DC:BA:50,153,40
EDC_386,00:0B:86:CE:60:00,11,37,00:0B:86:CE:60:10,165,40
OO_251Z,D8:C7:C8:E0:15:E0,6,41,D8:C7:C8:E0:15:F0,100,42
EDC_264,00:0B:86:C8:8D:A0,6,37,00:0B:86:C8:8D:B0,48,40
EDT_1017,00:0B:86:CD:FC:A0,6,37,00:0B:86:CD:FC:B0,48,40
PF_1254v,00:0B:86:CB:C7:20,1,37,00:0B:86:CB:C7:30,165,40
PF_1286,00:0B:86:CD:F1:C0,11,37,00:0B:86:CD:F1:D0,40,40
ST_20n,00:1A:1E:15:E8:60,1,41,00:1A:1E:15:E8:70,108,42
EDC_290,00:0B:86:CA:C7:60,6,37,00:0B:86:CA:C7:70,44,40
PF_3233,00:0B:86:C9:93:80,1,37,00:0B:86:C9:93:90,165,40
MFH_3340,00:0B:86:DC:B8:C0,11,37,00:0B:86:DC:B8:D0,48,40
EDT_1412,00:0B:86:CB:C1:40,11,37,00:0B:86:CB:C1:50,165,40
[...]