Embed Size (px)
Citation preview

Diploma Thesis in Electrical Engineering
Design and Implementation of a LabVIEWbased Computer Control for
EPR Instrumentation
Matthias Kolja Miehl
October 22, 2010
Medical College of WisconsinNational Biomedical EPR Center8701 Watertown Plank RoadMilwaukee, WI 53226USA
Milwaukee School of EngineeringElectrical Engineering Department1025 North BroadwayMilwaukee, WI 53202USA
Fachhochschule LübeckFachbereich ElektrotechnikStephensonstraße 323562 LübeckGermany


Erklärung zur DiplomarbeitIch versichere, dass ich die Arbeit selbstständig und ohne fremde Hilfe verfasst habe.Bei der Abfassung der Arbeit sind nur die angegebenen Quellen benutzt worden.Wörtlich oder dem Sinne nach entnommene Stellen sind als solche gekennzeichnet.
Ich bin damit einverstanden, dass meine Arbeit veröffentlicht wird, insbesondere dassdie Arbeit Dritten zur Einsichtnahme vorgelegt oder Kopien der Arbeit zur Weitergabean Dritte angefertigt werden.
Milwaukee, den 22. Oktober 2010 Matthias Kolja Miehl


AbstractDepartment Electrical EngineeringCourse of Studies Internationales Studium ElektrotechnikTopic Design and Implementation of a LabVIEW based computer
control for EPR instrumentation
Author Matthias Kolja MiehlSupervising Professor Dr.-Ing. Jörg MoßbruckerQuarter Summer 2010
This diploma thesis was written in the National Biomedical Electron ParamagneticResonance Center at the Medical College of Wisconsin in Milwaukee, Wisconsin, USA.The EPR research at the Medical College of Wisconsin involves the exchange of
hardware and the implementation of new experiments on a regular basis. The flexibilityof the different types of experiments required to write a new program for each type ofexperiment. Furthermore, already implemented experiments had to be rewritten touse new instrument drivers, if they should be performed in a different hardware setupfor a different frequency band. This labour intensive task reduced the actual researchtime by the time it took to implement new experiments or adapt existing ones to anew hardware setup.
For that reason the goal of this thesis is to design and implement a program frameworkthat abstracts the complexity introduced by changing hardware and provides a commonbasis for the implementation of different types of experiments. This reduces the amountof redundant work by providing a common feature basis to all experiments. The focus ofthis thesis is the design of a program concept that fulfils the specified requirements, theselection of the proper technologies to implement the concept, and the implementationof a simple experiment, to demonstrate the operability.
The software solution was developed with LabVIEW and fulfils the set requirements.


AcknowledgementsI would like to thank Senior Engineer Joseph J. Ratke of the Medical College ofWisconsin and Dr. John D. Gassert of the Milwaukee School of Engineering fortheir support of my diploma thesis, as well as the employees of the MCW for theirhelp. Furthermore I am thankful for the support my family and friends gave me.Finally I want to thank Dr.-Ing., Dipl.-Ing. Holger Dahms who initiated this courseof studies and is head of the Milwaukee-Lübeck exchange program at the Universityof Applied Sciences in Lübeck and Dr.-Ing. Jörg Moßbrucker, head of the Milwaukee-Lübeck exchange program at the Milwaukee School of Engineering, for making thisextraordinary experience possible.This thesis is funded in part by two projects that are supported by the National
Center for Research Resources under the grant numbers EB001980 and EB002052. Itscontent is solely the responsibility of the author and does not necessarily represent theofficial views of the National Center for Research Resources or the National Institutesof Health.


Contents
List of Figures v
List of Tables vii
Listings ix
Nomenclature xi
1 Introduction 11.1 Goal of the Thesis . . . . . . . . . . . . . . . . . . . . . . . . . . . . . 11.2 Document Structure . . . . . . . . . . . . . . . . . . . . . . . . . . . . 21.3 Team Work . . . . . . . . . . . . . . . . . . . . . . . . . . . . . . . . . 3
2 Background 52.1 EPR . . . . . . . . . . . . . . . . . . . . . . . . . . . . . . . . . . . . . 5
2.1.1 Introduction . . . . . . . . . . . . . . . . . . . . . . . . . . . . . 52.1.2 Scientific Significance . . . . . . . . . . . . . . . . . . . . . . . . 72.1.3 EPR Phenomenon . . . . . . . . . . . . . . . . . . . . . . . . . 72.1.4 L-Band Continuous Wave Experiment . . . . . . . . . . . . . . 82.1.5 L-Band Spectrometer . . . . . . . . . . . . . . . . . . . . . . . . 92.1.6 Further EPR Reading . . . . . . . . . . . . . . . . . . . . . . . 12
2.2 LabVIEW . . . . . . . . . . . . . . . . . . . . . . . . . . . . . . . . . . 132.2.1 Benefits . . . . . . . . . . . . . . . . . . . . . . . . . . . . . . . 132.2.2 Control Concept . . . . . . . . . . . . . . . . . . . . . . . . . . 142.2.3 Further Information . . . . . . . . . . . . . . . . . . . . . . . . 15
2.3 Related Work . . . . . . . . . . . . . . . . . . . . . . . . . . . . . . . . 152.3.1 WinEPR . . . . . . . . . . . . . . . . . . . . . . . . . . . . . . . 152.3.2 EWWin . . . . . . . . . . . . . . . . . . . . . . . . . . . . . . . 162.3.3 SpecMan4EPR . . . . . . . . . . . . . . . . . . . . . . . . . . . 16
i

3 Analysis 193.1 Problem Definition . . . . . . . . . . . . . . . . . . . . . . . . . . . . . 193.2 Requirements . . . . . . . . . . . . . . . . . . . . . . . . . . . . . . . . 203.3 Discussion of Related Work . . . . . . . . . . . . . . . . . . . . . . . . 213.4 Summary . . . . . . . . . . . . . . . . . . . . . . . . . . . . . . . . . . 23
4 Concept 254.1 Fundamental Design Considerations . . . . . . . . . . . . . . . . . . . . 25
4.1.1 Structure . . . . . . . . . . . . . . . . . . . . . . . . . . . . . . 254.1.2 Functionality . . . . . . . . . . . . . . . . . . . . . . . . . . . . 264.1.3 Workflow . . . . . . . . . . . . . . . . . . . . . . . . . . . . . . 274.1.4 Specifics . . . . . . . . . . . . . . . . . . . . . . . . . . . . . . . 28
4.2 Program Structure . . . . . . . . . . . . . . . . . . . . . . . . . . . . . 304.2.1 Overall Program Structure . . . . . . . . . . . . . . . . . . . . . 304.2.2 Abstraction to Allow for Changing Hardware . . . . . . . . . . . 31
4.3 Summary . . . . . . . . . . . . . . . . . . . . . . . . . . . . . . . . . . 33
5 Implementation 355.1 Introduction . . . . . . . . . . . . . . . . . . . . . . . . . . . . . . . . . 35
5.1.1 Program Development Approach . . . . . . . . . . . . . . . . . 355.1.2 Programming Style . . . . . . . . . . . . . . . . . . . . . . . . . 37
5.2 Discussion of LabVIEW Technologies . . . . . . . . . . . . . . . . . . . 375.2.1 Integration of Experiment GUIs into one Program . . . . . . . . 385.2.2 Internal Communication Framework . . . . . . . . . . . . . . . 395.2.3 Inter-Process Communication Framework . . . . . . . . . . . . . 405.2.4 Driver as a Module . . . . . . . . . . . . . . . . . . . . . . . . . 435.2.5 Summary . . . . . . . . . . . . . . . . . . . . . . . . . . . . . . 44
5.3 Implementation Overview . . . . . . . . . . . . . . . . . . . . . . . . . 455.3.1 Description of GUI Implementation . . . . . . . . . . . . . . . . 455.3.2 Program Flow and Description of Background Processes . . . . 545.3.3 Drivers . . . . . . . . . . . . . . . . . . . . . . . . . . . . . . . . 59
5.4 STM Implementation . . . . . . . . . . . . . . . . . . . . . . . . . . . . 605.5 Main Program and Driver Structure . . . . . . . . . . . . . . . . . . . . 62
5.5.1 Main Program . . . . . . . . . . . . . . . . . . . . . . . . . . . . 625.5.2 Driver . . . . . . . . . . . . . . . . . . . . . . . . . . . . . . . . 66
5.6 INI File Structure . . . . . . . . . . . . . . . . . . . . . . . . . . . . . . 69
ii

5.7 CW Experiment Implementation . . . . . . . . . . . . . . . . . . . . . 695.7.1 Hardware Setup . . . . . . . . . . . . . . . . . . . . . . . . . . . 745.7.2 Experiment Simulation . . . . . . . . . . . . . . . . . . . . . . . 74
6 Evaluation 776.1 Requirement List . . . . . . . . . . . . . . . . . . . . . . . . . . . . . . 776.2 Potential for Improvement . . . . . . . . . . . . . . . . . . . . . . . . . 786.3 Summary . . . . . . . . . . . . . . . . . . . . . . . . . . . . . . . . . . 79
7 Summary and Vision 81
Bibliography 83
A DVD Contents 87
B EPR Symposium Poster 89
C Program Flow 91C.1 Main Program . . . . . . . . . . . . . . . . . . . . . . . . . . . . . . . . 91C.2 Driver . . . . . . . . . . . . . . . . . . . . . . . . . . . . . . . . . . . . 97
D Source Code Modifications (STM) 103
E Sample INI Files 107
F TCP Benchmark Results 111
iii


List of Figures
2.1 Typical CW EPR spectrum . . . . . . . . . . . . . . . . . . . . . . . . 62.2 Transition of an electron in an applied magnetic field . . . . . . . . . . 82.3 Signal flow graph of a generic EPR spectrometer . . . . . . . . . . . . . 10
4.1 Overall application structure (concept) . . . . . . . . . . . . . . . . . . 314.2 Example for possible use of usages among experiments . . . . . . . . . 32
5.1 Modified waterfall model . . . . . . . . . . . . . . . . . . . . . . . . . . 365.2 Overall application structure (implementation) . . . . . . . . . . . . . . 445.3 outer tab tab control showing the Exp Selection page . . . . . . . . . . 475.4 outer tab tab control showing the Exp GUIs page . . . . . . . . . . . . 485.5 outer tab tab control showing the Instruments page . . . . . . . . . . . 495.6 outer tab tab control showing the Maintenance page . . . . . . . . . . . 505.7 outer tab tab control showing the Admin page . . . . . . . . . . . . . . 515.8 Cluster and indicator naming convention . . . . . . . . . . . . . . . . . 545.9 Workflow when working with the GUI as a user . . . . . . . . . . . . . 595.10 STM client/server communication framework . . . . . . . . . . . . . . . 605.11 Implementation of the main program’s parallel loop structure . . . . . 655.12 Implementation of the DAQ drivers’ parallel loop structure . . . . . . . 685.13 outer tab tab control showing the Parameters experiment page of the
Exp GUIs page . . . . . . . . . . . . . . . . . . . . . . . . . . . . . . . 715.14 outer tab tab control showing the Patrick experiment page of the Exp
GUIs page . . . . . . . . . . . . . . . . . . . . . . . . . . . . . . . . . . 725.15 outer tab tab control showing the Varian experiment page of the Exp
GUIs page . . . . . . . . . . . . . . . . . . . . . . . . . . . . . . . . . . 735.16 Experiment collection panel showing the four averages of a test signal . 75
B.1 EPR Symposium Poster . . . . . . . . . . . . . . . . . . . . . . . . . . 90
v


List of Tables
2.1 EPR frequency bands in use at the Medical College of Wisconsin . . . . 92.2 I/O connector pin assignment for the NI PCI-6024E slow speed ADC card 12
5.1 Structure of nested tab controls in the outer tab tab control . . . . . . 465.2 Overview of cluster naming convention . . . . . . . . . . . . . . . . . . 535.3 Overview of implemented instrument drivers . . . . . . . . . . . . . . . 595.4 Client/server command prefix convention . . . . . . . . . . . . . . . . . 615.5 Use of INI files . . . . . . . . . . . . . . . . . . . . . . . . . . . . . . . 69
vii


Listings
E.1 spectrometer.ini . . . . . . . . . . . . . . . . . . . . . . . . . . . . . . . 107E.2 text_based_variable.ini . . . . . . . . . . . . . . . . . . . . . . . . . . 107E.3 L-Band.CW sim.ini . . . . . . . . . . . . . . . . . . . . . . . . . . . . . 108
ix

NomenclatureSymbolsB0 magnetic fieldg Zeeman factorh Planck constantµB magnetic momentν microwave frequency
AbbreviationsAC Alternating CurrentADC Analog-to-Digital ConverterAFC Automatic Frequency ControlAWG Arbitrary Waveform GeneratorCPU Central Processing UnitCW Continuous WaveDAQ Data AcquisitionDC Direct CurrentDLL Dynamic Link LibraryEPR Electron Paramagnetic ResonanceESR Electron Spin ResonanceEXE Executable (file name extension)FFT Fast Fourier TransformGPIB General Purpose Interface BusGUI Graphical User InterfaceICAS Instrumentation Control and Acquisition SoftwareINI Initialization/Configuration file (file name extension)IP Internet ProtocolLabVIEW Laboratory Virtual Instrumentation Engineering Workbench
xi

LAN Local Area NetworkLIA Lock-In AmplifierLLVM Low-Level Virtual MachineLXI LAN eXtensions for InstrumentationMCW Medical College of WisconsinNI National InstrumentsNMR Nuclear Magnetic ResonanceNP-SV Networked-Published Shared VariablePARS Pure Absorption Rapid ScanPC Personal ComputerPCI Peripheral Component InterconnectPPL Pulse Programming LanguagePSD Phase-Sensitive DetectorRAM Random Access MemorySDSL Spin-Directed Spin LabelingSP-SV Single-Process Shared VariableSR Saturation RecoverySRS Stanford Research SystemsSTM Simple TCP/IP MessagingSV Shared VariableSVE Shared Variable EngineTCP Transmission Control ProtocolTDMS Technical Data Management StreamingUDP User Datagram ProtocolVI Virtual Instrument
xii

1 Introduction
1.1 Goal of the ThesisSituation At the time this thesis is written the Department of Biophysics of theMedical College of Wisconsin (MCW), with Dr. James S. Hyde as its director, receivesfunding for several projects dealing with EPR spectroscopy and MRI imaging inbiomedical research. The work documented in this thesis is related to two of them,namely
• National Biomedical EPR Centersupported by center grant EB001980 [8] and
• Development of Biomedical EPR Instrumentationsupported by grant EB002052 [7].
The goal of the first project is to enhance the technology for spin-directed spin-labeling(SDSL) applications. One highlighted sub-aim is the development of a new resonatorthat will increase the sensitivity for spin labeled samples in water by a factor of 40 atW-band (94GHz). The second project strives to develop novel instrumentation forpulse experiments at high magnetic fields. This will help to determine the dynamics ofmolecular structures using a high-speed Data Acquisition (DAQ) card and a state-of-the-art Arbitrary Waveform Generator (AWG).
Problem Definition The experiments conducted as part of these projects are designedto improve the performance of EPR spectroscopy by redesigning certain parts of thespectrometer, mainly with respect to signal sensitivity and data acquisition time. Thisprocess involves the exchange of hardware and the implementation of new experimentson a regular basis.
At the time the thesis started, it was required to write a new program for each typeof experiment. Due to the flexibility of the different types of experiments they oftenrequire a different control. Moreover, the drivers were part of the control program,making it only possible to use the software for a single frequency band with a specific
1

1 Introduction
hardware configuration. The implementation of a new experiment therefore oftenrequired writing a new program and the exchange of an instrument required rewritingthe software to use a new instrument driver. These are labour intensive tasks thatresulted in a slow software adaption to new experiments and new instruments.
Motivation The researchers need to adapt experiments with new software as fast aspossible. Their research time is restricted by due dates for their research results. Afast software adaption to new experiments would buy them more actual research time.They would start taking data earlier and could request more modifications to hardwareand software. More research time and more iterations promote better results which inturn increases the likelihood for continued funding. The final result of increasing thenumber of scientific papers published is the ultimate goal for each research department.
Goal of the Thesis Consequently the goal of this thesis is to design and implementa versatile control and measurement framework that can be used to implement allexperiments for every type of spectrometer with its respective hardware capabilities.It abstracts the complexity introduced by the multitude of different experiments andinstruments. Providing such a common base makes the implementation of experimentsand the adaption to changes more efficient and therefore faster. This base makes allimplemented drivers and features available to every implemented experiment. Beyondthis fundamental concept, it supports the operator in collection and storage of data.The system programmer is provided improved maintainability and extendability.
1.2 Document StructureThe background, Chapter 2, explains the relation of this thesis to the Electron Param-agnetic Resonance (EPR) research done at the Medical College of Wisconsin (MCW),introduces the software development environment used, and presents related work. Inthe analysis, Chapter 3, a detailed problem definition as well as a discussion of therelated work is presented. The concept is described in Chapter 4 and the implementa-tion follows in Chapter 5. Finally the evaluation is carried out in Chapter 6 and thesummary and vision, Chapter 7, concludes the thesis.
2

1.3 Team Work
1.3 Team WorkThis project is also the subject of the diploma thesis of Malte H. Reitzer. He also tookpart in the exchange program offered by the Fachhochschule Lübeck in Germany andthe Milwaukee School of Engineering in the United States of America.Since he also never worked on a large scale LabVIEW application before, a close
collaboration was desirable to develop the project within the given four months. Forexample, the research was done separately but frequent talks about what was learnedtook place, to discuss the advantages and disadvantages of various technologies andapproaches. During the coding phase of the preliminary proof of concept applicationMalte H. Reitzer focused on the main application while I focused on the driversand symposium poster (see Appendix B). Nevertheless, our work was closely linked.Before a feature was implemented its implementation details were always discussed inaccordance with the idea of four eyes being better than two. Larger portions of thecode were implemented together, following a software development technique calledpair programming. In this technique two programmers work together at one workstation. One writes code while the other reviews it as it is written. The person writingthe code is called the driver and the person reviewing the code is called the observer ornavigator. The roles are switched frequently. If questions occurred during the codingprocess on how to implement a specific feature, a solution was found by discussing thealternatives. The final program is a complete redesign of the earlier proof of conceptimplementation. It was designed together and implemented using pair programming.
The overall impression is that this programming approach results in a reduced overalldevelopment and implementation time as well as a better design with fewer bugs andless program code then usual. This approach seems to have a great benefit for complextasks that are not yet fully understood by the programmers, because the observerconsiders the overall design while the driver can concentrate on a specific feature thatneeds to be implemented.
3

2 BackgroundThis chapter provides the necessary knowledge to understand the described problemand its solution. It starts by illustrating how the control and measurement frameworkis related to the field of Electron Paramagnetic Resonance (EPR), continues with anintroduction to LabVIEW, and closes by introducing related work.
2.1 EPRThe goal of this section is to explain how this thesis relates to the research done at theMedical College of Wisconsin. Therefore, this section
• gives an explanation of what EPR is used for,• explains the EPR phenomenon,• gives an introduction to the implemented Continuous Wave (CW) experiment,• provides an overview of the used spectrometer hardware, and• describes how it interfaces to the PC that runs the control and acquisition
software.
Resources with detailed background information regarding EPR instrumentation andtheory are referenced in Section 2.1.6.
2.1.1 IntroductionEPR is short for Electron Paramagnetic Resonance. Sometimes it is also abbreviatedas ESR, Electron Spin Resonance. It is the only technique that allows one to unam-biguously detect free electrons in a species and determine the detected paramagneticspecies [1]. At MCW, these features are used for molecular research in the field ofstructural biology.
The sample itself does not contain free electrons. In general, the systems being studiedat MCW do not contain detectable free electrons in their natural state. Therefore,scientists place a spin label, a small paramagnetic molecule, on the surface of the
5

2 Background
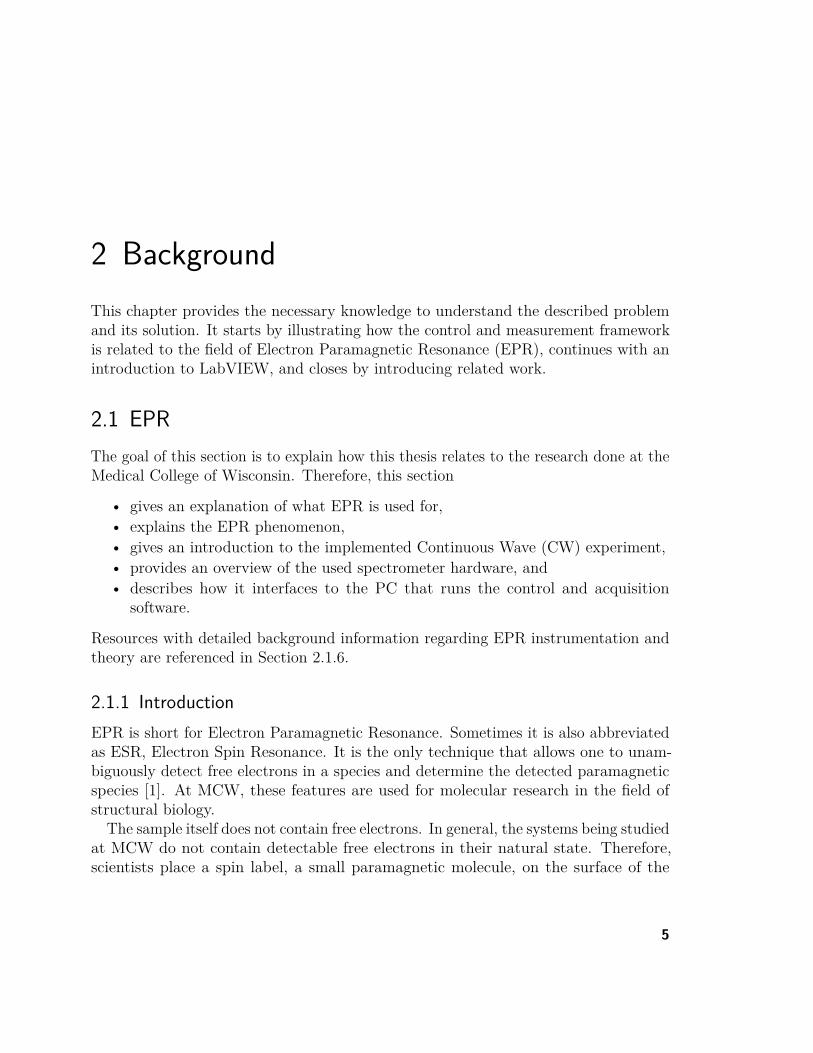
sample at points they want to examine. These labels contain free electrons that canbe detected by EPR spectroscopy. The program described in this thesis implementsthe control for a Continuous Wave (CW) experiment which is the traditional wayEPR spectroscopy is performed. Besides CW experiments a great variety of othermeasurement techniques exists of which each needs different control and acquisitionroutines to measure different properties.A typical CW EPR spectrum acquired at MCW by Aaron W. Kittell is shown in
Figure 2.1.
Figure 2.1: Typical CW EPR spectrum
This spectrum is the first derivative of the absorption signal of the sample. Themeasurement technique of the Phase-Sensitive Detector (PSD) used to detect theextremely small absorption signal causes it to output the first derivative of the signal.To obtain the original absorption spectrum typically an integration is performed.Another approach would be to apply the Hilbert transform.
The number of lines in a CW spectra depends on the spin quantum number, I,of the nucleus which the free electron makes contact with. For CW experiments ofnitroxides I = 1. The general rule states that the number of energy states of thenucleus and therefore the number of lines in the EPR spectrum equals to 2I + 1. ForCW experiments with I = 1 this results in three energy states of the nitrogen nucleus,I = −1, 0,+1, and three lines in the EPR spectrum. The principle behind the numberof spectral lines is explained by hyperfine interactions.
6

2.1 EPR
2.1.2 Scientific SignificanceLabels in EPR samples are very sensitive to their local environment. Their absorptionspectrum therefore contains information of the local structure. Hence, CW experimentsallow researchers to identify the dynamics of processes and the chemical structure nearthe label. Knowledge of this kind is used to understand how proteins function andinteract with other proteins inside the organism.To obtain this information the scientists acquire an EPR spectrum of the labeled
material that looks similar to the one shown in Figure 2.1. Afterwards they identifyand interpret the spectrum’s characteristic properties.
2.1.3 EPR PhenomenonAn electron has a spin, which gives it a magnetic property known as magnetic moment,µB. This magnetic moment makes the electron behave like a bar magnet. When anexternal magnetic field is applied, the paramagnetic electrons can either orientateparallel or antiparallel to the direction of the static field. This creates two distinctenergy levels for the electrons and allows EPR spectroscopy to detect them as theymake transitions between the two states.For the electron to absorb energy, the applied microwave energy has to match
the energy gap between the electron’s two energy states. The relation between theapplied microwave energy, the magnetic field, and the resonance energy is describedby Equation 2.1 [23, 25],
∆E = h · ν︸ ︷︷ ︸microwave energy
= g · µB ·B0︸ ︷︷ ︸resonance energy
, (2.1)
where
h = Planck constant,ν = Microwave frequency,g = Zeeman factor, constant for a unique sample,
µB = Magnetic moment, andB0 = Magnetic field.
If the applied microwave energy is equal to the resonance energy, i.e. h·ν = g ·µB ·B0,
7

2 Background
EPR spectroscopy detects a signal. This is the location researches are looking for andcalled satisfying resonance.Figure 2.2 shows how the magnetic field is increased until the resonance energy
matches the applied microwave energy and excites an electron to the upper energylevel. The line at the bottom represents the EPR absorption line.
Figure 2.2: Transition of an electron in an applied magnetic field
2.1.4 L-Band Continuous Wave ExperimentCW experiments can be performed at different frequency bands. An overview of allfrequency bands currently in use at MCW and the respective frequencies is listed inTable 2.1.Each frequency band needs to be performed on a hardware specifically designed forthat frequency.
Experiment Description CW experiments are performed by keeping the microwavefrequency, ν, constant, sweeping the magnetic field, B0, and measuring the absorbedenergy versus the magnetic field.
8

2.1 EPR
Table 2.1: EPR frequency bands in use at the Medical College of WisconsinFrequency Band Frequency ν [GHz]
L 1.5S 3X 9.5Q 36W 95
Information The measurement process results in an absorption spectrum that showsthe amount of energy absorbed by the labeled sample at a given magnetic field. Toobserve the dynamic processes and the chemical structure of molecules researchesidentify the distance between, the sharpness of, and the location of the signal peaks.CW experiments also allow to measure interspin distances, hyperfine interactions (Avalues), and the three dimensional g value of a sample.
2.1.5 L-Band SpectrometerSpectrometer Function Principle A spectrometer is a hardware setup to measure theabsorption curve of a labeled sample. It typically consists of five main components:
• Radiation source• DC magnets• Resonator• Modulation coils• Detector
These components and the signal flow between them is shown in Figure 2.3.The spectrometer consists of two arms: A signal and a reference arm that are
supplied by the same source. The reference arm provides a phase reference for thesignal in the signal arm carrying the EPR information. A coupler feeds the source signalinto both signal arms. To maximize the amplitude at the output of the spectrometer,the signal damping and signal runtime of both arms have to be adjusted to be equal.This is done by adding an attenuator and phase shifter into the reference arm andan attenuator into the signal arm. To allow the microwaves to propagate inside thesystem, the components are connected by waveguides.The radiation source is a low noise, monochromatic microwave source. Frequency
stability is ensured by an Automatic Frequency Control (AFC).
9

2 Background
Figure 2.3: Signal flow graph of a generic EPR spectrometer
Strong DC magnets are used to sweep the magnetic field inside which the resonatorwith the sample is placed. This magnetic field is controlled by a field regulation circuitand a field sweep system.The resonator, also known as a resonance chamber, is a metallic chamber with a
coupling hole allowing the microwaves to couple in and out. Coupling can be controlledwith an iris that controls the diameter of the coupling hole. The resonator is designedfor a specific resonance frequency which is determined by its dimensions. At thisresonance frequency the reflected signal is minimized and the energy absorbed bythe resonance chamber is maximized. When the sample is in resonance with theapplied microwave field, some energy is reflected from the resonator and passed viathe circulator to the detection. This reflected energy carries the EPR signal.Modulation coils modulate the magnetic field, typically with 100 kHz, to encode the
DC EPR signal as an AC signal. This reduces the 1/f-noise mainly originating fromthe microwave source and eliminates the influence of DC drift.The desired EPR signal is encoded in the frequency difference of the signal in the
reference and signal arm. The signal coming from the resonator is a microwave signalat the frequency of the respective microwave frequency band. First it is downconvertedto a lower frequency by mixing the reference arm with the signal arm. The resultingsignal’s frequency is the frequency difference between both arms. It originates from theinteraction of the signal arm with the resonator. Second this signal is fed into a Lock-InAmplifier (LIA) or Phase-Sensitive Detector (PSD) that further downconvertes and
10

2.1 EPR
thereby decodes the signal by mixing it with the 100 kHz field modulation frequency.The output of the mixer is a signal with a DC and an AC component. The DCcomponent is the desired EPR signal. Internally this DC component is filtered outusing an extremely narrow low-pass filter, e.g. −3 dB bandwidth of 0.5Hz, and finallyoutput to the PC’s data acquisition hardware. Because mixers are used to downconvertthe microwave signal, the amplitude of the EPR signal depends on the phase differencebetween the reference and signal arm. The smaller the phase difference, the larger theresulting amplitude at the mixer’s output.
CW Experiment Hardware Configuration To understand how the spectrometer interfaceswith the PC for the implemented CW experiment, the configuration of the involvedhardware is explained.
On the spectrometer side a Varian console is used. It contains the field controller tosweep the magnetic field and a Phase-Sensitive Detector (PSD) that outputs the firstderivative of the EPR absorption spectrum. Originally the console was used to drawEPR spectra on paper. It therefore has a slider with a pen holder that is moved bya stepper motor and moves the magnetic field for every step the motor does. Oncedigital data acquisition hardware and PC’s became affordable enough, it made sense torecord the data digitally. Since then, an Analog-to-Digital Converter (ADC) interfaceswith the Varian console. To record the EPR spectrum it samples the following threesignals which can be accessed on a connector panel at the back of the Varian console:
• EPR Signal: DC EPR signal output by the Varian’s PSD• Motor Steps: Signals the acquisition software when the magnetic field moved
and a new measurement has to be done• Slider’s Left Limit Switch: Signals that the slider is in its starting position at
the far left and the Varian console is ready for the next sweep
For one full sweep 10,000 motor steps are required. To reduce the overall acquisitiontime every tenth step is output to the PC. This reduces the number of steps toapproximately 1000, which is sufficient.
On the PC side the NI PCI-6024E, a slow speed ADC card, is used to interface withthe two signaling lines and sample the EPR signal. Table 2.2 shows the ADC card’sconnector panel configuration.When the operator starts the acquisition with the PC’s control and acquisition software,the ADC card is configured to wait for the left limit switch signal to start acquiring asample on every motor step and stop after the number of specified samples, typically
11

2 Background
Table 2.2: I/O connector pin assignment for the NI PCI-6024E slow speed ADC cardVarian Console Signal ADC Card PinsEPR signal 68 to 67, ACH0 to AlGNDMotor steps 38 to 13, PFI7/STARTSCAN to DGNDLeft limit switch 11 to 13, PFI0/TRIG1 to DGND
1024, is acquired. Depending on the number of measurements set by the operator onthe experiment interface, the software either stops the acquisition or reinitializes thecard so it starts acquiring the next collection of samples, one on every motor step, assoon as the next left limit switch signal is received.
2.1.6 Further EPR ReadingIf you would like to learn more about EPR instrumentation and theory, there are manygood books available. I recommend the following:
Instrumentation
• Poole, C. P. Electron Spin Resonance: A Comprehensive Treatise on ExperimentalTechniques, Editions 1, 2: Interscience Publishers, New York, (1967), (1983).
• Feher, G. Sensitivity Considerations in Microwave Paramagnetic ResonanceAbsorption Techniques: Bell System Tech. J. 36, 449 (1957).
Theory
• Knowles, P. F, D. Marsh and H. W. E. Rattle,Magnetic Resonance of Biomolecules:J. Wiley, New York, (1976).
• Weil, John A, J. R. Bolton, and Wertz, J. E, Electron Paramagnetic Resonance,Elementary Theory and Practical Applications: Wiley-Interscience, New York,(1994).
• Schweiger, Arthur, and Gunnar, Jeschke, Principles of Pulse Electron Paramag-netic Resonance: Oxford University Press, New York, (2001).
12

2.2 LabVIEW
2.2 LabVIEWThroughout this project LabVIEW 2009 SP1 was used in both the 32 and 64-bitversions. This is the first release that offers a 64-bit version. LabVIEW, short forLaboratory Virtual Instrumentation Engineering Workbench, is a proprietary develop-ment environment from National Instruments using a graphical dataflow programminglanguage called G. LabVIEW is available for Mac OS X, a few other UNIX’s, Linux,and Microsoft Windows.
2.2.1 BenefitsLabVIEW was selected as the development environment based on the following benefits.First of all, it has been used by Senior Engineer Joseph J. Ratke for 13 years to
control EPR experiments and acquire data. Hence, one knows which problems andlimitations to expect when working with LabVIEW. Building on an existing knowledgebase, minimizes the adjustments for integrating the solution at a later time andeventually reduces the development time. For example, old program code can easilybe integrated if the solution uses the same programming language.Besides these considerations, LabVIEW has some unique advantages over other
programming languages:
• It is specifically designed for tasks that involve data acquisition, instrumentcontrol, industrial automation, and is often used in laboratory environments.
• It supports the capability of parallel code execution.The ability to use multiple processors becomes more important as modern PCshave CPUs with a growing number of cores. LabVIEW takes advantage ofthis additional computing power without demanding much effort on the part ofthe programmer. Most other programming languages force the programmer tomanage the threads.
Additionally it has the following noteworthy benefits:
• Promotes intuitive development using a graphical programming language.Like the textbased approach the graphical approach has its benefits and lim-itations. Overall it feels more natural to use the graphical programming butfrom my experience it is not superior to the textbased approach. With enoughexperience and good programming practices, both approaches let the programmereasily comprehend the program structure. Both graphical and textbased code
13

2 Background
tends to get confusing for large applications, especially if a complex structure ischosen or a poor programming style is used.
• Facilitates the abstraction of complexity.LabVIEW abstracts the complexity involved in controlling instruments andusing the network. Drivers for common instruments are available and includeapplication examples. Furthermore, LabVIEW offers different approaches to dealwith the network communication, each with a different level of abstraction. Theyrange from basic TCP/IP and UDP over Simple TCP/IP Messaging (STM) tohighly abstracted shared variables.
• The inherent execution speed of LabVIEW applications is similar to C and C++applications.Historically software, written in graphical programming languages, is perceived asslower than similar C/C++ applications. However, the experience of LabVIEWprogrammers shows that optimized LabVIEW programs execute just as fastas C/C++ applications. On July 29, 2010 National Instruments published atutorial [17] on their website which says that their internal benchmarks haveshown that the introduction of the Low-Level Virtual Machine (LLVM) into theLabVIEW code generator “has produced and average 20 percent increase in VIexecution time.”
2.2.2 Control ConceptThe control concept of LabVIEW evolves around Virtual Instruments (VIs) that areLabVIEW programs or subroutines. Each VI has three representations: a GUI (frontpanel), a coding interface (block diagram), and a connector panel. The front panelholds the controls, indicators, and decorations while the block diagram holds the Gcode. The connector panel is used to represent the VI when it is used as a subVI insidethe block diagram of another VI. A subVI in G code is the equivalent of a subroutinein C. Some elements are only visible on the front panel (decorations like boxes andgraphics), other elements are only visible in the block diagram (e.g. a function blockto add two values), but most elements have an equivalent in both (e.g. controls andindicators).
14

2.3 Related Work
2.2.3 Further InformationThe following lists provide valuable LabVIEW resources.
Online Resources
• National Instruments (NI) Technical Support1 and NI Developer Zone2
Provides examples, tutorials, publications, webcasts and videos, instrumentdrivers, product manuals, and a discussion forum
• LabVIEW Advanced Virtual Architects3
Hardware and software discussion forum as well as code repository
Books
• Blume, P. A, The LabVIEW Style Book: Prentice Hall, (2007).• Georgi, W, E. Metin, Einführung in LabVIEW: Hanser Fachbuchverlag, (2007).• Bitter, R, T. Mohiuddin, M. Nawrocki, Advanced Programming Techniques: CRC
Press, (2007).
2.3 Related Work2.3.1 WinEPRBruker offers a program called WinEPR that controls the instruments and includessome signal processing but does not allow for much customization. The big drawbackis that it is only available for Bruker hardware.They offer two hardware systems with different applications in mind. The Elexys
system is research oriented and therefore allows the operator to modify some operationparameters. The EMX system is a stripped down version for more routine work. Ingeneral you get a black box with hardware that is developed by or for Bruker andintended for use by an instrument operator, not a scientist.
1 http://ni.com/support/2 http://zone.ni.com3 http://lavag.org/
15

2 Background
2.3.2 EWWinEWWin is distributed by Scientific Software Services1 which is owned byReef Morse.Among other software products it offers a simple commercial DAQ software for Contin-uous Wave (CW) experiments called EWWin. The full version costs $ 7750 (July 14,2010). It is only able to perform basic measurements and does not support all instru-ments used by the Medical College of Wisconsin.
2.3.3 SpecMan4EPRHistory SpecMan4EPR began as a collaboration between the groups of Prof. DaniellaGoldfarb, Weizmann Institute of Science in Israel, and Prof. Arthur Schweiger, SwissFederal Institute of Technology (ETH) in Switzerland. It was initially designed by Dr.Stefan Stoll (currently Department of Chemistry, University of California, Davis, CA)and Dr. Igor Gromov (currently Bruker BioSpin, Germany).2 The imaging and realtime communication capabilities were developed in collaboration with the Center forEPR Imaging In Vivo Physiology at the University of Chicago and supported by theNational Institutes of Health (NIH) with grants P41-EB002034 and R01-CA98575 [5].
Marketing SpecMan4EPR is a commercial application marketed by Scientific SoftwareServices. One license for the most advanced software version called SpecMan4EPR Im!costs $ 4500 and the simplest software solution called SpecMan4EPR costs $ 3000. Allapplications include one year of support. The addition of a typical device driver, e.g.field controller or arbitrary waveform generator, costs $ 600. The addition of a highcomplexity device driver, e.g. digitizer or pulse generator, costs $ 1200. The projectstarted in late 2001 and is still active. It is programmed in C++ and LabVIEW.
Requirements It is developed as an imaging application which results in the followingcharacteristic requirements:
• Management of complicated pulse sequencesImaging experiments involve the programming of pulse sequences. For imagingexperiments pulse sequences can become complicated. SpecMan4EPR providesthe user a Pulse Programming Language (PPL) that manages the different pulses.
1 http://scientific-software.com/2 http://SpecMan4EPR.com/
16

2.3 Related Work
An additional feature then creates the pulse sequence, optimizes it, and programsthe pulse generators accordingly.
• Handling of a large amount of dataImaging experiments tend to create data in the order of hundreds of megabytes.Consequently data is saved using a binary file format called TDMS instead of theASCII file format. Binary file formats allow faster access times what considerablyreduces the processing time for large data sets. As of August 2010 SpecMan4EPRis able to handle data of up to 600MB and the implementation of data sets inthe range of gigabytes is being developed.
Structural Approach Their spectrometer is composed of several Personal Computers(PCs) that are connected via a network. Each PC fulfils a specific sub task of theapplication, e.g. process server, data server, or driver, in order to balance the processingload. PCs running a driver are connected to an instrument while the process and datacomputers are dedicated network servers. The process server is communicating withall other computers to control them in accordance to the experiment specification. Thedata server receives and saves the experiments’ measurement data via the networkfrom each PC that is connected to a data acquisition instrument.The Graphical User Interface (GUI) connects to the central process server via
TCP/IP. Hence it is possible to remotely control an experiment.
Additional Benefits Instruments can be exchanged since the drivers are not imple-mented as part of the program. Instead they can be assigned as needed.Experiments are created via the GUI and then transmitted to the process server.
17


3 AnalysisThis chapter contains a detailed problem definition, names the requirements andconstraints of a solution, discusses the relevance of already existing works to this topic,and closes by summarizing the most important information.
3.1 Problem DefinitionAs discussed in Section 1.1 the goal of MCW’s Biophysics Department is to improve theperformance of EPR spectroscopy. From this goal it is evident that the repeatability ofexperiments and their precise control are the indispensable prerequisites for success ofprojects in this field. A versatile solution has to be found for handling the multitude ofexperiments and frequency bands, each requiring a different set of hardware and controlsoftware. In addition, an optimal usability, in terms of GUI feedback, responsiveness,and reliability, as well as long-term maintainability and ease of future extension, areprerequisites for acceptance by the users and the future programmers that will maintainthe software.
From this, three categories can be distinguished and its requirements formulated asfollows:
• Program Structure– Enable modularity and flexibility– Ease of future modification by providing a path for expansion– Improve maintainability
• Graphical User Interface (GUI)– Simplify displays– Common interfaces across experiments– Increase responsiveness to operator actions
• Improved Execution Responsiveness– Take advantage of 64-bit platforms
19

3 Analysis
– Take advantage of multi-core processors– Take advantage of multithreading and parallelism– Avoid polling wherever possible
These subjects are described in more detail in the following section.
3.2 RequirementsProgram Structure The software should be thought of as a large scale application. Theconcept of a large scale application forces design patterns, that result in software withproperties that are highly beneficial for this project.It enables modularity and flexibility, thereby reducing the memory footprint and
improving maintainability. Likewise, making modifications in the future is made easyby following design patterns and using good programming style ensuring clear code.
Polling is avoided wherever possible. This results in a highly responsive user interface.
Graphical User Interface To make the orientation and therefore the navigation easierfor operators that are switching experiments, a common interface across all experimentsshould be provided.
Additionally, displays should provide all necessary information but be kept as simpleas possible to make their use as intuitive as possible.
The user must be informed of the current state of the program anytime there is aninteraction with the GUI. For example, the increase of a parameter value must resultin a proper notification of some kind, if the value could not be set. This also includesthe generation of meaningful error messages.
Improved Execution Responsiveness In order to improve the execution responsivenessthe software should be a native 64-bit application. However, some instrument driversmay not be available as a 64-bit version. Therefore, the application should also beable to incorporate 32-bit drivers. Furthermore, it should take advantage of multi-coreprocessors as well as multithreading and parallelism. This will allow the application tobenefit from future PC architectures that will primarily be characterized by a risingnumber of cores [22].
20
3.3 Discussion of Related Work
3.3 Discussion of Related WorkThis section discusses the relevance of applications, described as related work inSection 2.3, with regard to the previously defined requirements.
Software Specific Requirements Comparing the requirements with the capability pro-vided by the presented applications, three conflicting topics can be identified. Thesetopics state what the application must support but most programs do not deal with:
• Exchange of instruments• Storing of instrument selection and parameters for each experiment• Easy future program extension by the customer
In order to improve the performance of EPR spectroscopy, the redesign of certainspectrometer parts is necessary. From this arises the need to comfortably exchangeinstruments. This requires an open spectrometer hardware platform and either a largebase of drivers for all possibly required instruments or the opportunity to integratenew drivers. Since different hardware configurations are possible, the currently usedinstrument selection and parameters must be stored for each experiment.
The way experiments in a research environment are performed is subject to change.Old techniques are improved and new ones are developed. Therefore, the ease offuture extension is a substantial requirement for any application used in a researchenvironment. It ensures the flexibility needed in order to fulfil deadlines and meetdevelopment goals. Using code that promotes cost-effective solutions with shortdevelopment cycles which is necessary to stay ahead in research.
Another aspect is the application type. The MCW’s biophysics research departmentneeds a common framework that can be used for all experiments which use spectrometerhardware with nonproprietary hardware interfaces. Such an application should providean abstraction layer that allows an easy access to the underlying complexity which arisesfrom different experiment types and different instruments used across the experiments.It should provide a versatile base to make the development of new experiment typessimpler and faster by sharing instrument drivers and advanced features among allexperiments.The following paragraphs discuss the available software solutions with respect to
these critical requirements.
WinEPR WinEPR can not be used for all experiments or to implement new ones sinceit only works with Bruker’s proprietary hardware that has a proprietary hardware
21

3 Analysis
interface. Therefore the hardware can not be exchanged with standard componentsand the software cannot be modified. However, it allows to save parameters for futureexperiments.
If only this solution would be used, the whole research department would be restrictedto what Bruker’s application and hardware offer. Consequently Bruker’s approachdoes not meet the requirements.
EWWin EWWin supports all Varian, Bruker, and JEOL spectrometers. Otherspectrometers are supported by providing hardware that can interface with them. Thismeans it supports no open hardware setup composed of separate instruments connectedvia nonproprietary busses to the computer. It does support storing of parameters foreach experiment but it does not allow modifications of the program.Since it does not allow exchanging hardware, implementing new experiments, or
extending existing ones, EWWin does not fulfil the requirements.
SpecMan4EPR This application is designed for imaging spectroscopy which hasrequirements and goals that go in a different direction than the ones developed in thisthesis. For imaging applications the focus lies on different kinds of experiments, onthe handling of more data than it can be expected for EPR experiments, and on ahigher complexity regarding the pulse sequences used to control the instrumentation.As a result, SpecMan4EPR is limited to CW, pulse, and imaging experiments.
The program would cost a minimum of $ 3000 and there is a charge of $ 600 to$ 1200 for adding a new driver if it is not already included. Since the knowledge ofhow to implement a control and acquisition software is already available in the MCW’sDepartment of Biophysics, these costs do not seem reasonable. It takes about thesame amount of money to develop an in-house application that would have the decisiveadvantage of being tailored to the specified requirements.It cannot be used for all experiments in the department, it provides no storing
functionality, the price for drivers makes the exchange of hardware costly, and it cannot be modified to meet future needs. From this one can conclude that SpecMan4EPRdoes not meet the described requirements.
22

3.4 Summary
3.4 SummaryNone of the known applications fulfil the previously developed requirements, mostlybecause of the lack of the three mentioned key issues. In addition to that none of theprograms can provide an extendable framework to easily implement future experimentsand update existing ones. Therefore none of them is practical.
For this application area an internally developed software program can easily addressthese limiting factors and fulfil the requirements. Besides meeting the requirementsfurther benefits can be identified. An in-house development also reduces communicationbarriers, which lead to software that does not meet the specifications. Being able to im-plement newly developed types of experiments, contemporary and cost-effective withinthe department, avoids dependencies. Having the knowledge inside the departmentis a great advantage whenever fast or unique solutions are required. Consequently,continued in-house development is a very plausible solution.
23


4 ConceptThis chapter gives a detailed description of the approach taken to solve the problemdescribed in Section 1.1.The main design goals, with regard to the program structure, are:
• Implementation of several experiments in one program• Making instruments exchangeable• Ensuring maintainability and future extendability• Being able to use 32 and 64-bit drivers
In addition to these main goals, several other considerations are taken into account inthe course of this section.
The result of this design is a program structure that reflects the previously developedrequirements. Its implementation is presented in Chapter 5.
4.1 Fundamental Design ConsiderationsIn the course of the following section, the design decisions for the final program conceptare derived from the previously specified program requirements.
4.1.1 StructureThe overall goal is to design a versatile framework that abstracts the complexityintroduced by different instruments and experiments. In other words, one applicationthat can be used for all experiments on every spectrometer and that is easy to extend.This fundamental goal results in three design decisions:
• To use the same program for all experiments and to make it easily extandable,e.g. by sharing functions among experiments,↪→ all experiments and therefore all experiment GUIs are integrated in oneprogram.
25

4 Concept
• To use the same program with different instruments↪→ drivers are not part of the program core.
• To ensure maintainability and future extendability↪→ modularization is promoted to create reusable code.
4.1.2 FunctionalityA control and measurement application requires a method of experiment selection, anexperiment interface, and an instrument panel for control of all instrument parametersfor more advanced users. An administration panel allows configuration of the programsettings and a maintenance panel assists in trouble shooting. This results in thefollowing five broad program sections:
• Experiment selection panelStartup screen allowing the operator to select an experiment for the currentspectrometer.
• Experiment panelExperiment user interface that displays the controls needed to run the currentexperiment and displays the measurement results.
• Instrument panelAdvanced instrument user interface. It allows the operator to control all instru-ment parameters, rather than just the most common ones, of each instrumentused in the current experiment.
• Maintenance panelInformation screen with restricted access that informs the administrator aboutthe current state of the program by displaying the state of the software andcurrently processed data. It may assist in understanding the cause for unexpectedsoftware behaviour without the need to use a software debugger. This allowsimmediate corrective actions.
• Administration panelThis screen has restricted access and allows selecting an instrument for each taskin an experiment.
26

4.1 Fundamental Design Considerations
4.1.3 WorkflowWith this framework three general workflows are possible—one for each type of usage:
• Performing EPR measurements• Program maintenance• Program administration
Its main purpose is to provide the operator a reliable tool to make measurements. Theselection of instruments for any experiment can be changed by the administrator anda panel with debugging information can be opened.
Measurements The administrator preselects the spectrometer according to the hard-ware setup the measurement PC is part of. The operator can select one of theexperiments available for the current spectrometer. Since every experiment requires aspecific set of instruments, it is important to allow only those experiments which canbe performed with the currently connected hardware. After the operator selects oneof the experiments available for the current spectrometer, the program shows whichinstruments are connected, which are missing, and if a driver did not start. If a driverterminates unexpectedly, the operator is notified and can decide to restart the driveror continue working without it. Even if not all instruments are available, the user cancontinue.
If the user cancels the experiment selection, the drivers are terminated and a differentexperiment can be selected. When continuing, the user is directed to the experimentGUI. It loads a set of default instrument parameters from the default parameter fileassociated with the selected experiment. The default parameters can be modified andthe new instrument parameters can be saved to a parameter file. Each user can load acustomized set of default instrument parameters from a previously saved parameterfile.
When an instrument control is changed, its value is directly sent to the instrument.If the instrument supports reading out a given parameter value, the control on theGUI is updated with the value actually set by the instrument. If a value could not beset, the user is notified.
A user can switch to the instrument panel to control all implemented parameters ofthe instruments used in an experiment and be not limited to the most common ones.
Current measurement results and current instrument parameters can be saved to acommon spreadsheet file for post-processing. The current experiment can be cancelled
27

4 Concept
allowing return to the experiment selection on the main screen. Each interface providesa button to exit the application and terminate all drivers.
Maintenance Whenever needed, the operator can login as an administrator to gainaccess to the maintenance section of the program. It displays the data that is currentlybeing processed by the software. During normal operation it allows troubleshooting.During software development it assists in finding programming mistakes.
Administration The administration section is also restricted to administrator access.It can be accessed from any point within the program. This section allows selectionof the spectrometer and of the instrument for every task in each experiment for allspectrometers.
4.1.4 SpecificsThis section lists a number of specific concerns and the resulting design decisions.
The more experiments implemented, the more spectrometer systems need to besupported. Consequently the number of accessible drivers has to increase. Loading alldrivers regardless of the current hardware environment would take up an increasingamount of Random Access Memory (RAM), thereby increasing the load on the computerand slowing it down. Instead only drivers needed for the current hardware selectionshould be loaded.
• To reduce the application’s memory footprint↪→ drivers are loaded as modules on an as needed basis.
The application is designed for the use in a research environment with changinghardware. Hence, it should make the exchange of hardware as easy as possible.
• To make drivers and consequently instruments exchangeable↪→ generic commands are used that are the same for drivers/instruments of thesame device class, e.g. set frequency, set amplitude, read offset.↪→ management commands are the same for all drivers, e.g. set inst name, getstatus.
Sometimes the same instrument model is used twice in an experiment.
• To be able to control two instruments that use the same device driver↪→ it is possible to start several instances of the same driver.
28

4.1 Fundamental Design Considerations
It is important to document all experiment parameters. Besides the measurementresults this comprises the instrument parameters and sometimes additional notes. Thisallows one to comprehend what was done after the experiment is completed.
• To document all experiment parameters↪→ a report is generated containing the measured data, the instrument parameters,and additional optional notes.
• To document instrument parameters inside the application for instruments thathave no computer control↪→ a manual driver is used that merely receives the command and takes noaction.
Experiments are often run with the same or similar parameters. It therefore reducesthe workload and chance of typing errors if a set of default parameters can be storedand loaded later.
• To be able to change and save default program parameters↪→ configuration files are used to store program settings.
When not directly working with an instrument but controlling it remotely, it isimportant to have feedback on what is happening.
• To allow intuitive work with the experiment GUI↪→ if possible, the instrument controls display the values currently set on theinstrument.↪→ the operator is notified, in case of an error or unexpected event.
The operator needs to see what is measured as data is collected and to restart ameasurement with different parameters, if the result is not satisfactory.
• To give the operator immediate feedback on what is measured↪→ the driver sends a measured data point to the program core as soon as it isacquired.
64-bit computer hardware has become common now and is slowly replacing 32-bitcomputers.
• To take advantage of the additional processing power introduced by 64-bithardware↪→ the program core is implemented as a 64-bit application.
29

4 Concept
However, not all instrument drivers are available for the 64-bit platform.
• To allow 32-bit and 64-bit drivers↪→ each driver will be an executable that is separate from the program core andevery other driver.
4.2 Program StructureThis section takes above design decisions to develop the program structure.
4.2.1 Overall Program StructureIdentified structural parts:
• Experiment GUIs provide controls and indicators allowing the user to set instru-ment parameters and display measurement results.
• The program core contains all user interfaces, the experiment logic, and launchesthe drivers as needed.
• Drivers serve as an instrument interface to the program core.They translate commands like set amplitude to the actual commands send viathe instrument bus (LXI, GPIB) to the instrument.
• The instrument is connected to the PC via its specific instrument bus and awaitsinstrument specific commands that control its outputs and inputs.
Inter-Process Communication In order to execute the commands of the user, theprogram core issues commands to the driver. The driver is launched by the programcore and waits for commands. This results in the following communication chain:
User ↔ Experiment GUI ↔ Program Core ↔ Driver ↔ Instrument
All actions originate from the user. The user changes a control value on the GUIthat causes the program core to send a command to the driver which translates it forthe instrument. If the instrument allows read out of its parameters, the driver readsthe set parameter value, transmits it to the program core which displays it on the GUIfor the user to see. A client/server type of communication between program core anddrivers seems appropriate.
30

4.2 Program Structure
Resulting Interfaces
• Experiment GUI ↔ program core: internal program data flow• Program core ↔ driver: inter-process communication• Driver ↔ instrument: instrument bus
This concept is visualized in Figure 4.1 showing the overall application structure.
Figure 4.1: Overall application structure (concept)
4.2.2 Abstraction to Allow for Changing HardwareThis section lists the design decisions which allow the creation of an abstraction layerfor the instrument hardware.Changing hardware is handled by
• excluding drivers from the program core,• keeping the communication between drivers and the program core consistent
across different devices of the same type, and• understanding the task that one instrument fulfils in an experiment as an usage.
An experiment uses instruments which fulfil a certain task within the experiment.Other instruments exist that can fulfil the same task since they share the neededfunctionality. Such a task in an experiment is called a usage. The concept of usagesallows distinguishing the instrument from its job in the experiment. This allows
31

4 Concept
the assignment of different instruments to the same usage. Typical usages would befunction generator or field controller. Each usage has a set of parameters that have tobe controlled. Hence, any other instrument can be selected for this usage if it has thefunctionality to do the job and therefore an equivalent set of parameters. By keepingthe communication consistent, different function generator models and brands can stillbe addressed with the same command to set the amplitude and frequency. Since somefunction generators provide functionalities that others do not have, drivers for thesame instrument type share a subset of commands for the functionality that they havein common, but have different commands in addition to the common commands forfunctionalities they do not share.
The described nesting is visualized in Figure 4.2. It also shows that two experimentson the same spectrometer can have some usages in common and also have new ones.
Figure 4.2: Example for possible use of usages among experiments
32

4.3 Summary
4.3 SummaryThe most important results are summarized in the overall structure shown in Figure 4.1:
• GUIs are part of the main application,• drivers are separate executables that share a set of commands, and• usages are introduced by distinguishing instruments by their task in the experi-
ment.
33


5 ImplementationThe main application and drivers are implemented as described in Chapter 4. Thischapter therefore focusses on the overall implementation process, the implementedapplication structure, and the structure of key application parts. It describes theessential program parts in reasonable detail. It does not replace any of the otheravailable documentation:
• A description of the program flow is attached in the Appendix C.• For practical reasons a detailed program documentation is done by commenting
the source code found on the DVD attached as Appendix A. This way theprogrammer has all needed documentation at hand when programming and thedocumentation is inseparable from the program code.
• In case more details are needed on a certain topic, references to resources withmore details can be found in the respective section of this thesis.
This chapter starts with Section 5.1 introducing how the implementation was ap-proached in respect to the applied software development model and coding style.Section 5.2 discusses which LabVIEW technologies are used to implement the pro-gram and Section 5.3 gives a structural implementation overview. Afterwards theimplementation of key application parts is described in Sections 5.4 to 5.7.
5.1 IntroductionThis section describes how the program development was approached from an organi-zational point of view. The relation to the end user and the applied software modelare discussed in Section 5.1.1, while Section 5.1.2 describes the programming style.
5.1.1 Program Development ApproachEnd User The end user of the program has a key role in the development process.Ultimately, the goal is to deliver a software that fulfils the end user’s needs and is
35

5 Implementation
convenient to use. Joseph J. Ratke has experience in writing control and acquisitionsoftware for the scientists using the spectrometers. He thereby knows their needs andfunctions as the customer representative. To make sure the design is oriented towardthe needs of the end user, he was consulted several times during the developmentprocess in addition to the initial requirement phase.
Software Development Model To find a proper software development approach onehas to consider that both team members are new to the field of EPR and have nosignificant experience with LabVIEW. It is therefore safe to assume that one can nothave a complete overview of the task right from the beginning. Instead one has tolearn about the task while one is working on it. One is naturally becoming more awareof the end user’s needs, the implications of the requirements, and LabVIEW as onedesigns and implements the application. Therefore a cyclic development process isneeded that allows revision of the initial design based on what was learned during thedevelopment of previous versions of the system. This approach is found in the iterativeand incremental development which is a modified version of the waterfall softwaredevelopment model [2, pp. 182–184].The original waterfall model is not an option, since it demands the programmer
to fully complete one development step before the next one is started. The iterativeand incremental development model, however, develops a system in a cyclic process(iteratively) while generating only small program portions at a time (incremental). Ithas an initial planning phase and ends with installing it in the production environmentwhile performing these cyclic iterations in between. This process is illustrated inFigure 5.1.
Figure 5.1: Modified waterfall model
36
5.2 Discussion of LabVIEW Technologies
This resulted in the following development approach: After all requirements aredefined as well as possible, the program structure is designed and a basic applicationis written that implements the key requirements. Then the requirement list is used tostructure the iteration process. Each iteration step then implements one item fromthe requirement list. To make this work every implementation has to be as modular aspossible. From what was learned about LabVIEW’s features and the end user’s needsduring the development phase, the overall program logic was improved during eachiteration.
5.1.2 Programming StyleAs with text based programming languages, a good programming style also has tobe cultivated for LabVIEW’s graphical programming language called G. To learnabout good LabVIEW programming style Peter A. Blume’s LabVIEW style book1 wasused [3].The most important points that were incorporated in this project are how to
maintain clean G code, how to design the front panel, how to write and documentsubVIs properly, as well as a number of design patterns. Three design patterns had anexceptionally strong influence on the application’s appearance:
• The multiple-loop application framework• The use of shift registers instead of local or global variables• Functional Globals and Action Engines
5.2 Discussion of LabVIEW TechnologiesAfter selecting a development environment and designing the program structure theconcept is implemented. This means that the LabVIEW technology has to be selectedthat fits best for each purpose in question. For each purpose all possible LabVIEWtechnologies are listed and then evaluated with regard to their suitability.
1 http://bloomy.com/lvstyle/
37

5 Implementation
5.2.1 Integration of Experiment GUIs into one ProgramGoal The goal is to integrate all experiment interfaces into one program while main-taining an easily understandable structure.
Technologies Two LabVIEW technologies are evaluated for this task:
• Subpanel ControlsAllow the integration of the front panel of a subVI into the front panel of acalling VI.
• Tab ControlsAllow placement of controls in an area and only display those on the same tab.Consists of pages and tabs. Related controls are placed on the same page whichcan be selected by the tab.
Evaluation When subpanel controls are compared to tab controls they have no realbenefits. For example, with subpanels controls and data are encapsulated in the subVIsfor each instrument but the control values and data of all instruments have to becombined anyway to save the default instrument parameter file or the measurementreport. When using tab controls all controls are directly present in the main VI.Although there are no real benefits, there are some drawbacks:
• Accessing subpanel controls programmatically and reacting to events in subpanelcontrols is more complicated than with tab controls.One has to use a Value (Signaling) property node to generate the value changeevent that can be detected by the event handler. For this property node thereference of the control on the subVI’s front panel is needed. This reference hasto be extracted in several steps from the reference to the subVI [13].
• Subpanel controls tend to have a higher CPU usage than tab controls whenupdated [12]. This is especially true for nested subpanel controls.
• The front panel of a VI is only visible in a subpanel if the calling VI is running.It therefore is easy to lose the overview of the implemented interfaces. In otherwords: It is easier to keep the overview with tab controls, since all controls arepresent at all times. Note: With tab controls resources are only spent on controlscurrently displayed although controls not currently displayed are loaded intomemory.
• Using subpanel controls only allows organizing the instrument controls groupedby instruments.
38

5.2 Discussion of LabVIEW Technologies
Furthermore, all instrument controls would be visible at all times. This includesthe controls for those parameters that are only needed in exceptional cases andthereby clutters the interface.
• Using subpanel controls alone makes it difficult to display experiments that havemore than one screen.Using them in combination with tab controls or loading subpanels that have but-tons to load other subpanels in the first subpanel would make it more complicatedthan using tab controls at the first place.
Decision Because subpanel controls have many drawbacks and no real benefits overtab controls, tab controls are used. Using nested tab controls provides an intuitivestructure for the GUI organization: All interfaces can be accessed without runningthe main application and are structured in a logical way. The experiment controlsare found on the page of the respective experiment which itself is on the page of theselected spectrometer.
5.2.2 Internal Communication FrameworkGoal The goal is to take advantage of the following points to provide a reasonablebasis for the implementation of the discussed concept:
• Event-driven processingto avoid polling, which would utilize CPU time, andto promote asynchronous processing of data.
• Bufferingto make sure that all produced data is received. No data is lost if a producer(DAQ device) generates a lot of data that is then processed by the consumerwhile another producer sends data to the consumer.
• Parallelismto take advantage of future PC architectures with an increasing number ofcores and be able to process data in the background and perform networkcommunication without affecting the GUI responsiveness or other tasks. Improvedparallelism results in faster overall execution speed and greater responsiveness.
Technologies Two approaches are evaluated for this task:• Event-Driven State Machine
The event-driven state machine uses an event handler structure to react on events.
39

5 Implementation
This structure only executes when an event is registered and is in a locked stateotherwise.However, only a sequence of events can be executed but no parallel tasks. Theorder is determined programmatically [3, pp. 262–264].Furthermore, a queue is used to buffer elements.
• Multiple-Loop Application FrameworkThe multiple-loop application framework is an event-driven architecture withparallel loops for each cohesive parallel task. Parallel loops communicate using aqueue-based messaging scheme [3, pp. 278–283].
Evaluation The event-driven state machine is suitable for applications with mediumcomplexity, since only one state is executed at a time which prevents parallel codeexecution. The multiple-loop application framework processes tasks in parallel byproviding several parallel loops. This makes it suitable for large applications withprocesses that have to be executed in parallel, e.g. data acquisition, transmitting data,receiving data, data processing, and error handling.
Decision Based on above considerations the multiple-loop application framework isthe optimal framework for the implementation of the required concepts.Details on queued state machines can be found at http://expressionflow.com/
2007/10/01/labview-queued-state-machine-architecture/.
5.2.3 Inter-Process Communication FrameworkGoal The goal is to have a reliable, easy to use, low-maintenance, flexible, and fastcommunication between the program core and each driver. It is not planned to havethe main application and drivers running on different machines across the network.Nevertheless, this might change in the future and a solution should be selected that isflexible enough to allow such a requirement change. Currently there is also no need fora deterministic data transfer, which is unlikely to change.
Technologies In order to communicate between applications on the same computer anetworking technology is needed. Four technologies were evaluated for this task:
• User Datagram Protocol (UDP)UDP is a low-level connectionless network protocol that does not guarantee thereception of sent data. It is therefore suited best for fast communication that
40

5.2 Discussion of LabVIEW Technologies
can accept a few lost packages as well as broadcasting, i.e. the transmission ofdata to a large number of hosts [20].
• Transmission Control Protocol (TCP)TCP is a low-level connection-based protocol that ensures reliable data transmis-sion. The connection establishment takes some time which makes it work best forapplications where not speed but reliable data transfer is most important [20].
• Shared Variables (SVs)Shared variables offer the highest abstraction of network communication from theblock diagram: One can use them just like global variables by inputting a valueat one place and reading it out at another place. They offer more functionalitythan simple global variables by providing optional network communication andbuffering of messages.There are two types of SVs that are interesting for this project: Single-Process(SP) and Network-Published (NP) shared variables SP-SV’s communication isrestricted to other processes on the local host while NP-SVs allow to communicatewith processes on different machines on the network. The background work ishandled by the Shared Variable Engine (SVE). This is a process that runs in thebackground to manage the Shared Variable communication.The SVE uses UDP to publish the NP-SVs available on the local host to thenetwork. For data transmission a proprietary in TCP encapsulated protocolcalled NI-PSP is used [6, 21].
• Simple TCP/IP Messaging (STM)STM is a command-based communication design pattern for data producer/-consumer applications. It provides a customizable framework written in G codewhich implements the comfortable sending and receiving of commands and pa-rameters using TCP, UDP, or serial communication interfaces. The commandtells the receiver how to process the received parameter data. By hiding thecustomizable transport layer implementation details from the programmer theamount of code in the main application, needed to implement a communicationchannel, is reduced.The header is formed from an array of meta-data which is transmitted only onceduring the connection establishment. Afterwards only the index pointing to therespective element is transmitted resulting in a small overhead, i.e. header topayload ratio.Its focus lies on high performance data transmission instead of ease of use, thegoal of shared variables, and is specifically designed for streaming data over the
41

5 Implementation
network. It provides code to manage multiple client connections.Since standard communication protocols are used, STM allows LabVIEW appli-cations to communicate with programs written in other programming languages.The STM Read Message VI sleeps until data is received. Consequently, no CPUtime is wasted by polling for received packages. The processing receiver loop isdriven at the rate of incoming data [9, 11, 16].
Evaluation Initially one has to answer the question whether TCP is fast enough or ifUDP has to be used to transmit the acquired data from a driver to the main application.To answer this question, a TCP benchmark was performed on the computer used fordeveloping the software (Microsoft Windows 7, dual hexa-core CPU, 12GB RAM).It shows that TCP provides a minimum throughput of 90MB/s and a maximumthroughput of 119MB/s. As shown in Appendix F these rates are sufficiently high.The ultimate exclusion criterion for UDP is that it does not make sure that send
data is received which is a crucial requirement for measurement applications.Although TCP itself qualifies as the basis for the inter-process communication, it is
a low-level communication implementation. If only TCP would be used to implementthe communication for applications with many data items and multiple connections,a large amount of additional work would be required to handle the abstraction fromthe raw data transmission. This additional work results in more code and introducescomplexity that needs to be handled. Shared variables and STM both provide asolution for this problem.When compared to TCP, SVs have a relatively large header. Therefore, shared
variable’s network performance is slower than TCP’s. For large payloads they arecomparable, since the header to payload ratio decreases for larger payloads. Sharedvariables are not designed for fast streaming of small data packages, e.g. single datapoints. Additionally, the shared variable engine has to run in the background whichneeds additional memory and puts an additional load on the CPU. The final exclusioncriterion for shared variables are their known issues which make them unreliable insome applications or at least introduce additional maintenance work [24].STM provides an abstraction of the underlying transport protocol to provide the
mentioned command-based communication design pattern. Furthermore, its smallheader and use of TCP makes it a good solution for fast and reliable transfer ofsmall data packages. STM thereby avoids the exclusion criteria for UDP, TCP, andshared variables. Additionally, STM uses polymorphic VIs which allow switching thetransport layer without making noteworthy changes to the program source code. It
42

5.2 Discussion of LabVIEW Technologies
also allows the programmer to customize the STM functionality according to currentneeds, thereby ensuring flexibility and future reliability.
Decision One can conclude:
• UDP ensures no reliable data transmission• TCP provides a fast but complicated implementation• Shared variables are easy to use but not reliable and have a large overhead for
small data packages• STM avoids the above issues and is flexible enough to ensure future reliability
Based on these considerations STM is used to implement the communication betweenthe program core and each driver.
5.2.4 Driver as a ModuleGoal To handle the drivers in a reasonable way, the following points have to be met:
• While the main application runs in a 64-bit environment, it has to be possibleto run drivers in either a 64-bit or 32-bit environment. The 32-bit supportis important to be able to use older LabVIEW drivers. For example, mostLabVIEW drivers for GPIB instruments are 32-bit and will most likely never beavailable in a 64-bit version.
• It has to be possible to launch the same driver more than once, in case the currentexperiment uses two or more instruments with the same LabVIEW driver.
Technologies In general, one can either execute LabVIEW code as a VI or build anEXE file using the LabVIEW application builder.
Evaluation The following points illustrate the comparison of EXE and VI capabilities:
• EXEs only require the LabVIEW run-time engine for execution. VIs need thefull LabVIEW development environment.
• An EXE is compiled either as 32 or 64-bit binary and can then easily be calledby other LavbVIEW programs via the System Exec function block. To call aVI one first has to know in which environment it must be executed. One wouldthen call the respective 32 or 64-bit LabVIEW binary with the path to the VI asan argument.
43

5 Implementation
• EXEs execute faster than VIs.• It is possible to completely hide an EXE from the user. This includes the front
panel and the taskbar entry instead of just the front panel, as for a VI [10].
It is desirable to need only the LabVIEW run-time engine. One would otherwise need alicense for every PC on which one wants to execute the written VIs. It greatly reducescomplexity when drivers can be called directly instead of calling the correct LabVIEWbinary with the path to the driver as an argument. Finally, being able to completelyhide the drivers from the user reduces the distraction caused by additional taskbarentries without an user interface.
Decision Based on above considerations, the LabVIEW application builder is used tocreate EXE files for the main application and all drivers. Depending on the LabVIEWdriver requirements, drivers are compiled as either 64 or 32-bit binaries.
5.2.5 SummaryThe final overall application structure, showing the selected LabVIEW technologies, isshown in Figure 5.2.
Figure 5.2: Overall application structure (implementation)
44

5.3 Implementation Overview
5.3 Implementation OverviewThis section provides an overview of the implemented application structure to givea general understanding of how the software works. It starts with an explanation ofthe GUI implementation and continues with a description of what happens in thebackground when the GUI is used.
5.3.1 Description of GUI ImplementationStructure The graphical user interface is implemented with nested tab controls. Onetab control called the outer tab contains all other tab controls. Each page of this maintab control represents a key section of the application software:
• Exp SelectionThe Startup screen. From here the operator can select an experiment and seewhich instruments are available.
• Exp GUIsActual experiment interface with displays, commonly used instrument controls,indicators, and buttons to save a measurement report and the current parameters.
• InstrumentsInterfaces to control all implemented instrument parameters of the instrumentsused in the respective experiment.
• MaintenanceDisplays currently processed data, e.g. names of all connected drivers, togetherwith the respective usage name, current queue elements, and a list of commandssent.
• AdminSelect the current spectrometer and assign an instrument to each usage of everyspectrometer.
Table 5.1 shows how the tabs are organized. For example, the experiment GUI isorganized such that every spectrometer has its own page. On every of those pagesa tab control is found that holds the respective experiment interfaces. For L-Bandthese are CW sim and Pure Absorption Rapid Scan (PARS). The implemented CWexperiment interface holds another tab control for each part of the experiment.Figures 5.3 to 5.7 show how every section’s implementation looks like.
45

5 Implementation
Table 5.1: Structure of nested tab controls in the outer tab tab controlSections Spectrometer Tabs Experiment Tabs Measurement TabsExp Selection ⇒ S-Band Experiment selection buttons:
⇒ X-Band⇒ L-Band → CW sim, PARS⇒ Q-Band⇒ W-Band
Exp GUIs ⇒ S-Band⇒ X-Band⇒ L-Band → CW sim → Collection
↪→ Parameters↪→ Patrick↪→ Varian
↪→ PARS⇒ Q-Band⇒ W-Band
Instruments ⇒ S-Band⇒ X-Band⇒ L-Band → CW sim
↪→ PARS⇒ Q-Band⇒ W-Band
Maintenance No tab controls
Admin ⇒ S-Band Pages contain one cluster for each experiment.⇒ X-Band Inside the cluster, there is one control for⇒ L-Band each usage to select an instrument⇒ Q-Band for that usage.⇒ W-Band
46

5.3 Implementation Overview
Figure 5.3: outer tab tab control showing the Exp Selection page
47

5 Implementation
Figure 5.4: outer tab tab control showing the Exp GUIs page
48

5.3 Implementation Overview
Figure 5.5: outer tab tab control showing the Instruments page
49

5 Implementation
Figure 5.6: outer tab tab control showing the Maintenance page
50

5.3 Implementation Overview
Figure 5.7: outer tab tab control showing the Admin page
51

5 Implementation
The order of tabs can be changed as needed, since not the tab’s index but its nameis used for identification.All tabs, except those which are part of the experiment interface, are hidden from
the operator when the application is running. The operator moves via button clicksbetween the tab pages. Depending on the set spectrometer and experiment selection,the operator gets to different pages via the same button click.There are three different levels of button visibility:
• Visible from every screen:Exit Application button
• Visible from more than one screen: Load and Save instrument parameters andSwitch to Instrument Panel buttons in case of the experiment panel. Switch toExperiment Panel button in case of the instrument panel.
• Visible from only the current screen: In all other cases
Furthermore, buttons might be visible, but disabled by the software, until it makessense for the user to use them. This way the program can communicate to the userwhat happens internally.
Naming Conventions It exists the need to identify the purpose of controls and indicatorsin order to programmatically organize the program flow and take proper actions. Forexample, there are three different kinds of experiment controls:
• Buttons that cause the main program to do something experiment related, e.g.saving a report or deleting all current averages.
• Buttons that send a command to the driver.• Instrument controls that control the instrument parameters.
All these controls have to be connected to the correct usage and the command, thatshould be executed. Connecting them to the correct usage is done by groupingthem in clusters. The labels of the clusters contain the usage name and an identifierthat determines what type of controls are in the cluster. The usage is needed toprogrammatically assign the controls to the correct usage and the identifier is neededto group them correctly inside the usage. This allows the programmer to handle themin an easy way.
Since the instrument controls on the experiment panel and instrument panel shouldupdate each other if one changes, the instrument panel clusters need a different identifierthan the experiment panel clusters. In case an instrument panel control changes, the
52

5.3 Implementation Overview
reference for the respective experiment panel control is determined and used to updatethat panel control.The resulting naming convention for all clusters is shown in Table 5.2:
Table 5.2: Overview of cluster naming conventionNaming Convention Content<usage>.local Buttons triggering local code execution<usage>.cmd Buttons sending a command to the driver<usage>.set Numeric controls sending a command and parameter
value to the driver (experiment panel)<usage>.inst Numeric controls sending a command and parameter
value to the driver (instrument panel)
The label of controls in the local clusters are the names of the cases that should becalled in the main program. cmd plus the label of controls in a cluster of type cmdare the commands that are send to the driver. For clusters of type set and inst thecommand send to the driver consists of the command prefix set and the label of thecontrol inside the cluster.To be able to arrange the instrument controls as needed on the experiment user
interface, one has to be able to have several instrument control clusters. To tell thesoftware that it should look for more clusters of that usage, a dot together with anincremented number starting with 1 is appended to the original cluster name. Thisresults in clusters called <usage>.set.1 and <usage>.set.2.The instrument panel only contains instrument controls.In addition to that, indicators exist that display measurement results and the status
of the measurement process. Indicators have to receive the correct data from thecorrect usage. For example, if the driver that is connected to a usage called adc returnsdata with the command return data to the main program, the indicator that displaysthis data is called data.adc.Figure 5.8 visualizes this concept for the experiment and instrument panel.
53

5 Implementation
Figure 5.8: Cluster and indicator naming convention
5.3.2 Program Flow and Description of Background ProcessesIn the following the program work flow and background process taking place whileusing the software are explained. A detailed explanation of the program flow can befound in Appendix C.
Program Start Before the first user interaction can happen, the system has to initializeitself by performing a number of steps:
• Delete old data (flush queues and memory of internal data structures)• Initialize GUI (reset tabs and displays, make tabs invisible)• Read current spectrometer and set the experiment selection accordingly• Read which instrument is selected for which usage and populate the admin panel
accordingly This allows the administrator to change the instrument assignmentsfor all usages. Otherwise, the administrator would have to select every experimentfor which the instrument assignment should be changed.
54

5.3 Implementation Overview
Experiment Selection by User After the program was initialized, it waits for the firstuser interaction. The user may either select an experiment or activate the adminaccount to go to the admin panel and change the instrument selection. If the userselects an experiment the drivers for that experiment are started:
• Read necessary information from default experiment INI file for connecting tothe instrument: Instrument name, driver’s EXE name, and instrument’s resourcename, i.e. IP respectively GPIB address.
• Register a new connection with the TCP port inside the application using themodified STM connection manager.
• Write the registered TCP port to the text_based_variable.ini, see Listing E.2in Appendix E, inside a section called like the EXE file. Note: This file’s contentis deleted at program start.
• Call EXE file.• As soon as the driver started, it reads the port from the respective section of
the text_based_variable.ini, and writes a checksum into the same section.Then waits a short period of time and reads the checksum back. If it is still thesame checksum, it deletes the port from the file and opens this port for the mainprogram to connect to. This method allows to detect the case that to identicaldrivers started shortly after each other and try to use the same port, becauseonly one of them will ever be able to read back the correct checksum. Sincethe drivers themselves are interchangeable, it is unimportant which connects towhich port as long as the port was read from the INI file section with the driver’sname.
• The main program now tries to connect to the driver. If it fails, an element isput on the queue that will cause the main program to try it again later.
• As soon as the connection is established, the connection information is added tothe connection manager: Driver and usage name as well as the STM connectioninformation needed to handle the connection.
• The instrument name and resource name are send to the driver on the respectiveport.
• Finally, the driver is queried for its instrument type and status, i.e. connectivityof the driver to the instrument and the instrument name, that is displayed onthe experiment selection page in the list of available devices.
55

5 Implementation
Cancel Experiment Selection If the user decides to run a different experiment, thecurrent experiment selection can be canceled by clicking on the Select DifferentExperiment button.
• This triggers the shutdown of all started drivers by sending each of them thecmd shutdown command.
• To probe if the driver still runs, the same shutdown command is send repeatedlyto the driver, until an error occurs, that indicates a failed connection attempt.
• As soon as this error is detected the previously registered driver connection isremoved from the STM connection manager.
• After all drivers terminated, the queues are flushed and the display of availabledevices is updated.
Proceed to Experiment GUI The button to proceed to the experiment GUI is disableduntil the main application connected to at least one driver. Then the user can click onthe Proceed to GUI button to display the experiment interface.
• The application stops all attempts to connect to drivers it could not connect toyet, because the user decided to continue without using them. Therefore theno resources should be spend on further connection attempts. All incompleteconnection entries are removed from the STM connection manager.
• After all tabs and sub tabs are set according to the user’s selection, the maintab is changed to Exp GUI to display the experiment interface.
• The references to all controls and indicators on the instrument and experimentpanel are saved using the discussed naming conventions.
• The default instrument parameters are loaded from the default experiment INIfile into the instrument and experiment panel. Its filename consists of the setspectrometer and the selected experiment. Therefore it can be derived from theuser’s selection.
• Finally, init cases for each instrument depending on the previously read instrumenttype are called. In the currently implemented CW experiment this is used toinitialize the data acquisition memory, to make sure old averages are deleted.
Switch to Instrument Interface As soon as the user is on the experiment interface theinstrument interface can be accessed. This is done by clicking on the button Switch toInstrument Panel. To get back, the instrument panel contains a button called Switchto Experiment Panel.
56

5.3 Implementation Overview
Switching between instrument and experiment interfaces is implemented by append-ing the label of the respective control to a command string which is processed by theset tabs case.
Loading and Saving Instrument Parameters As long as the user is on the experimentinterface, instrument parameters can be loaded from and saved to user specified INIfiles.
The loading and saving is handled by two different cases which get the path to thefile as an argument. In the case where parameters are loaded from the INI file, theyare first written into the instrument and experiment controls and then automaticallyset on the respective instrument.
Instrument Parameters The user can control the instrument parameters by changingthe instrument controls on the experiment and instrument panel.To detect the change of an instrument control, a nested event handler loop is
used. The outer loop detects the change of an element inside the cluster, the innercase detects the change of the control itself. When the user changes the value of aninstrument control the respective event handler case for that cluster and control fires.All necessary information to handle this event programmatically, i.e. the usage thisaction is connected to and the command to send, is encoded in the cluster label andcontrol label. Inside the event handler this information is used to put an element onthe queue that sends the command and parameter to the respective driver. Afterwardseither the instrument panel control or experiment panel control has to be updated,depending on on which panel the user changed the control value.
Perform Measurement Besides changing instrument parameters, measurements canbe performed that record and display data from the spectrometer. In the currentlyimplemented CW experiment, measurements are done on the Collection page of theexperiment interface shown in Figure 5.4. A measurement is done by clicking theMeasure button. The number of measurements to perform is set in the Requestedinstrument control at the bottom. The number of completed measurements is dis-played below. Every time the measurement button is clicked, the specified numberof measurements is done. By default, only one measurement is done. Each time ameasurement is done, the single measurement results are added up for averaging. TheDelete Averages button has to be pressed to delete the averaged data and start a newaverage. While the current measurement is accumulated, each received data point is
57

5 Implementation
displayed as soon as it is received. After a new average has be calculated successfullythe new average is displayed on the graph and a Excel XLS backup file is written thatcontains the new average data. As soon as the number of requested measurements iscompleted, the final set of averaged data is saved under a different file name.
View Processed Information The page displaying the currently processed informationis not part of the normal workflow. Normally only the experiment selection, theexperiment interface, and the instrument interface can be accessed. It therefore has tobe accessed by directly selecting the main tab called maintenance on the outer tab.For this the user needs to activate the administrator account to make the normallyhidden main tabs visible. In addition to the main tabs becoming visible, all other tabsbecome visible too and normally disabled buttons are enabled. This is done to makethe programmer’s debugging work as easy as possible. The administrator accountis activated by hitting F12 and typing in the administrator password. The defaultpassword is admin. It is hardcoded inside the application.
Assign Instruments to Usages and Selecting a Spectrometer Neither the Maintenancepage nor the Admin page is part of the normal user workflow. In order to access it,the user has to activate the administrator account and select the Admin tab fromthe outer tab control. On this page, one can select the spectrometer as well as theinstrument for each usage.When the spectrometer is changed, the new spectrometer name is written to the
spectrometer.ini file and all respective tabs are updated. Afterwards the systeminitializes itself as described in the startup phase.
In the case where an instrument selection is changed, the current spectrometer andexperiment are read from the admin spec tab in which the change occurred to writethe new value to the respective default experiment INI file.
Workflow Summary Figure 5.9 shows the described workflow. In the interest of clarityit does not show the branches that would be needed if the administrator account isactive.
58

5.3 Implementation Overview
Figure 5.9: Workflow when working with the GUI as a user
5.3.3 DriversThis section gives a short overview of the instruments for which a driver is implemented.Table 5.3 lists all three driver VIs with information about the respective instrument.
Table 5.3: Overview of implemented instrument driversDriver Name Instrument Instrument Type Bus Driver Typeni pci-6024e.vi NI PCI-6024E slow-speed ADC PCI NI DAQmxsrds345.vi SRS DS345 function generator GPIB GPIB commandsn8241a.vi Agilent N8241A AWG LXI 64-bit DLL
The NI PCI-6024E is a slow speed PCI digitizer that uses National Instrument’sDAQmx measurement solution to interface with the G code. The SRS DS345 isused as a function generator and uses LabVIEW’s GPIB send and receive functionblocks to communicate with the hardware. Agilent’s N8241A is a high speed AWGthat connects via LAN eXtensions for Instrumentation (LXI) using a 64-bit DLL forhardware function calls.
The driver’s structure is explained in Section 5.5.2 and the driver’s program flow isshown in Appendix C.2.
59

5 Implementation
5.4 STM ImplementationAll implementation relevant information was introduced in Section 5.2.3 as part ofthe technology evaluation for the inter-process communication framework. Resourceswith detailed information on the STM functions and implementation were referenced.This section explains how STM influences the main program’s and driver’s parallelloop structure and shows which modifications are necessary to implement STM forthis application. For this application the STM 2.0 Reference Library is used [18].
Communication Framework STM is a design pattern that implements a simple dataproducer/consumer system. It uses a command and parameter string to communicate.The desired data is transmitted in the parameter string while the command string tellsthe receiver how to handle the received data.The interaction between client and server is implemented as follows:
• The server is the data producer.It waits for the client to connect, sends its meta-data defining the set of validcommands that can be used to exchange information, and uses one of thesecommands to send its generated data to the client.
• The client is the data consumer.It tries to connect to the server, reads the meta-data, and then reads and displaysthe received data.
For this design pattern the main program is the client and the driver is the server.This concept is implemented using the client and server parallel loop structure shownin Figure 5.10 [9]. It shows the loops necessary to implement the STM design pattern.
Figure 5.10: STM client/server communication framework
60

5.4 STM Implementation
These loops can be found in modified form in the main program and drivers.The server’s command parser receives the commands from the client and translates
them to specific actions inside the server. It thereby provides an abstraction layerbetween the commands received from the client and the actual actions performed bythe server. This allows one to send the server a generic command like start acquisitionand let the server handle the details of how the command is carried out.
The medium priority task and high priority task are handled in two separate loops.The medium priority loop handles more than one task while the high priority loop isdedicated to the main function of that driver, e.g. data acquisition.
See Section 5.5 for a detailed explanation of the loops and their interaction in boththe main program and the driver.
Command Convention To organize the communication between the main program anddrivers a command prefix convention is introduced.
Table 5.4: Client/server command prefix conventionType of Command Write ReadParameter set getData send readResponse return —Trigger code execution cmd
For sending parameters the command prefix set is used resulting in the commandset <parameter name>. Reading a parameter is done with the get command prefix.This principle is the same for sending and requesting data. To trigger the executionof a specific routine cmd <case name> is send. If a specific code part within thatcase should be triggered, one or more case names can be appended with a dot to formset <case1>.<case2>.<case3>. The return command prefix is used to emphasizethat the send data is the response to an earlier received command. If the instrumentsupports the parameters to be read, a set command will be answered with a returncommand containing the value set by the instrument. Acquired data and responses toget commands are always send with a return command.Commands that are common to every driver are those used during the driver’s
startup phase: set inst name, set resc name, get status, and return status. Furthermore,drivers share a subset of identical commands for the functionality they have in common.Drivers for function generators always have to implement commands for setting thewaveform and amplitude. This allows the client to expect the same result although
61

5 Implementation
different drivers and instruments are used. For functionalities they do not sharedifferent additional commands are implemented.
Modifications The original STM design pattern is modified to
• handle multiple server connections instead of multiple client connections and• handle the data type of the transmitted data automatically.
To handle multiple server connections the STM connection manager and affectedVIs have to be modified to handle additional information and provide additionalfunctionality. In order to automatically handle the data type of the transmitted data,the data type of the STM parameter was changed from string to variant [15]. For thisthe variant’s typestring, used to decode the data in the receiver, is sent in addition tothe desired data. It is implemented so that it is transparent to the programmer.
All modifications of the original STM library are documented in detail in Appendix D.
5.5 Main Program and Driver StructureWith STM, the main program acts as the client and the drivers act as the servers.The parallel loop structure of the main program and the drivers is developed from theSTM client/server communication framework shown in Figure 5.10. Additional loopshad to be implemented to reflect the special needs of this project.
The main program’s structure is described in Section 5.5.1 and the driver’s structurein Section 5.5.2. Figures 5.12 and 5.11 show the actual implementation of this structure.The function blocks inside the case structures are removed to make all loops fit on onepage.
5.5.1 Main ProgramThe main program uses two queues to communicate among its five parallel loops:
• Main QueueUsed to communicate between the transmitter loop, event handler loop, receiverloop, and main loop
• Error QueueDedicated to the transmission of error codes to the error loop
62
5.5 Main Program and Driver Structure
A subVI called loop_compare.vi is used to allow multiple listeners, i.e. transmitterand main loop, on the main queue. It checks if the current loop name matches thename of the receiving loop that is encoded inside the transmitted queue element. Ifthat is the case, the element is dequeued. If an queue element contains a target loopthat does not exist, a pop-up message is displayed containing the invalid target loopname.The tasks of the five parallel loops are as follows:
Transmitter Loop To ensure an optimal performance, this loop has only two tasks:
• Forwarding of commands and parameter values to the specified driver• Terminating all drivers in case of a main program shutdown
Event Handler Loop The event handler loop is nested by up to four levels to detectfront panel events. To ensure a high GUI responsiveness, the event handler does notprocess the information. Instead the data is enqueued for the respective processing loop.In case of a changing instrument control it sends the command and new parametervalue to
• the transmitter, so it is set on the instrument, and• to main, in order to set the equivalent instrument control on the instrument
panel or the experiment panel—depending on which control was changed by theuser.
Receiver Loop The receiver loop is periodically checking for new messages from thedrivers. New data is forwarded to the receive case in the main loop. Additionally, atevery 1000-th execution, it checks the connection status of all server connections. If aconnection loss is detected, an element is enqueued for the error loop to generate apop-up message and ask the user if the driver should be restarted. In case the userdecides to restart the driver, an element will be put on the queue for the transmitterto restart the driver.
Main Loop The main loop contains the actual main program routines. They control
• the program initialization on startup and after a spectrometer change,• the loading and saving of user and default instrument parameters,• the setting of the active tabs,
63

5 Implementation
• the updating of instrument controls,• the storing of references to all instrument controls,• the main program and driver shutdown,• the handling and processing of acquired data from the drivers,• and the start and termination of drivers.
To communicate with the drivers, the respective data is enqueued for the transmitter.
Error Loop The error loop is used for exception handling. It receives an error codeand takes the proper actions.
Summary To summarize the structural description, the following list clarifies how theloops are interrelated:
• TransmitterEither forwards commands and parameter values to the specified driver orterminates all drivers in case of a main program shutdown. As a part of ashutdown it fires the respective cases in main to complete a restart or shutdown.
• Event HandlerDetects user interface events and fires the respective event cases. It tells the trans-mitter to set new parameters on the instrument and main to update instrumentcontrols, start drivers, update the tab selection, etc.
• ReceiverPeriodically checks for new data from all connected drivers and sends it directlyto main.
• MainContains main control routines that are either fired by itself, the event handler, orthe transmitter loop. It sends commands and parameter values to the transmitterloop and error codes to the error loop. It receives data from the receiver loop tobe processed.
• ErrorCatches errors and takes proper actions (exception handling)
Figure 5.11 shows how the implementation of the described structure looks like.
64

5.5 Main Program and Driver Structure
Figure 5.11: Implementation of the main program’s parallel loop structure
65
5 Implementation
5.5.2 DriverThere are two types of drivers: Those that control data acquisition devices and thosethat do not. The drivers for DAQ devices are more complicated, because they needthe additional capability of acquiring and sending data back as efficiently as possible.In the following discussion, only the DAQ drivers are explained, since the simplerdrivers’ structure is identical to the DAQ drivers’ structure apart from the missingDAQ functionality.The DAQ driver, in the following just called driver, uses the following four queues
to transmit data internally between five parallel loops:
• Data QueueSolely dedicated to the transmission of acquired data from the high priority loop(DAQ) to the medium priority loop (transmitter)
• Medium Priority QueueForwards commands from the command parser loop to the medium priority loop(processor)
• High Priority QueueForwards commands from the command parser loop to the high priority loop(DAQ)
• Error QueueForwards error codes to the error loop
Separate queues are used for medium and high priority loop to allow them to functionin parallel. If there was one element in the queue for loop A (which is busy) and rightafter that one element for loop B, Loop B would have to wait until Loop A dequeuedits element before it could start.
The data queue is separate from the other queues so it does not disturb the commu-nication between the loops. It contains the data field command, that tells the mediumpriority loop (transmitter) what to do with the data.The tasks of the mentioned five loops are as follows:
Command Parser Loop The command parser loop receives the commands from themain program. To ensure responsiveness, the command parser loop does not processthe commands itself. Instead it forwards them to the appropriate loop and therebyacts as an abstraction layer. For example, when receiving the command cmd startacquisition it enqueues the necessary commands to start the data acquisition. Itthereby implements some additional abstraction useful for managing the driver. The
66

5.5 Main Program and Driver Structure
goal is to have abstracted commands in the main application that do not relate to aspecific type of DAQ hardware.
High Priority Loop (DAQ) The high priority loop acts as the data producer loop.It generates data by acquiring measurements from the DAQ hardware. Once theacquisition is started, this is the main task of an DAQ instrument and can be challengingspeed wise. This loop is completely dedicated to acquiring data. This ensures maximumspeed. It contains all routines necessary to control the DAQ hardware. To ensurea maximum bandwidth in transmitting the data from this DAQ loop to the mainapplication, it has its own queue to transmit the acquired data to the main programvia the transmitter loop.
Medium Priority Loop (Transmitter) The acquired data is received by the mediumpriority loop (transmitter). It is completely dedicated to dequeueing the data andtransmitting it via TCP to the main application. Again, since this is its only task, itprovides a maximum throughput.
Medium Priority Loop (Processor) This loop takes care of all other functions. Thisincludes setting parameters received from the main application, reading the parametervalues back from the instrument, and returning it to the main application so it can beupdated on the user interface.
Error Loop The error loop is used for exception handling. It catches an error andreacts accordingly.
Summary To summarize the structural description, the following list clarifies how theloops are interrelated:
• Command ParserControls medium priority loop and high priority loop by enqueueing commandsand data for them
• Medium Priority (transmitter)Transmits the data on the data queue to the connected client
• Medium Priority (processor)Processes main program’s commands
67

5 Implementation
• High PriorityGenerates data and enqueues it on the data queue
• ErrorCatches errors and takes proper actions (exception handling)
Figure 5.12 shows how the described structure is implemented.
Figure 5.12: Implementation of the DAQ drivers’ parallel loop structure
68
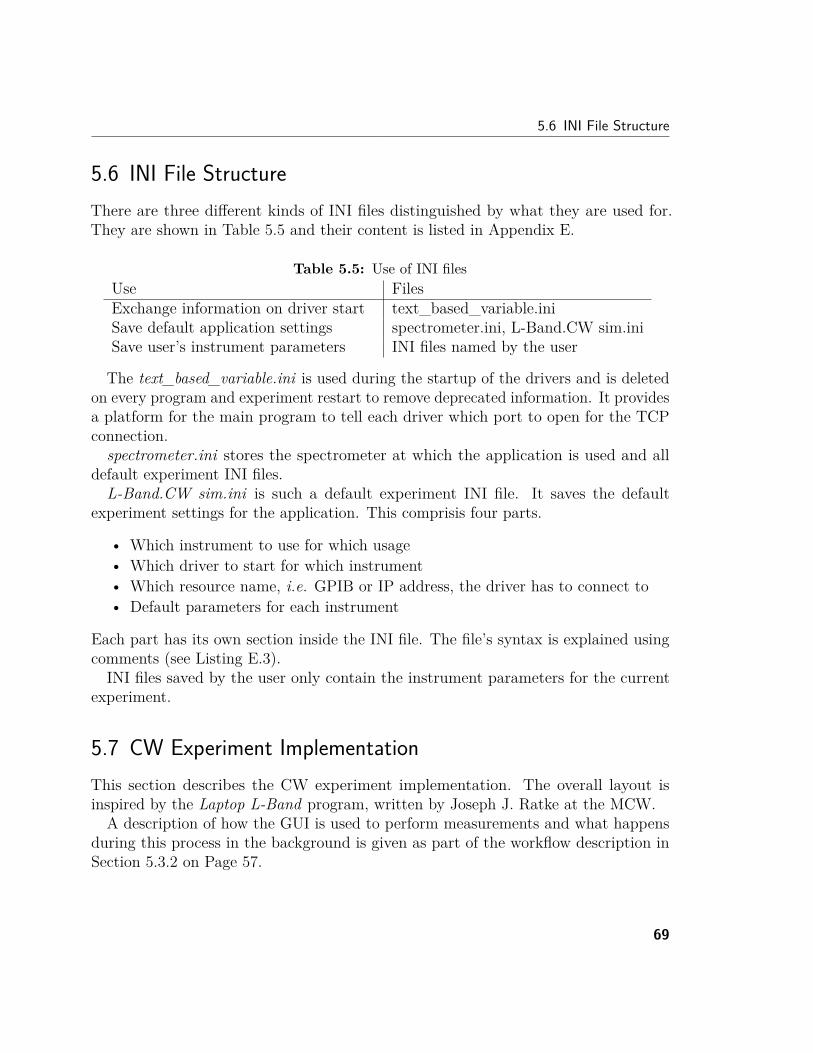
5.6 INI File Structure
5.6 INI File StructureThere are three different kinds of INI files distinguished by what they are used for.They are shown in Table 5.5 and their content is listed in Appendix E.
Table 5.5: Use of INI filesUse FilesExchange information on driver start text_based_variable.iniSave default application settings spectrometer.ini, L-Band.CW sim.iniSave user’s instrument parameters INI files named by the user
The text_based_variable.ini is used during the startup of the drivers and is deletedon every program and experiment restart to remove deprecated information. It providesa platform for the main program to tell each driver which port to open for the TCPconnection.spectrometer.ini stores the spectrometer at which the application is used and all
default experiment INI files.L-Band.CW sim.ini is such a default experiment INI file. It saves the default
experiment settings for the application. This comprisis four parts.
• Which instrument to use for which usage• Which driver to start for which instrument• Which resource name, i.e. GPIB or IP address, the driver has to connect to• Default parameters for each instrument
Each part has its own section inside the INI file. The file’s syntax is explained usingcomments (see Listing E.3).INI files saved by the user only contain the instrument parameters for the current
experiment.
5.7 CW Experiment ImplementationThis section describes the CW experiment implementation. The overall layout isinspired by the Laptop L-Band program, written by Joseph J. Ratke at the MCW.
A description of how the GUI is used to perform measurements and what happensduring this process in the background is given as part of the workflow description inSection 5.3.2 on Page 57.
69

5 Implementation
Experiment Pages The experiment is divided into four parts of which each has aspecial task:
• CollectionCollect, display, and save the EPR spectrum
• ParametersDocument experiment parameters
• PatrickAdvanced user page that allows settings used by a user called Patrick
• VarianControls to simulate the experiment without being connected to a spectrometer.
The Collection page of the experiment interface is shown above in Figure 5.4. Theother experiment pages are shown below in Figures 5.13, 5.14, and 5.15.
70

5.7 CW Experiment Implementation
Figure 5.13: outer tab tab control showing the Parameters experiment page of theExp GUIs page
71

5 Implementation
Figure 5.14: outer tab tab control showing the Patrick experiment page of the ExpGUIs page
72
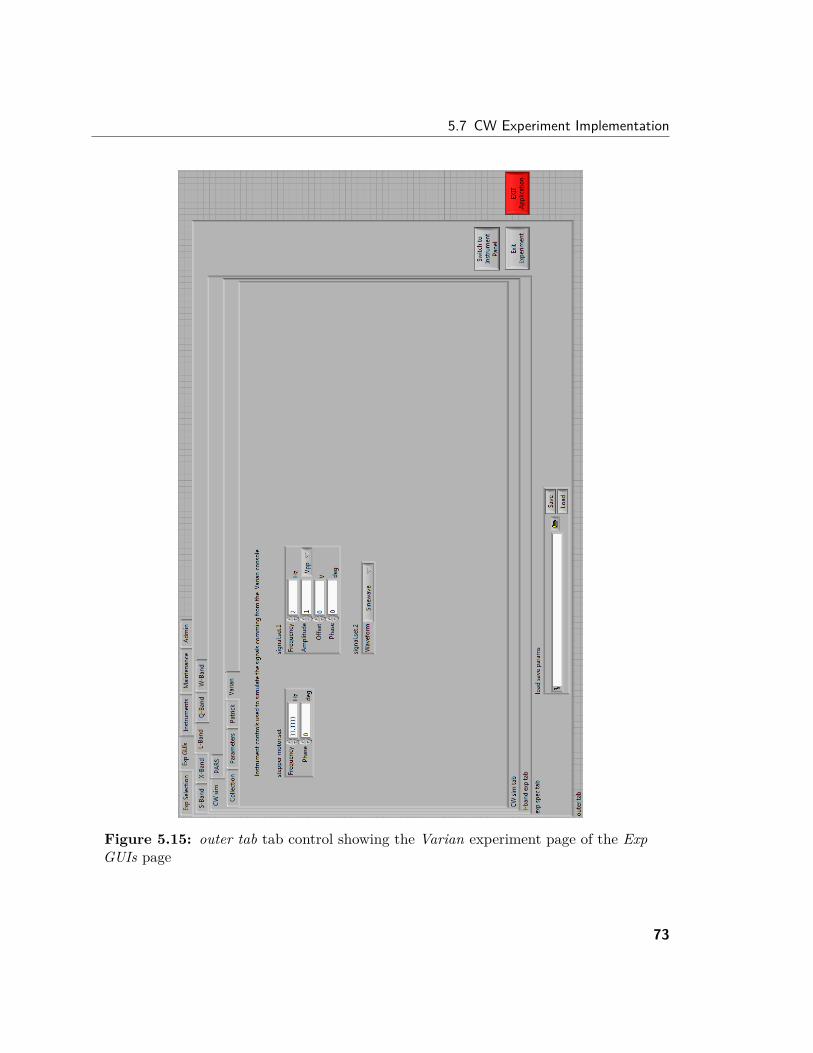
5.7 CW Experiment Implementation
Figure 5.15: outer tab tab control showing the Varian experiment page of the ExpGUIs page
73

5 Implementation
5.7.1 Hardware SetupThis experiment’s data acquisition involves two devices:
• Varian console providing analog signal and digital control lines• Slow speed digitizer: NI PCI-6024E
The Varian console contains the field controller to sweep the field and the Phase-Sensitive Detector (PSD) to measure the EPR spectrum. It communicates with thePC via TTL interface and an analog signal (±10V) that is connected to the connectorpanel of the PC’s DAQ card. Three signals are transmitted to the PC:
• Left limit switch signal (TTL)Indicates, that the Varian recorder arm is at the left limit and starting the nextcollection
• Stepper motor signal (TTL)Signals the PC that the motor of the slider and thereby the field moved and thenext sample can be acquired
• Analog signalSignal from the PSD that represents a new data point for the current fieldstrength
For more information see EPR Section 2.1.5 on Page 11 in the Background Chapter.
5.7.2 Experiment SimulationTo test the experiment at the workbench and not occupy the spectrometer, the signalsfrom the Varian console were simulated using two function generators. Either theSRS DS345 or Agilent N8241A can be used for this purpose.
One function generator simulates the stepper motor by outputting a low frequencyrectangular TTL waveform. The other generates any other kind of waveform tosimulate the analog signal from the PSD. The Varian’s left limit switch is simulatedby a switch on the DAQ card’s connector panel.
To run the experiment, first the function generators are set up and then the switchis closed. The collection starts immediately and stops after the specified number ofsamples has been acquired. If the software is configured to acquire more than onemeasurement, the next collection starts as soon as the switch is closed again.Figure 5.16 shows the result of a simulation run.
74

5.7 CW Experiment Implementation
Figure 5.16: Experiment collection panel showing the four averages of a test signal
75


6 EvaluationThe successful implementation of an experiment in Section 5.7 shows that the overallconcept and implementation works. In addition to that, the following section explainshow all other specified requirements are met.
6.1 Requirement ListThe following list presents all initially developed requirements and explains how theyare met by the implementation:
• The application runs on all spectrometersby implementing a comfortable way to change the instruments and creatingdrivers that can be loaded on an as needed basis as many times as necessary.
• The application can implement all experimentsby providing a tab control structure with pages for all current spectrometers.New spectrometers and experiments can easily be added by adding tabs to therespective tab controls.
• New experiments can be implemented faster than beforeby providing a program structure that offers a command-based interface to theinstrument drivers, GUI instrument controls, and indicators. New experimentsmerely have to duplicate the structure given by the example experiment and canuse all shared resources.
• Maintainability is improved and common interfaces are promotedby providing a framework in which new experiments can be implemented. Thiseliminates the need for redundant work, e.g. implementation of LabVIEW drivers,creating a program structure, organizing the data processing, which reduces theoverall code size one has to maintain.
• Modularity and flexibility are promotedby excluding the drivers from the program core to provide 32 and 64-bit capability,by using STM that allows to interface with non LabVIEW applications and can
77

6 Evaluation
easily be switched to use different transport layers, by using an extendable tabcontrol structure, by using a robust and extendable internal program architecturebased on the multi-loop application framework, by using standardized drivercommands, and by using nested case structures that can adapt to changing needs.
• 32 and 64-bit driver capability is implementedby using the LabVIEW application builder to create 32 and 64-bit EXE files.
• A path for expansion is providedby having modular code in cohesive cases that can be rearranged to reflect futureneeds.
• The responsiveness to operator actions is improvedby automatically updating instrument controls with the value actually set onthe instrument.
• The experiment work flow is simplifiedby using fewer buttons and a more intuitive control concept for the data collection.
• Efficient usage of multi-core processors and multi-threading is promotedby using a parallel loop design pattern for the program architecture and dividinglarger tasks into smaller cohesive tasks.
• Polling is avoidedby using an event-handler structure to capture user interface events and by usingSTM, which utilizes no CPU usage when waiting on the next message.
6.2 Potential for ImprovementThree possibilities for improvement can be identified.
Currently two CPU cores are used significantly more than the remaining ten. Whenacquiring data these two cores indicate a CPU usage of about 70% while all othercores are hardly used. The CPU usage is not critical yet but its development shouldbe observed to identify an emerging bottleneck in time. At the moment, LabVIEWorganizes how the parallel loops’ threads are distributed across the CPU cores. Onewill have to investigate whether LabVIEW rearranges the threads in a sensible way orif they have to be assigned manually to a core using timed loops.When 1024 data points are acquired within four seconds, it takes the graph on
the experiment’s Collection page about six seconds to draw all acquired data points.It is not clear yet where this delay comes from, but more efficient ways of updatingLabVIEW graphs can be investigated. This issue does not limit the ability to performthe implemented CW experiment, because it takes the Varian console at least 30 seconds
78

6.3 Summary
to output its about 1000 motor steps.Although the overall program structure is consistent and modular, points for im-
provement were identified after finishing this project. To further improve the codestructure, one could focus more on the commonalities of the experiments at eachfrequency band, e.g. CW, PARS, saturation recovery. All of them
• have to communicate with the user,• contain data acquisition routines,• some may contain processing routines for FFT and the Hilbert transform,• and all of them need to initialize the instruments and implemented routines at
specific points during program execution.
If the program is oriented more along the common basis of the experiments, the overallprogram structure can be simplified by creating common cases for the implementationof the initialization, data acquisition, data processing, and user interactions.
6.3 SummaryOne can conclude, that all requirements, including the implementation of an experiment,are implemented and functional. Additionally, three possibilities for improvement wereidentified and discussed.
79


7 Summary and VisionSummary The application described in this thesis addresses the main issues of EPRcontrol and acquisition applications by focusing on program structure, user interface,execution responsiveness, and modularity. The developed program structure is key.It provides a path for future expansion and ensures high maintainability as well asoptimal performance.
The following three possibilities for future improvement were identified and discussed:
• Improving thread allocation to spread the utilization of CPU resources• Decreasing the time it takes to display acquired data• Improving the program structure by focusing on the common basis of experiments
Vision In the future, the CW experiment acquisition time can be speed up by a factorof 10 by using an approach called “Adaptive Signal Averaging Technique that Reducesthe Acquisition Time of Continuous Wave Magnetic Resonance Experiments” [4]. Thisadaptive filter approach improves the averaging process in a way, that comparableresults can be achieved with only a tenth of the acquisition runs.If the need arises to acquire larger sets of data, the Technical Data Management
Streaming (TDMS) file format instead of Microsoft Excel’s XLS files could be used tobackup each successfully completed average. TDMS is a light-weight binary LabVIEWfile format with open documentation [14, 19]. The open documentation ensures thatone will always be able to implement private LabVIEW TDMS function blocks andread old data sets, even though the official TDMS standard changed. Binary fileformats in general have the advantage of handling large amounts of data very efficientlyby reducing the storage footprint. TDMS provides a generic structure for savingmeasurement and simulation data in an organized and consistent way.
Currently, the software is limited by the small number of implemented drivers. Theimplementation of more drivers will be one of the main tasks for future developmentof this framework. Fortunately, this process is simplified by the drivers already beingimplemented in other LabVIEW programs. The commands and syntax are alreadyknown and need only to be transferred into the new driver structure.
81


Bibliography[1] Bruker BioSpin. What is EPR? http://www.bruker-biospin.com/whatisepr.html,
2010. (accessed August 25, 2010). (cited on page 5)
[2] Rick Bitter, Taqi Mohiuddin, and Matt Nawrocki. LabVIEW: Advanced Program-ming Techniques. CRC Press, second edition edition, 2007. (cited on page 36)
[3] Peter A. Blume. The LabVIEW Style Book. Prentice Hall, February 2007.(cited on pages 37 and 40)
[4] Corey J. Cochrane and Patrick M. Lenahan. Adaptive Signal Averaging Techniquethat Reduces the Acquisition Time of Continuous Wave Magnetic ResonanceExperiments. EPR newsletter, 19:10–11, 2010. (cited on page 81)
[5] Boris Epel and Reef Morse. SpecMan4EPR: A versatile control software for pulseEPR. http://specman4epr.com/Handouts/SM_poster_RMCAC2010.pdf, August2010. EPR symposium poster presented on August 21, 2010 at Medical College ofWisconsin. (cited on page 16)
[6] Gerardo Garcia. Create Distributed Applications with LabVIEW Shared Variables.http://zone.ni.com/devzone/cda/pub/p/id/87, March 2007. (cited on page 41)
[7] Medical College of Wisconsin, Inc. Development of Biomedical EPR Instrumenta-tion, November 2007. Federal Identifier: EB002052. (cited on page 1)
[8] Medical College of Wisconsin, Inc. National Biomedical EPR Center, September2007. Federal Identifier: 5 P41 EB001980-34. (cited on page 1)
[9] National Instruments. Command-Based Communication Using SimpleTCP/IP Messaging. http://zone.ni.com/devzone/cda/tut/p/id/3098, July 2008.(cited on pages 42 and 60)
83
Bibliography
[10] National Instruments. Running a LabVIEW Executable as a Background Process.http://digital.ni.com/public.nsf/allkb/EFEAE56A94A007D586256EF3006E258B,March 2008. (cited on page 44)
[11] National Instruments. A Multi-client Server Design Pattern Using SimpleTCP/IP Messaging. http://zone.ni.com/devzone/cda/tut/p/id/3055, June 2009.(cited on page 42)
[12] National Instruments. High CPU Utilization When Updating Nested SubPanels.http://digital.ni.com/public.nsf/allkb/1BC7394514A4304A862574CC005DFA29,September 2009. (cited on page 38)
[13] National Instruments. Programmatically Firing a Value Change Event for a VIInside a Subpanel.http://digital.ni.com/public.nsf/allkb/0B11E4964685B49F862571430000091E,July 2009. (cited on page 38)
[14] National Instruments. TDMS File Format Internal Structure.http://zone.ni.com/devzone/cda/tut/p/id/5696, December 2009. (accessed Au-gust 29, 2010). (cited on page 81)
[15] National Instruments. Handling Variant Data. http://zone.ni.com/reference/en-XX/help/371361G-01/lvconcepts/handling_variant_data/, June 2010. (accessedJuly 18, 2010). (cited on page 62)
[16] National Instruments. LabVIEW Simple Messaging Reference Library (STM).http://zone.ni.com/devzone/cda/tut/p/id/4095, May 2010. (cited on page 42)
[17] National Instruments. NI LabVIEW Compiler: Under the Hood.http://zone.ni.com/devzone/cda/tut/p/id/11472, July 2010. (accessed August25, 2010). (cited on page 14)
[18] National Instruments. Simple Messaging Reference Library (STM).http://zone.ni.com/devzone/cda/epd/p/id/2739, September 2010. (accessed Au-gust 10, 2010). (cited on page 60)
[19] National Instruments. The NI TDMS File Format.http://zone.ni.com/devzone/cda/tut/p/id/3727, August 2010. (accessed August29, 2010). (cited on page 81)
84

Bibliography
[20] National Instruments. Using LabVIEW with TCP/IP and UDP.http://zone.ni.com/reference/en-XX/help/371361G-01/lvconcepts/using_labview_with_tcp_ip_and_udp/,June 2010. (cited on page 41)
[21] National Instruments. Using the LabVIEW Shared Variable.http://zone.ni.com/devzone/cda/tut/p/id/4679, March 2010. (cited on page 41)
[22] David Patterson. The Toruble with Multi-Core. IEEE Spectrum, 47:28–32 and52–53, July 2007. (cited on page 20)
[23] Charles P. Poole, Jr. Electron Spin Resonance: A Comprehensive Treatise onExperimental Techniques. John Wiley & Sons, 2 edition, 1983. (cited on page 7)
[24] Dave Thomson. Shared Variables Issues.http://decibel.ni.com/content/docs/DOC-4044, March 2009. (cited on page 42)
[25] John A. Weil and Rames R. Bolton. Electron Paramagnetic Resonance: Ele-mentary Theory and Practical Appliations. John Wiley & Sons, 2 edition, 2007.(cited on page 7)
85


A DVD ContentsThis storage medium contains:
• Diploma thesis in PDF format• EPR symposium poster• Program source code and INI files• Modified STM library called STM_ICAS• LabVIEW instrument drivers for SRS DS345 and Agilent N8241A
87


B EPR Symposium PosterFigure B.1 shows the poster presented on the EPR symposium at the Medical Collegeof Wisconsin on August 21, 2010. It reflects the project state at that time. To have aproper headline, the program was called “Instrumentation Control and AcquisitionSoftware” (ICAS).
89

B EPR Symposium Poster
Instrumentation Control and Acquisition Software FACHHOCHSCHULEInstrumentation Control and Acquisition Software
(ICAS) for EPR Spectroscopy Experiments University of Applied Sciences
HOCHSCHULELÜBECK
(ICAS) for EPR Spectroscopy Experiments University of Applied Sciences
Matthias K. Miehl, Malte H. Reitzer, Joseph J. Ratke, John D. Gassert
National Biomedical EPR Center, Medical College of Wisconsin, Milwaukee, WI, USA
Introduction Technical Details
Program StructureMain Issues • Responsiveness is increased by enqueueing elementsinside the user interface event handler and receiver loop
Introduction Technical Details
Program Structure
• Large Scale Application approach
Main Issues
The instrumentation used in EPR experiments typically has
inside the user interface event handler and receiver loopusing an event-driven state machine. Events are forwarded toa main loop instead of being processed immediately. Both• Large Scale Application approach
Dynamically load the instrument drivers as external modules.Therefore the software is easily extendable for future
The instrumentation used in EPR experiments typically hasthe following control and data acquisition issues:
a main loop instead of being processed immediately. Bothloops require a minimum amount of time to handle incomingtasks.Therefore the software is easily extendable for future
instruments and maintains a small memory footprint.Modularizing software also reduces the overall complexity.
• Requires precise instrument timing and consistent settings• Record of settings (instrument selection and parameters)
tasks.
• Allow the operator to perform baseline correction, FFT, andModularizing software also reduces the overall complexity.
• Communication FrameworkThe main application/driver communication is realized using
• Record of settings (instrument selection and parameters)• New program for each EPR experiment• Consistent program structure for all EPR experiments
• Allow the operator to perform baseline correction, FFT, andother post-processing on the acquired data.
The main application/driver communication is realized usingSimple TCP Messaging (STM), the Command-BasedCommunication design pattern, and an Action Engine to
ICAS addresses these issues. Improved Execution ResponsivenessCommunication design pattern, and an Action Engine tomanage multiple server TCP connections.ICAS is an in-house development of the National Biomedical
EPR Center at the Medical College of Wisconsin. It is• Takes advantage of 64-bit architecture. This increases theprocessing performance and throughput. Although the main
Figure 1 shows the overall program structure. Figure 2 showsa typical STM communication structure.
EPR Center at the Medical College of Wisconsin. It isdesigned for optimal usability and long-term maintainability. Itcombines the functionality of previously developed in-house
processing performance and throughput. Although the mainapplication and most drivers are 64-bit, 32-bit drivers aresupported.
a typical STM communication structure.combines the functionality of previously developed in-houseapplications used to control EPR experiments and focuses onimproving the overall program structure to offer the following
supported.
• Takes advantage of multi-threading and multi-corebenefits:
• Program Structure
• Takes advantage of multi-threading and multi-coreenvironments by writing code with parallel threads where theymake sense. These threads are then logically grouped and
• Program Structure• Enable modularity and flexibility• Ease of future modification by providing a path for
make sense. These threads are then logically grouped andassigned to one of the 12 CPUs. The goal is to group them ina way that the processor usage is distributed equally over all
• Ease of future modification by providing a path forexpansion
• Improve maintainability
available cores. This is accomplished by grouping threadsthat do not run at the same time or generate little overall CPUusage when executing.
• Improve maintainability
• Graphical User Interface (GUI)
usage when executing.
• No significant use of polling. Polling is the repeated use of• Graphical User Interface (GUI)
• Simplified displays• Common interfaces across experiments• Increased responsiveness to operator actions
• No significant use of polling. Polling is the repeated use ofCPU time to check for the completion of a task. It is only usedto check for new data from the server. By controlling it with a
Figure 1: Overall program structure and communication paths• Increased responsiveness to operator actions• Post-processing options
to check for new data from the server. By controlling it with aTimed Loop, minimal CPU time is consumed. In otherprogram parts case structures are used. Case structures
• Improved Execution Responsiveness• Take advantage of 64-bit platforms
program parts case structures are used. Case structurescause no CPU usage until data arrives.
• Take advantage of 64-bit platforms• Take advantage of multi-core processors• Take advantage of multi-threading and parallelism Summary• Take advantage of multi-threading and parallelism• Avoid polling wherever possible
• Data Acquisition
Summary
Conclusions• Data Acquisition
• Calculation of optimum acquisition rate and record lengthfor a high speed digitizer
Conclusions
• This software addresses the main issues of EPR control andfor a high speed digitizer• Baseline subtraction in hardware on high speed digitizer
• This software addresses the main issues of EPR control andacquisition applications by focusing on the program structure,GUI, execution responsiveness, and data acquisition.
Figure 2: STM Communication Framework
The Software is part of two diploma theses and is currently
GUI, execution responsiveness, and data acquisition.
• The program structure is key. It provides a path for futureIt is possible to exchange instruments with equivalentfunctions within experiments by using standardized servercommands. INI files are used to manage the application’s
The Software is part of two diploma theses and is currentlyconsidered a work-in-progress. The presentation exampleimplements a basic experiment using two instruments, a
• The program structure is key. It provides a path for futureexpansion and ensures high maintainability as well asoptimal performance.
commands. INI files are used to manage the application’sdefault settings by defining which instrument to use for whichtask within an experiment and saving the default parameters
function generator and a slow speed data acquisition card.
Acknowledgementstask within an experiment and saving the default parametersfor each instrument.Development System
Acknowledgements
• LabVIEW 2009 64 and 32-bit• Windows 7
This work was supported by grant EB001980 and EB002052from the National Institutes of Health. The authors would alsolike to thank Senior Electrical Engineer Joseph J. Ratke and
Graphical User Interface• Windows 7• Dual hexa-core (12 core) CPU• 12 GB RAM
like to thank Senior Electrical Engineer Joseph J. Ratke andDr. John D. Gassert for their advice and mentoring.
• A Common interface across all experiments is achieved by• 12 GB RAM • A Common interface across all experiments is achieved byincorporating the user interfaces for all experiments into asingle application using Tab Controls. Maintaining thestructure of only one program allows keeping acquisitionsoftware up-to-date for all experiments.
Figure B.1: EPR Symposium Poster
90

C Program Flow
C.1 Main ProgramMain Program Startup
• init.level 1
– Delete queues’ elements (flush queues)Remove elements from queues that remain after unexpected program termi-nation
– Make tabs invisible– Initialize STM Connection Manager and Experiment Info functional global– Erase content of and display device array showing the available instruments
on the experiment selection page– Activate Exp Selection tab on outer tab by calling set tabs case– Call init.level 2
• init.level 2
– Read spectrometer from spectrometer.ini– Write spectrometer to ring control Spectrometer Ring Admin on Admin
main tab by calling the set ring case– Set admin spec tab, exp spec tab, exp selection spec tab, and inst spec tab
according to the set spectrometer by calling the set tabs case– Call init.level 3
• init.level 3
– Scan active page of admin spec tab for clusters and use the labels of thecontrols inside (usage names) to fill the usage array in the Experiment Infofunctional global
– Call init.level 4
91

C Program Flow
• init.level 4Read default devices from INI files and write them into the rings on the adminspec tab for all experiment pages– Get sections = spectrometers
Get sections from spectrometer.ini. Ignore config section. This yields allavailable spectrometers.
– Get keys = INI file namesFor each section, i.e. spectrometer: Read key values, i.e. default experimentINI file names. These files contain the default instrument parameters. Thisyields the INI file for the cluster on the admin spec tab
– Open the INI file and read the config sectionKey = usage, ke value = instrument name
– Search for control with the read usage as the label and assign it the readinstrument
• Event “Spectrometer Ring Admin”: Value ChangeCall change spec case to change the current spectrometer:– Save newly selected spectrometer to spectrometer.ini– Set all tabs accordingly
Experiment Selection• Event User selects an experiment⇒ See Start Drivers
• Event User cancels the current experiment selection⇒ See Cancel Experiment Select/Shutdown Experiment
• Event User proceeds to experiment GUI– Set experiment on <spectrometer> exp tab– New tab control page value automatically updated in tab control cluster by
set tabs case– Set experiment on inst <spectrometer> exp tab– New tab control page value automatically updated in tab control cluster by
set tabs case
92

C.1 Main Program
– Switch to experiment GUI by setting the Exp GUI tab on the outer tab tabcontrol
– Load default instrument parameters into the controls on the active page ofthe <spectrometer> exp tab and inst <spectrometer> exp tab
– Set default instrument parameters on instrument
Start Drivers• driver.start
– Determine INI file for current spectrometer and experiment, e.g. L-Band.CWsim.ini
– Use usages from Experiment Info functional global to identify EXE names∗ Read config sectionKey names = usagesKey values = driver names
∗ Read driver sectionKey names = driver namesKey values = EXE names without .exe
∗ Read resource sectionKey names = driver namesKey values = resource names, i.e. instrument addresses
∗ Call driver.start lvl2 case• driver.start lvl2
– Get new port for driver from STM Connection Manager and write it intotext_based_variable.ini
– Start EXE with previously read file namePerform error handling if EXE not found:
∗ Notify user with pop-up window∗ Skip the next steps
– Connect to driver. Retry to connect if connection attempt failed.– Add STM Connection Info to STM Connection Manager if the connection
was established– Send resource name, set resc name, and instrument name, set inst name, to
the driver (enqueue element for the transmitter loop)– Request status information from driver with get status
93

C Program Flow
– Request instrument type from driver with get inst type• Transmitter Loop
Forwards enqueued data to the driver. Identifies the driver port by the usage.Sends– set resc name and set inst name with respective argument to the driver– get status
• Driver get status case calledIt obtains connectivity information and returns the status information, connec-tivity and instrument name, to the client with return status.
• Receiver Loop: Receive driver’s response in case return statusForward received data to receive case in Main Loop to process, i.e. save anddisplay, the data.
• Error Loop Handle missing EXEReceives error code from driver.start lvl2 case. Generates a pop-up windowto inform the operator.
Cancel Experiment Select/Shutdown ExperimentEvent User cancels current experiment selection or exits the current experiment
• Event HandlerEnqueues driver.shutdown with init as argument which is the case to call afterthe following case (init.level 1)
• driver.shutdownSends cmd shutdown command to all connected drivers
• transmitter.reset connectionsRemoves connection from connection manager if connection to driver can notbe established. Only continues with next case, if all drivers are terminated, i.e.main program can no longer connect to the drivers. Therefore, check connectionto all drivers as often as necessary until all drivers are disconnected.
• Call init.level 1 case– Flush queues– Erase content of and display device array displaying the available instruments
on the experiment selection page
94
C.1 Main Program
Shutdown ProgramEvent User exits the main program
• Quit Receiver Loop• Event Handler
– Enqueue driver.shutdown case with cmd shutdown as argument, i.e. thecase to call after the following case (main.shutdown)
– Quit Event Handler Loop
• driver.shutdown
– Send cmd shutdown command to all connected drivers• transmitter.reset connections
– Remove connection from STM Connection Manager, if the connection to thedriver can no longer be established. Only continue with the next case, if alldrivers are terminated, i.e. main program can no longer connect. Therefore,check connection to all drivers as often as necessary until all drivers aredisconnected.
– Quit Transmitter Loop
• Main Loop: cmd shutdown
– Release main queue– Quit Main Loop– Enqueue element for Error Loop telling it to release the error queue
• Error Loop
– Release error queue– Quit Error Loop
• At this point the EXE quits executing.
95

C Program Flow
Loading and Setting Default ParametersEvent User proceeds to GUI
• Stop enqueueing elements to try to connect to driver• Load parameters into controls on instrument tab
– Determine reference to sub tab of instrument tab– Determine control references to clusters on current page of the instrument
panel sub tab– Read current spectrometer and experiment from Experiment Info functional
global to open respective INI file– Determine control references on the active page for every cluster on the
page– Use section and cluster of key names to read key value for every control
inside the cluster (2nd for loop)• Load parameters into controls on experiment tab• Send parameters to instrument
The clusters on the instrument panel are a superset of what is shown on the experimentpanel, i.e. the experiment panel contains a subset of the controls on the instrumentpanel. In addition to that, the instrument panel only contains clusters while theexperiment panel also contains indicators.
Change Instrument Control• Input cluster label and control label to cl-ctl to cmd.vi.• Send its output, i.e. usage and command, to the driver.• Call settings.update ctl.invert case to update the equivalent control on
the respective control panel. Updates the instrument panel control, if the valuechange occurred on the experiment panel and vice versa.
96
C.2 Driver
C.2 DriverWhile the program flow of the main program is oriented along the user’s input, theprogram flow of the driver is oriented along the commands received from the mainprogram.This section describes the program flow of a driver used for a DAQ instrument.
Drivers for other instrument types, e.g. function generators, have a subset of theroutines of a DAQ driver since they are missing the DAQ part.
Driver Startup• Make front panel invisible• Reset indicators and controls to default values• Read port assigned to this driver type by the STM Connection Manager in the
main program from text_based_variable.ini.• Listen for TCP connection on read port.• Send STM Meta-Data as soon as a connection is established.
Processing set commands for setting a driver parameterEvent Main program sends command to set a driver parameter.
set resc name or set inst name
• Command ParserEnqueues the received variant data and the received command on the MediumPriority Queue for the Medium Priority Loop (Processor). In case thereceived command contains a dot only the part before the dot is forwarded.
• Medium Priority Loop (Processor)Case called that is named like the received command. Converts variant data tooriginal data type and saves it inside the Instrument Parameters cluster.
97
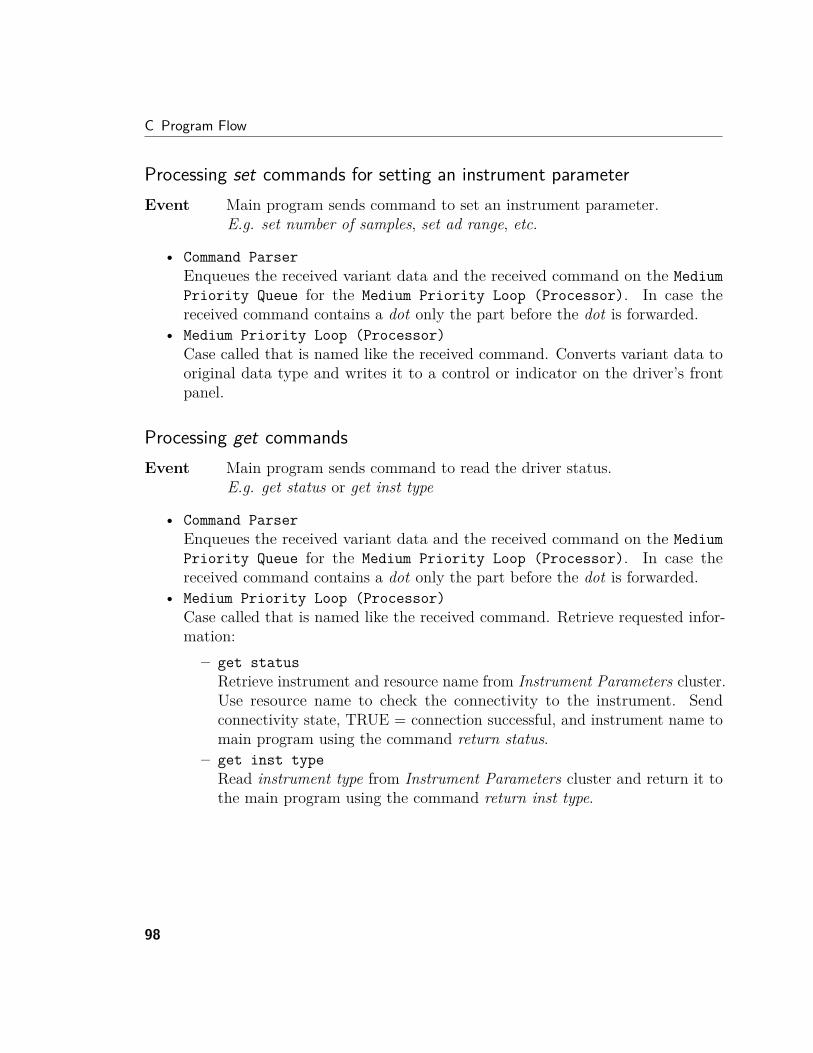
C Program Flow
Processing set commands for setting an instrument parameterEvent Main program sends command to set an instrument parameter.
E.g. set number of samples, set ad range, etc.
• Command ParserEnqueues the received variant data and the received command on the MediumPriority Queue for the Medium Priority Loop (Processor). In case thereceived command contains a dot only the part before the dot is forwarded.
• Medium Priority Loop (Processor)Case called that is named like the received command. Converts variant data tooriginal data type and writes it to a control or indicator on the driver’s frontpanel.
Processing get commandsEvent Main program sends command to read the driver status.
E.g. get status or get inst type
• Command ParserEnqueues the received variant data and the received command on the MediumPriority Queue for the Medium Priority Loop (Processor). In case thereceived command contains a dot only the part before the dot is forwarded.
• Medium Priority Loop (Processor)Case called that is named like the received command. Retrieve requested infor-mation:– get status
Retrieve instrument and resource name from Instrument Parameters cluster.Use resource name to check the connectivity to the instrument. Sendconnectivity state, TRUE = connection successful, and instrument name tomain program using the command return status.
– get inst typeRead instrument type from Instrument Parameters cluster and return it tothe main program using the command return inst type.
98

C.2 Driver
Processing cmd commandsEvent Main program sends command to trigger the execution of code.
E.g. cmd start acquisition, cmd stop acquisition, or cmd shutdown
• Command ParserDoes not need to forward any received data. Instead one or several elements withan empty data field and the name of the case/cases to be called are enqueued onthe High Priority Queue for the High Priority Loop (DAQ).
• High Priority Loop (DAQ)Case specified in the queue element’s command field is called. This case mightcall other cases, as for the
Performing Data AcquisitionEvent The DAQ routine was activated by the cmd start acquisition command
• High Priority Loop (Processor)
– DAQ1-Init∗ Retrieves all instrument parameters for instrument initialization.∗ Starts the acquisition task.∗ Calls data acquisition case DAQ1-Acquire.
– DAQ1-Acquire∗ Waits for signal to take the first sample.∗ After each acquired sample the data point is returned the the mainprogram using the command return data.add data point.
∗ Checks if the number of desired samples for the current measurementis reached.If the number is not reached yet, it enqueues an element on the HighPriority Queue calling DAQ1-Acquire to take the next sample.If the number is reached, it enqueues an element on the High PriorityQueue calling DAQ1-Send Collection.
– DAQ1-Send Collection∗ Stops the acquisition task∗ It then checks if the number of desired measurements is reached and
transmits the number of already completed measurements to the main
99

C Program Flow
application.If the number is not reached yet, it enqueues an element on the HighPriority Queue calling DAQ1-Restart to start the acquisition taskagain and wait for the signal to take the first sample.If the number is reached, it sends the signalling commands returndata.collection complete and return data.averaging complete to the mainprogram and enters an idle case.
– DAQ1-Restart∗ Starts the acquisition task∗ Enqueue element on the High Priority Loop calling DAQ1-Acquireto wait for the signal to take the first sample.
– DAQ1-Stop This case can be called at any time by sending cmd stop acqui-sition to the driver.
∗ Stops the acquisition task∗ Return the signalling command return data.delete collection to themain program causing it to delete the current collection.
100

C.2 Driver
Driver ShutdownEvent Driver receives cmd shutdown command.
• Command Parser LoopEnqueues DAQ-Shutdown command for High Priority Loop and quits CommandParser Loop.
• High Priority Loop: DAQ-Shutdown– Release High Priority Queue– Enqueue shutdown on Data Queue for Medium Priority Loop (Transmitter)– Enqueue MPLP-Shutdown on Medium Priority Queue for Medium Priority
Loop (Processor)– Enqueue shutdown for Error Loop– Delete acquisition task– Quit High Priority Loop
• Medium Priority Loop (Transmitter): shutdown– Release Data Queue– Quit Medium Priority Loop (Transmitter)
• Medium Priority Loop (Processor): MPLP-Shutdown– Leave instrument in a save condition– Quit Medium Priority Loop (Processor)– Release Medium Priority Queue
• Error Loop
– Release Error Queue– Quit Error Loop
101


D Source Code Modifications (STM)This is a summary of the parts of the final application that are programmed fromscratch or are modifications of existing source code.Everything, except the files in the STM library and the instrument drivers, are
written from scratch. While the instrument drivers are used as they are, the STMlibrary is modified. Every modified VI of the STM library is identified by havingthe name of the project, ICAS, in the head line. The following list shows whichmodifications were done to which part of the STM library v2.0. The original versioncan be found on http://zone.ni.com/devzone/cda/epd/p/id/2739.
• TCP Connection Manager.vi
– Organized inputs and outputs in a cluster to reduce the number of inputand output terminals.
– Added handling of usage name, driver name, and driver port, i.e. rewrotethe “Properties In” cluster.
– Replaced the “Set Properties” case by “Set Properties by Conn” and “SetProperties by Port” to select the connection that should be changed byeither the “Connection Info” or the port used for that connection.
– Added outputs for all usage names, all driver names, the EXE name andport for the currently processed connection, all ports, all connections.
– Added case “New Port” to determine the next smallest port not used byany other connection currently saved and add a connection with this port.
– Replaced the “Get Connection(s)” case by “Get Connection by Index”, “GetConnection by Driver”, and “Get Connection by Usage”
– Added case “Get Data Type by CMD” to determine the data type associatedwith the given command by looking it up in the Meta Data Cluster of therespective connection.
– Modified “Add Connection, “Remove Connection”, and “Get ConnectionCount” to incorporate above changes.
103

D Source Code Modifications (STM)
• TCP Check Connection.vi
– Now ignores errors resulting from a Connection ID being equal to zero. Inthis case the server is starting up and will be available soon, therefore itsconnection information should not be removed. If it does not start up untilthe user proceeds to the experiment interface, its connection informationwill be removed from the connection manager inside the start lvl2 caseof the driver case in the main loop.
– Now outputs driver and usage information of the last processed connection.• All STM Read Message and STM Write Message VIs now use the variant data
type instead of string to transmit the parameter.• The following VIs and controls are modified or updated inside the LabVIEW
user.lib directory to save additional information in the Meta Data.– _SubVIs \ stm_GetIDfromName_.vi– compatibility \ _SubVIs \ TypeDefs \ stm_MetaElement.ctl– Serial \ STM Read Message (Serial).vi– Serial \ STM Read Meta Data (Serial Clst).vi– Serial \ STM Read Meta Data (Serial Ref).vi– Serial \ STM Set Meta Data (Serial Clst).vi– Serial \ STM Set Meta Data (Serial Ref).vi– Serial \ STM Write Message (Serial).vi– Serial \ STM Write Meta Data (Serial Clst).vi– Serial \ STM Write Meta Data (Serial Ref).vi– Serial \ stm_Serial Connection Info.ctl– TCP \ STM Get Connection Reference (TCP).vi– TCP \ STM Read Message (TCP).vi– TCP \ STM Read Meta Data (TCP Clst).vi– TCP \ STM Read Meta Data (TCP Ref).vi– TCP \ STM Set Meta Data (TCP Clst).vi– TCP \ STM Set Meta Data (TCP Ref).vi– TCP \ STM Write Message (TCP).vi– TCP \ STM Write Meta Data (TCP Clst).vi– TCP \ STM Write Meta Data (TCP Ref).vi– TCP \ stm_TCP Connection Info.ctl
104

– UDP \ STM Get Connection Reference (UDP).vi– UDP \ STM Read Message (UDP).vi– UDP \ STM Read Meta Data (UDP Clst).vi– UDP \ STM Read Meta Data (UDP Ref).vi– UDP \ STM Write Message (UDP).vi– UDP \ STM Write Meta Data (UDP Clst).vi– UDP \ STM Write Meta Data (UDP Ref).vi– UDP \ stm_UDP Connection Info.ctl
Strictly speaking, it is no longer necessary to transmit the data type as a part of theSTM meta-data, since the data type of the parameter is changed from string to variant.This feature was kept, since it might be beneficial to transmit additional informationinside the meta-data for future implementations and poses no significant overhead.
105


E Sample INI Files
Listing E.1: spectrometer.ini[ c on f i g ]cur r ent spectrometer = "L−Band"
; d e f au l t experiment INI f i l e s[ S−Band ]
[X−Band ]
[ L−Band ]CW sim = "L−Band .CW sim . i n i "
[Q−Band ]
[W−Band ]
Listing E.2: text_based_variable.ini[ s rds345 ]port = 60000checksum = 0.18903285363229319
[ n i pci −6024e ]port = 60001checksum = 1.47458434037360586
107

E Sample INI Files
Listing E.3: L-Band.CW sim.ini; ass ignment o f instrument to usage; −−−−−−−−−−−−−−−−−−−−−−−−−−−−−−−−−; usage = instrument name[ c on f i g ]s t epper motor = "DS345 ( 1 ) "s i g n a l = "DS345 ( 2 ) "adc = "NI PCI−6024E"
; EXE names; −−−−−−−−−; instrument name = dr i v e r name[ d r i v e r ]DS345 (1 ) = " srds345 "DS345 (2 ) = " srds345 "N8241A = " n8241a "N8241A Option 330 = " n8241a "NI PCI−6024E = " ni pci −6024e "
; instrument r e s ou r c e names; −−−−−−−−−−−−−−−−−−−−−−−−−; instrument name = re sou r c e name[ r e s ou r c e ]DS345 (1 ) = "17 "DS345 (2 ) = "18 "N8241A = "TCPIP0 : : 1 6 9 . 2 5 4 . 1 . 2 0 : : i n s t 0 : : i n s t r "N8241A Option 330 = "TCPIP0 : : 1 6 9 . 2 5 4 . 1 . 2 2 : : i n s t 0 : : i n s t r "NI PCI−6024E = "Dev1 "
; d e f au l t parameters; −−−−−−−−−−−−−−−−−−; parameter_DataType = value
108

[ s t epper motor ]f r equency_Dig i ta l = 33.333333ampl i tude_Digita l = 1.000000phase_Dig ita l = 0.000000o f f s e t_D i g i t a l = 0.000000amplitude unit_Ring = 1.000000waveform_Ring = 2.000000
[ s i g n a l ]f r equency_Dig i ta l = 1.000000ampl i tude_Digita l = 3.000000phase_Dig ita l = 0.000000o f f s e t_D i g i t a l = 0.000000amplitude unit_Ring = 1.000000waveform_Ring = 1.000000wr i t e wfm f i l e_Path = "/C/temp/waveform . txt "
[ adc ]daq cntr control_Ring = 0.000000ad range_Enum = 1.000000num of samples_Dig i ta l = 1024.000000num of avgs_Dig i ta l = 1.000000input mode_Ring = 65535.000000
109


F TCP Benchmark ResultsThis chapter contains information regarding the TCP benchmark. First the systemrequirements are determined to be able to evaluate if the benchmark results fulfilthe needs. Afterwards the measurement approach is described. The benchmark codecan be found on the DVD as Appendix A and the measurement results are attachedon Page 113. The benchmark results do not indicate if they were done within theLabVIEW 32 or 64-bit environment, because no throughput difference between 32 and64-bit LabVIEW build binaries was measured.
Requirement Definition Among others, the Agilent AP240 digitizer card is used atMCW to sample the analog signal from the spectrometer. For this example the AP240is selected, because it is one of the fastest averaging devices used at MCW.
It acquires 1000 samples at a typical sampling rate of 10 to 100MSa/sec. Each acquiredsample is added to a separate on-board memory location of the card’s 24-bit buffer.After all 1000 samples are acquired, the acquisition stops until the next averaginginterval starts. A typically used averaging rate is 20 kHz. At the end of each averaginginterval each of the 1000 points is send as three separate Bytes to the measurementapplication via the computer’s PCI bus. This results in 3 kB of data send every 20 kHz.
From the set averaging rate and the sample size one can calculate the throughput inBytes per second with
averaging rate[
Samplessec
]· sample size
[Byte
Sample
]. (F.1)
Using Equation F.1 the required throughput for a typical averaging rate of 20 kHz iscalculated to be 60MB/sec. This is well below the measured minimum throughput of90MB/sec.
111

F TCP Benchmark Results
Measurement Method Two LabVIEW programs are written to perform the benchmark:
• A server generating the data with three nested for loops. The number of runs isadjusted separately for each for loop to control the amount of data generated.
• A client measuring how long it takes to receive the data.
As soon as the client connects, the server sends the data, closes the connection, andwaits for a new client connection. Inside the client a sequence structure calculatesthe time it takes to receive the data from the server. To increase the accuracy of thefinal measurement result, variations and inaccuracies are minimized by averaging overseveral measurements. Therefore, the client reconnects several times and averages theaccumulated results at the end. The end result, comprising the number of transferredbits and the measured throughput, i calculated in the client and displayed on theclient’s front panel.
112

TCP Benchmarking
Q-Band System20 measurement averages
Single (32-bit)single-precision floating-point numbers have a 32-bit IEEE single-precision format
transmission time increases exponentially with increasing number of transmitted bits
TCP Benchmark 2010-07-16 1/2
Transmitted Transmitted Speed Speed
loops bits Mbytes Transmission Time [ms] Mbits/s Mbytes/s
32 2097152 0.262 2.9 723.156 90.3945
64 16777216 2.097 21.6 776.723 97.0904
128 134217728 16.777 153.8 872.677 109.085
256 1073741824 134.218 1124.95 954.48 119.31
512, 256, 256 2147483648 268.435 2261.9 949.416 118.677
512, 512, 256 4294967296 536.871 4604 932.877 116.61
855.290 106.9114
1000000 100000000 10000000000
1
10
100
1000
10000
Number of Transmitted bits
Tra
ns
mis
sio
n T
ime
[m
s]
1000000 100000000 10000000000
0.000
200.000
400.000
600.000
800.000
1000.000
1200.000
Number of Transmitted bits
Th
rou
gh
pu
t [M
bits
/s]
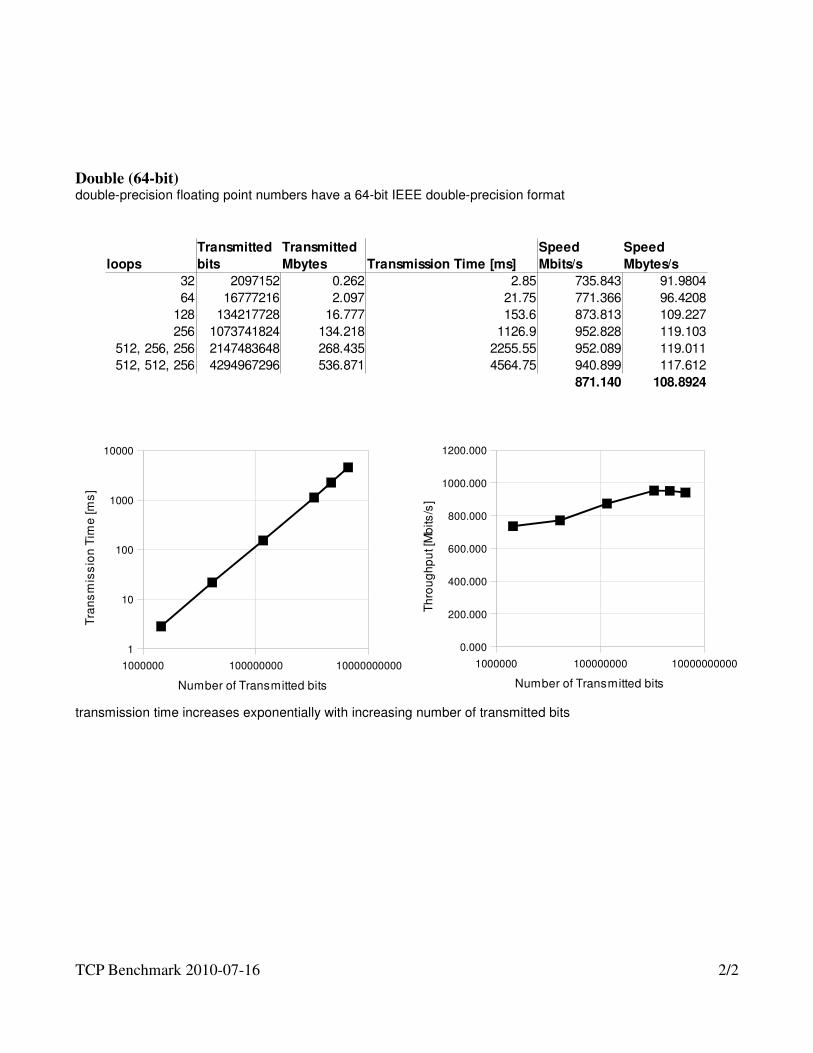
Double (64-bit)double-precision floating point numbers have a 64-bit IEEE double-precision format
transmission time increases exponentially with increasing number of transmitted bits
TCP Benchmark 2010-07-16 2/2
Transmitted Transmitted Speed Speed
loops bits Mbytes Transmission Time [ms] Mbits/s Mbytes/s
32 2097152 0.262 2.85 735.843 91.9804
64 16777216 2.097 21.75 771.366 96.4208
128 134217728 16.777 153.6 873.813 109.227
256 1073741824 134.218 1126.9 952.828 119.103
512, 256, 256 2147483648 268.435 2255.55 952.089 119.011
512, 512, 256 4294967296 536.871 4564.75 940.899 117.612
871.140 108.8924
1000000 100000000 10000000000
1
10
100
1000
10000
Number of Transmitted bits
Tra
ns
mis
sio
n T
ime
[m
s]
1000000 100000000 10000000000
0.000
200.000
400.000
600.000
800.000
1000.000
1200.000
Number of Transmitted bits
Th
rou
gh
pu
t [M
bits
/s]