Embed Size (px)
Citation preview

See discussions, stats, and author profiles for this publication at: https://www.researchgate.net/publication/253916862
Design and Implementation of an Experimental Segway Model
Article · March 2009
DOI: 10.1063/1.3106501
CITATIONS
17READS
12,762
2 authors:
Some of the authors of this publication are also working on these related projects:
ESP32 educational basic interface kits View project
Wastewater pumping, treating and recovering View project
Wael Younis
Der Albalah Industrial School, Gaza ,Palestine
1 PUBLICATION 17 CITATIONS
SEE PROFILE
Mohamed Abdelati
Islamic University of Gaza
39 PUBLICATIONS 111 CITATIONS
SEE PROFILE
All content following this page was uploaded by Mohamed Abdelati on 11 February 2015.
The user has requested enhancement of the downloaded file.
Design and Implementation of an ExperimentalSegway Model
�Eng. Wael Younis � Prof.Dr. Mohammed Abdelati ���� The Islamic University of Gaza, Gaza, Palestine.
(e-mail: [email protected]).��� The Islamic University of Gaza, Gaza, Palestine.(e-mail: [email protected]).
Abstract: The segway is the first transportation product to stand, balance, and move in the same way wedo. It is a truly 21st-century idea. The aim of this research is to study the theory behind building segwayvehicles based on the stabilization of an inverted pendulum. An experimental model has been designedand implemented through this study. The model has been tested for its balance by running a ProportionalDerivative (PD) algorithm on a microprocessor chip. The model has been identified in order to serve asan educational experimental platform for segways.
Keywords: Inverted pendulum, segway, nonlinear control.
1. INTRODUCTION
THe building of a device to transport a person from pointA to point B has been done many ways in the past. This
includes bikes, cars, planes, scooters and so on, recently therehas been a new way of traveling, which is the segway [1].The Segway uses the idea of an inverted pendulum which is aclassic non linear control problem. There are several variationsof the problem, the main ones are: the Furuta pendulum (Furuta,2003) [4], (Astrom and Furuta, 1996) [2], the pendulum on amobile cart (Gordillo et al., 2004) [5], the pendulum on a two-wheeled vehicle with independent motors (Baloh and Parent,2003) [3], (Grasser et al., 2002) [6], (Segway, 2004) [7], theBalancing Scooter (Blackwell 2007) [8], the Human TransportVehicle (Beckwith, 2004) [9], the Almost Self-Balancing twoWheeled Electric Skateboard (Chudleigh, 2005) [10]. In ad-dition, there is a wide range of controller systems, designedthroughout the last few decades for these applications. Thispaper presents the design and implementation of an experi-mental segway model based on the stabilization of an invertedpendulum (Figure 1), this model has been identified in orderto serve as an educational experimental platform for segways.This work focuses on the problem of an inverted pendulumon a two-wheeled vehicle for human transportation, where theperson riding the vehicle acts as pendulum. The forward move-ment is caused by the rider’s inclination with respect to theequilibrium position. The core of the system is made up of amicrocontroller, whose function is to calculate the controller’sactions using the information arriving from the various sensors.This microcontroller communicates with a PC, allowing col-lection of relevant vehicle data for analysis. The rest of thispaper is organized as follows; Section 2 describes the differentcomponents of the system, and the relationship between them,both at hardware and software levels. Section 3 shows themathematical model. Section 4 presents the controller designalong with simulation results. Treatment of sensor informationtogether with experimental results are addressed in Section 5.�
Sponsored by the scientific research deanery at IUG
Finally in Section 6, conclusions and suggestions for futurework are presented.
Fig. 1. General view of the vehicle
2. SYSTEM ARCHITECTURE
The system has a low-cost microcontroller (PIC16F877A, byMicrochip) [12], which communicates with various peripherals.As it can be seen in Figure 2, there are two sets of devicesconnected to the microcontroller: sensors and actuators. Theset of sensors is made up by a gyroscope and an accelerometerfor balancing, and a potentiometer for steering measurements.The gyroscope and accelerometer were chosen from the AnalogDevices iMEMS (ADXL203EB and ADXL203EB) [13, 14].They report an analog voltage between 0V and 5V to the con-troller. The gyroscope is used simply to measure angular rate.The accelerometer is used to indirectly measure the directionof the force of gravity, since it is really sensing force per unitmass along a given axis. This, along with a small angle approxi-mation, gives an estimate of the angle to horizontal. The systemactuators are two geared electric motors that run on 24VDC andare able to reach 220 rpm.
Proceedings of the 2nd Mediterranean Conference on Intelligent Systems and AutomationMarch 2009. Zarzis, Tunisia.
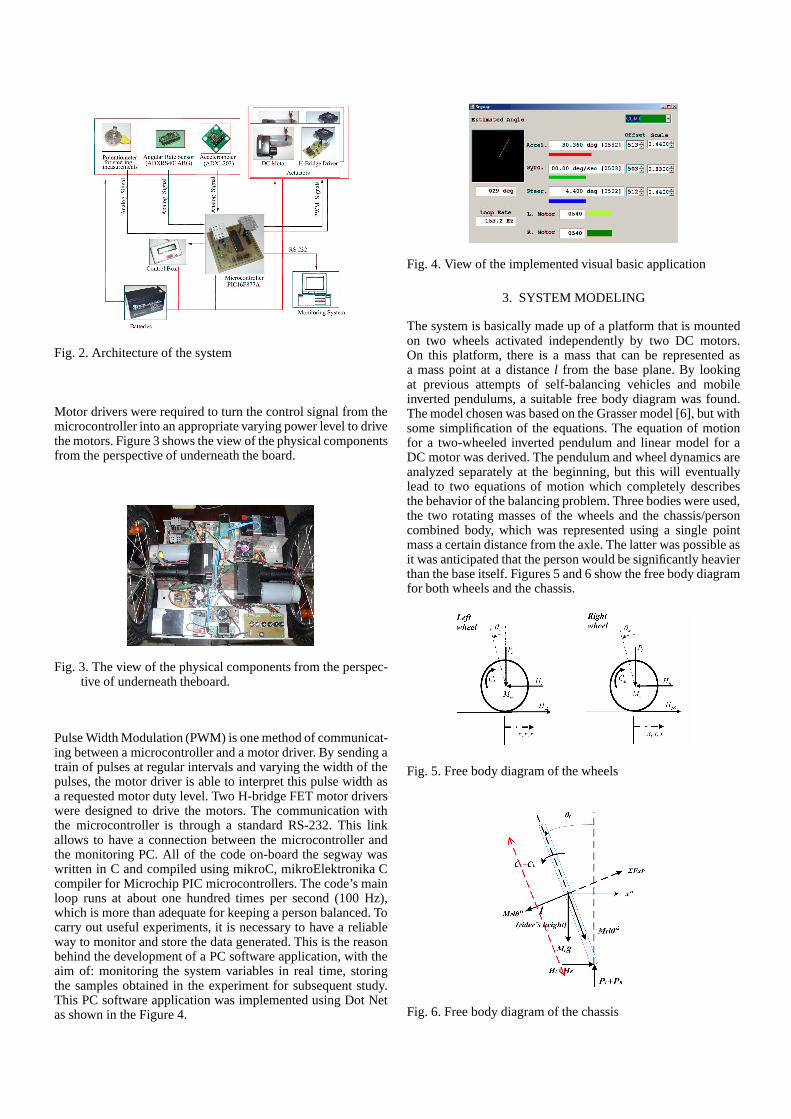
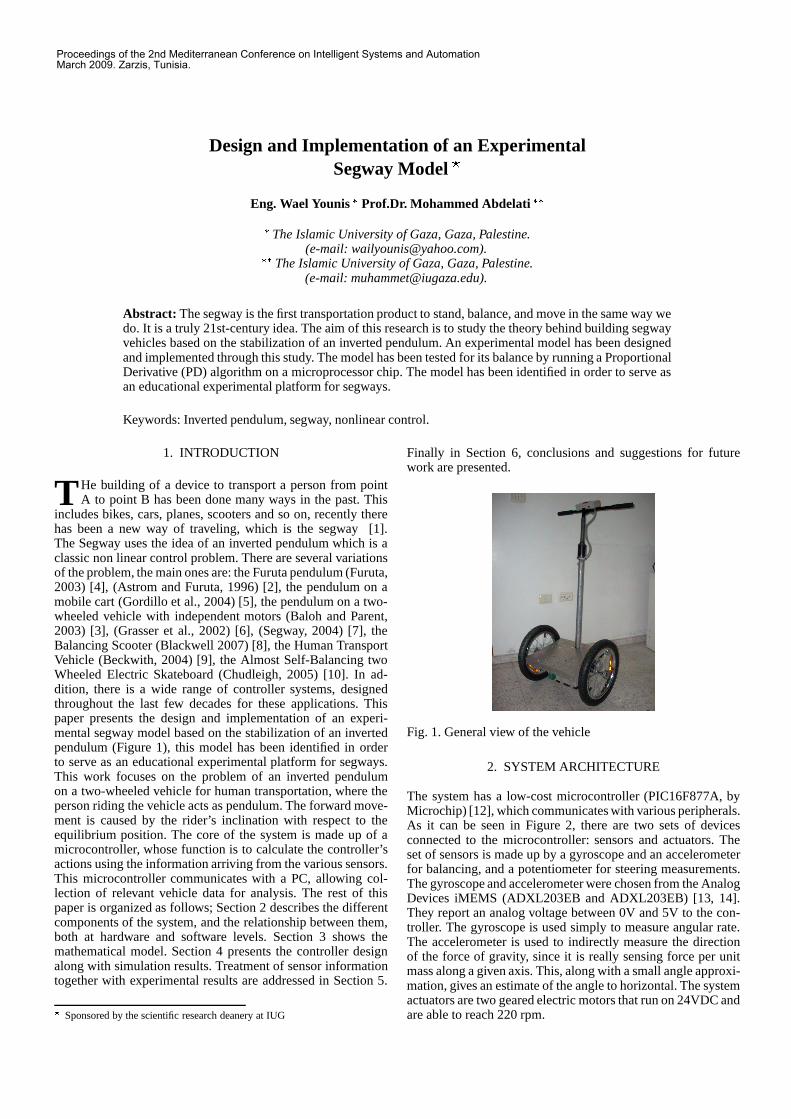
Fig. 2. Architecture of the system
Motor drivers were required to turn the control signal from themicrocontroller into an appropriate varying power level to drivethe motors. Figure 3 shows the view of the physical componentsfrom the perspective of underneath the board.
Fig. 3. The view of the physical components from the perspec-tive of underneath theboard.
Pulse Width Modulation (PWM) is one method of communicat-ing between a microcontroller and a motor driver. By sending atrain of pulses at regular intervals and varying the width of thepulses, the motor driver is able to interpret this pulse width asa requested motor duty level. Two H-bridge FET motor driverswere designed to drive the motors. The communication withthe microcontroller is through a standard RS-232. This linkallows to have a connection between the microcontroller andthe monitoring PC. All of the code on-board the segway waswritten in C and compiled using mikroC, mikroElektronika Ccompiler for Microchip PIC microcontrollers. The code’s mainloop runs at about one hundred times per second (100 Hz),which is more than adequate for keeping a person balanced. Tocarry out useful experiments, it is necessary to have a reliableway to monitor and store the data generated. This is the reasonbehind the development of a PC software application, with theaim of: monitoring the system variables in real time, storingthe samples obtained in the experiment for subsequent study.This PC software application was implemented using Dot Netas shown in the Figure 4.
Fig. 4. View of the implemented visual basic application
3. SYSTEM MODELING
The system is basically made up of a platform that is mountedon two wheels activated independently by two DC motors.On this platform, there is a mass that can be represented asa mass point at a distance l from the base plane. By lookingat previous attempts of self-balancing vehicles and mobileinverted pendulums, a suitable free body diagram was found.The model chosen was based on the Grasser model [6], but withsome simplification of the equations. The equation of motionfor a two-wheeled inverted pendulum and linear model for aDC motor was derived. The pendulum and wheel dynamics areanalyzed separately at the beginning, but this will eventuallylead to two equations of motion which completely describesthe behavior of the balancing problem. Three bodies were used,the two rotating masses of the wheels and the chassis/personcombined body, which was represented using a single pointmass a certain distance from the axle. The latter was possible asit was anticipated that the person would be significantly heavierthan the base itself. Figures 5 and 6 show the free body diagramfor both wheels and the chassis.
Fig. 5. Free body diagram of the wheels
Fig. 6. Free body diagram of the chassis
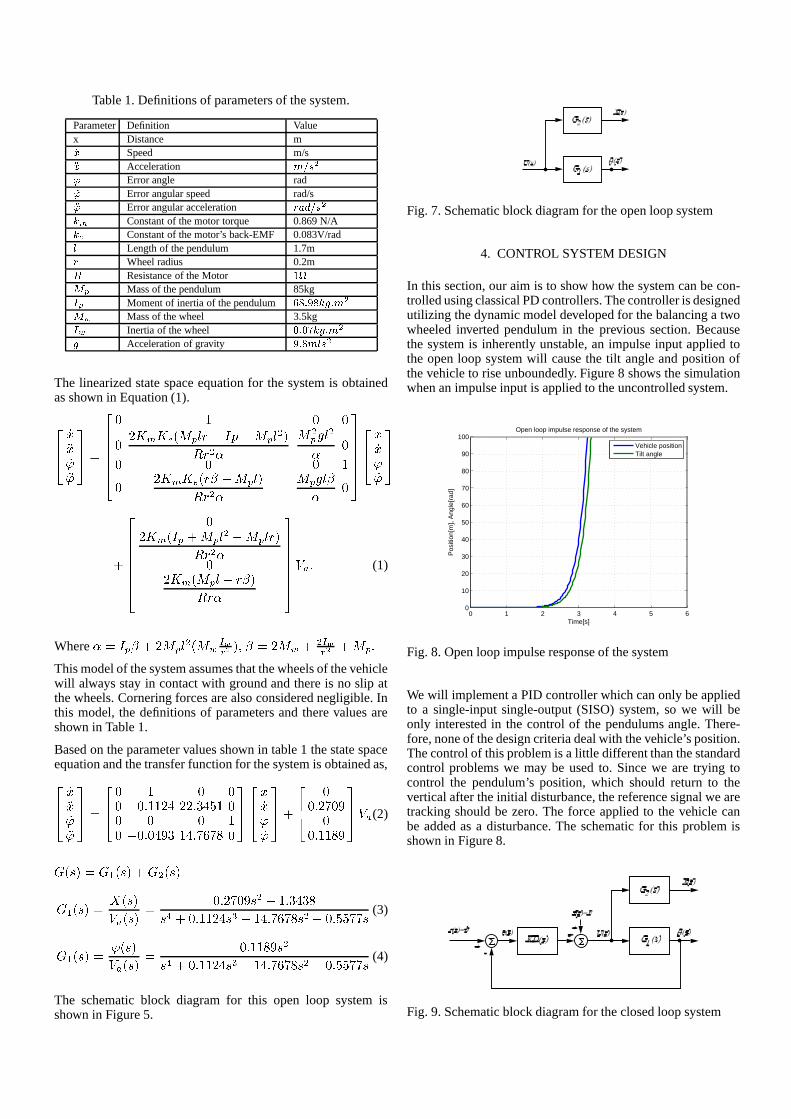
Table 1. Definitions of parameters of the system.
Parameter Definition Valuex Distance m�� Speed m/s�� Acceleration ��� �� Error angle rad�� Error angular speed rad/s�� Error angular acceleration �������� ����
Constant of the motor torque 0.869 N/A���Constant of the motor’s back-EMF 0.083V/rad�Length of the pendulum 1.7m� Wheel radius 0.2m�Resistance of the Motor �����Mass of the pendulum 85kg���Moment of inertia of the pendulum �� "! #� �"$ ! �%��'&Mass of the wheel 3.5kg�(&Inertia of the wheel )"! )+* �"$ ! �%�$Acceleration of gravity #"! �� � �
The linearized state space equation for the system is obtainedas shown in Equation (1).
,-./0 10 /2 123 4576
,-----.8 9 8 88;:=<?>@<BADC�EGF=HJILKNM�OPKQEGF=HSR"TU I R"V EWRFYX HSRV 88 8 8 98 :=<?>L<BADCJIDZ[KQEGF\H�TU I R"V EGF X HJZV 8
3 444445,-.0 /02 /23 45
],------.
8:=<?>'CSM F ] EGF=HSR^KQEGF=HJI=TU I R"V8:=<?>'C�EGF=H_K`IDZaTU I V
3 4444445bdcfe
(1)
Where V 6 M F=Z ] :gEGF\HSRgC�EQhikjl m T�nDZ 6 :gEQh ] R ikjl m ] EGF eThis model of the system assumes that the wheels of the vehiclewill always stay in contact with ground and there is no slip atthe wheels. Cornering forces are also considered negligible. Inthis model, the definitions of parameters and there values areshown in Table 1.
Based on the parameter values shown in table 1 the state spaceequation and the transfer function for the system is obtained as,,-./0 10 /2 123 45 6
,-.8 9 8 88 K 8 e 9g9 :\op:g: e q osr 9t88 8 8 98 K 8 e 8 ofu q 9 o e v\wsv\x 8
3 45,-.0 /02 /23 45 ]
,-.
88 e : v 8 u88 e 9g9 x u3 45 bdc (2)
y C�zDT 6 y'{ C�zDT ] y R C�zDTy'{ C�zDT 6}| C�zDTbdc C�zDT 68 e : v 8 ufz"R~K 9 e q o qgxz�� ] 8 e 9g9 :\osz"��K 9 o e v\wsv\x z R K 8 e rgr vgv z (3)
y'{ C�zDT 6 2 C�zDTbdc C�zDT 68 e 9g9 x ufz"Rz�� ] 8 e 9g9 :\osz"��K 9 o e v\wsv\x z R K 8 e rgr vgv z (4)
The schematic block diagram for this open loop system isshown in Figure 5.
Fig. 7. Schematic block diagram for the open loop system
4. CONTROL SYSTEM DESIGN
In this section, our aim is to show how the system can be con-trolled using classical PD controllers. The controller is designedutilizing the dynamic model developed for the balancing a twowheeled inverted pendulum in the previous section. Becausethe system is inherently unstable, an impulse input applied tothe open loop system will cause the tilt angle and position ofthe vehicle to rise unboundedly. Figure 8 shows the simulationwhen an impulse input is applied to the uncontrolled system.
0 1 2 3 4 5 60
10
20
30
40
50
60
70
80
90
100Open loop impulse response of the system
Pos
ition
[m],
Ang
le[r
ad]
Time[s]
Vehicle positionTilt angle
Fig. 8. Open loop impulse response of the system
We will implement a PID controller which can only be appliedto a single-input single-output (SISO) system, so we will beonly interested in the control of the pendulums angle. There-fore, none of the design criteria deal with the vehicle’s position.The control of this problem is a little different than the standardcontrol problems we may be used to. Since we are trying tocontrol the pendulum’s position, which should return to thevertical after the initial disturbance, the reference signal we aretracking should be zero. The force applied to the vehicle canbe added as a disturbance. The schematic for this problem isshown in Figure 8.
Fig. 9. Schematic block diagram for the closed loop system
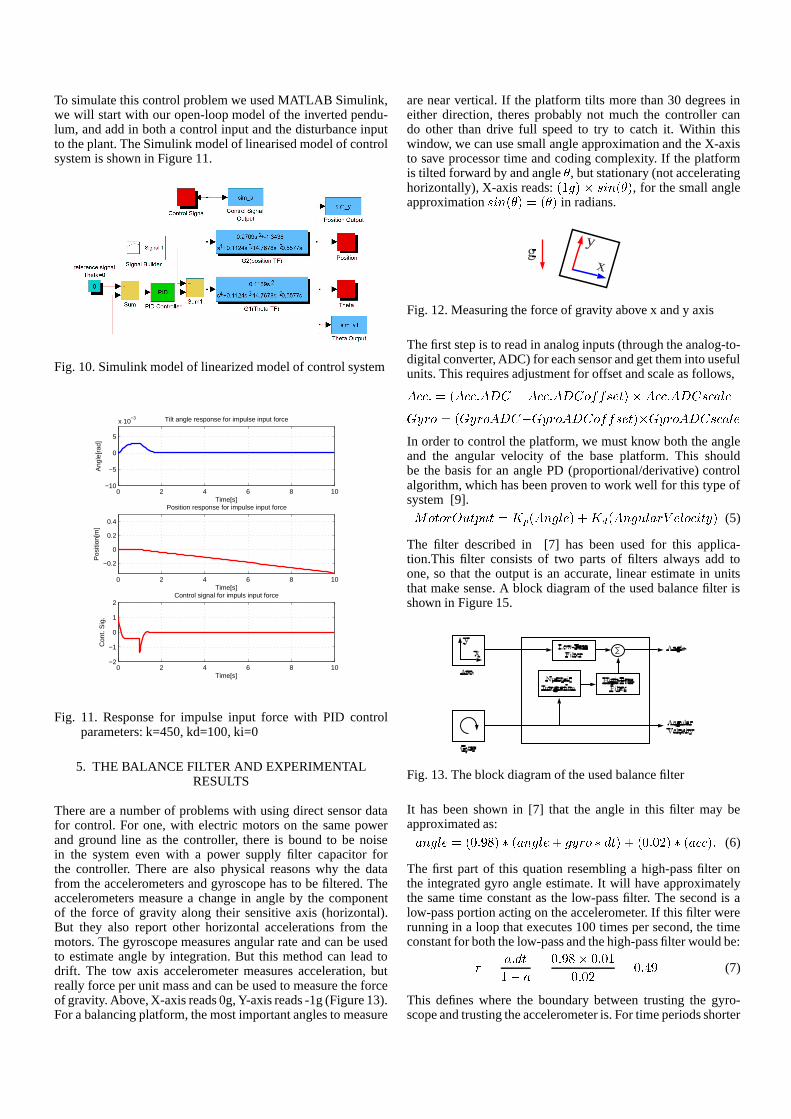
To simulate this control problem we used MATLAB Simulink,we will start with our open-loop model of the inverted pendu-lum, and add in both a control input and the disturbance inputto the plant. The Simulink model of linearised model of controlsystem is shown in Figure 11.
Fig. 10. Simulink model of linearized model of control system
0 2 4 6 8 10−10
−5
0
5
x 10−3 Tilt angle response for impulse input force
Ang
le[r
ad]
Time[s]
0 2 4 6 8 10
−0.2
0
0.2
0.4
Position response for impulse input force
Pos
ition
[m]
Time[s]
0 2 4 6 8 10−2
−1
0
1
2Control signal for impuls input force
Con
t. S
ig.
Time[s]
Fig. 11. Response for impulse input force with PID controlparameters: k=450, kd=100, ki=0
5. THE BALANCE FILTER AND EXPERIMENTALRESULTS
There are a number of problems with using direct sensor datafor control. For one, with electric motors on the same powerand ground line as the controller, there is bound to be noisein the system even with a power supply filter capacitor forthe controller. There are also physical reasons why the datafrom the accelerometers and gyroscope has to be filtered. Theaccelerometers measure a change in angle by the componentof the force of gravity along their sensitive axis (horizontal).But they also report other horizontal accelerations from themotors. The gyroscope measures angular rate and can be usedto estimate angle by integration. But this method can lead todrift. The tow axis accelerometer measures acceleration, butreally force per unit mass and can be used to measure the forceof gravity. Above, X-axis reads 0g, Y-axis reads -1g (Figure 13).For a balancing platform, the most important angles to measure
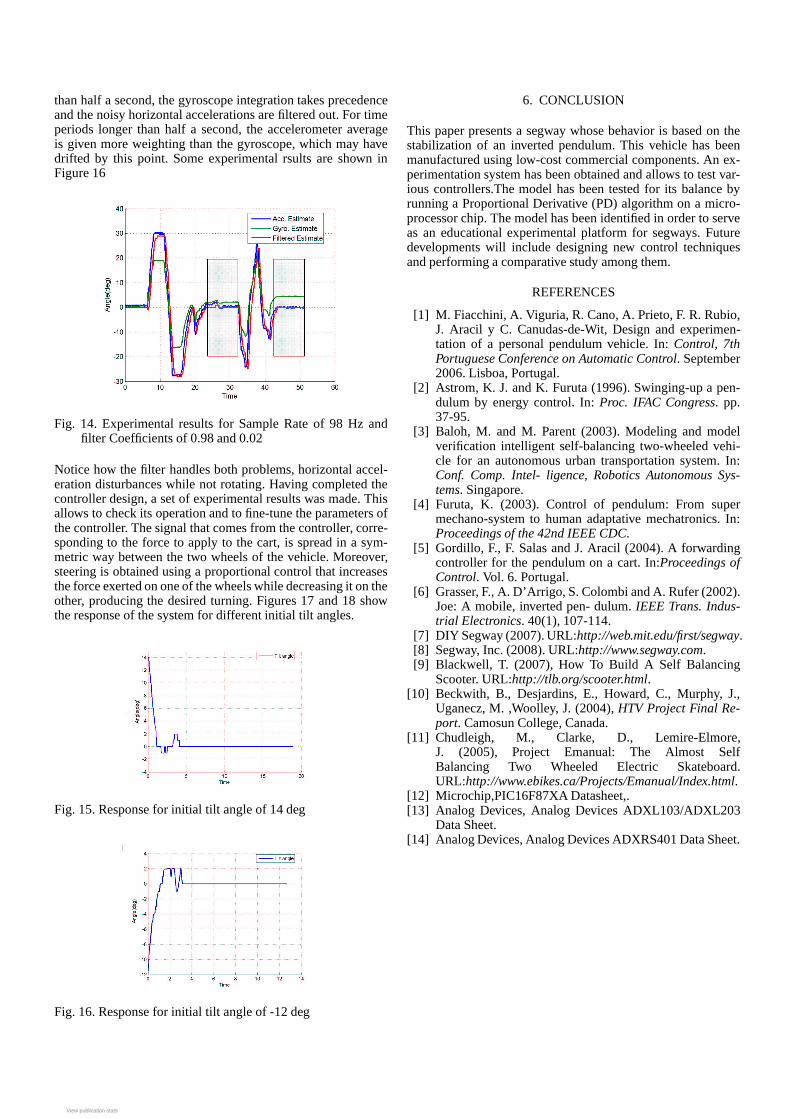
are near vertical. If the platform tilts more than 30 degrees ineither direction, theres probably not much the controller cando other than drive full speed to try to catch it. Within thiswindow, we can use small angle approximation and the X-axisto save processor time and coding complexity. If the platformis tilted forward by and angle � , but stationary (not acceleratinghorizontally), X-axis reads: C 9 X T��Gz��k��CJ�fT , for the small angleapproximation z��k��CJ�fT 6 CJ�fT in radians.
Fig. 12. Measuring the force of gravity above x and y axis
The first step is to read in analog inputs (through the analog-to-digital converter, ADC) for each sensor and get them into usefulunits. This requires adjustment for offset and scale as follows,�@�+� e 6 C �@�+� e �@�B� K �@�+� e �@�B��=��� z"�"��T^� �@�+� e �@�B� z �+� HS�y� I � 6 C y� I �\�@�B� K y� I �\�@�B��=��� z"�"��T=� y� I �\�@�B� z �+� HS�In order to control the platform, we must know both the angleand the angular velocity of the base platform. This shouldbe the basis for an angle PD (proportional/derivative) controlalgorithm, which has been proven to work well for this type ofsystem [9].E � � � I=�L�d��OY�d� 6 <�F�C � � X HS�\T ] <B�fC � � X �_H � I b �DH �\� �k� � T (5)
The filter described in [7] has been used for this applica-tion.This filter consists of two parts of filters always add toone, so that the output is an accurate, linear estimate in unitsthat make sense. A block diagram of the used balance filter isshown in Figure 15.
Fig. 13. The block diagram of the used balance filter
It has been shown in [7] that the angle in this filter may beapproximated as:� � X HS� 6 C 8 e u x T��LC � � X HS� ] X � I � �~�g��T ] C 8 e 8 :gT��LC �s�+� T e (6)
The first part of this quation resembling a high-pass filter onthe integrated gyro angle estimate. It will have approximatelythe same time constant as the low-pass filter. The second is alow-pass portion acting on the accelerometer. If this filter wererunning in a loop that executes 100 times per second, the timeconstant for both the low-pass and the high-pass filter would be:� 6 � e �g�9 K � 6
8 e u x � 8 e 8�98 e 8 : 6 8 e ofu (7)
This defines where the boundary between trusting the gyro-scope and trusting the accelerometer is. For time periods shorter
than half a second, the gyroscope integration takes precedenceand the noisy horizontal accelerations are filtered out. For timeperiods longer than half a second, the accelerometer averageis given more weighting than the gyroscope, which may havedrifted by this point. Some experimental rsults are shown inFigure 16
Fig. 14. Experimental results for Sample Rate of 98 Hz andfilter Coefficients of 0.98 and 0.02
Notice how the filter handles both problems, horizontal accel-eration disturbances while not rotating. Having completed thecontroller design, a set of experimental results was made. Thisallows to check its operation and to fine-tune the parameters ofthe controller. The signal that comes from the controller, corre-sponding to the force to apply to the cart, is spread in a sym-metric way between the two wheels of the vehicle. Moreover,steering is obtained using a proportional control that increasesthe force exerted on one of the wheels while decreasing it on theother, producing the desired turning. Figures 17 and 18 showthe response of the system for different initial tilt angles.
Fig. 15. Response for initial tilt angle of 14 deg
Fig. 16. Response for initial tilt angle of -12 deg
6. CONCLUSION
This paper presents a segway whose behavior is based on thestabilization of an inverted pendulum. This vehicle has beenmanufactured using low-cost commercial components. An ex-perimentation system has been obtained and allows to test var-ious controllers.The model has been tested for its balance byrunning a Proportional Derivative (PD) algorithm on a micro-processor chip. The model has been identified in order to serveas an educational experimental platform for segways. Futuredevelopments will include designing new control techniquesand performing a comparative study among them.
REFERENCES
[1] M. Fiacchini, A. Viguria, R. Cano, A. Prieto, F. R. Rubio,J. Aracil y C. Canudas-de-Wit, Design and experimen-tation of a personal pendulum vehicle. In: Control, 7thPortuguese Conference on Automatic Control. September2006. Lisboa, Portugal.
[2] Astrom, K. J. and K. Furuta (1996). Swinging-up a pen-dulum by energy control. In: Proc. IFAC Congress. pp.37-95.
[3] Baloh, M. and M. Parent (2003). Modeling and modelverification intelligent self-balancing two-wheeled vehi-cle for an autonomous urban transportation system. In:Conf. Comp. Intel- ligence, Robotics Autonomous Sys-tems. Singapore.
[4] Furuta, K. (2003). Control of pendulum: From supermechano-system to human adaptative mechatronics. In:Proceedings of the 42nd IEEE CDC.
[5] Gordillo, F., F. Salas and J. Aracil (2004). A forwardingcontroller for the pendulum on a cart. In:Proceedings ofControl. Vol. 6. Portugal.
[6] Grasser, F., A. D’Arrigo, S. Colombi and A. Rufer (2002).Joe: A mobile, inverted pen- dulum. IEEE Trans. Indus-trial Electronics. 40(1), 107-114.
[7] DIY Segway (2007). URL:http://web.mit.edu/first/segway.[8] Segway, Inc. (2008). URL:http://www.segway.com.[9] Blackwell, T. (2007), How To Build A Self Balancing
Scooter. URL:http://tlb.org/scooter.html.[10] Beckwith, B., Desjardins, E., Howard, C., Murphy, J.,
Uganecz, M. ,Woolley, J. (2004), HTV Project Final Re-port. Camosun College, Canada.
[11] Chudleigh, M., Clarke, D., Lemire-Elmore,J. (2005), Project Emanual: The Almost SelfBalancing Two Wheeled Electric Skateboard.URL:http://www.ebikes.ca/Projects/Emanual/Index.html.
[12] Microchip,PIC16F87XA Datasheet,.[13] Analog Devices, Analog Devices ADXL103/ADXL203
Data Sheet.[14] Analog Devices, Analog Devices ADXRS401 Data Sheet.
View publication statsView publication stats