Embed Size (px)
Citation preview
DESIGN AND OPTIMISATION OF A PHASED ARRAY TRANSDUCER FOR
ULTRASONIC INSPECTION OF LARGE FORGED STEEL INGOTS
Frederic Dupont-Marillia1,a), Mohammad Jahazi1,b), Serge Lafrenier2,c), Pierre Belanger1,d)
1 Department of mechanical engineering, École de technologie supérieure, 1100 rue Notre-Dame Ouest, Montreal,
Quebec, Canada
2 Finkl Steel Sorel, 100 Rue McCarthy Saint-Joseph-de-Sorel, Canada
a)Corresponding author: [email protected] b)[email protected]
c) [email protected] d)[email protected]
Abstract
Large steel forgings are used in numerous industries. This paper investigates the possibility of adapting ultrasonic
phased array testing to the inspection of forged steel blocks with dimensions of up to 1000 mm in every direction.
The paper looks at two objectives in order to provide the best inspection performance: (1) the ultrasonic phased
array probe optimisation and (2) the ultrasonic wave transmission sequence in a total focusing method imaging
scenario. The CIVA software suite was used to optimize the phased array probe element count and width in a full
matrix capture configuration. Based on the simulation results, a 32-element transducer was then built and tested in a
777 mm forged steel block using full matrix capture, plane wave and Hadamard transmission sequences. It was
observed that plane wave and Hadamard sequences transmit significantly more energy inside the test sample
because the elements are emitting simultaneously, therefore leading to an improved signal-to-noise ratio. However,
the horizontal resolution was a strong limitation for every transmission sequence, especially for plane waves,
because of the limited range of angles available in a block of large dimensions. The Hadamard transmission
sequence was shown to represent the best compromise in terms of defect reflected amplitude, signal-to-noise ratio
and resolution. The experimental results were compared with simulations and were found to be in very good
agreement.
Keywords: Phased array; large size; forged steel; Full Matrix Capture; Plane Wave; Hadamard; Imaging;
Introduction
Ultrasonic waves have been used for over 60 years in
the medical and industrial fields. Ultrasonic testing (UT)
is the most widely used non-destructive testing (NDT)
method to inspect parts, measure dimensions and
evaluate material properties. More recently, phased
array ultrasonic testing (PAUT) was developed to
generate images of parts under inspection, and has
demonstrated many advantages in terms of probability
of detection and inspection cost [1]. Over the past
decade, PAUT has been applied to ensure the quality of
safety-critical components in the aerospace, power
generation and oil and gas industries. Indeed, ultrasonic
imaging allows the visualisation of cracks, porosities or
other subsurface defects of test specimens. Nowadays,
the research community is moving its focus to
increasing the image reconstruction rate [2], precision
and signal-to-noise ratio (SNR) [3], as well as
inspecting more complex components such as those
made of highly attenuating materials [4] and anisotropic
materials [5]. In some particular applications, e.g.,
automotive injection moulding, large forged steel blocks
are produced, and their NDT is of significant concern
because of the long propagation distances associated
with the dimensions of the blocks, which lead to strong
signal attenuation. Moreover, defects located close to
the centre of the block are of high interest since they
may correspond to moulding surfaces.
This paper thus investigates the ultrasonic imaging of
large steel forgings (more than 1000 mm in every
direction) from (1) the probe design and (2) the wave
transmission sequence. Conventional commercially
available PAUT probes are typically not powerful
enough to generate ultrasonic waves with enough
energy to detect defects or other heterogeneities at
distances up to 1000 mm because of the small
dimensions of the piezoelectric elements involved. In
that context, single element transducers with large
diameters (usually more than 25 mm) are still preferred
because imaging of large blocks remains too
challenging. For these reasons, an adapted probe and
several transmission sequences were studied to improve
PAUT imaging in large forged steel blocks.
The aim in this study is to maximise the energy
transmitted into the block without sacrificing the image
resolution or the probability of detection of typical
defects. The first part of this paper focuses on the probe
design. Probe properties such as the element count, the
element width and the aperture were studied in order to
evaluate their influence on the energy transmitted into
the test sample, as well as the imaging sensitivity and
resolution. The second part of the paper investigates
alternative wave transmission sequences. Today, the
total focusing method (TFM) [6] with the full matrix
capture (FMC) [7] wave transmission sequence is of
great interest for industries because it allows a wide
range of inspections and an easy imaging reconstruction
process. Other methods studied in this paper include the
transmission of plane waves (PW) [8] generated from
the simultaneous activation of multiple elements
following a delay law to create plane wavefronts.
Finally, a new approach is proposed using a Hadamard
matrix for generating transmission sequences. This
novel method represents a compromise between FMC
and plane wave transmission for energy transmission
and SNR. The Hadamard transmission sequence
combines high-energy waves generated from the
simultaneous activation of multiple elements and the
acquisition on all element combinations similar to FMC.
This article begins with a review of the scientific
background relevant to this paper. The design and
optimisation of the PAUT probe are then presented in
simulations. Experimental validations of the PAUT
probe and the transmission sequences are then presented
and discussed. Finally, conclusions are drawn.
Wave Transmission Sequences
PAUT requires a probe that can transmit and receive on
multiple elements organised in a one- or two-
dimensional matrix. The present work only considers
one-dimensional linear arrays. Over the years, several
methods have been proposed for element activation,
leading to a range of different reconstruction algorithms.
In the context of the PAUT of a large block, the
conventional beam focusing technique does not appear
to be adapted because of the time required to focus
ultrasonic waves over a very large area. Therefore, the
present work compares images obtained through three
different transmission sequences: (1) FMC, (2) PW and
(3) the Hadamard matrix. Background information on
the three methods are detailed in the following
subsections.
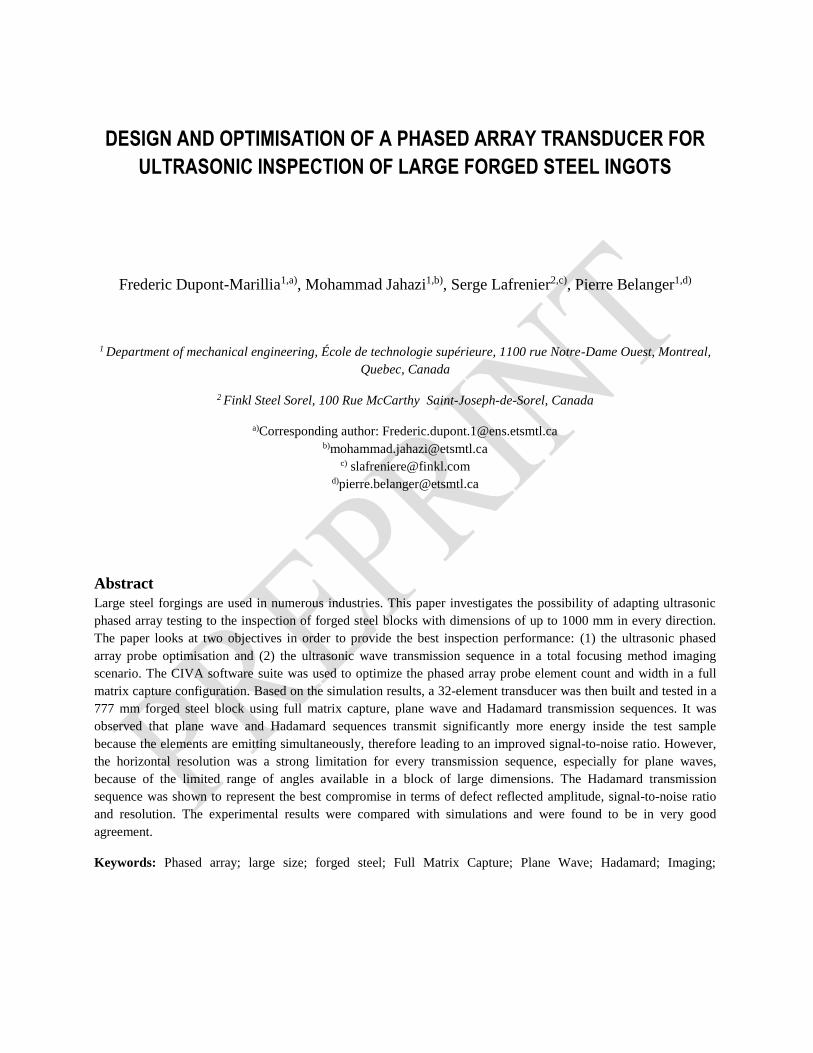
• Full Matrix Capture
FMC [7] performs the acquisition of M = N x N signals
corresponding to all pairs of elements in a probe. This
sequence has the advantage of being relatively simple to
implement since no delay laws are required. A
schematic of the FMC sequence is shown in Figure 1.
Figure 1: Schematic of the Full Matrix Capture wave
transmission sequence
Reconstruction is performed by coherently summing all
signals 𝑆𝑁𝑀 for each pixel i and j of the image matrix
using the following equation:
𝐴𝑁𝑀 = |𝐻 (∑ ∑ 𝑆𝑁𝑀(𝑡𝐸 + 𝑡𝑅)
𝑀
𝑁=1
𝑁
𝑁=1
)| (1)
where H is the Hilbert transform [9], 𝑡𝐸 is the time of
flight between the emitter E and the pixel of interest
(𝑥𝑀, 𝑦𝑀), 𝑡𝑅 is the time of flight between the receiver R
and the pixel of interest and 𝑉𝐿 is the longitudinal speed
of sound:
𝑡𝐸 =
√(𝑥𝑀 − 𝑥0)2 + (𝑦𝑀 − 𝑦0)2
𝑉𝐿⁄
𝑡𝑅 =√(𝑥𝑀 − 𝑥1)2 + (𝑦𝑀 − 𝑦0)2
𝑉𝐿⁄
(2)
(3)
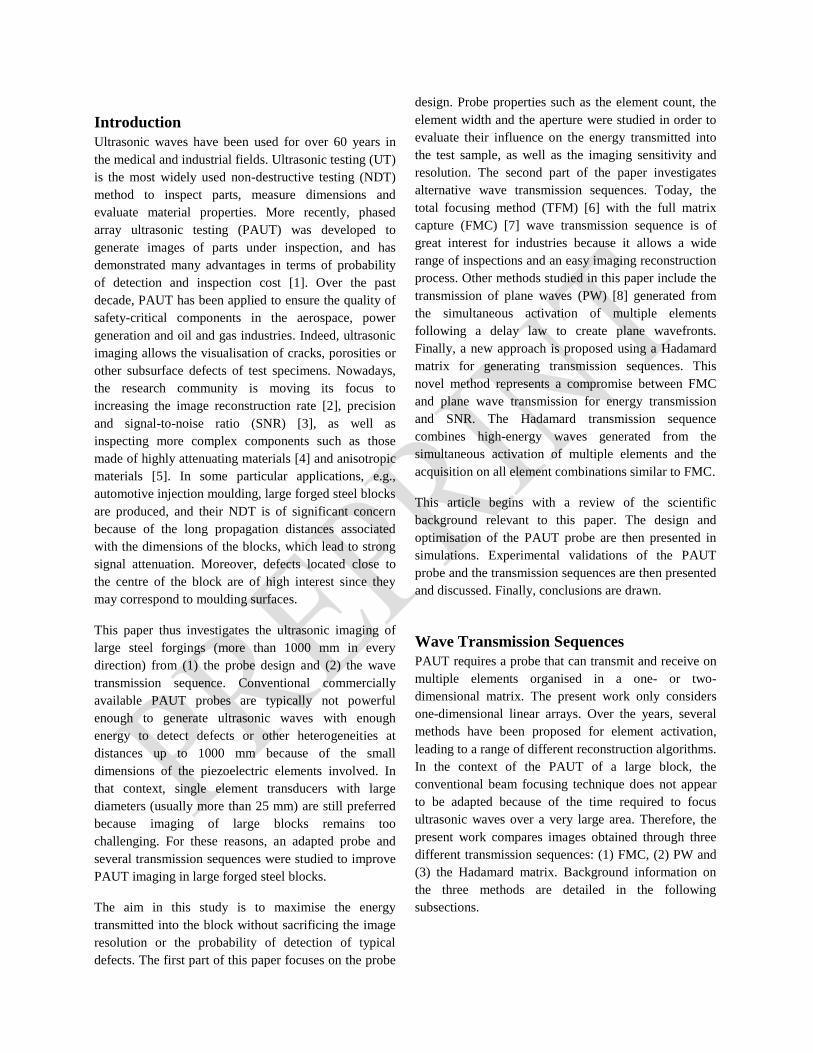
• Plane Wave Transmission
PW imaging was recently proposed in order to improve
the frame rate and the SNR [8]. This method activates
all elements at each transmission in order to generate a
coherent plane wavefront defined by the angle α relative
to the propagation axis. The energy transmitted into the
material is higher than for FMC, and SNR is therefore
increased. Contrary to FMC, for which the number of
transmissions depends on the number of elements, in
PW imaging, the number of transmissions is defined by
the number of angles (generally set between 10 and 30).
This low number of transmissions therefore leads to
high frame rate imaging [3], [10]. With PW, the
resolution mainly depends on the path differences
introduced by the different angles. In the context of the
inspection of blocks of large dimensions, the angular
range is limited by the geometry associated with the
long propagation distances involved. A schematic of the
PW transmission and acquisition sequence in presented
in Figure 2.
The coherent signal summation for image reconstruction
also uses equation (1) from the subsection above. The
time of flight between the pixel of interest and a
receiver (𝑡𝑅) remain unchanged from equation (2), but
the time of flight between an emitter and the pixel of
interest (𝑡𝐸) depends on the wavefront angle, and can be
found with:
𝑡𝐸 =
(𝑥𝑀 − 𝑥0) sin 𝛼 + (𝑦𝑀 − 𝑦0) cos 𝛼
𝑉𝐿
(4)
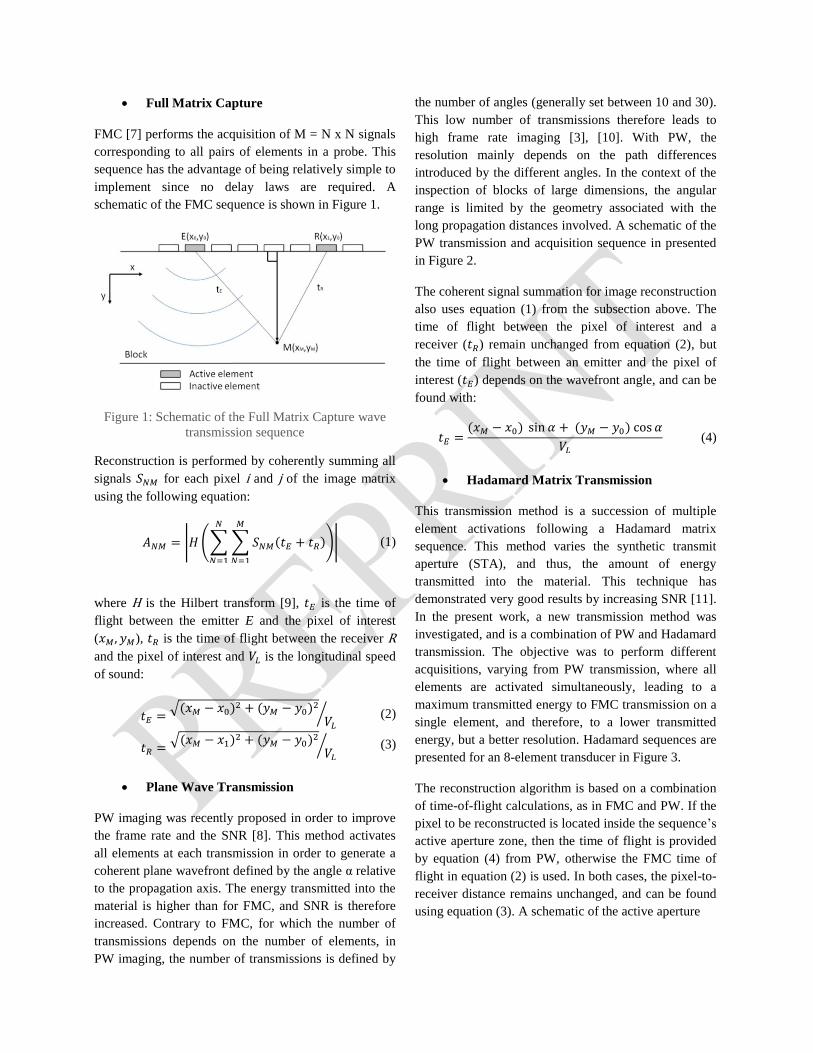
• Hadamard Matrix Transmission
This transmission method is a succession of multiple
element activations following a Hadamard matrix
sequence. This method varies the synthetic transmit
aperture (STA), and thus, the amount of energy
transmitted into the material. This technique has
demonstrated very good results by increasing SNR [11].
In the present work, a new transmission method was
investigated, and is a combination of PW and Hadamard
transmission. The objective was to perform different
acquisitions, varying from PW transmission, where all
elements are activated simultaneously, leading to a
maximum transmitted energy to FMC transmission on a
single element, and therefore, to a lower transmitted
energy, but a better resolution. Hadamard sequences are
presented for an 8-element transducer in Figure 3.
The reconstruction algorithm is based on a combination
of time-of-flight calculations, as in FMC and PW. If the
pixel to be reconstructed is located inside the sequence’s
active aperture zone, then the time of flight is provided
by equation (4) from PW, otherwise the FMC time of
flight in equation (2) is used. In both cases, the pixel-to-
receiver distance remains unchanged, and can be found
using equation (3). A schematic of the active aperture
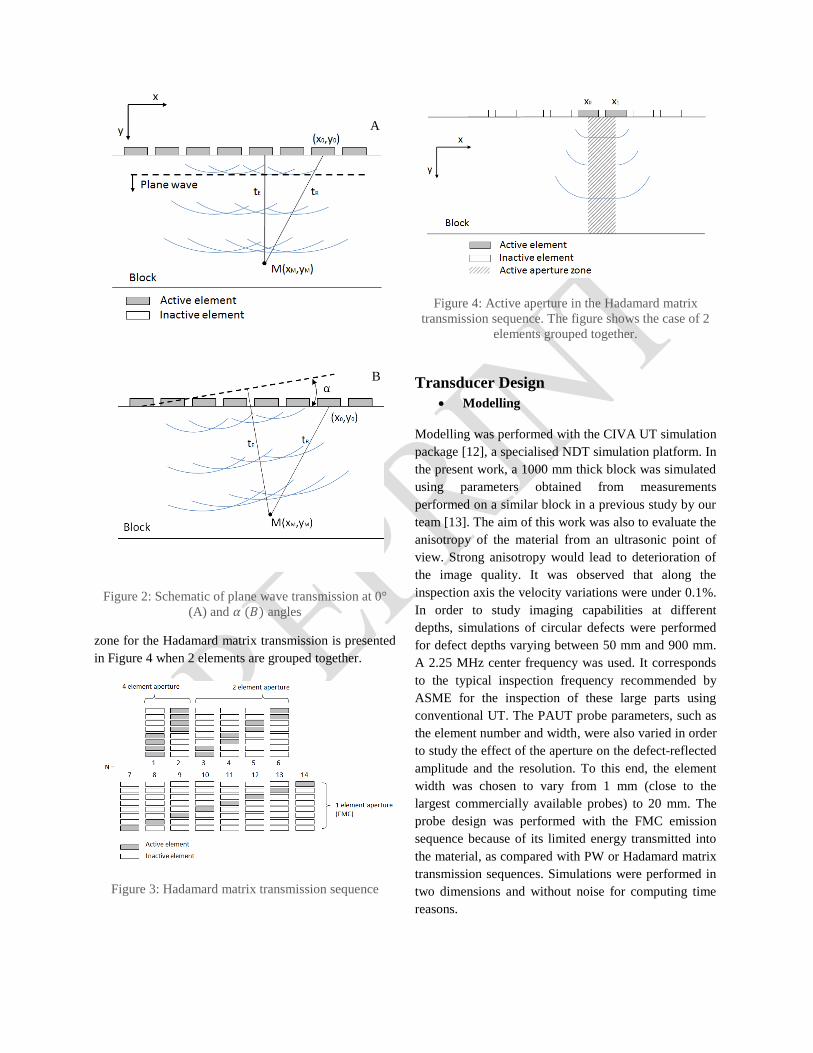
Figure 2: Schematic of plane wave transmission at 0°
(A) and 𝛼 (𝐵) angles
zone for the Hadamard matrix transmission is presented
in Figure 4 when 2 elements are grouped together.
Figure 3: Hadamard matrix transmission sequence
Figure 4: Active aperture in the Hadamard matrix
transmission sequence. The figure shows the case of 2
elements grouped together.
Transducer Design
• Modelling
Modelling was performed with the CIVA UT simulation
package [12], a specialised NDT simulation platform. In
the present work, a 1000 mm thick block was simulated
using parameters obtained from measurements
performed on a similar block in a previous study by our
team [13]. The aim of this work was also to evaluate the
anisotropy of the material from an ultrasonic point of
view. Strong anisotropy would lead to deterioration of
the image quality. It was observed that along the
inspection axis the velocity variations were under 0.1%.
In order to study imaging capabilities at different
depths, simulations of circular defects were performed
for defect depths varying between 50 mm and 900 mm.
A 2.25 MHz center frequency was used. It corresponds
to the typical inspection frequency recommended by
ASME for the inspection of these large parts using
conventional UT. The PAUT probe parameters, such as
the element number and width, were also varied in order
to study the effect of the aperture on the defect-reflected
amplitude and the resolution. To this end, the element
width was chosen to vary from 1 mm (close to the
largest commercially available probes) to 20 mm. The
probe design was performed with the FMC emission
sequence because of its limited energy transmitted into
the material, as compared with PW or Hadamard matrix
transmission sequences. Simulations were performed in
two dimensions and without noise for computing time
reasons.
A
B
• Simulations
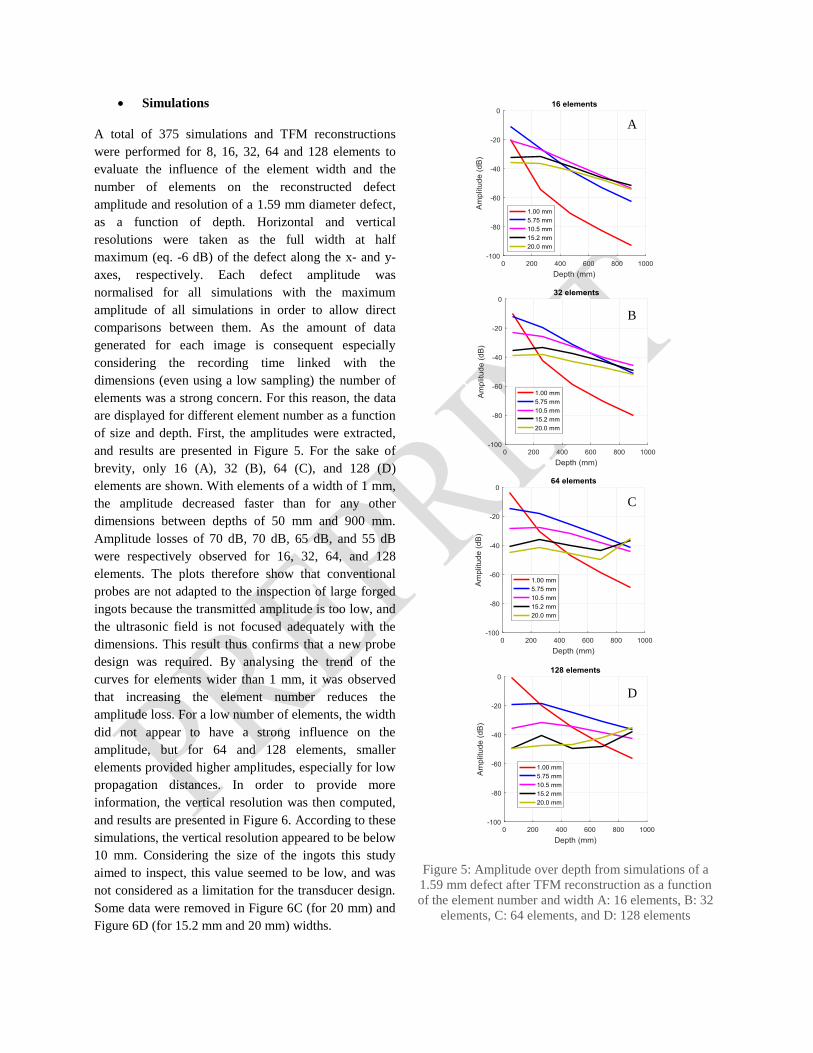
A total of 375 simulations and TFM reconstructions
were performed for 8, 16, 32, 64 and 128 elements to
evaluate the influence of the element width and the
number of elements on the reconstructed defect
amplitude and resolution of a 1.59 mm diameter defect,
as a function of depth. Horizontal and vertical
resolutions were taken as the full width at half
maximum (eq. -6 dB) of the defect along the x- and y-
axes, respectively. Each defect amplitude was
normalised for all simulations with the maximum
amplitude of all simulations in order to allow direct
comparisons between them. As the amount of data
generated for each image is consequent especially
considering the recording time linked with the
dimensions (even using a low sampling) the number of
elements was a strong concern. For this reason, the data
are displayed for different element number as a function
of size and depth. First, the amplitudes were extracted,
and results are presented in Figure 5. For the sake of
brevity, only 16 (A), 32 (B), 64 (C), and 128 (D)
elements are shown. With elements of a width of 1 mm,
the amplitude decreased faster than for any other
dimensions between depths of 50 mm and 900 mm.
Amplitude losses of 70 dB, 70 dB, 65 dB, and 55 dB
were respectively observed for 16, 32, 64, and 128
elements. The plots therefore show that conventional
probes are not adapted to the inspection of large forged
ingots because the transmitted amplitude is too low, and
the ultrasonic field is not focused adequately with the
dimensions. This result thus confirms that a new probe
design was required. By analysing the trend of the
curves for elements wider than 1 mm, it was observed
that increasing the element number reduces the
amplitude loss. For a low number of elements, the width
did not appear to have a strong influence on the
amplitude, but for 64 and 128 elements, smaller
elements provided higher amplitudes, especially for low
propagation distances. In order to provide more
information, the vertical resolution was then computed,
and results are presented in Figure 6. According to these
simulations, the vertical resolution appeared to be below
10 mm. Considering the size of the ingots this study
aimed to inspect, this value seemed to be low, and was
not considered as a limitation for the transducer design.
Some data were removed in Figure 6C (for 20 mm) and
Figure 6D (for 15.2 mm and 20 mm) widths.
Figure 5: Amplitude over depth from simulations of a
1.59 mm defect after TFM reconstruction as a function
of the element number and width A: 16 elements, B: 32
elements, C: 64 elements, and D: 128 elements
A
B
C
D
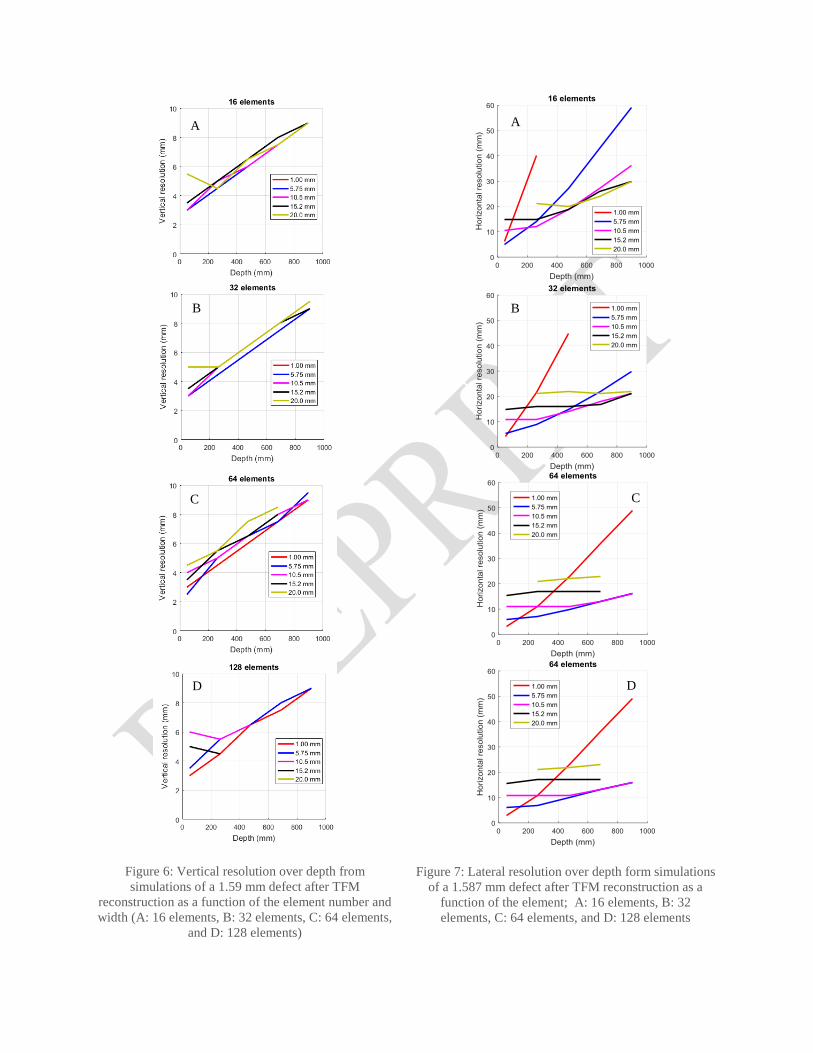
Figure 6: Vertical resolution over depth from
simulations of a 1.59 mm defect after TFM
reconstruction as a function of the element number and
width (A: 16 elements, B: 32 elements, C: 64 elements,
and D: 128 elements)
Figure 7: Lateral resolution over depth form simulations
of a 1.587 mm defect after TFM reconstruction as a
function of the element; A: 16 elements, B: 32
elements, C: 64 elements, and D: 128 elements
B
C
A
D D
C
B
A
The results were rejected because strong artefacts were
generated in these cases. Indeed, for some particular
probe configurations with more than 64 elements with
widths of 15.2 mm and greater, artefacts strongly
decreasing the image quality. These artefacts are
associated with constructive interferences which can be
removed by selecting data based on the angle between
emission and reception [14]. Finally, the lateral
resolution was extracted and analysed following the
same procedure, and results are presented in Figure 7.
Data points were rejected for 64 and 128 elements at 20
mm and 15.2 mm, respectively. The same artefacts
observed previously degraded the images and the
resolution value. Compared to the vertical resolution (
Figure 6), the lateral resolution appeared to be between
2.5 and 6 times higher. These high values showed that
the imaging quality would be limited by the lateral
resolution. In addition, it was observed that increasing
the element number improves the resolution. At high
depths, an element width between 5 mm and 15 mm
appeared to offer the best resolution.
Finally, using the amplitudes and resolutions that were
computed and extracted appeared to indicate that the
best configuration would be 32 elements with a width of
9.25 mm.
Experiments
Experiments were conducted on a large block of forged
steel with artificial defects, such as side drilled holes
and notches, at different depths.
• Material
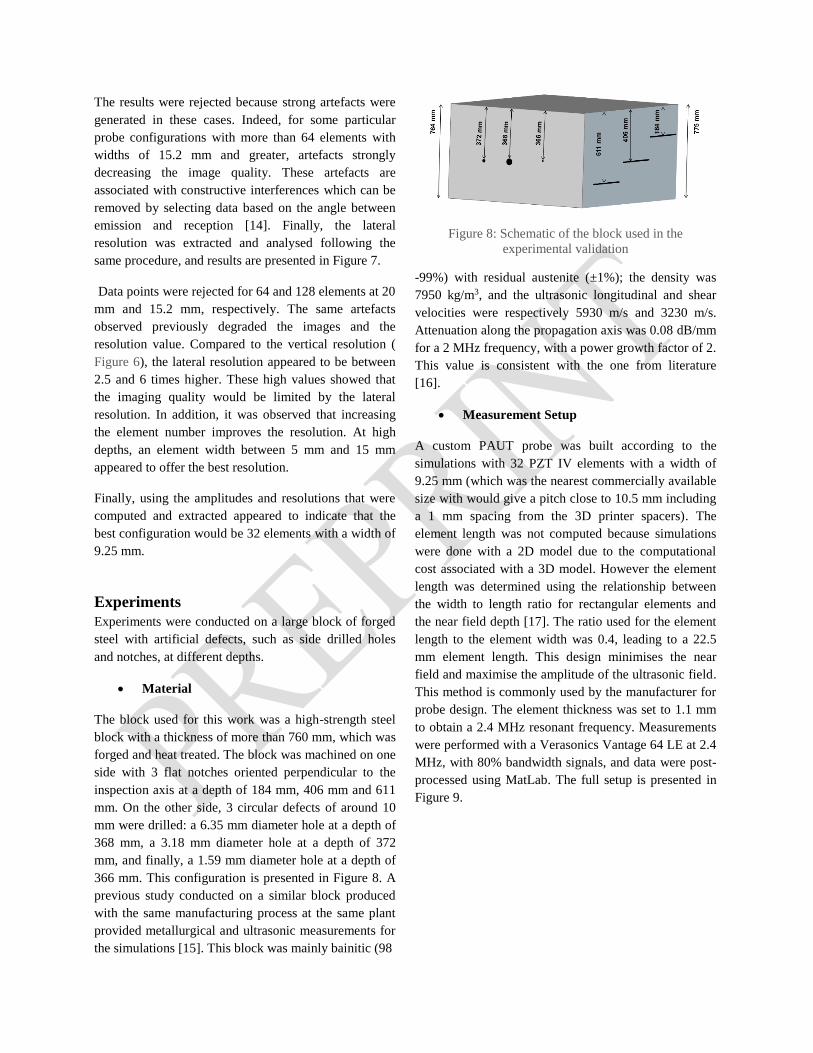
The block used for this work was a high-strength steel
block with a thickness of more than 760 mm, which was
forged and heat treated. The block was machined on one
side with 3 flat notches oriented perpendicular to the
inspection axis at a depth of 184 mm, 406 mm and 611
mm. On the other side, 3 circular defects of around 10
mm were drilled: a 6.35 mm diameter hole at a depth of
368 mm, a 3.18 mm diameter hole at a depth of 372
mm, and finally, a 1.59 mm diameter hole at a depth of
366 mm. This configuration is presented in Figure 8. A
previous study conducted on a similar block produced
with the same manufacturing process at the same plant
provided metallurgical and ultrasonic measurements for
the simulations [15]. This block was mainly bainitic (98
Figure 8: Schematic of the block used in the
experimental validation
-99%) with residual austenite (±1%); the density was
7950 kg/m3, and the ultrasonic longitudinal and shear
velocities were respectively 5930 m/s and 3230 m/s.
Attenuation along the propagation axis was 0.08 dB/mm
for a 2 MHz frequency, with a power growth factor of 2.
This value is consistent with the one from literature
[16].
• Measurement Setup
A custom PAUT probe was built according to the
simulations with 32 PZT IV elements with a width of
9.25 mm (which was the nearest commercially available
size with would give a pitch close to 10.5 mm including
a 1 mm spacing from the 3D printer spacers). The
element length was not computed because simulations
were done with a 2D model due to the computational
cost associated with a 3D model. However the element
length was determined using the relationship between
the width to length ratio for rectangular elements and
the near field depth [17]. The ratio used for the element
length to the element width was 0.4, leading to a 22.5
mm element length. This design minimises the near
field and maximise the amplitude of the ultrasonic field.
This method is commonly used by the manufacturer for
probe design. The element thickness was set to 1.1 mm
to obtain a 2.4 MHz resonant frequency. Measurements
were performed with a Verasonics Vantage 64 LE at 2.4
MHz, with 80% bandwidth signals, and data were post-
processed using MatLab. The full setup is presented in
Figure 9.
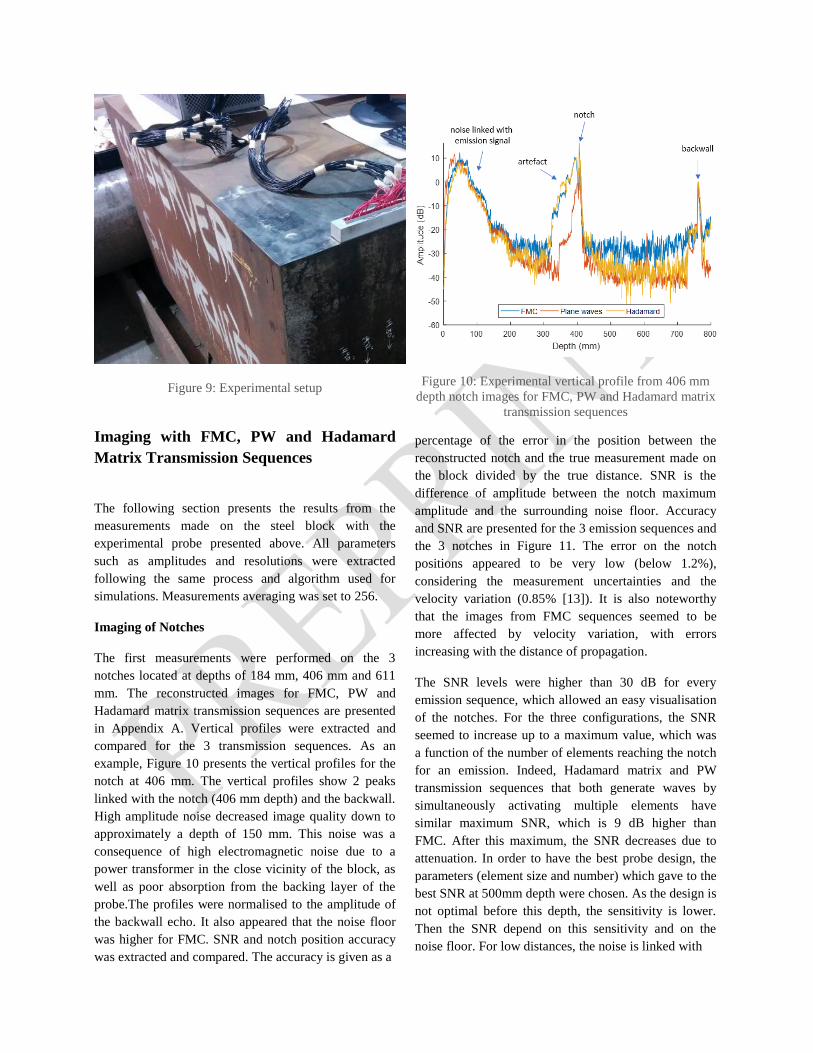
Figure 9: Experimental setup
Imaging with FMC, PW and Hadamard
Matrix Transmission Sequences
The following section presents the results from the
measurements made on the steel block with the
experimental probe presented above. All parameters
such as amplitudes and resolutions were extracted
following the same process and algorithm used for
simulations. Measurements averaging was set to 256.
Imaging of Notches
The first measurements were performed on the 3
notches located at depths of 184 mm, 406 mm and 611
mm. The reconstructed images for FMC, PW and
Hadamard matrix transmission sequences are presented
in Appendix A. Vertical profiles were extracted and
compared for the 3 transmission sequences. As an
example, Figure 10 presents the vertical profiles for the
notch at 406 mm. The vertical profiles show 2 peaks
linked with the notch (406 mm depth) and the backwall.
High amplitude noise decreased image quality down to
approximately a depth of 150 mm. This noise was a
consequence of high electromagnetic noise due to a
power transformer in the close vicinity of the block, as
well as poor absorption from the backing layer of the
probe.The profiles were normalised to the amplitude of
the backwall echo. It also appeared that the noise floor
was higher for FMC. SNR and notch position accuracy
was extracted and compared. The accuracy is given as a
Figure 10: Experimental vertical profile from 406 mm
depth notch images for FMC, PW and Hadamard matrix
transmission sequences
percentage of the error in the position between the
reconstructed notch and the true measurement made on
the block divided by the true distance. SNR is the
difference of amplitude between the notch maximum
amplitude and the surrounding noise floor. Accuracy
and SNR are presented for the 3 emission sequences and
the 3 notches in Figure 11. The error on the notch
positions appeared to be very low (below 1.2%),
considering the measurement uncertainties and the
velocity variation (0.85% [13]). It is also noteworthy
that the images from FMC sequences seemed to be
more affected by velocity variation, with errors
increasing with the distance of propagation.
The SNR levels were higher than 30 dB for every
emission sequence, which allowed an easy visualisation
of the notches. For the three configurations, the SNR
seemed to increase up to a maximum value, which was
a function of the number of elements reaching the notch
for an emission. Indeed, Hadamard matrix and PW
transmission sequences that both generate waves by
simultaneously activating multiple elements have
similar maximum SNR, which is 9 dB higher than
FMC. After this maximum, the SNR decreases due to
attenuation. In order to have the best probe design, the
parameters (element size and number) which gave to the
best SNR at 500mm depth were chosen. As the design is
not optimal before this depth, the sensitivity is lower.
Then the SNR depend on this sensitivity and on the
noise floor. For low distances, the noise is linked with
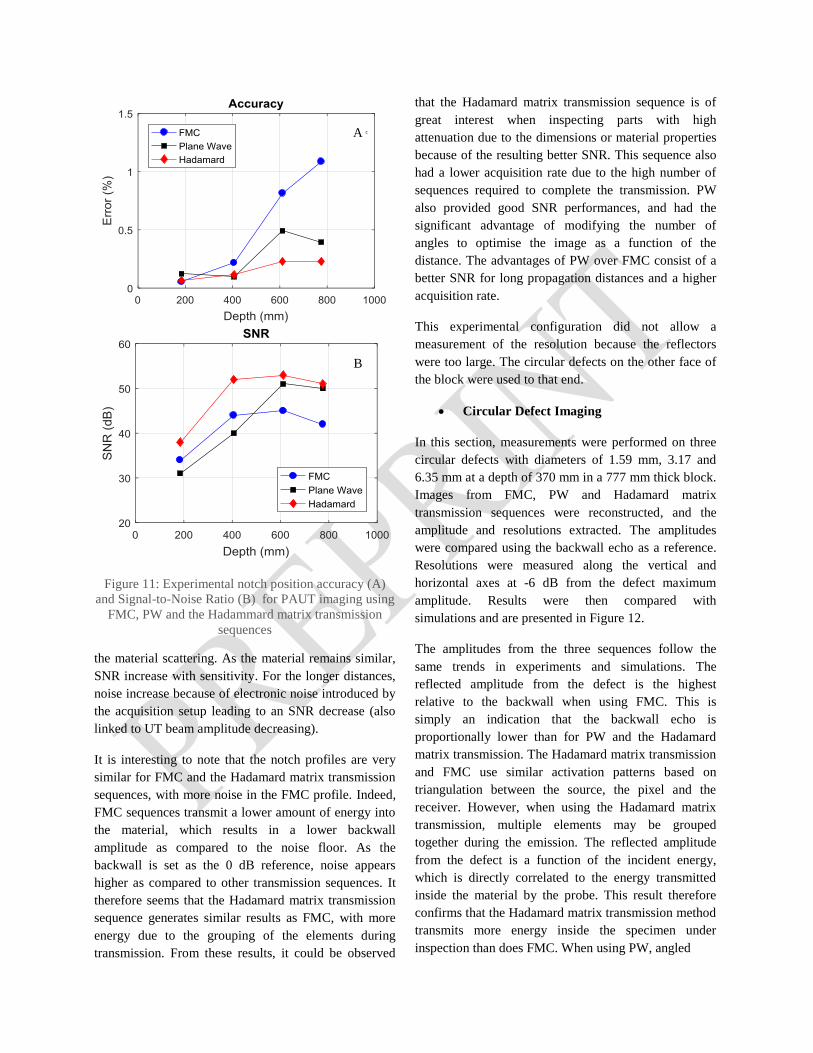
Figure 11: Experimental notch position accuracy (A)
and Signal-to-Noise Ratio (B) for PAUT imaging using
FMC, PW and the Hadammard matrix transmission
sequences
the material scattering. As the material remains similar,
SNR increase with sensitivity. For the longer distances,
noise increase because of electronic noise introduced by
the acquisition setup leading to an SNR decrease (also
linked to UT beam amplitude decreasing).
It is interesting to note that the notch profiles are very
similar for FMC and the Hadamard matrix transmission
sequences, with more noise in the FMC profile. Indeed,
FMC sequences transmit a lower amount of energy into
the material, which results in a lower backwall
amplitude as compared to the noise floor. As the
backwall is set as the 0 dB reference, noise appears
higher as compared to other transmission sequences. It
therefore seems that the Hadamard matrix transmission
sequence generates similar results as FMC, with more
energy due to the grouping of the elements during
transmission. From these results, it could be observed
that the Hadamard matrix transmission sequence is of
great interest when inspecting parts with high
attenuation due to the dimensions or material properties
because of the resulting better SNR. This sequence also
had a lower acquisition rate due to the high number of
sequences required to complete the transmission. PW
also provided good SNR performances, and had the
significant advantage of modifying the number of
angles to optimise the image as a function of the
distance. The advantages of PW over FMC consist of a
better SNR for long propagation distances and a higher
acquisition rate.
This experimental configuration did not allow a
measurement of the resolution because the reflectors
were too large. The circular defects on the other face of
the block were used to that end.
• Circular Defect Imaging
In this section, measurements were performed on three
circular defects with diameters of 1.59 mm, 3.17 and
6.35 mm at a depth of 370 mm in a 777 mm thick block.
Images from FMC, PW and Hadamard matrix
transmission sequences were reconstructed, and the
amplitude and resolutions extracted. The amplitudes
were compared using the backwall echo as a reference.
Resolutions were measured along the vertical and
horizontal axes at -6 dB from the defect maximum
amplitude. Results were then compared with
simulations and are presented in Figure 12.
The amplitudes from the three sequences follow the
same trends in experiments and simulations. The
reflected amplitude from the defect is the highest
relative to the backwall when using FMC. This is
simply an indication that the backwall echo is
proportionally lower than for PW and the Hadamard
matrix transmission. The Hadamard matrix transmission
and FMC use similar activation patterns based on
triangulation between the source, the pixel and the
receiver. However, when using the Hadamard matrix
transmission, multiple elements may be grouped
together during the emission. The reflected amplitude
from the defect is a function of the incident energy,
which is directly correlated to the energy transmitted
inside the material by the probe. This result therefore
confirms that the Hadamard matrix transmission method
transmits more energy inside the specimen under
inspection than does FMC. When using PW, angled
A C
B
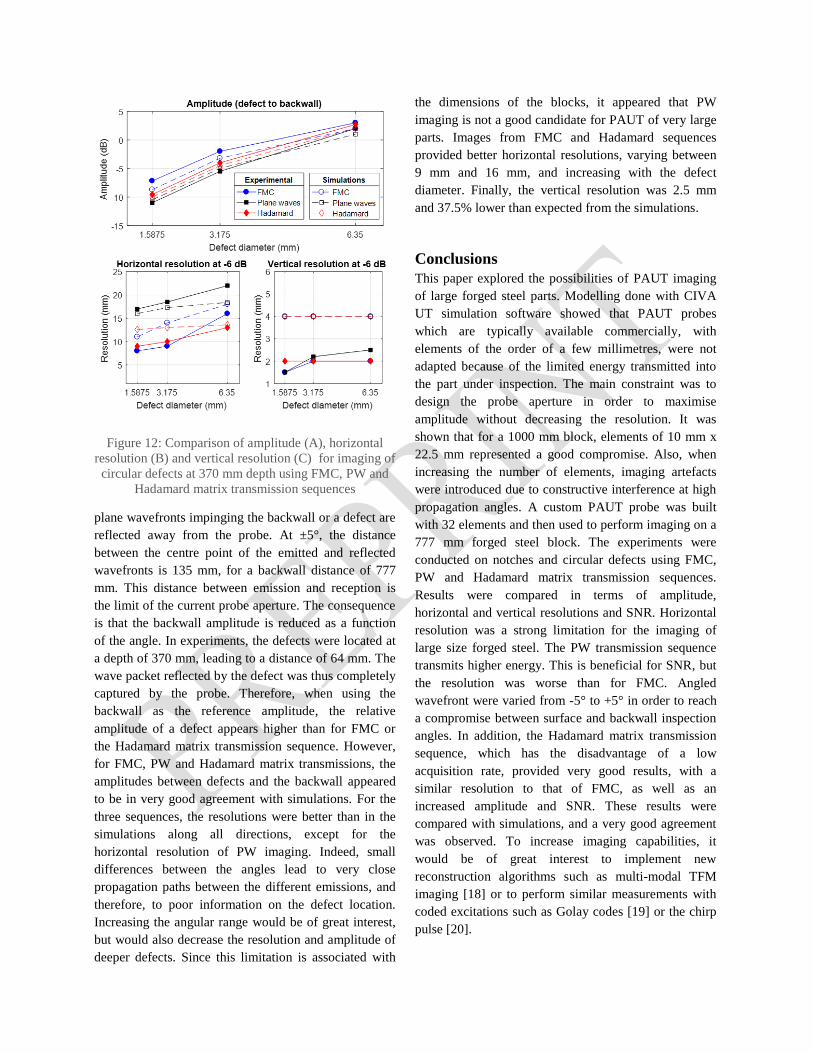
Figure 12: Comparison of amplitude (A), horizontal
resolution (B) and vertical resolution (C) for imaging of
circular defects at 370 mm depth using FMC, PW and
Hadamard matrix transmission sequences
plane wavefronts impinging the backwall or a defect are
reflected away from the probe. At ±5°, the distance
between the centre point of the emitted and reflected
wavefronts is 135 mm, for a backwall distance of 777
mm. This distance between emission and reception is
the limit of the current probe aperture. The consequence
is that the backwall amplitude is reduced as a function
of the angle. In experiments, the defects were located at
a depth of 370 mm, leading to a distance of 64 mm. The
wave packet reflected by the defect was thus completely
captured by the probe. Therefore, when using the
backwall as the reference amplitude, the relative
amplitude of a defect appears higher than for FMC or
the Hadamard matrix transmission sequence. However,
for FMC, PW and Hadamard matrix transmissions, the
amplitudes between defects and the backwall appeared
to be in very good agreement with simulations. For the
three sequences, the resolutions were better than in the
simulations along all directions, except for the
horizontal resolution of PW imaging. Indeed, small
differences between the angles lead to very close
propagation paths between the different emissions, and
therefore, to poor information on the defect location.
Increasing the angular range would be of great interest,
but would also decrease the resolution and amplitude of
deeper defects. Since this limitation is associated with
the dimensions of the blocks, it appeared that PW
imaging is not a good candidate for PAUT of very large
parts. Images from FMC and Hadamard sequences
provided better horizontal resolutions, varying between
9 mm and 16 mm, and increasing with the defect
diameter. Finally, the vertical resolution was 2.5 mm
and 37.5% lower than expected from the simulations.
Conclusions
This paper explored the possibilities of PAUT imaging
of large forged steel parts. Modelling done with CIVA
UT simulation software showed that PAUT probes
which are typically available commercially, with
elements of the order of a few millimetres, were not
adapted because of the limited energy transmitted into
the part under inspection. The main constraint was to
design the probe aperture in order to maximise
amplitude without decreasing the resolution. It was
shown that for a 1000 mm block, elements of 10 mm x
22.5 mm represented a good compromise. Also, when
increasing the number of elements, imaging artefacts
were introduced due to constructive interference at high
propagation angles. A custom PAUT probe was built
with 32 elements and then used to perform imaging on a
777 mm forged steel block. The experiments were
conducted on notches and circular defects using FMC,
PW and Hadamard matrix transmission sequences.
Results were compared in terms of amplitude,
horizontal and vertical resolutions and SNR. Horizontal
resolution was a strong limitation for the imaging of
large size forged steel. The PW transmission sequence
transmits higher energy. This is beneficial for SNR, but
the resolution was worse than for FMC. Angled
wavefront were varied from -5° to +5° in order to reach
a compromise between surface and backwall inspection
angles. In addition, the Hadamard matrix transmission
sequence, which has the disadvantage of a low
acquisition rate, provided very good results, with a
similar resolution to that of FMC, as well as an
increased amplitude and SNR. These results were
compared with simulations, and a very good agreement
was observed. To increase imaging capabilities, it
would be of great interest to implement new
reconstruction algorithms such as multi-modal TFM
imaging [18] or to perform similar measurements with
coded excitations such as Golay codes [19] or the chirp
pulse [20].
References
[1] B. W. Drinkwater and P. D. Wilcox, “Ultrasonic
arrays for non-destructive evaluation: A review,”
NDT & E International, vol. 39, no. 7, pp. 525–
541, Oct. 2006.
[2] P. Gong, P. Song, and S. Chen, “Ultrafast Synthetic
Transmit Aperture Imaging Using Hadamard-
Encoded Virtual Sources With Overlapping Sub-
Apertures,” IEEE Transactions on Medical
Imaging, vol. 36, no. 6, pp. 1372–1381, June 2017.
[3] E. Tiran et al., “Multiplane wave imaging increases
signal-to-noise ratio in ultrafast ultrasound
imaging,” Physics in Medicine and Biology, vol.
60, no. 21, pp. 8549–8566, Nov. 2015.
[4] E. L. Villaverde, S. Robert, and C. Prada,
“Ultrasonic Imaging in Highly Attenuating
Materials With Hadamard Codes and the
Decomposition of the Time Reversal Operator,”
IEEE Transactions on Ultrasonics, Ferroelectrics,
and Frequency Control, vol. 64, no. 9, pp. 1336–
1344, Sep. 2017.
[5] G. Ribay, C. Poidevin, G. Rougeron, and B. C. L.
de Roumilly, “UT Data Reconstruction in
Anisotropic and Heterogenous Welds,” presented
at the 8th International Conference on NDE in
Relation to Structural Integrity for Nuclear and
Pressurised Components Abstracts, 2010.
[6] C. Holmes, B. Drinkwater, and P. Wilcox, “The
post-processing of ultrasonic array data using the
total focusing method,” Insight-Non-Destructive
Testing and Condition Monitoring, vol. 46, no. 11,
pp. 677–680, 2004.
[7] R. Long, J. Russell, and P. Cawley, “Ultrasonic
phased array inspection using full matrix capture,”
Insight - Non-Destructive Testing and Condition
Monitoring, vol. 54, no. 7, pp. 380–385, Jul. 2012.
[8] L. Le Jeune, S. Robert, E. Lopez Villaverde, and C.
Prada, “Plane Wave Imaging for ultrasonic non-
destructive testing: Generalization to multimodal
imaging,” Ultrasonics, vol. 64, pp. 128–138, Jan.
2016.
[9] C. Holmes, B. W. Drinkwater, and P. D. Wilcox,
“Post-processing of the full matrix of ultrasonic
transmit–receive array data for non-destructive
evaluation,” NDT & E International, vol. 38, no. 8,
pp. 701–711, Dec. 2005.
[10] G. Montaldo, M. Tanter, J. Bercoff, N. Benech, and
M. Fink, “Coherent plane-wave compounding for
very high frame rate ultrasonography and transient
elastography,” IEEE Transactions on Ultrasonics,
Ferroelectrics and Frequency Control, vol. 56, no.
3, pp. 489–506, Mar. 2009.
[11] I. Trots, A. Nowicki, and M. Lewandowski,
“Synthetic transmit aperture in ultrasound
imaging,” Archives of Acoustics, vol. 34, no. 4, pp.
685–695, 2009.
[12] P. Calmon, S. Mahaut, S. Chatillon, and R. Raillon,
“CIVA: An expertise platform for simulation and
processing NDT data,” Ultrasonics, vol. 44, pp.
e975–e979, Dec. 2006.
[13] F. Dupont-Marillia, M. Jahazi, S. Lafreniere, and P.
Belanger, “Influence of local mechanical properties
of high strength steel from large size forged ingot
on ultrasonic wave velocities,” 2017, p. 090002.
[14] F. Dupont-Marillia, M. Jahazi, and P. Belanger,
“Phased array inspection of large size forged steel
parts,” AIP Conference Proceedings, vol. 1949, no.
1, p. 080004, Apr. 2018.
[15] A. Loucif, E. Ben Fredj, M. Jahazi, L.-P. Lapierre-
Boire, R. Tremblay, and R. Beauvais, “Analysis of
macrosegregation in large size forged ingot of high
strength steel,” in The 6th International Congress
on the Science and Technology of Steelmaking
(ICS2015), Beijing (China), 2015.
[16] J. D. N. Cheeke, Fundamentals and applications of
ultrasonic waves. CRC press, 2012.
[17] X. Gros, N. Cameron, and M. King, “Current
applications and future trends in phased array
technology,” Insight(UK), vol. 44, no. 11, pp. 673–
678, 2002.
[18] E. Iakovleva, S. Chatillon, P. Bredif, and S.
Mahaut, “Multi-mode TFM imaging with artifacts
filtering using CIVA UT forwards models,” 2014,
pp. 72–79.
[19] J. Isla and F. Cegla, “Coded Excitation for Pulse-
Echo Systems,” IEEE Transactions on Ultrasonics,
Ferroelectrics, and Frequency Control, vol. 64, no.
4, pp. 736–748, Apr. 2017.
[20] M. H. Pedersen, T. X. Misaridis, and J. A. Jensen,
“Clinical evaluation of chirp-coded excitation in
medical ultrasound,” Ultrasound in Medicine &
Biology, vol. 29, no. 6, pp. 895–905, Jun. 2003.
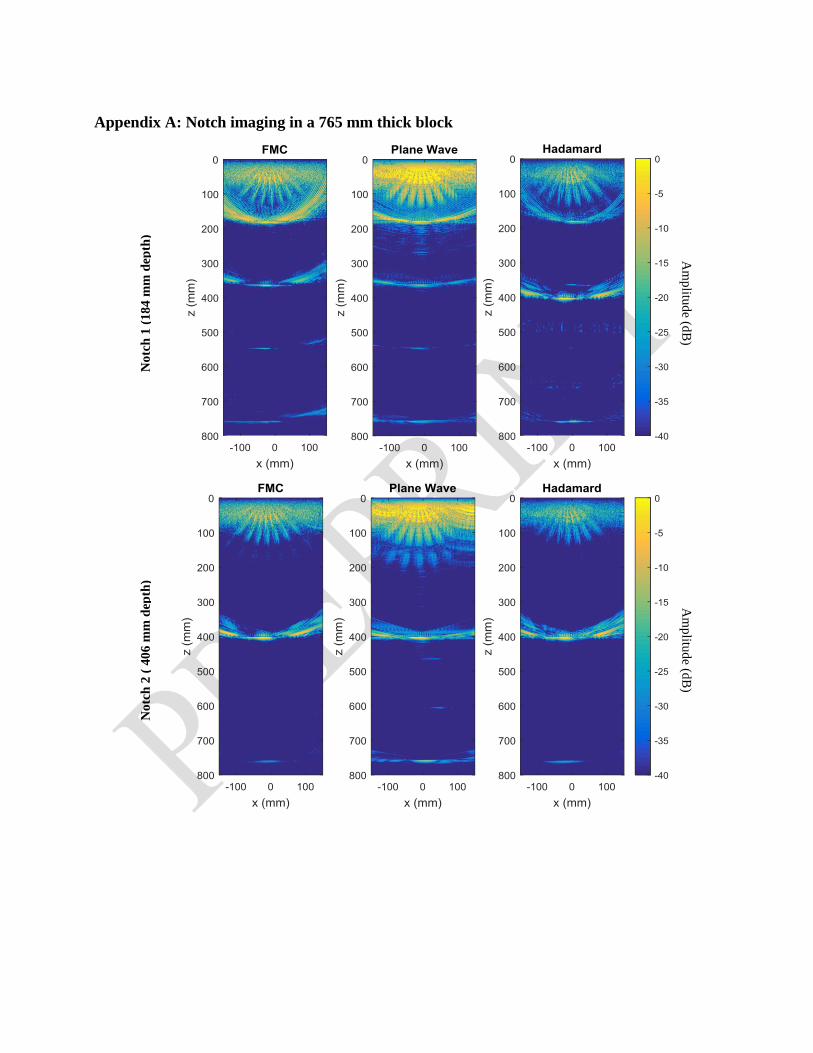
Appendix A: Notch imaging in a 765 mm thick block
No
tch
1 (
18
4 m
m d
epth
)
Am
plitu
de (d
B)
No
tch
2 (
40
6 m
m d
epth
)
Am
plitu
de (d
B)
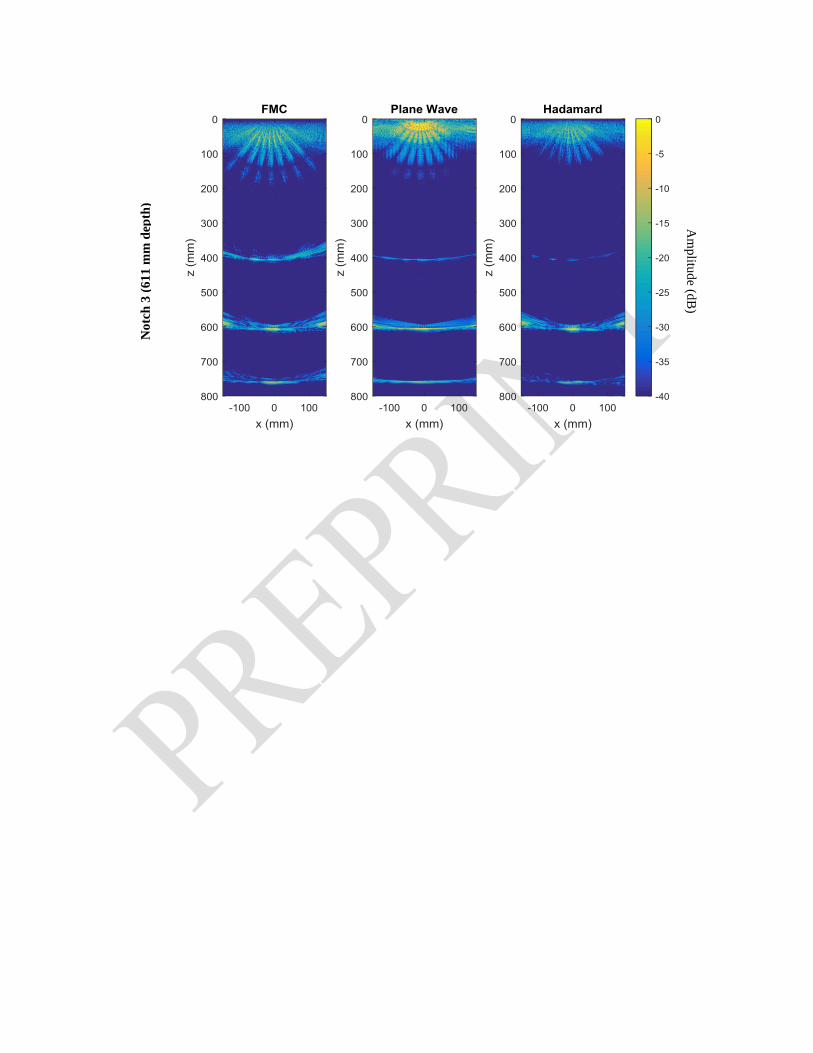
No
tch
3 (
61
1 m
m d
epth
)
Am
plitu
de (d
B)
A