Embed Size (px)
Citation preview

Purdue UniversityPurdue e-PubsInternational Refrigeration and Air ConditioningConference School of Mechanical Engineering
2016
Design and Performance of Thermal EnergyStorage Module using High Thermal ConductivityPhase Change Composite MaterialSiddique Khateeb RazackNetEnergy, United States of America, [email protected]
Yoram ShabtayNetEnergy, United States of America, [email protected]
Mukund BhaskarHeat Transfer Technologies, United States of America, [email protected]
Yoram Shabtay
Hal StilmanHeat Transfer Technologies, United States of America
See next page for additional authors
Follow this and additional works at: http://docs.lib.purdue.edu/iracc
This document has been made available through Purdue e-Pubs, a service of the Purdue University Libraries. Please contact [email protected] foradditional information.Complete proceedings may be acquired in print and on CD-ROM directly from the Ray W. Herrick Laboratories at https://engineering.purdue.edu/Herrick/Events/orderlit.html
Khateeb Razack, Siddique; Shabtay, Yoram; Bhaskar, Mukund; Shabtay, Yoram; Stilman, Hal; and Al-Hallaj, Said, "Design andPerformance of Thermal Energy Storage Module using High Thermal Conductivity Phase Change Composite Material" (2016).International Refrigeration and Air Conditioning Conference. Paper 1568.http://docs.lib.purdue.edu/iracc/1568

AuthorsSiddique Khateeb Razack, Yoram Shabtay, Mukund Bhaskar, Yoram Shabtay, Hal Stilman, and Said Al-Hallaj
This article is available at Purdue e-Pubs: http://docs.lib.purdue.edu/iracc/1568
2018, Page 1
16th International Refrigeration and Air Conditioning Conference at Purdue, July 11-14, 2016
Design and Performance of Thermal Energy Storage module using high thermal conductivity Phase Change Composite material
Siddique A. Khateeb Razack1*, Mukund Bhaskar1, Yoram Shabtay2, Hal Stilman3, Said Al-Hallaj1
1AllCell Technologies
Chicago, IL, USA Ph: 1-773-922-1155, Fax: 1-773-940-1123, [email protected]
2Heat Transfer Technologies Prospect Heights, IL, USA
Ph: 1-630-258-3143, Fax: 1-847-215-0243, [email protected]
3International Copper Association, Ltd 260 Madison Avenue, 16th Floor, NY, NY 10016
Ph: 212 251 7240, Fax: 212 251 7245, [email protected]
*Corresponding Author
ABSTRACT HVAC (Heating, Ventilation and Cooling) accounts for approximately 15-30% of a commercial building’s electricity cost and about 25% of electricity consumption. Electricity costs charged by the utilities companies for commercial building customers includes consumption charges ($/kWh) and demand charges ($/kW) depending on the time of use (TOU) charges. Thus, there is great interest to reduce the electricity consumption charges and demand charges by using new energy efficient technologies and products. One such product is a thermal energy storage (TES) system using a phase change material (PCM) to offset the cooling costs associated with air-conditioning systems by reducing the electricity consumption during peak time periods. A novel phase change composite (PCC) TES material was developed that has very high thermal conductivity and favorable operating temperature than ice with fast charge/discharge rate capability. Compared to ice, the PCC TES system is capable of very high heat transfer rate and has lower system and operational costs. Proof of concept demonstration and technical feasibility were successfully completed on a 4.5 kWh PCC TES prototype unit. Performance results show that a PCC TES system can be designed for a commercial building and maintain high efficiency at high discharge rates.
1. INTRODUCTION Latent heat storage is attractive because large amounts of energy can be stored in a relatively small volume with a small temperature change in the media. Latent heat storage is useful in many areas including solar heating systems described by El-Dessouky [1], district cooling as described by Justin Ning-Wei et al [2] and waste heat recovery by M. Chinnapandiana [3]. Out of the three phase transformation options being solid-liquid, liquid-gas, solid-gas, and solid-solid, solid-liquid is most common and cost-effective of all, and applicable to the temperature range considered herein. Other thermal storage mechanisms, like absorption and adsorption thermochemical process, are described by Atul et al [4]. This study focuses on using a solid-liquid PCM for building cooling applications by utilizing their low temperature latent heat of fusion to reduce the cooling load on an existing air-conditioning (AC) unit. In the United States, electricity consumption accounts for about 61% of the total energy consumed in the commercial building sector and cooling and refrigeration alone accounts for more than 25% of the electricity consumption [5]. Most of the electricity consumption for building cooling happens during the peak operating hours between 10 AM to 5 PM when the solar gain into the building is very high. During these peak operating times, the AC units typically run close to their full load during hot summer days when their efficiency is low and carbon emissions are very high. When this scenario is aggregated over thousands of commercial buildings, the load on the

2018, Page 2
16th International Refrigeration and Air Conditioning Conference at Purdue, July 11-14, 2016
electricity grid is so significant that utility companies charge 3-4 times higher electricity rates during peak operating times and also charge additional demand electricity charges in order to lower the demand on the grid. Currently, the utility companies have time of usage (ToU) electricity rates for electricity consumption and also demand charges for peak power consumption. The electricity rates during peak hours between 9AM to 5 PM are 3-4 times higher than off-peak times and demand charges are about $15-18/kW [6]. This will result in significant electricity costs that will encourage commercial building owners to adopt more energy efficient technologies and renewable energy sources to partially meet the electricity demands or shift the electricity consumption to off-peak duration. Thus, solar photo-voltaic (PV) energy storage systems have gained lot of attention in recent years to reduce peak electricity consumption in commercial and residential sectors. Such energy storage systems typically use battery systems like lead acid or lithium-ion battery to store the PV electrical energy and shift the building electricity load completely or partially during the peak operating hours. Recently, thermal energy storage (TES) systems are becoming very popular to meet the building cooling needs as demonstrated by Austin Energy utility company. This utility company’s central cooling system uses chilled water to meet peak cooling demands of various commercial buildings and thereby shave about 15 MW of its summer peak electrical demand [7]. IceEnergy is another commercial TES company selling 4-20 tons ice-based TES systems to shift more than 90% of peak cooling demand by running their ice TES systems during peak summer days [8]. There are some inherent disadvantages in pure ice-based TES system such as a dedicated refrigeration system to make ice which increases system weight, capital and operating costs; poor thermal conductivity of ice that requires significant amount of copper; slow charging duration (>10 hours) and slow discharging rates. Because of these reasons, the final system energy storage capacity reduces by more than 50% compared to theoretical energy storage capacity of pure ice [9]. The proposed TES system in this study employs an organic PCM compound that is integrated into graphite composite matrix. This combination brings significant advantages over current methods. PCM compounds alone have thermal conductivity of about 0.2W/m-K. The thermal conductivity of the proposed phase change composite (PCC) material is considerably higher at about 10-20 W/m.K. An additional significant advantage of this PCC is its containment: The PCM will not leak out from the graphite matrix when the PCM is in liquid phase because it is held by capillary force inside the microscopic pores of graphite matrix. This PCC does not require a container, let alone a sealed one. It is possible to choose the PCC phase-change temperature. The PCC can be impregnated with PCM ranging in temperature from -37°C to 151°C all of which are commercially available. An additional advantage of the graphite PCC is the large surface area in contact with the heat exchanger. The PCC can be machined to mate with tubes and flat surfaces as desired, providing very high contact surface area. The proposed TES system can be integrated with existing AC refrigeration without the need for an additional compressor and relative components. The existing cycle is used to charge the TES system during off-peak times when cooling load is lower rather than a dedicated refrigeration system necessary for ice based TES system. The proposed PCC TES system is intended to be used to cool commercial buildings in addition to existing air-conditioning (AC) units. Figure 1 shows the schematic of the TES system integrated with an AC unit to cool a building. The proposed technology relies on existing Compressor and refrigerant system to charge the system during off-peak times, resulting in lower equipment cost as shown in Figure 1. During the night, the AC unit charges the PCC TES system when electricity prices are very low and the cold energy is stored in the PCC material. During the peak hours of the day, the TES system will run in parallel with the AC unit and cools the warm air when the cooling demand exceeds a peak threshold. In this manner, the AC unit can be downsized, compressor efficiency can be improved and peak consumption charges and demand charges can be significantly reduced.

2018, Page 3
16th International Refrigeration and Air Conditioning Conference at Purdue, July 11-14, 2016
Figure 1 Overview of Proposed System Operation for Peak Shaving or Peak Load Shifting
2. EXPERIMENTAL WORK The proposed thermal energy storage (TES) system consists of a composite material capable of absorbing and releasing thermal energy at very high rates because of its high thermal conductivity. The phase change composite (PCC) material in the TES system has anisotropic graphite structure that results in anisotropic thermal and mechanical properties. It has very high thermal conductivity perpendicular to graphite compaction at about 20-24 W/m-K and it is 8-10 W/m-K parallel to graphite compaction. The rate of thermal energy transfer is greatly improved in the proposed system thus eliminating large temperature gradients, non-uniform melting and solidification that are typical problems with pure PCM materials. Finally, the amount of heat exchanger coil is reduced thereby reducing the cost and weight of overall system. In the following sub-sections, details about the composite material properties, fabrication, system design specifications, assembly process and test methodology is discussed. 2.1 Phase Change Composite Material Fabrication The various steps involved in manufacturing PCC slabs for this experimental work are described as follows. The PCC material uses commercially available Expanded Graphite to make a supporting porous matrix to hold the organic phase change material. The structure of Expanded Graphite is shown in Figure 2 (a), (b). Expanded Graphite material was compacted to achieve a bulk density of about 180 kg/m3. The compressed Expanded Graphite was then submerged in a bath of molten PCM with a melting range of 5-6°C, thus it is liquid at room temperature. The soaking step lasted for about 18-24 hours and typical PCM weight fraction was 74-78% in the final composite material. A typical SEM image of the graphite matrix filled with PCM is shown Figure 2(c) where the graphite has a more ordered structure after compaction and all the void spaces in the graphite structure are filled with PCM.
Figure 2 Scanning Electron Microscopy (SEM) images of expanded graphite showing vermicular form at (a) 71X and (b) 500X magnification; (c) SEM images of graphite matrix after PCM soaking [10]
(c) (a) (b)

2018, Page 4
16th International Refrigeration and Air Conditioning Conference at Purdue, July 11-14, 2016
Table 1 shows the various properties of the PCC material. The latent heat and phase change temperature were measured using a differential scanning calorimetry instrument (Mettler-Toledo Model No-DSC823e/700) and thermal conductivity was measured using a laser flash instrument (TA Instruments DXF-200). Because of the anisotropic nature of the graphite structure, thermal conductivity is approximately two times higher in perpendicular direction compared to parallel direction of compaction. Thus, the Phase Change Composite (PCC) material has a very thermal conductivity graphite matrix that rapidly transfers the thermal energy to and from the phase change material. The PCM is contained within the microscopic pores of the graphite matrix and the melting and solidification happens very uniformly across the graphite matrix. Another important feature of this composite material is that the PCM does not leak out from the graphite matrix instantaneously because it is held inside the microscopic pores by capillary forces. Table 1 Properties of Phase Change Composite (PCC) Material
Properties Specifications PCM Phase Change Temperature -oC 5-6 Pure PCM Latent Heat - kJ/kg (Wh/kg) 260 (72) Composite Latent Heat - kJ/kg (Wh/kg) 190-205 (53-57) Composite Density (kg/m3) 825-900 Weight % PCM 74-78 % Weight% Graphite 22-26% Thermal Conductivity (perpendicular to compaction) – W/m.K 18-22 Thermal Conductivity (parallel to compaction) – W/m.K 8-12 2.2 Thermal Energy Storage (TES) system Design Specifications In order to demonstrate the technical feasibility of the proposed TES system using the PCC material, a 4.5 kWh prototype system was designed and assembled. The TES system consists of two major components – PCC material and heat exchanger copper tubes. Preliminary proof-of-concept testing was performed on a very small module with a storage capacity of 0.15 kWh consisting two PCC slabs sandwiched with a one copper serpentine tube. The experimental testing results and finite element modeling results guided the design process to develop the design specifications for this 4.5 kWh TES system. Table 2 shows the specifications of the 4.5 kWh TES system and Table 3 show the specifications of copper serpentine heat exchanger coils used in the TES system for transferring the thermal energy between the PCC material and heat exchanger fluid. Table 2 Design Specifications of the 4.5 kWh TES Sub-Scale System
Design Parameters Specifications Weight % PCC 74% Weight% Copper 11.5% Length (m) 0.46
Width (m) 0.26 Thickness 1 slab (m) 0.0254
Total Number of Slabs 28 Total Mass of PCC Slabs (kg) 78 Nominal PCC Density (kg/m3) 850 Total Length (m) 0.51 Total Width (m) 0.31 Total Height (m) 0.81 Energy Stored (kWh) (latent heat) 4.0 Energy Stored (kWh) (sensible heat) 0.5

2018, Page 2
16th International Refrigeration and Air Conditioning Conference at Purdue, July 11-14, 2016
Total Energy Stored (kWh) 4.5 Specific Energy (Wh/kg) – PCC Only 56 Specific Energy (Wh/kg) – PCC + Copper 54 Projected System Specific Energy (Wh/kg) 40 Energy Density (Wh/Lit) – PCC Only 52 Energy Density (Wh/Lit) – PCC + Copper 52 Projected System Energy Density (Wh/Lit) 37 Table 3 Design Specifications of Copper Serpentine Tubes used in the TES system
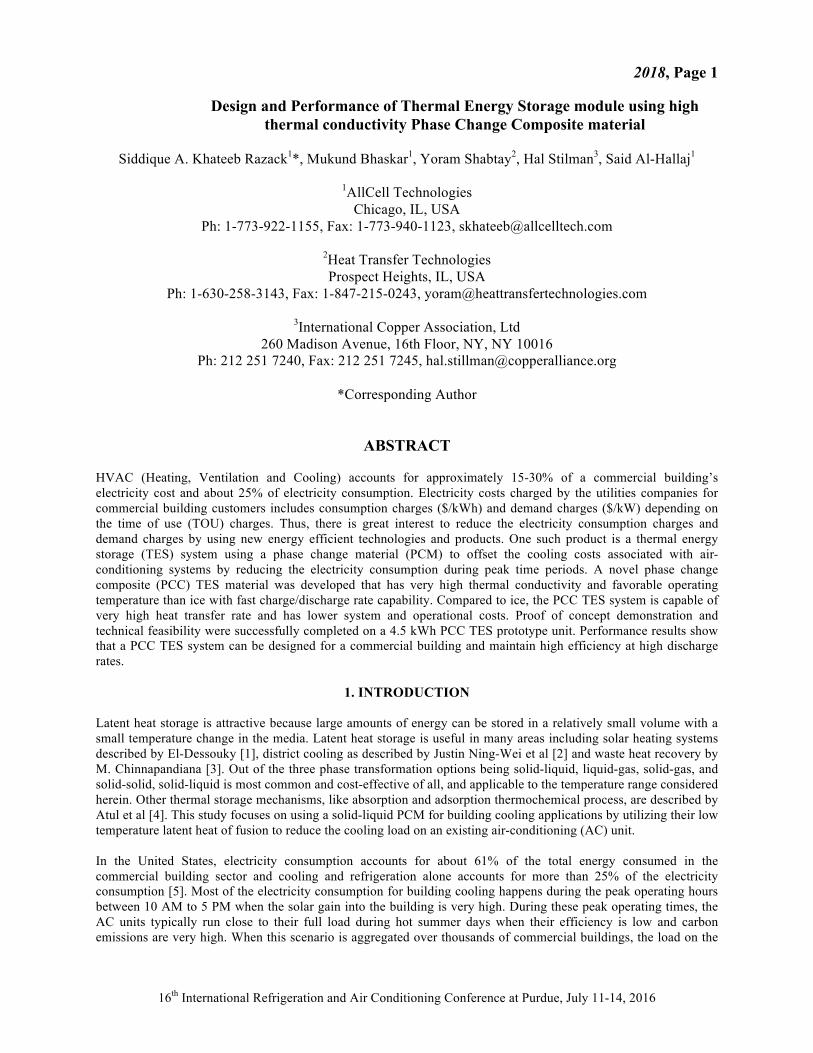
Design Parameters Specifications Mass of 1 serpentine (kg) 0.42 Mass of Serpentine (kg) 11.12 Pitch (m) 0.0486 Tube Length (m) 0.212 Outer Diameter (m) 0.009525 Inner Diameter (m) 0.008128 Copper Volume (m3) 0.001177 Density (kg/m3) 9033 No of serpentines 27 Mass of Copper/Mass PCC 15.8% 2.3 TES System Assembly The TES prototype system has a total energy storage capacity of 4.5 kWh (89% latent heat, 11% sensible heat) and consists of 28 PCC slabs and 27 copper serpentine tubes. The slabs were then machined with grooves using the CNC machine to accommodate the serpentine copper tubes. The schematic of the system assembly is shown in Figure 3. The TES system assembly mainly consists of PCC slabs and copper tubes stacked on top of each other ending with a 1-inch building insulation material on top and bottom of the PCC slabs. Figure 4 shows few steps during the assembling process of the 4.5 kWh TES system. The first PCC slab is laid on top of 1-inch insulation layer at the bottom. The first copper serpentine tube is placed on top the first PCC slab by fitting inside the grooves machined using a CNC machine. The spacing between the grooves is 2 inches and another PCC slab with grooves is placed on top of the first copper serpentine such that the copper serpentine is sandwiched in between the PCC slabs. In this manner, the PCC slab and copper serpentine are alternately stacked on top of each other. The full PCC-copper stack assembly is shown in Figure 5. In order to minimize pressure drop, a three-pass circuit design was adopted for connecting all the copper heat exchanger tubes via copper bends as shown in Figure 5(A). The three-pass inlet and exit manifolds are located at the top and bottom of the TES stack assembly respectively. The fully assembled TES stack with insulation materials is shown in Figure 5(B). Outside insulation is 1-inch in thickness with R-5 insulation rating and the gaps were filled with glass wool insulation. During the assembly process, various K-Type thermocouples were inserted at various locations along the TES stack height. The schematic of the thermocouple locations is shown in Figure 5(C). The entire TES stack assembly was secured to a 0.25-inch stainless-steel metal plate on top-most and bottom-most of assembly via long threaded rods. In order to reduce air-gaps in between the PCC slabs, compression springs were used in order to apply a small amount of compression load. The springs were mounted on the top metal plate. It is important to ensure that the total compression does not exceed the yield stress of the PCC material in its liquid state to prevent permanent deformation and damage. The maximum load/spring was rated at 7.3 pound-force and the total compression load on the bottom most PCC slab was calculated to be about 1.26 psi (8.7 k Pa). The applied spring load on the PCC slab does not exceed the yield stress of the material when the PCM undergoes phase change from solid to liquid phase. The yield stress of a similar PCC material was measured to be about 100-500 kPa and hence the applied compression load is safe during operation and will not cause a structural failure of the TES system.

2018, Page 2
16th International Refrigeration and Air Conditioning Conference at Purdue, July 11-14, 2016
Figure 3 Schematic of the 4.5 kWh TES System Assembly
Figure 4 TES System Assembly
2018, Page 3
16th International Refrigeration and Air Conditioning Conference at Purdue, July 11-14, 2016
Figure 5 Full stack assembly of the 4.5 kWh TES system
2.4 TES System Testing The 4.5 kWh TES system was tested in laboratory using a Julabo® Chiller (Model # F25-ME). The experimental set-up is shown in Figure 6. This chiller has in-built heater option that allows to provide the cooling load to discharge the TES system. The chiller has a reservoir capacity of about 1 gallon for heat transfer fluid and it has a cooling capacity of 0.25 to 0.4 kW, thus limiting the fast discharge rates of the TES system. A digital flow meter Digiflow 6710 (Savant Electronics Inc., Taiwan) was employed to monitor the flow velocity and record the total volumetric flow occurring, with an accuracy of ±10%. Additional in-line flow meter (McMaster Carr, Part # 8051K42) was also used to compare with the digital flow meter and an average flow-rate was used for all calculation purposes. The cold TES prototype unit was insulated using 1-inch thick building insulation material (FOAMULAR 150 manufactured by Owens Corning combined with fiber wool). The PVC tubing was insulated using general-purpose tube insulation. A data logger, SMARTDAC GP/20 manufactured by Yokogowa Electric (Sugar Land, TX), was used to record temperatures using T-type thermocouples located at specified locations as shown in Figure 5. The heat exchanger fluid used was 50:50 mix of water/ethylene glycol (EG) anti-freeze mixture that is typically used for automotive applications. During TES charging mode, the chiller cools the glycol mix to -5oC (arbitrarily chosen) and circulates into the TES system. The cold EG fluid absorbs the heat from the PCC slabs and the warm glycol flows back into the chiller reservoir where the heat is rejected to the cold refrigerant coil. The cold glycol fluid circulates from the reservoir into the TES system and the cooling cycle continues until the PCC slabs in the TES system turns into solid phase below 5oC. During the TES discharge mode, the glycol is pre-heated to 15oC via the inbuilt heater in the chiller and the warm glycol is circulated into the TES system via the copper serpentine tubes. The glycol inlet temperature was chosen based on typical evaporator coil temperature at air inlet conditions of 27oC (80oF) dry-bulb, 19.4oC (67oF) wet-bulb. The warm glycol rejects the heat into the cold PCC slabs and exits the TES system as a cold fluid. The heater coil in the chiller should be able to heat the glycol to a steady inlet temperature of 15oC before flowing back into the TES system. The chiller has a maximum heating capacity of 1 kW and during discharge, the heating power required to raise the exit temperature of glycol from 0°C to 15°C is 2 kW. Thus, it was difficult to maintain a steady temperature of 15°C at glycol inlet line. In order to overcome this limitation, an external heater rated at 1 kW was built with a temperature controller and inserted into the chiller bath which heats the glycol bath simultaneously to
Exit Manifold
(A) (B) (C)
Inlet Manifold

2018, Page 4
16th International Refrigeration and Air Conditioning Conference at Purdue, July 11-14, 2016
maintain the glycol inlet temperature at 15°C. The results shown here are those with an external heater operating during the discharge cycle. Many trials were run at each flow rate to verify the performance and the results from one trial at each flow-rate are shown and discussed in this section.
Figure 6 Experimental Set-up of the 4.5 kWh TES Benchtop System for testing
During TES charging mode, the chiller cools the glycol mix to -5oC (arbitrarily chosen) and circulates into the TES system. The cold EG fluid absorbs the heat from the PCC slabs and the warm glycol flows back into the chiller reservoir where the heat is rejected to the cold refrigerant coil. The cold glycol fluid circulates from the reservoir into the TES system and the cooling cycle continues until the PCC slabs in the TES system turns into solid phase below 5oC. During the TES discharge mode, the glycol is pre-heated to 15oC via the inbuilt heater in the chiller and the warm glycol is circulated into the TES system via the copper serpentine tubes. The glycol inlet temperature was chosen based on typical evaporator coil temperature at air inlet conditions of 80oF dry-bulb, 67oF wet-bulb. The warm glycol rejects the heat into the cold PCC slabs and exits the TES system as a cold fluid. The heater coil in the chiller should be able to heat the glycol to a steady inlet temperature of 15oC before flowing back into the TES system. The chiller has a maximum heating capacity of 1 kW and during discharge, the heating power required to raise the exit temperature of glycol from 0°C to 15°C is 2 kW. Thus, it was difficult to maintain a steady temperature of 15°C at glycol inlet line. In order to overcome this limitation, an external heater rated at 1 kW was built with a temperature controller and inserted into the chiller bath which heats the glycol bath simultaneously to maintain the glycol inlet temperature at 15°C. The results shown here are those with an external heater operating during the discharge cycle. Many trials were run at each flow rate to verify the performance and the results from one trial at each flow-rate are shown and discussed in this section. There are 25 K-Type thermocouples (T/C) instrumented in the PCC TES system as shown in Figure 5(C). The T/Cs were inserted about 1 inch deep into the PCC slab by drilling a small hole through the PCC, only few thermocouple location results are reported and discussed in the results section. Thermocouples were also inserted into the inlet and exit manifolds to monitor the glycol inlet and exit temperature. The glycol inlet and exit temperature is a mix average temperature of the top and bottom three PCC slabs respectively.
4.5 kWh PCC TES Benchtop System
Julabo® Chiller
Flow-meter (0.2-2 GPM)
Digital Flow-meter (0.2-2 GPM)
Digital Datalogger

2018, Page 5
16th International Refrigeration and Air Conditioning Conference at Purdue, July 11-14, 2016
3. RESULTS AND DISCUSSION Figure 7 shows the temperature profiles of the glycol coolant (inlet and exit) and PCC at various locations at a glycol flow-rate ranging from 2.5 to 3 L/min. During charging, the initial temperature of the TES system is around 10-15oC and very cold glycol (-5oC) is circulated into the TES system. Initially, the glycol flow-rate is higher because viscosity is lower and as the system temperature drops lower, the glycol flow-rate gradually reduces due to increasing viscosity. The total charge duration is approximately 13 hours to completely solidify the PCM in the PCC composite. The chiller has a cooling capacity of 0.25-0.4 kW, which would suggest the TES cool-down cycle to last approximately 12-14 hours. Initial results with a smaller module consisting of 2 slabs demonstrated that the PCC slabs can be charged completely in less than 2 hours because of less thermal mass owing to high thermal conductivity of PCC slabs. Thus, it is expected that with optimal chiller sizing, the charge duration of actual TES system will less than 6 hours.
Figure 7 Temperature Profiles of 4.5 kWh TES Prototype System @ Glycol Flow-Rate of 2.5-3 L/min
Figure 8 shows the temperature profiles of the 4.5 kWh PCC TES prototype system at a glycol flow-rate of 1.6 L/min. The initial rest period lasts for 45 min during which there is no flow into the system and the warm glycol @ 15°C starts flowing into the PCC TES system after the rest period. The glycol inlet temperature (red curve) is about 15°C and it is lower initially because of heater power limitations from the chiller heater. The glycol exit temperature (blue curve) and PCC temperature at various locations start at -4oC at the beginning of discharge cycle. It can be seen that the PCC slabs at the top most locations near glycol inlet discharge faster because of incoming glycol at 15°C. As the glycol flows down the copper tubes, it gains the cold thermal energy from PCC slabs. The driving force for thermal energy transfer between glycol and PCC slabs reduces from top to bottom, thus the PCC slabs at bottom location discharge at slower rate compared to top locations. Initially, the temperature difference between the glycol exit and PCC slab at bottom most location is < 1oC but gradually the difference increases after 3.5 hours

2018, Page 6
16th International Refrigeration and Air Conditioning Conference at Purdue, July 11-14, 2016
although the PCC slabs at bottom locations are still very cold. The thermal efficiency of the TES system was calculated to be > 89% according to equation (1). Infrared (IR) thermal imaging camera (Flir Model C2) was used to look at the thermal profile of the PCC slabs during the discharge mode of the TES system. As expected, the PCC slabs at the top most location discharge faster i.e. lose their cold thermal energy at faster rate than the PCC slabs at the bottom locations as shown in Figure 9. Another important feature of a TES system is the rate of thermal energy released from the TES system relative to the stored capacity. Higher this ratio, faster is the system response to meet the cooling demand especially in demand response programs. Figure 10 shows the discharge cooling power as a function of depth of discharge of PCC TES unit. The useful cooling power delivered by the TES system was calculated according to equation (2). The depth of discharge of the TES system is calculated as the ratio of stored energy depleted to the total stored energy available before discharge. The useful cooling power achieved from the PCC TES unit is greater than 85% combining the sensible and latent heat of PCM material. The latent heat contribution of PCM is about 80% of the total cooling power achieved. Thus, increasing the latent heat of the PCM material will significantly reduce the total thermal mass required in the PCC TES unit. Thermal Energy Efficiency of the PCC TES system was calculated to be 89+/-2% using the formula as follows – Qreleased = mo!"(!t+1 − !t) !"
!0 (kJ) (1)
Qstored = PCC Sensible Heat + PCC Latent Heat (2) where PCC Sensible Heat = mPCC*CP,PCC*(ΔTs + ΔTl) (kJ) (3)
PCC Latent Heat = mPCC*λ (kJ) (4) Thermal Efficiency = Qreleased / Qstored (5) Cooling Power = !!"(!t+1 − !t) (kW) (6) where Qreleased = Thermal energy absorbed by Glycol from PCC - kJ Qstored = Total thermal energy stored in PCC slabs – kJ Tt+1 = Temperature of Exit Glycol at time step t+1 Tt = Temperature of Exit Glycol at time step t t = Duration of TES discharge – second mo = Mass flow-rate of Glycol – kg/s m = Total Mass of PCC slabs - kg Cp,PCM = Specific heat capacity for PCC slabs - kJ/kg. K (2.0 kJ/kg. K) ∆Ts = Temperature difference when PCM is in solid state ∆Ts = Temperature difference when PCM is in liquid state λ = Latent heat capacity of PCC material (kJ/kg), which is 180 kJ/kg.

2018, Page 7
16th International Refrigeration and Air Conditioning Conference at Purdue, July 11-14, 2016
Figure 8 Temperature Profiles of 4.5 kWh TES Prototype System @ Glycol flow rate of 1.6 L/min
Figure 9 Infra-red Thermal Images of the PCC TES system during discharge

2018, Page 8
16th International Refrigeration and Air Conditioning Conference at Purdue, July 11-14, 2016
Figure 10 Cooling Power Characteristics of 4.5 kWh Prototype System @ Glycol flow rate of 1.6 L/min
The results presented here clearly demonstrated that a very efficient thermal energy storage system can be designed for cooling applications. The advantage of using a very high thermally conductive phase change composite (PCC) material can be seen in the results presented where high cooling rates can be achieved which is traditionally not possible with ice-based systems. With ice-based TES systems and other PCM based systems, it is necessary to have very high heat transfer area and significant amount of heat exchanger coils to efficiently exchange thermal energy, lower temperature gradients and non-uniform phase transition. Although, the PCM used in this study has 21% lower latent heat compared to ice (260 J/g vs. 330 J/g), the overall system energy storage capacity will be very similar because of excessive copper heat exchanger coils required in ice-based TES system. The weight fraction of copper heat exchanger coils used in the PCC TES system was < 15% whereas in typically ice-based TES system or pure PCM system, copper weight fraction exceeds 40%. One of the commercially available ice-based TES system has a much lower system storage capacity compared to theoretical storage capacity of ice due to significant amount of copper and other system components [9]. Thus, although the PCM material used in the current TES system has 21% lower latent heat, the system level storage capacity could be similar because less amount of copper is used. Table shows a comparison between Ice and PCC TES systems. It can be seen that the PCC TES system may have lower specific energy storage capacity compared to Ice but in terms of the high rate capability and power output it will be much superior compared to Ice based TES systems. Table 4 – Comparison between Ice and Organic PCM used in current TES system
Characteristics Ice Pure PCM PCC Composite Material Operating Temperature - oC (oF) 0 5-7oC
(41-45oF) 5-7oC
(41-45oF) Weight % of Copper 40-60%d 40-60%d 10-15%c Thermal Conductivity - W/m.K) 2.2 0.2 10-25e Charge/Discharge Duration - hrs 10-12b 9-12 2-4 Theoretical Energy Storage 92 (330) 72 (260) 56 (202)

2018, Page 9
16th International Refrigeration and Air Conditioning Conference at Purdue, July 11-14, 2016
Capacity - Wh/kg (kJ/kg) Energy Storage Capacity including Copper - Wh/kg
45-60a 45-50a 45-55
System Energy Storage Capacity - Wh/kg
42b 35-40c 38-48c
System Energy Storage Capacity - Wh/Lit
22b 30-35c 33-37c
a-estimated based on Copper Wt% b-IceBear30 Product Specification (http://ice-energy.com/wp-content/uploads/2013/12/ice_bear_product_sheet.pdf) c-Estimated based on Initial Prototype BOM (bill of materials); d-assumed based on IceBear30 specification sheet
4. CONCLUSIONS This study successfully demonstrated a 4.5 kWh thermal energy storage (TES) prototype system for cooling applications using a laboratory chiller. The phase change composite (PCC) material used in the TES prototype system is capable of discharging at faster rates because of its very high thermal conductivity compared to traditional phase change material technologies. Thermal efficiency greater than 89% was demonstrated and with optimization of the design, efficiency can be improved further. The PCC TES system also demonstrated high power/energy ratio during discharge because of high thermal conductivity of the PCC material. High output power per stored energy is very important for peak shaving purposes and reducing demand charges on electricity consumption. The PCC TES system described in this paper can also be easily integrated into an existing vapor-compression rooftop unit because it has higher operating temperature and can be easily charged by the existing AC unit. The performance results reported in this study demonstrates that the PCC TES system is technically feasible to uniquely compete with ice-based TES system because of its high charge/discharge rate capability and ease of integration with existing AC systems. The integration of the PCC TES system with a commercial AC unit is part of future work to further mature this technology with field demonstration.
NOMENCLATURE TES Thermal Energy Storage PCM Phase Change Material PCC Phase Change Composite kWh kilo-watt hour Qreleased Thermal energy absorbed by Glycol from PCC - kJ Qstored Total thermal energy stored in PCC slabs – kJ t Duration of TES discharge – second mo Mass flow-rate of Glycol – kg/s m Total Mass of PCC slabs - kg Cp,PCM Specific heat capacity for PCC slabs - kJ/kg. K ∆Ts Temperature difference when PCM is in solid state ∆Ts Temperature difference when PCM is in liquid state λ Latent heat capacity of PCC material (kJ/kg),
REFERENCES [1] El-Dessouky, H. and Al-Juwayhel, F., (1997), Effectiveness of a thermal energy storage system using phase-change materials, Energy Conversion and Management, 38, 601-617 [2] Justin Ning-Wei Chiu, Dr. Viktoria Martin, and Prof. Fredrik Setterwall System integration of latent heat thermal energy storage for comfort cooling integrated in district cooling network, KTH – Department of Energy Technology, Brinellvägen 68, SE-100 44 Stockholm, Sweden

2018, Page 10
16th International Refrigeration and Air Conditioning Conference at Purdue, July 11-14, 2016
[3] M. Chinnapandiana, V. Pandiyarajan, and R. Velraj, (2011) Experimental Investigation of A Latent Heat Storage System For Diesel Engine Waste Heat Recovery With and Without Cascaded Arrangement, International Conference on Mechanical, Automobile and Robotics Engineering [4] Atul Sharma, V.V. Tyagi, C.R. Chen, D. Buddhi (2007) Review on thermal energy storage with phase change materials and applications, Department of Mechanical Engineering, Kun Shan University, 949. [5] United States Department of Energy Information Administration (EIA), (2016, May 01) - Retrieved from https://www.eia.gov/energyexplained/index.cfm?page=us_energy_commercial [6] Southern California Edison Commercial Time of Usage Electricity Rates - https://www.sce.com/NR/rdonlyres/6B523AB1-244D-4A8F-A8FE-19C5E0EFD095/0/090202-Business-Rates-Summary.pdf [7] Lazar, J. (2016). Teaching the “Duck” to Fly, Second Edition. Montpelier, VT: The Regulatory Assistance Project. Available at: http://www.raponline.org/document/download/id/7956 [8] IceEnergy Ice Bear product (2016, May 01) – Retrieved from http://www.ice-energy.com/grid/#whitepapers [9] IceEnergy Ice Bear 30 product specification sheet (2016, May 01) – Retrieved from - http://ice-energy.com/wp-content/uploads/2013/12/ice_bear_product_sheet.pdf) [10] A. Mills, M. Farid, J.R. Selman, S. Al-Hallaj, Thermal conductivity enhancement of phase change materials using a graphite matrix, Appl. Therm. Eng. 26 (2006) 1652–1661. doi:10.1016/j.applthermaleng.2005.11.022.
ACKNOWLEDGEMENT The authors thank International Copper Association for funding this project.