Embed Size (px)
Citation preview
College of Engineering
Department of Mechanical Engineering
Fall 2016-17
Senior Design Project Report
Design & Construction of a Pilot-Scale Cooling Tower
In partial fulfillment of the requirements for the Degree of Bachelor of Science in Mechanical
Engineering
S T U D E N T N A M E
Team Members:
1- Ali Abdullah Ben Obaid 201100293 2- Salem H Al Salem 201100294 3- Hussain A Al Mubarak 200901660 4- Mohammed A Al Nemer 201100192
Supervised by: Dr. Esam Jassim
2
All team members have contributed in various ways towards the successful completion of
this report. First and foremost, we would like to thank Allah who makes everything possible
for us. Sincere gratitude goes to our families for the support they gave us during the entire
period of our studies. Many thanks also go to the Mechanical Engineering Faculty for
providing guidance and support and inspiring us during doing the entire project. We greatly
appreciate the effort that they put to help us complete this report under their outstanding
supervision. Special thanks to Dr. Esam Jassim who closely supervised us in this project and
also many thanks to our instructor during the semester Dr. Nader Sawalhi.
Acknowledgement

3
Abstract
Cooling tower is a heat exchanger in which air and water are brought into direct or indirect contact in
order to reduce the water’s temperature. In this project a design of a pilot system that incorporates
both a heat exchanger component and a cooling tower is constructed. A mathematical model for a
counter-flow wet cooling tower is derived, which is based on one-dimensional heat and mass balance
equations using the measured heat transfer coefficient. The balanced equations are solved to predict
the temperature change of air and water, as well as the humidity. Experimental measurements on the
pilot-scale cooling tower will be carried out in order to analyze the performance and study the
comparison with the analytical model.
The experiment was conducted based on three cases. Case (1); conduct the experiment with
both forced and induced fan in service. The results revealed a 4 to 5 degrees water
temperature difference. Case (2), uses one fan only for forced draft fan. 3.5 to 4 degrees water
temperature difference is achieved. In third case, Using only induced fan to move the air
across the tower. 1.9 degrees difference is achieved. Incorporating both forced and induced
draft fans have positive impact on cooling tower performance. They contributed in increasing
the efficiency of the cooling tower by enabling more volume of air to pass through the tower
and hence more heat will be dissipated. The zigzag water flow pattern has made the water
movement to slow down and longer time of water exposure to air is achieved. Stainless steel
fills have higher conductivity and this helped us in achieving as excellent results. Further
discussion of the results is in section 4.3 of this paper.
4
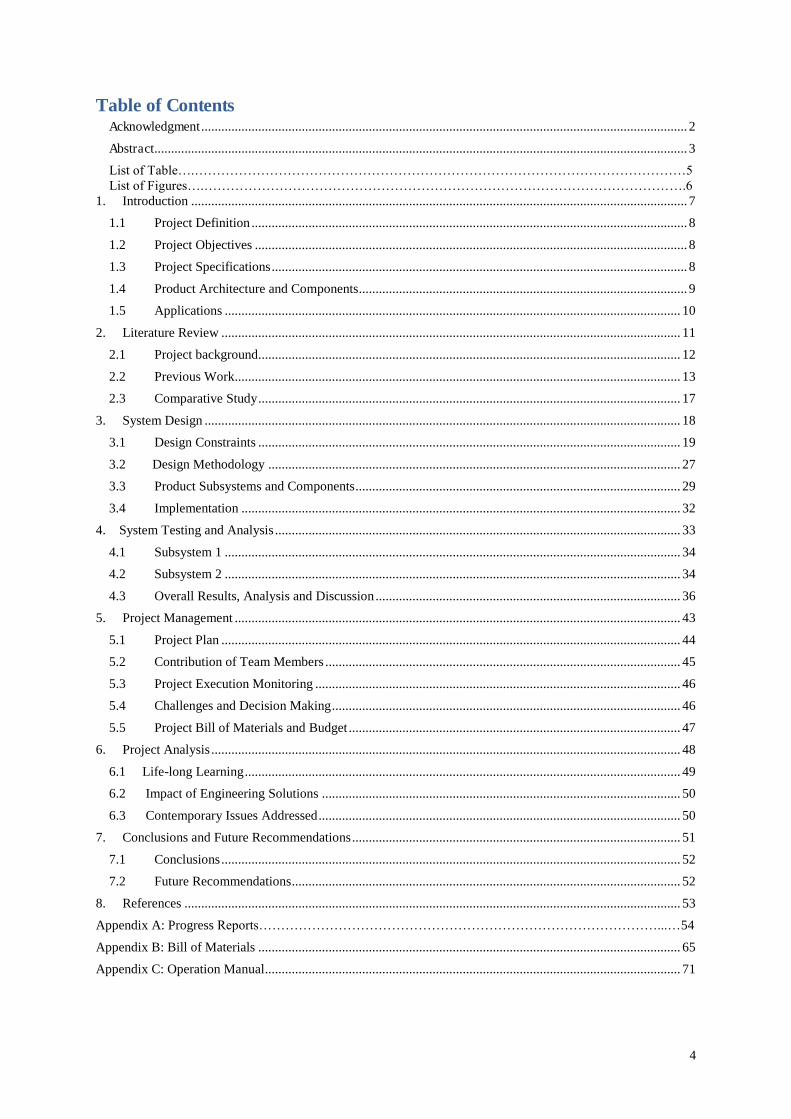
Table of Contents Acknowledgment ................................................................................................................................................. 2
Abstract ............................................................................................................................................................... 3
List of Table….…………………………………………………………………………………………………5 List of Figures….……………………………………………………………………………………………….6 1. Introduction .................................................................................................................................................... 7
1.1 Project Definition .................................................................................................................................. 8
1.2 Project Objectives ................................................................................................................................. 8
1.3 Project Specifications ............................................................................................................................ 8
1.4 Product Architecture and Components.................................................................................................. 9
1.5 Applications ........................................................................................................................................ 10
2. Literature Review ......................................................................................................................................... 11
2.1 Project background.............................................................................................................................. 12
2.2 Previous Work ..................................................................................................................................... 13
2.3 Comparative Study .............................................................................................................................. 17
3. System Design .............................................................................................................................................. 18
3.1 Design Constraints .............................................................................................................................. 19
3.2 Design Methodology ........................................................................................................................... 27
3.3 Product Subsystems and Components ................................................................................................. 29
3.4 Implementation ................................................................................................................................... 32
4. System Testing and Analysis ......................................................................................................................... 33
4.1 Subsystem 1 ........................................................................................................................................ 34
4.2 Subsystem 2 ........................................................................................................................................ 34
4.3 Overall Results, Analysis and Discussion ........................................................................................... 36
5. Project Management ..................................................................................................................................... 43
5.1 Project Plan ......................................................................................................................................... 44
5.2 Contribution of Team Members .......................................................................................................... 45
5.3 Project Execution Monitoring ............................................................................................................. 46
5.4 Challenges and Decision Making ........................................................................................................ 46
5.5 Project Bill of Materials and Budget ................................................................................................... 47
6. Project Analysis ............................................................................................................................................ 48
6.1 Life-long Learning .................................................................................................................................. 49
6.2 Impact of Engineering Solutions ........................................................................................................... 50
6.3 Contemporary Issues Addressed ............................................................................................................ 50
7. Conclusions and Future Recommendations .................................................................................................. 51
7.1 Conclusions ......................................................................................................................................... 52
7.2 Future Recommendations .................................................................................................................... 52
8. References .................................................................................................................................................... 53
Appendix A: Progress Reports………………………………………………………………………………...…54
Appendix B: Bill of Materials .............................................................................................................................. 65
Appendix C: Operation Manual ............................................................................................................................ 71
5
List of tables
Table 2.1 comparison of the four cooling towers ................................................................................. 14
Table 2.2 NTUUncorr. Equations for thermoplastic counter current wavy packing ............................ 16
Table 3.1 cooling tower capacity with different ambient temperature ................................................. 20
Table 3.2 Properties of galvanized steel ............................................................................................... 23
Table 3.3 Saudi Aramco Standard#27-SAMSS-003 Material Specification Standards ....................... 24
Table 3.4 Pugh chart for material selection .......................................................................................... 28
Table 4.1 Case (1) temperature readings .............................................................................................. 38
Table 4.2 Case(2) temperature readings .............................................................................................. 38
Table 4.3 Case(3) temperature readings ............................................................................................... 39
Table 5.1 Project's Time frame ............................................................................................................. 44
Table 5.2 Task distribution ................................................................................................................... 45

6
List of figures Figure 1.1 Counter-flow cooling tower ................................................................................................... 9
Figure 1.2 A/C cooling tower ............................................................................................................... 10
Figure 1.3 Electric power plant cooling tower ...................................................................................... 10
Figure 2.1 Scale deposits in the fill ....................................................................................................... 12
Figure 2.2 Range and approach schematic ............................................................................................ 13
Figure 2.3 Representative schematic of energy contribution ................................................................ 15
Figure 2.4 Forced draft cooling tower experiment setup (Kuljeet Singh) ............................................ 16
Figure 2.5 Ceramic tile packing ............................................................................................................ 17
Figure3.1 cooling tower size tool .......................................................................................................... 20
Figure3.2 TTXL Assembled modular tower ......................................................................................... 21
Figure3.3 Exploded view of the cooling tower assembly ............................................................................ 22
Figure 3.4 Axial flow fan ...................................................................................................................... 24
Figure 3.5 Fan outline drawing ............................................................................................................. 25
Figure 3.6 Submersible pump ............................................................................................................... 26
Figure 3.7 Layout of the assembled design ........................................................................................... 26
Figure 3.8 Structural System ................................................................................................................. 28
Figure 3.9 Sprinkler in operation .......................................................................................................... 28
Figure 3.10 Water spry sprinkler .......................................................................................................... 28
Figure 3.11 Water temperature sensor .................................................................................................. 29
Figure 3.12 Air temperture sensor ........................................................................................................ 30
Figure 3.13 Bill of materials of the tower ............................................................................................. 31
Figure 4.1 Experimental setup .............................................................................................................. 34
Figure 4.2 Isometric view of real tower ................................................................................................ 34
Figure 4.3 Range & Approach of a cooling tower ................................................................................ 35
Figure 4.4 Cooling tower formulas.................................................................................................... 35
Figure 4.5 Cooling tower air & water flow ........................................................................................... 35
Figure 4.6 Diagram of range and approach ........................................................................................... 36
Figure 4.7 Range and approach schematic ............................................................................................ 36
Figure 4.8 Comparison of Range of the three cases ........................................................................ 39
Figure 4.9 Comparison of efficiecy of the three cases .......................................................................... 39
Figure 4.10 Comparison of Approach of the three cases ...................................................................... 40
Figure 4.11 Summary of achieved results of the three cases ....................................................................... 41
Figure 5.1 Gantt chart ........................................................................................................................... 44
7
Introduction
1.1 Project Definition
1.2 Project Objectives
1.3 Project Specifications
1.4 Product Architecture and Components
1.5 Applications
8
1.1 Project Definition The project is mainly about designing of a pilot-scale cooling tower that uses different fill
material and arrangement than the traditional ones. It is a proof of heat exchanger device
where air and water are brought together in direct contact. The increase of surface area of the
falling water will encounter the air coming in cross or counter-flow causing it to evaporate.
As a result, the vapor will lower the temperature of the water. It is an effective method with
relatively reasonable costs. The air entering the tower is either by a mechanical or natural
draft. Different types of cooling towers are widely used in industries. The mass volume of
water and the “free” ambient temperature make the amount of heat transfer to be high and
hence satisfy the desire. The scarcity of water is the challenge when utilizing this type of heat
exchanger in areas where water is scarce like the Eastern Province of Saudi Arabia.
1.2 Project Objectives The objectives of this project are to:
1. Study the heat transfer effectiveness in cooling towers.
2. Increase the rate of heat transfer by changing the exchanger fills material and
arrangements.
3. Minimize the water usage by having an insulated cooling tower frame.
4. Take advantage of combining both induced and forced draft fans in a cooling tower.
5. Show how a cooling tower can be realistically modeled.
6. Compare experimental and analytical data of the energy performance.
1.3 Project Specifications These are the project's specifications:
a) Environmental friendly and cost effective.
b) Easy to implement with no complications.
c) A pilot-scale with light weight frame materials.
d) A 220V power source for the fans and the water pump.
e) Distilled water is used as the substance to be cooled and air as the cooling medium.
f) Galvanized with carbon steel frame structure.
9
1.4 Product Architecture and Components Basic components that constitute a cooling tower are: the frame, drift eliminator, casing,
exchange fill, cold water basin (sink), air inlet, fans and nozzles (spray distribution). (Krishna
S. Vishwakarma, 2015)
Exchanger fill: this can be in both splash or film layer. Its function is to slow the motion of
falling water and increase the contact area between water and air by spreading the water. It is
made of stainless steel for better conductivity and corrosion resistance.
Cold water basin: It is the bottom sink of the cooling tower where it receives the cooled
water. The accumulation of falling water is kept in the bottom basin then it is pumped to its
application.
Drift eliminator: this eliminates the water droplets from going out the tower through the
induced upper fan.
Air inlet: the air enters the tower from the air inlet fan (forced draft fan). This will allow the
air to contact the water in counter-flow pattern.
Nozzles: nozzles are used in the cooling tower to spray the water and to wet the exchange
fills.
Fans: These are used to forcedly draft the inlet air and to induce the exit air, too.
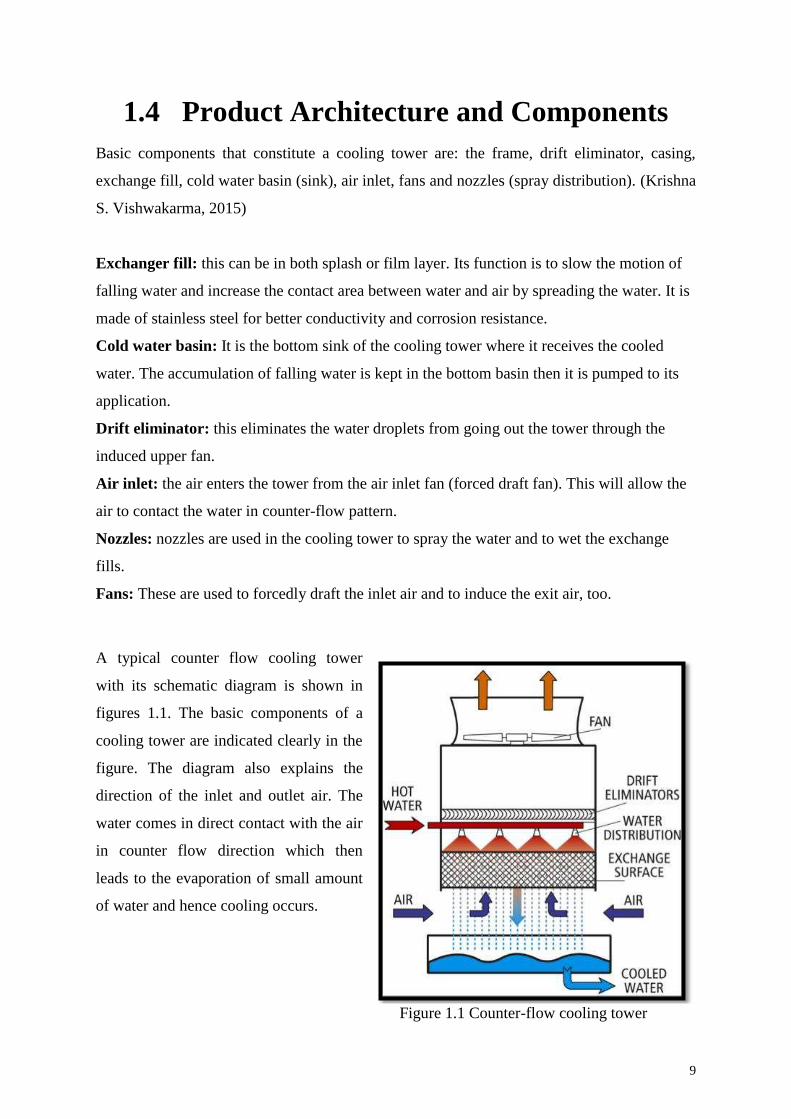
A typical counter flow cooling tower
with its schematic diagram is shown in
figures 1.1. The basic components of a
cooling tower are indicated clearly in the
figure. The diagram also explains the
direction of the inlet and outlet air. The
water comes in direct contact with the air
in counter flow direction which then
leads to the evaporation of small amount
of water and hence cooling occurs.
Figure 1.1 Counter-flow cooling tower
10
Figure 1.2 A/C cooling tower
Figure 1.3 Electric power plant cooling tower
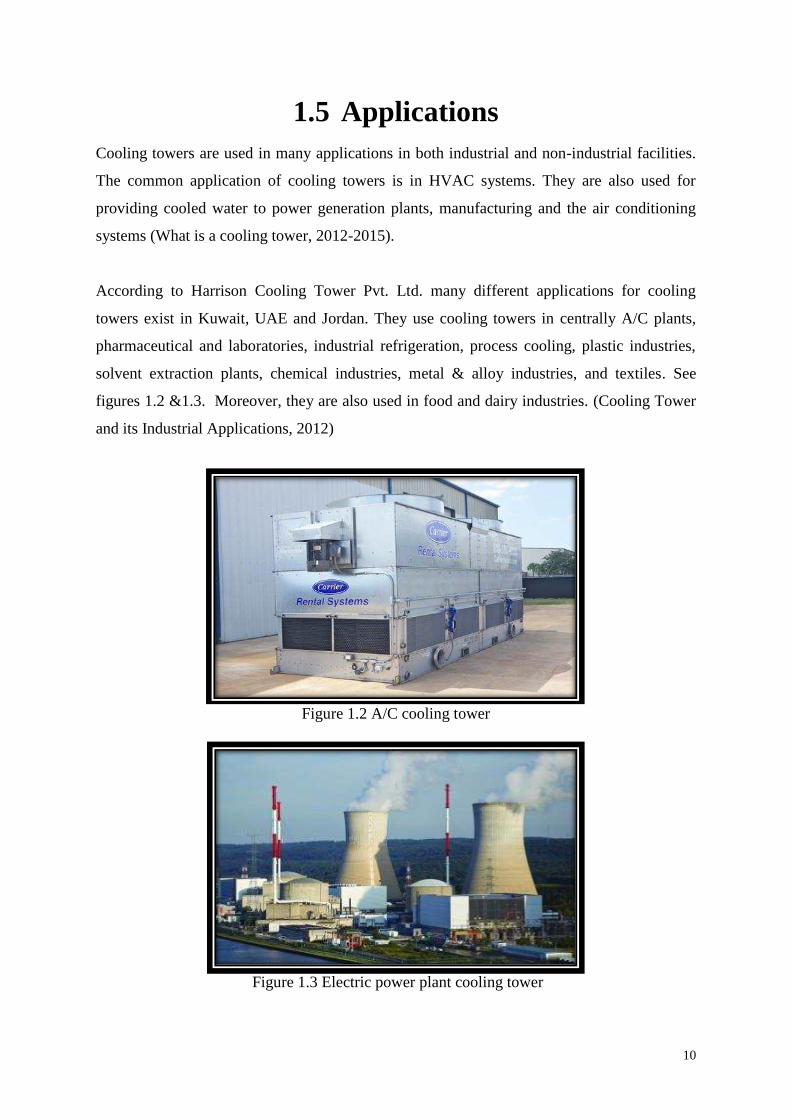
1.5 Applications Cooling towers are used in many applications in both industrial and non-industrial facilities.
The common application of cooling towers is in HVAC systems. They are also used for
providing cooled water to power generation plants, manufacturing and the air conditioning
systems (What is a cooling tower, 2012-2015).
According to Harrison Cooling Tower Pvt. Ltd. many different applications for cooling
towers exist in Kuwait, UAE and Jordan. They use cooling towers in centrally A/C plants,
pharmaceutical and laboratories, industrial refrigeration, process cooling, plastic industries,
solvent extraction plants, chemical industries, metal & alloy industries, and textiles. See
figures 1.2 &1.3. Moreover, they are also used in food and dairy industries. (Cooling Tower
and its Industrial Applications, 2012)
11
Literature Review
2.1 Project Background
2.2 Previous Work
2.3 Comparative Study

12
2.1 Project background Cooling towers are heat rejection devices where air and water are brought together in direct
contact. This results in evaporation of small portion of water which will cause the water
temperature to drop. The warm air is discharged from the tower to the atmosphere. The
principle of evaporative cooling is inferred from that in human body's perspiration (sweat).
As the body produces sweat it absorbs the heat to cool off your body (What is evaporative
cooling, 2010).
Cooling towers have been employed since a long period of time in both industrial and non-
industrial facilities. Starting in 1800, they were used in developing countries and then their
usage was widely spread to be worldwide, (The Secret History of Cooling Towers, 2016).
Cooling towers are characterized by the pattern of air flow and movement. Some uses a fan to
force the air in or induce the air out of the tower. These are called "mechanical draft towers".
The other types get advantage of the natural draft of air in and out of the tower. Two common
types of flow are counter and cross flow towers. In counter flow cooling towers air travels
vertically from bottom to top, opposite to the falling water. Whereas in a cross flow tower, air
moves horizontally crossing the water that comes from the fills (What is a cooling tower,
2012-2015)
With the limited resources, users of cooling towers are experiencing
vulnerable challenges. Scale deposits in the fills (Figure 2.1) and the air
flow that enters the cooling tower are some of the challenges that most
industrial and non-industrial facilities encounter (G.Srinivasan, 2016).
These challenges have been studied in the last decade. Different types of
fill materials have been used to overcome the scale deposits phenomenon
which significantly impacts the efficiency of heat transfer in cooling
towers, (Buecker, 2015). Scale deposit can not only be a defect source in
cooling towers, but it can also cause harm to the environment through the
need of using excessive amount of make- up and blow down water.
According to Shivaraman, most of fill materials in cooling towers are made of plastics and
wooden films. This is because they provide greater heat transfer efficiency due to the lack of
debris that may be built on the fill surfaces which can block the water passageway
(Shivaraman, 2004).
Figure.2.1 Scale deposits in the fill (Buecker, 2015)
13
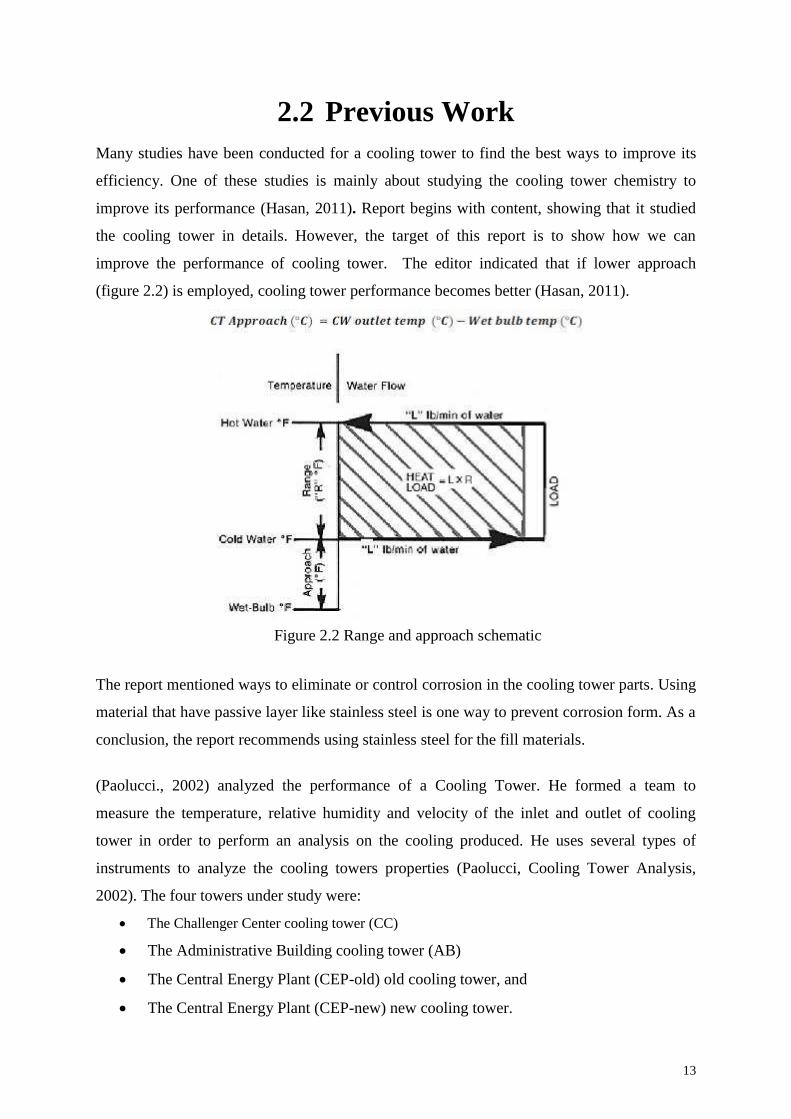
2.2 Previous Work Many studies have been conducted for a cooling tower to find the best ways to improve its
efficiency. One of these studies is mainly about studying the cooling tower chemistry to
improve its performance (Hasan, 2011). Report begins with content, showing that it studied
the cooling tower in details. However, the target of this report is to show how we can
improve the performance of cooling tower. The editor indicated that if lower approach
(figure 2.2) is employed, cooling tower performance becomes better (Hasan, 2011).
Figure 2.2 Range and approach schematic
The report mentioned ways to eliminate or control corrosion in the cooling tower parts. Using
material that have passive layer like stainless steel is one way to prevent corrosion form. As a
conclusion, the report recommends using stainless steel for the fill materials.
(Paolucci., 2002) analyzed the performance of a Cooling Tower. He formed a team to
measure the temperature, relative humidity and velocity of the inlet and outlet of cooling
tower in order to perform an analysis on the cooling produced. He uses several types of
instruments to analyze the cooling towers properties (Paolucci, Cooling Tower Analysis,
2002). The four towers under study were:
The Challenger Center cooling tower (CC)
The Administrative Building cooling tower (AB)
The Central Energy Plant (CEP-old) old cooling tower, and
The Central Energy Plant (CEP-new) new cooling tower.

14
Both the AB and CEP are wet cooling towers while the CC is a dry cooling tower. The data
that was recorded can be seen in Table 1 below.
Table 2.1 comparison of the four cooling tower (Paolucci., 2002)
The conclusion that came out from this experiment is that dry cooling tower is not as efficient
as the wet one. It also concluded that when the volumetric flow rate increases, the cooling
capacity increases too. (Paolucci, Cooling Tower Analysis, 2002)
A recent study also showed that when airflow passes a wetted surface, there is a transfer of
sensible and latent heat. If there is a difference in the partial pressure of water vapor in the air
and that of the water, there will be a mass transfer. This transfer of mass causes a thermal
energy transfer. This is because if some water is evaporated from the water layer, the latent
heat of this vaporized water will be supplied to the air. The concept of enthalpy potential is a
very useful one in quantifying the transfer of heat (sensible and latent) in those processes and
components where there is a direct contact between the air and water. Heat transfer rate in the
cooling tower is represented by the difference between the enthalpy of moist air at bulk water
temperature and the enthalpy of the moist air. (Ramkumar Ramkrishnan, Experimental study
of cooling tower performance using ceramic, 2013)
A study of water evaporation process was conducted by (Papaefthimiou VD, 2006). They
work on developing a model to describe thermodynamically the water evaporation process
inside a counter flow evaporative cooling tower. Schematic representation of energy
contribution of cooling tower and air steam is shown in figure 2.3. The air from ambient is in
direct contact with the falling water, they did their analysis based on the energy and mass
balance between air and hot water. The water temperature, humidity ratio, and rate of change
of air temperature along the cooling tower height were described. As per their results, the
degree of saturation of inlet air affected the thermal performance of the cooling tower. They
mentioned that the cooling capacity of the cooling tower increases with decreasing inlet air

15
Figure 2.3 Representative schematic of energy contribution
wet bulb temperature and the overall temperature of water fall is positively correlation with
the increasing water to air mass ratio.
Also, another study for the thermal effectiveness of the cooling tower was conducted by
(Lemouari M, 2010). They studied the performance of a counter flow evaporative cooling
tower by the heat rejected from the tower. They studied the effect of the flow rates of (air and
water) .Also, the evaluate the inlet water temperatures on the thermal effectiveness of the
cooling tower as well as the heat rejected by the tower from hot water to be cooled to the air
discharged into the ambient. According to their results, the water to air mass flow rate ratio,
as well as the inlet water temperature is very important to determine the performance of
evaporative cooling towers.
Moreover, another study conducted by (Muangnoi T, 2007) who studied exergy. Exergy is
the energy that is available to be used. After the system and surroundings reaches
equilibrium. The exergy analysis used to investigate the performance of counter flow
evaporative cooling tower. They write a mathematical equation related to heat and mass
transfer principle. They proof the equation by experimental data analysis. According to the
result, they showed that the lowest exergy destruction is located at the top of the tower.
16
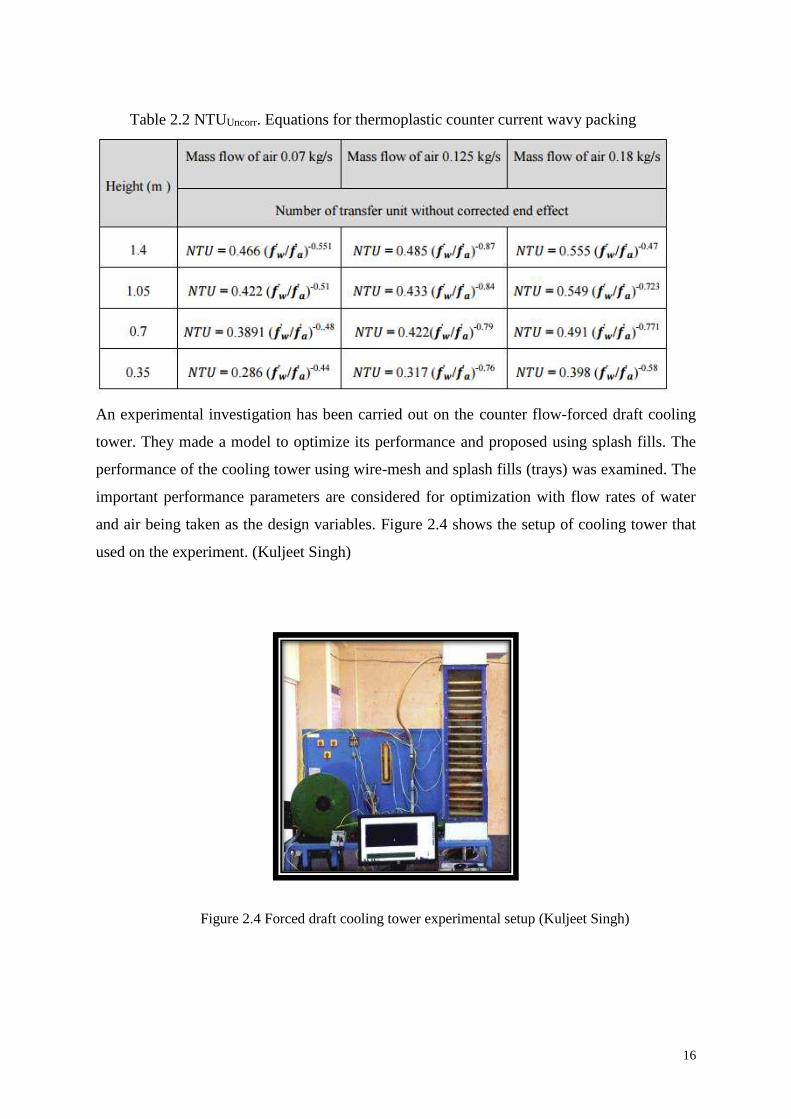
Table 2.2 NTUUncorr. Equations for thermoplastic counter current wavy packing
Figure 2.4 Forced draft cooling tower experimental setup (Kuljeet Singh)
An experimental investigation has been carried out on the counter flow-forced draft cooling
tower. They made a model to optimize its performance and proposed using splash fills. The
performance of the cooling tower using wire-mesh and splash fills (trays) was examined. The
important performance parameters are considered for optimization with flow rates of water
and air being taken as the design variables. Figure 2.4 shows the setup of cooling tower that
used on the experiment. (Kuljeet Singh)
17
This study reveals the different optimal operating points for various types of fills and out of
these. As a result, the wire mesh type of fill has been found to be the most effectiveness fills
operating under the study conditions. The conclusion that came out from this study that the
proposed methodology is generalized and can be easily implemented to optimize the
performance of any forced draft cooling tower with much larger temperature ranges. (Kuljeet
Singh)
2.3 Comparative Study
A recent study conducted by (Bhupesh Kumar Yadav, 2015) was performed to compare
analytical and experimental data of a cooling tower performance. The study revealed that the
effectiveness (which is the ratio of range and the ideal range) of a designed model cooling
tower is 52.94% (Bhupesh Kumar Yadav, 2015). Barile et al. studied the performance of a
turbulent bed cooling tower. They found a correlation between water and air mass flow ratios.
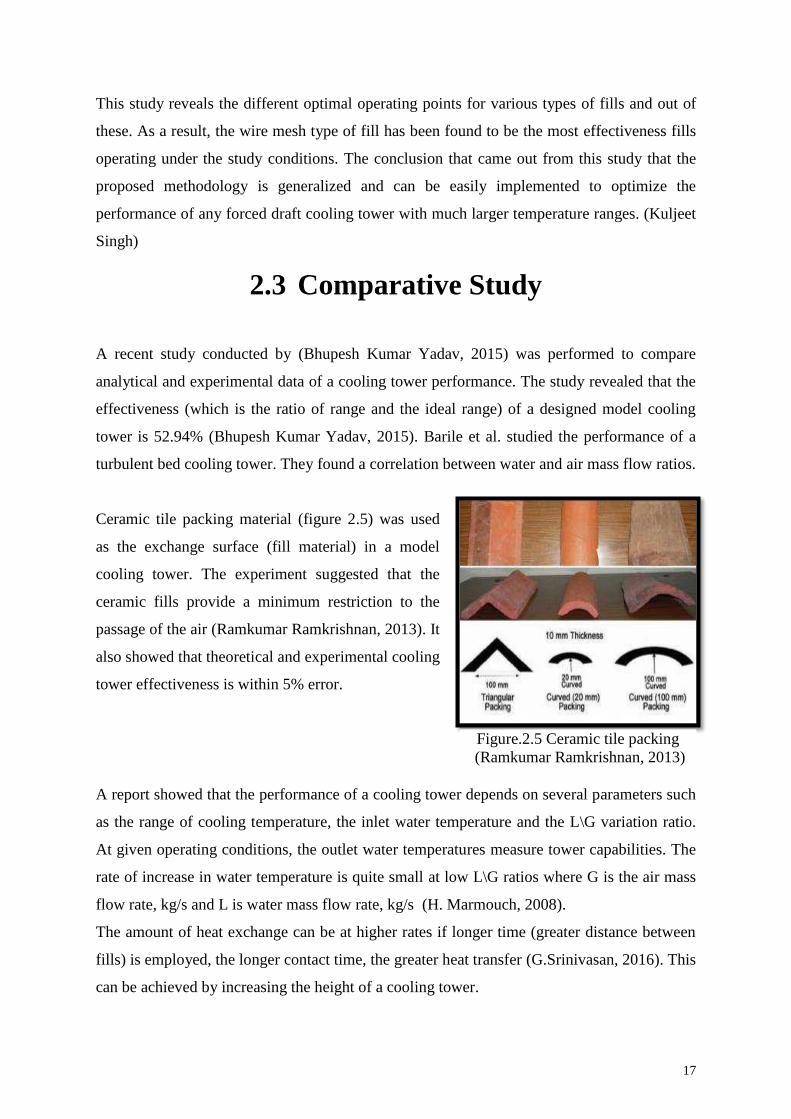
Ceramic tile packing material (figure 2.5) was used
as the exchange surface (fill material) in a model
cooling tower. The experiment suggested that the
ceramic fills provide a minimum restriction to the
passage of the air (Ramkumar Ramkrishnan, 2013). It
also showed that theoretical and experimental cooling
tower effectiveness is within 5% error.
A report showed that the performance of a cooling tower depends on several parameters such
as the range of cooling temperature, the inlet water temperature and the L\G variation ratio.
At given operating conditions, the outlet water temperatures measure tower capabilities. The
rate of increase in water temperature is quite small at low L\G ratios where G is the air mass
flow rate, kg/s and L is water mass flow rate, kg/s (H. Marmouch, 2008).
The amount of heat exchange can be at higher rates if longer time (greater distance between
fills) is employed, the longer contact time, the greater heat transfer (G.Srinivasan, 2016). This
can be achieved by increasing the height of a cooling tower.
Figure.2.5 Ceramic tile packing (Ramkumar Ramkrishnan, 2013)

18
System Design
3.1 Design Constraints
3.2 Design Methodology
3.3 Product Subsystems and Components
3.4 Implementation
19
3.1 Design Constraints A Cooling tower is a heat transfer (exchanger) device that is used to discharge waste heat to
the atmosphere. Designing & sizing such device are needed to determine the best type that
fits the application requirements. To do so, some engineering standards and guidelines were
used and reviewed to complete this project.
Several important factors need to be taken into consideration when designing a cooling tower.
Our design factors are:
The dry-bulb and wet-bulb temperatures of the air
The temperature of warm water
The efficiency of contact between air and water in terms of the volumetric mass
transfer coefficient and the contact time between the air and the water
The uniformity of distribution of the phases within the tower
The air pressure drop
The desired temperature of the cooled water
These factors are inferred from KLM Technology Group Engineering Design Guidelines.
By maintaining cooling towers with the engineering designed specifications, efficiency
increases and life span increases too. This will positively impact the environment by saving
energy resources. A 1C cooling water temperature increase may increase the A/C compressor
electricity consumption by 2.7% and 1C drop in cooling water temperature can give a heat
rate saving of 5 kCal/kWh in a thermal power plant, (KLM Technology Group).
Cooling tower sizing and selection should be carefully considered to meet the application
requirements and operate with the designed range and efficiency. Different companies have
been consulted for the optimum size that will achieve cooling of a minim 4 degrees Celsius.
This was the target of this project. Table 3.1 is an example of readily designed towers with
different operating requirements.
20
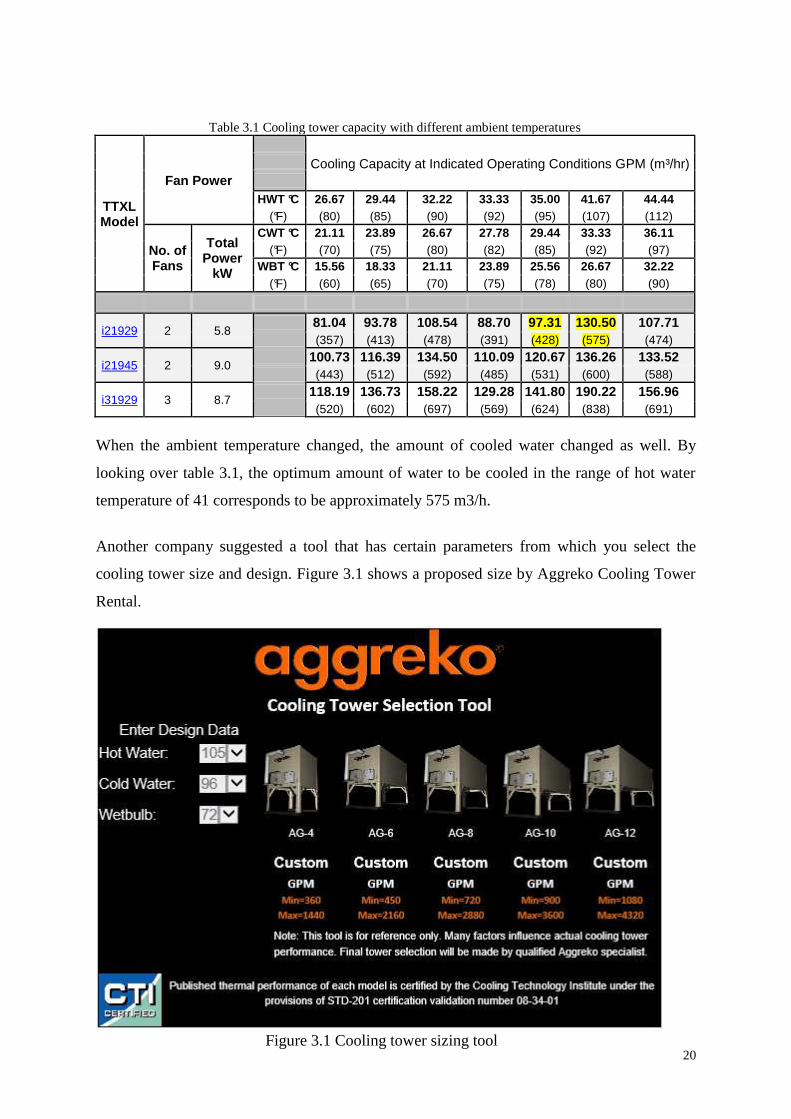
Table 3.1 Cooling tower capacity with different ambient temperatures
TTXL Model
Fan Power
Cooling Capacity at Indicated Operating Conditions GPM (m³/hr)
HWT °C 26.67 29.44 32.22 33.33 35.00 41.67 44.44 (°F) (80) (85) (90) (92) (95) (107) (112)
No. of Fans
Total Power
kW
CWT °C 21.11 23.89 26.67 27.78 29.44 33.33 36.11 (°F) (70) (75) (80) (82) (85) (92) (97)
WBT °C 15.56 18.33 21.11 23.89 25.56 26.67 32.22 (°F) (60) (65) (70) (75) (78) (80) (90)
i21929 2 5.8 81.04 93.78 108.54 88.70 97.31 130.50 107.71 (357) (413) (478) (391) (428) (575) (474)
i21945 2 9.0 100.73 116.39 134.50 110.09 120.67 136.26 133.52 (443) (512) (592) (485) (531) (600) (588)
i31929 3 8.7 118.19 136.73 158.22 129.28 141.80 190.22 156.96 (520) (602) (697) (569) (624) (838) (691)
When the ambient temperature changed, the amount of cooled water changed as well. By
looking over table 3.1, the optimum amount of water to be cooled in the range of hot water
temperature of 41 corresponds to be approximately 575 m3/h.
Another company suggested a tool that has certain parameters from which you select the
cooling tower size and design. Figure 3.1 shows a proposed size by Aggreko Cooling Tower
Rental.
Figure 3.1 Cooling tower sizing tool

21
Figure 3.2 TTXL Assembled modular tower
TTXL Factory has the below cooling tower specifications that corresponds to a temperature
of 40° C for the warm water and wet bulb of 22° C. Figure 3.2 shows a suggested size with
the following specifications:
Specifications
Metric English
Nom. Dimensions (shell WxL) 213.4 cm x 411.5 cm 7'-00 x 13'-06"
No. Fans/Motors 2 2
Motors (total) 5.8 kW 8.0 hp
Inlet Dia. One VanStone 6" One VanStone 6"
Nominal Flow
(35°C HWT/29.4°C CWT/25.6°C WBT)
(95°F HWT/85°F CWT/78°F WBT)
118.0 m³/h 518 gpm
Minimum Flow 45.4 m³/h 200 gpm
Maximum Flow 136.0 m³/h 600 gpm
Shipping Weight 2,379 Kg 5,245 lb.
Operating Weight 4,360 Kg 9,609 lb.
Basin Capacity 2,025.2 L 535 gallons
Based on the above recommendations and after long discussion with many seniors, it was
decided that the cooling tower be made with range of 4° to 5° C and the water flow rate as of
the selected pump. The height is to be 1.3 m and the width to be 0.60 m with depth of 0.4 m
to fit the requirement of reaching the temperature difference of 4 to 5 degree in range.

22
Corrosion environment is presented in cooling towers so frame should possess the proprieties
that resist corrosion and temperature during process. The galvanized steel is better corrosion
resistant than the uncoated steel as per the American Galvanizers Association. Also,
Galvanized steel has lower cost when compare with other corrosion resistance metal like
stainless steel. It is available in local market in different sizes and thicknesses. Also, it is easy
to form it to the desired shape. In addition to that, the suitable type of electrode for
galvanized steel is available in the local market for activities of assembly.
Figure 3.3 Exploded view of the cooling tower assembly
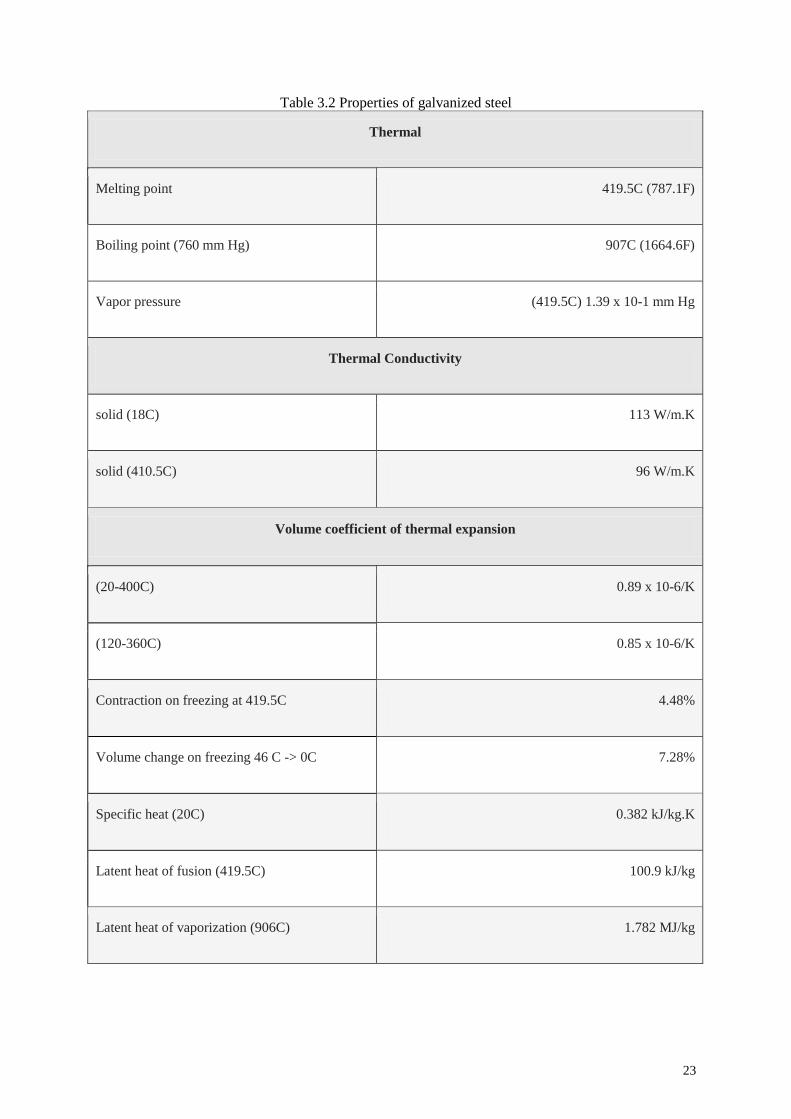
Frame structure is made of galvanized steel (also called hot-dip zinc coated steel). It is an
alloy of iron-zinc coated steel sheet. As per the American Galvanizers Association, the
galvanized steel is 100 times better corrosion resistant than the uncoated steel. It is also 100%
recyclable with conductivity of 113 W/m.K in solid state, (HDG Environmental Advantages,
2016). Engineering properties of galvanized steel are summarized in table 3.1.
23
Table 3.2 Properties of galvanized steel
Thermal
Melting point 419.5C (787.1F)
Boiling point (760 mm Hg) 907C (1664.6F)
Vapor pressure (419.5C) 1.39 x 10⁻¹ mm Hg
Thermal Conductivity
solid (18C) 113 W/m.K
solid (410.5C) 96 W/m.K
Volume coefficient of thermal expansion
(20-400C) 0.89 x 10⁻⁶/K
(120-360C) 0.85 x 10⁻⁶/K
Contraction on freezing at 419.5C 4.48%
Volume change on freezing 46 C -> 0C 7.28%
Specific heat (20C) 0.382 kJ/kg.K
Latent heat of fusion (419.5C) 100.9 kJ/kg
Latent heat of vaporization (906C) 1.782 MJ/kg

24
Figure 3.4 Axial flow fan
Stainless Steel was used in our design for the fill (heat exchange surface) materials. It has
high conductivity and thus greater heat transfer is achieved. Besides, it is corrosion resistant
and it can withstand the scale formation. Since the cooling tower is pilot scaled, only three
fills (trays) of stainless steel were used. The fills are equipped with small holes to allow
smooth falling of water and air movement across the tower.
One of the standards being taken into consideration is Saudi Aramco Engineering Standard #
27-SAMSS-003. It states that a cooling tower should have the following material
specifications (refer to table 3.2):
Table 3.3 Saudi Aramco Standard#27-SAMSS-003 Material Specification Standards for a Cooling Tower
No. Component Basic Material Specification
1. Drift eliminator
Douglas Fir Polyvinyl Chloride Glass Fiber Reinforced Polyester
CTI STD 114
2. Piping
Carbon Steel RTR PVC HDPE
API SPEC 5L 01-SAMSS-034
3.
Mechanical Equipment Supports, Guards, Ladders and Safety Cages
Carbon Steel
ASTM A36
4. Fan Bolts and Hardware
Stainless Steel
ASTM A194 - 8M ASTM A193 - B8M
Fans are mechanical devices that are used to move air. In cooling towers, they are employed
to provide draft either forced or induced. This project incorporates both forced and induced
fans to positively impact the efficiency of the cooling tower. A 92.32 cfm aluminum blade
fan is used for both the forced and induced draft shown in
figure 3.1.
Fan specifications and dimensions as well as other related
technical data are summarized in below figure 3.2:

25
Figure 3.5 Fan outline drawing General axial flow fan technical details:
Electric motor: Shaded pole type AC electric motor design. Frame: High quality aluminum alloy outside frame Anti-corrosive and moisture proof structure Impeller: UL-0 70% PBT+30%FRP Bearing: self-lubricating bearing and ball bearing. Insulation: Class B Insulation Impedance: the case adds 500V DC to the coils, insulation impedance 100Mっ higher Dielectric strength: 0.5mA 1500V/AC min Safety protection: Impedance protection Operating temperature: -10-+70Ԩ Storage temperature: -40-+70Ԩ
Centrifugal submersible pump is used to transfer the warm water from the separated tank
(which represents the water coming from power plant or A/C plant) to the top of the cooling
tower. It is useful equipment that provides a head of 2.8 m with max flow rate 1800 L/h.
Features and specifications: Voltage: 220V (Compatible with 230V/240V) Frequency: 50/60HZ Power: 75W Head: 2.8 m Flow: 1800L/H Size: 102 * 98 * 100mm

26
Figure 3.6 Submersible pump

27
3.2 Design Methodology Designing a pilot scale counter-flow cooling tower requires several considerations to take
care of and steps to follow in order to come up with a perfect design. The project was
designed according to international standards and guidelines. One of the useful engineering
tool that has been utilized is the Solidworks software. It helped us in determining the
optimum size and dimensions of our cooling tower. The system design shown in figure 3.1 is
the layout of our real project.
Previous studies were considered in the materials selection process and the best wall
structural element was selected based on engineering standards of reputational companies.
We have also done a Pugh chart comparison and it revealed the best choices available. We
have chosen the stainless steel neglecting the bad effect of its weight. On the other hand, its
thermal conductivity and corrosion resistance as well as its availability made it possible to be
the best choice for this designs, Table 3.3 shows a Pugh chart.
Figure 3.7 Layout of the assembled design

28
Table 3.4 Pugh Chart for the fill material selection
Stainless steel Wood Copper
Wight - + +
Weldability with steel + - -
Corrosion Resistance S S S
Sheet availability + + -
Thermal conductivity + - +
Sum of - 1 2 2
Sum of + 3 2 2
Choice *
Selecting materials was carefully studied for this design. Several standards and codes have
been reviewed to choose the best that fits our project. The methodology followed for this
desgin depends upon the below diagram.

29
Figure 3.9 Sprinkler in operation Figure 3.10 Water spray sprinkler
3.3 Product Subsystems and Components Structural System The design components consist of main structural components and subsystems. The frame is
to support the whole tower assembly and provide space for the heat exchange to occur. The
fills are fitted in the frame and the bottom basin is for collecting the cooled water. Both
forced and draft fans are installed in the frame structure to move the air in counter flow
pattern. Figure 3.2
Plumbing System
Submersible pump is used to transfer warm water from a separated tank to the top of the
cooling tower. PVC ½” hose is connected from the pump to the nozzle installed in the top of
the tower. The water is then sprayed through the nozzle (sprinkler) to increase the surface
contact area between air and water, see figure 3.4. The sprinkler sensing mechanism is
destroyed so that it keeps running (spraying) the water at all times. Pump flow rate is 1800
L/h.
Figure 3.8 Structural System

30
Figure 3.11 Water temperature sensor
Instrumentation System
Two water proof sensors DS18B20 shown in figure 3.8 are used to measure the temperature
of the warm water in the separated tank and the cooled water in the collection basin of the
cooling tower. These sensors are accurate and have a display screen connected to them to
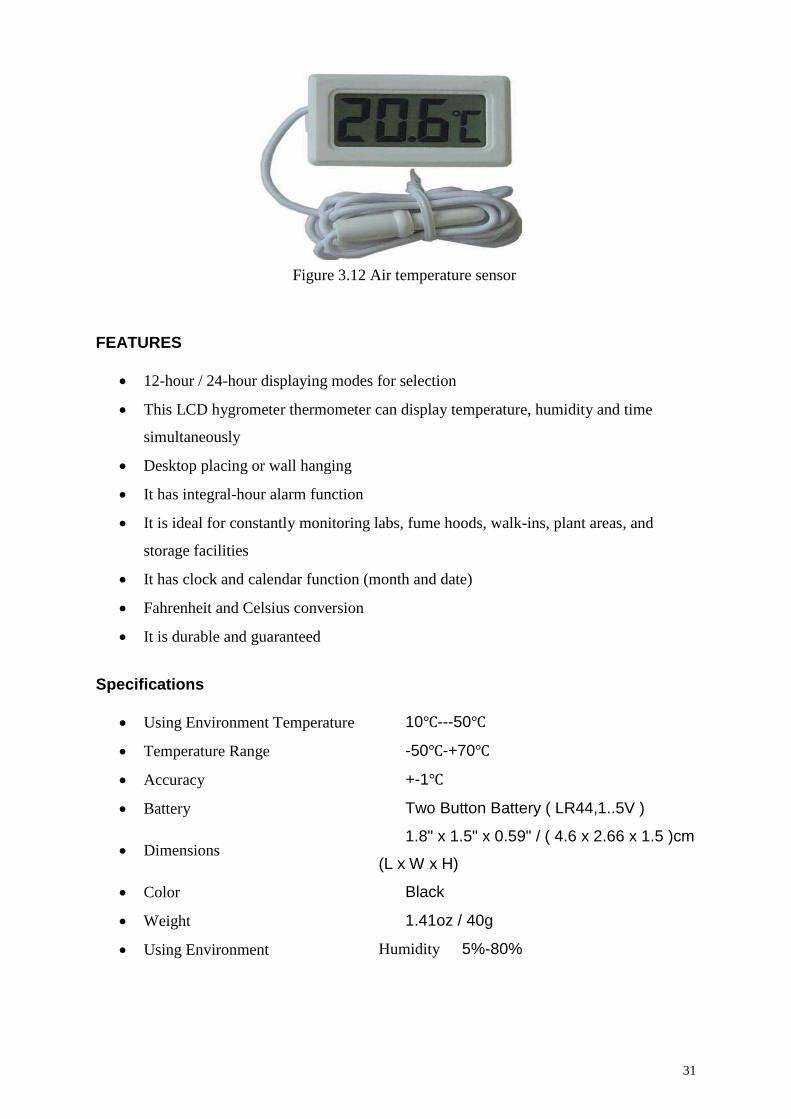
display the temperature readings. Other air sensors TPM-10 shown in figure 3.9 are used to
measure the temperature of the ambient air (inlet air) and the air leaving the cooling tower.
They are also connected to display screen separately to show the air temperature readings.
FEATURES
Unique 1-Wire interface requires only one port pin for communication
Multidrop capability simplifies distributed temperature sensing applications
Requires no external components can be powered from data line. Power supply range
is 3.0V to 5.5V
Zero standby power required
Measures temperatures from -55°C to +125°C. Fahrenheit equivalent is -67°F to
+257°F ±0.5°C accuracy from -10°C to +85°C
Thermometer resolution is programmable from 9 to 12 bits
Converts 12-bit temperature to digital word in 750 ms (max.)
User-definable, nonvolatile temperature alarm settings
Alarm search command identifies and addresses devices whose temperature is outside
of programmed limits (temperature alarm condition)
Applications include thermostatic controls, industrial systems, consumer products,
thermometers, or any thermally sensitive system
31
Figure 3.12 Air temperature sensor
FEATURES
12-hour / 24-hour displaying modes for selection
This LCD hygrometer thermometer can display temperature, humidity and time
simultaneously
Desktop placing or wall hanging
It has integral-hour alarm function
It is ideal for constantly monitoring labs, fume hoods, walk-ins, plant areas, and
storage facilities
It has clock and calendar function (month and date)
Fahrenheit and Celsius conversion
It is durable and guaranteed
Specifications
Using Environment Temperature 10Ԩ---50Ԩ
Temperature Range -50Ԩ-+70Ԩ
Accuracy +-1Ԩ
Battery Two Button Battery ( LR44,1..5V )
Dimensions 1.8" x 1.5" x 0.59" / ( 4.6 x 2.66 x 1.5 )cm
(L x W x H)
Color Black
Weight 1.41oz / 40g
Using Environment Humidity 5%-80%
32
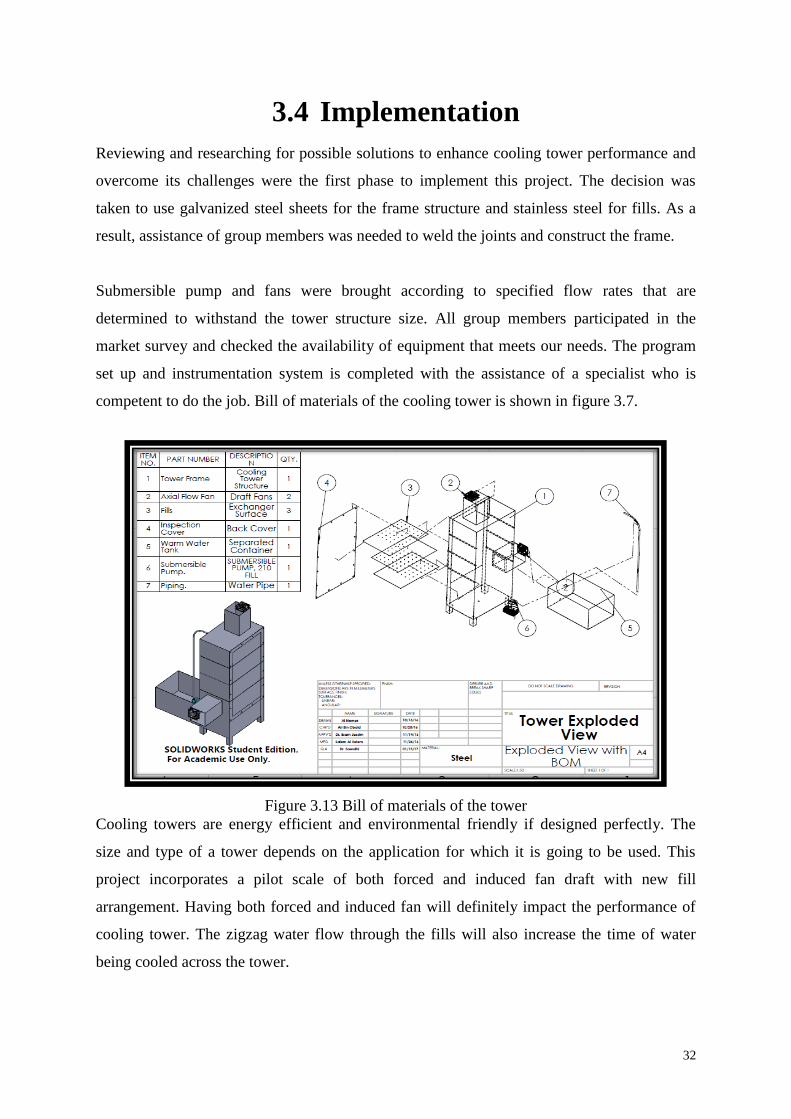
Figure 3.13 Bill of materials of the tower
3.4 Implementation Reviewing and researching for possible solutions to enhance cooling tower performance and
overcome its challenges were the first phase to implement this project. The decision was
taken to use galvanized steel sheets for the frame structure and stainless steel for fills. As a
result, assistance of group members was needed to weld the joints and construct the frame.
Submersible pump and fans were brought according to specified flow rates that are
determined to withstand the tower structure size. All group members participated in the
market survey and checked the availability of equipment that meets our needs. The program
set up and instrumentation system is completed with the assistance of a specialist who is
competent to do the job. Bill of materials of the cooling tower is shown in figure 3.7.
Cooling towers are energy efficient and environmental friendly if designed perfectly. The
size and type of a tower depends on the application for which it is going to be used. This
project incorporates a pilot scale of both forced and induced fan draft with new fill
arrangement. Having both forced and induced fan will definitely impact the performance of
cooling tower. The zigzag water flow through the fills will also increase the time of water
being cooled across the tower.

33
System Testing & Analysis
4.1 Plumping and actual flow rate testing
4.2 Cooling Tower Performance Test
4.3 Overall Results and Discussion

34
4.1 Plumping and actual flow rate testing The objectives of this test are:
To check the tower for proper sealing (leak test)
To check the pump’s performance with current hose piping
To check the water distribution through the nozzles
Procedure:
The cooling tower is completely insulated by vinyl. The separated water container is filled
with water not exceeding the cooled water collection basin. The pump is connected to the
power and switched on to observe any noticeable leakage across the tower.
*Note that you need to drain the water and power off the pump after test’s completion.
4.2 Cooling Tower Performance Test
The objectives of this test are:
To verify proper air flow across the cooling tower
To notice any avoidable challenges
To have an attempt test performance of the whole system including sensors
To calculate the range, approach and efficiency of the cooling tower
To predict the exit air and cooled water temperatures
Procedure:
The induced fan is connected to a power supply of 220V whereas the forced is 110V. Then
the warm water tank is filled and the pump is primed. Make sure no obstacles could be
sucked by the forced draft fan or any other unwanted object to enter the tower by the pump.
Switch on the sensors prior to conducting the experiment. Record the temperature readings of
the warm water and the ambient (inlet) air. The weather forecast of relative humidity should
be recorded to get the wet bulb temperature from the psychrometric chart. Turn on the pump
and fans simultaneously. Wait till the volume of collection basin is almost full
(approximately 60L). Record the readings of the cooled water and the exit air temperatures.
See experimental setup shown in figure 4.1.
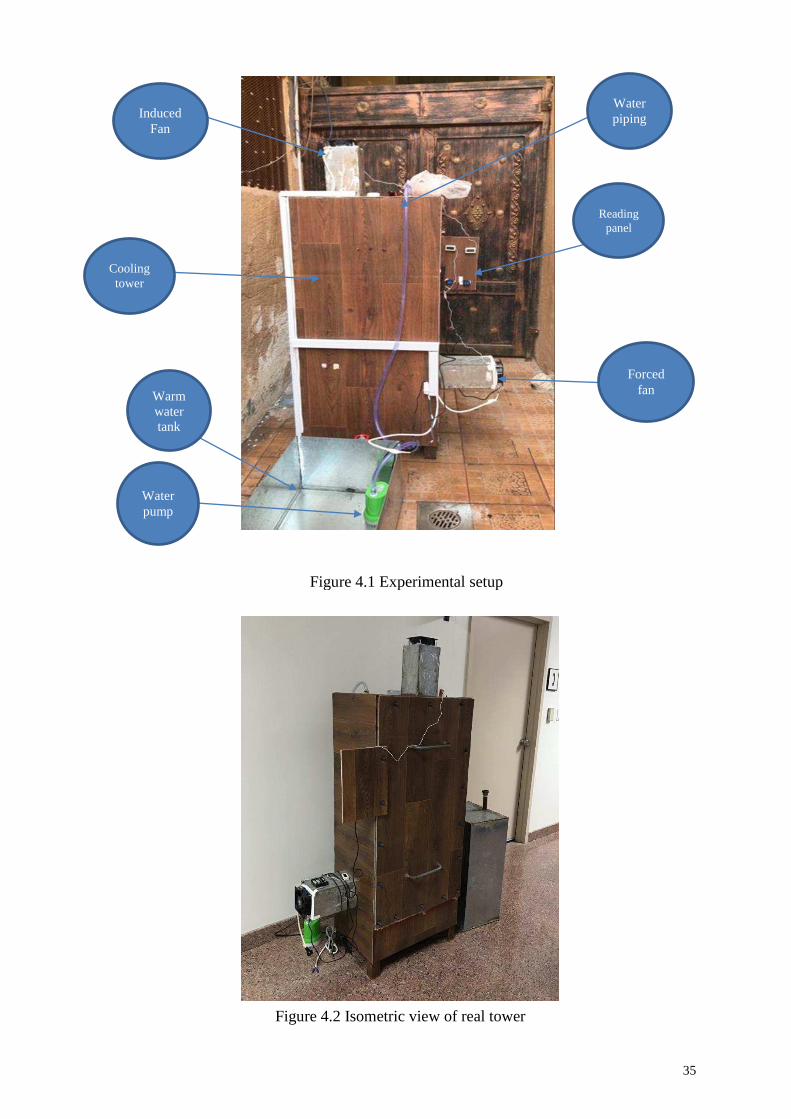
35
Figure 4.1 Experimental setup
Figure 4.2 Isometric view of real tower
Forced fan
Cooling tower
Induced Fan
Reading panel
Water pump
Warm water tank
Water piping

36
Figure 4.5 Cooling tower air & water flow
Figure 4.4 Cooling tower formulas
4.3 Overall Results, Analysis and Discussion When air flow passes a wetted surface there is a transfer of sensible and latent heat. If there is
a difference in temperature between the air and the wetted surface, heat will be transferred. If
there is a difference in the partial pressure of water vapor in the air and that of the water,
there will be a mass transfer. This transfer of mass causes a thermal energy transfer because if
some water is evaporated from the water layer, the latent heat of this vaporized water will be
supplied to the air. The cooling tower effectiveness is the ratio of range to the ideal range:
Three cases of air drafts have been studied and tested in this
cooling tower:
Case (1) when only induced draft fan was used with
flow rate of 92.32 cfm = 32.21 kg/s.
Case (2) is when forced draft fan was only used with
same flow rate as the induced one.
Case (3) is studies when both fans are employed.
Figure 4.3 Range & Approach of a cooling tower

37
Figure 4.7 Range and approach schematic Figure 4.6 Diagram of range and approach
The magnitude of certain parameters needs to be measured to study the tower effectiveness of
each case. Range, Approach, and efficiency as well as the evaporation loss rates are taken
into consideration in this project. Range and Approach are critical parameters from which we
can evaluate the performance and effectiveness of heat transfer rates in a cooling tower
(figure 4.4). Thus, below calculations are measuring tools for our project. Range is the
difference between inlet (warm) water and outlet (cooled) water. Approach is the difference
between the outlet water temperature and the entering air wet bulb temperature. The higher
approach the less efficient is the cooling tower whereas the higher range the high efficient the
tower is.
Four trials were attempted to measure the temperature readings of each case. The calculations
of Range, Approach, Efficiency & the Evaporation rate were carried out on the most ideal
trial. In other words, the mean average of all trials has been selected to represent each
parameter.
The air entering the cooling tower is denoted as Ta1 and the air exiting it is Ta2. Similarly,
the water entering the tower is Tw1 and the exit is Tw2. Using these notations, temperature
readings were recorded in tables 4.1, 4.2, 4.3. Further analysis of obtained results is explained
below.

38
Case (1) Induced Fan Analysis: In this system, a centrally located fan at the top, takes suction from the tower and discharges
it to the atmosphere. The only difference between the induced draft cooling tower and forced
draft cooling tower is that the fan is located at the top in the induced draft cooling tower.
Table 4.1 Case (1) temperature readings
Trial# Ta1(C) Tw1 )C( Ta2 (C) Tw2(C)
1 27 40.8 33 38.5
2 26.9 36.5 31.1 35
3 27.1 38.6 32.2 36
4 27.1 36.5 31.1 35.1
Average 27.02 38.1 31.95 36.15
Range = 38.1-36.15= 1.95 C
Approach= Cooled water-Wet bulb temperature, the corresponding wet bulb temperature is
21C (obtained from the Psychrometric Chart)
Approach=36.15-21= 15.15C
Efficiency = Range / (Range + Approach).
Efficiency= 1.95/ (1.95+15.15) = 11.4%
Case (2) Forced Fan Analysis: In this system, fan is located near the bottom and on the side. This fan forces the air from
bottom to top. An eliminator is used to prevent loss of water droplets along with the forced
air.
Table 4.2 Case (2) temperature readings Trial# Ta1(C) Tw1 )C( Ta2 (C) Tw2 (C)
1 27.8 39.3 33.5 35.1
2 29.1 36.6 32.2 34.5
3 29.2 39 33.7 35.1
Average 28.7 38.3 33.13 34.9
39
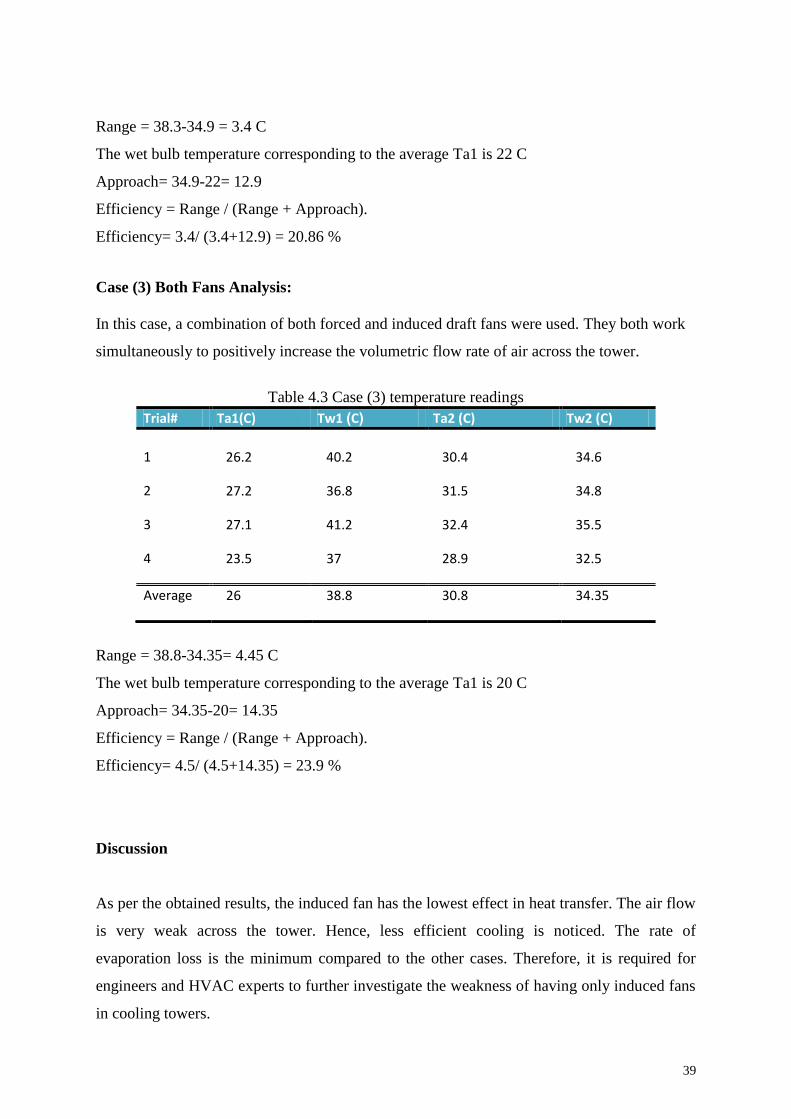
Range = 38.3-34.9 = 3.4 C
The wet bulb temperature corresponding to the average Ta1 is 22 C
Approach= 34.9-22= 12.9
Efficiency = Range / (Range + Approach).
Efficiency= 3.4/ (3.4+12.9) = 20.86 %
Case (3) Both Fans Analysis: In this case, a combination of both forced and induced draft fans were used. They both work
simultaneously to positively increase the volumetric flow rate of air across the tower.
Table 4.3 Case (3) temperature readings
Trial# Ta1(C) Tw1 )C( Ta2 (C) Tw2 (C)
1 26.2 40.2 30.4 34.6
2 27.2 36.8 31.5 34.8
3 27.1 41.2 32.4 35.5
4 23.5 37 28.9 32.5
Average 26 38.8 30.8 34.35
Range = 38.8-34.35= 4.45 C
The wet bulb temperature corresponding to the average Ta1 is 20 C
Approach= 34.35-20= 14.35
Efficiency = Range / (Range + Approach).
Efficiency= 4.5/ (4.5+14.35) = 23.9 %
Discussion
As per the obtained results, the induced fan has the lowest effect in heat transfer. The air flow
is very weak across the tower. Hence, less efficient cooling is noticed. The rate of
evaporation loss is the minimum compared to the other cases. Therefore, it is required for
engineers and HVAC experts to further investigate the weakness of having only induced fans
in cooling towers.

40
0
1
2
3
4
5
6
Case (1) Case (2) Case (3)
Ra
ng
e (
C)
Range
Figure 4.5 Comparison of Range of the three cases
0
5
10
15
20
25
30
Case (1) Case (2) Case (3)
Eff
icie
ncy
(%
)
Efficiency
Figure 4.6 Comparison of efficiecy of the three cases
The efficiency of cooling depends on several parameters. This includes the terms “Range and
Approach”. The higher range is the good cooling tower is whereas the lower approach, the
better rate of heat transfers. In this case, we have higher approach and less range which
resulted in lower efficiency. One of the possible reasons of having less efficiency is due to
having well insulated frame with no air entry portion other than the duct opening of the
forced draft fan. The small holes on the fills can’t allow large volume of air flow to pass
through them.
The second case has achieved better results than the first one. The efficiency has reached up
to 20.8% which represents almost double what was achieved in the induced draft experiment.
The reason behind that is probably caused by the location of the fan. It is located in the above
of the collection basin and right after the last cooling stage (fill). Evaporation loss has also
increased and contributed to better cooling.
41
0
2
4
6
8
10
12
14
16
18
Case (1) Case (2) Case (3)
Ap
pro
ach
(C
)
Approach
Figure 4.7 Comparison of Approach of the three cases
0
5
10
15
20
25
30
Range Approach Evaporation rate Efficiency
Summary
Case 1 Case 2 Case 3
Figure 4.8 Summary of achieved results of the three cases
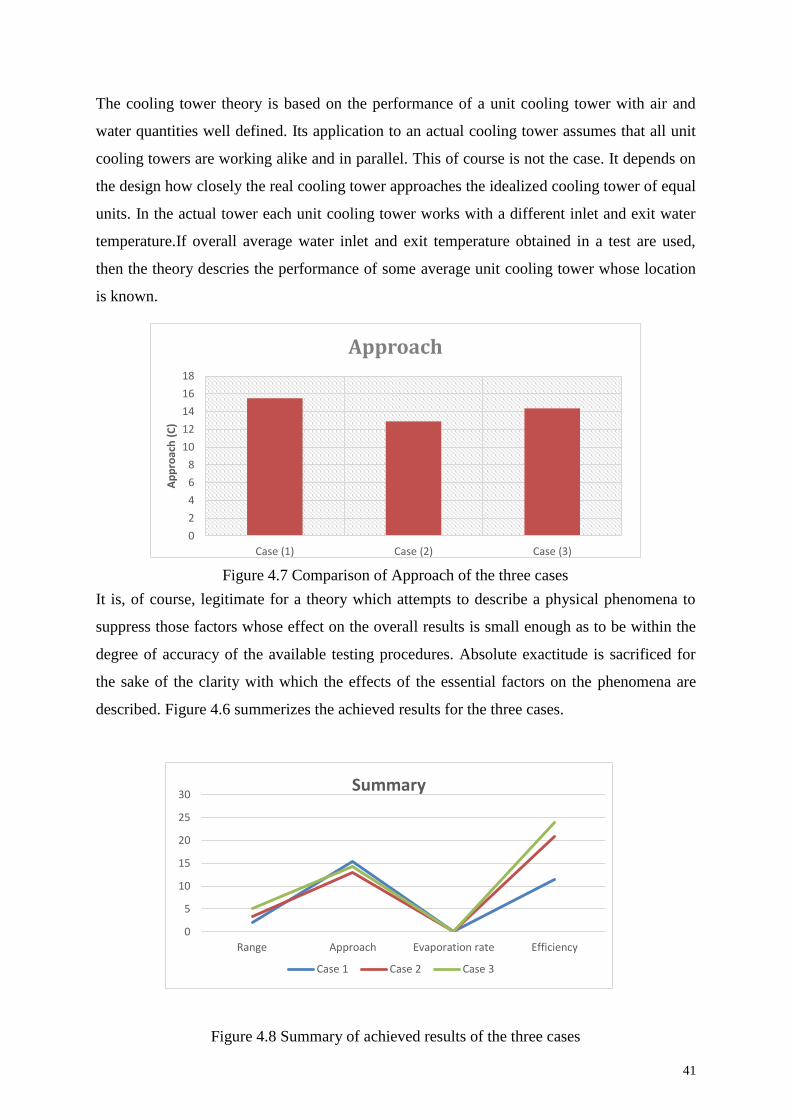
The cooling tower theory is based on the performance of a unit cooling tower with air and
water quantities well defined. Its application to an actual cooling tower assumes that all unit
cooling towers are working alike and in parallel. This of course is not the case. It depends on
the design how closely the real cooling tower approaches the idealized cooling tower of equal
units. In the actual tower each unit cooling tower works with a different inlet and exit water
temperature.If overall average water inlet and exit temperature obtained in a test are used,
then the theory descries the performance of some average unit cooling tower whose location
is known.
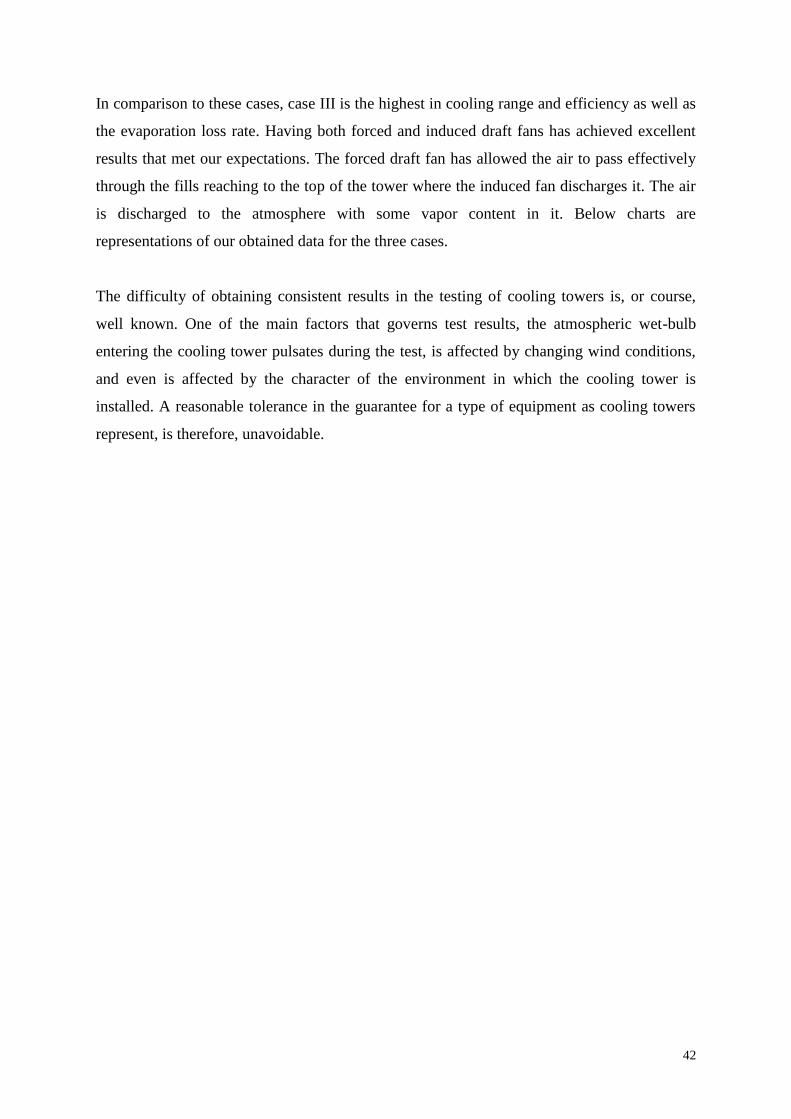
It is, of course, legitimate for a theory which attempts to describe a physical phenomena to
suppress those factors whose effect on the overall results is small enough as to be within the
degree of accuracy of the available testing procedures. Absolute exactitude is sacrificed for
the sake of the clarity with which the effects of the essential factors on the phenomena are
described. Figure 4.6 summerizes the achieved results for the three cases.
42
In comparison to these cases, case III is the highest in cooling range and efficiency as well as
the evaporation loss rate. Having both forced and induced draft fans has achieved excellent
results that met our expectations. The forced draft fan has allowed the air to pass effectively
through the fills reaching to the top of the tower where the induced fan discharges it. The air
is discharged to the atmosphere with some vapor content in it. Below charts are
representations of our obtained data for the three cases.
The difficulty of obtaining consistent results in the testing of cooling towers is, or course,
well known. One of the main factors that governs test results, the atmospheric wet-bulb
entering the cooling tower pulsates during the test, is affected by changing wind conditions,
and even is affected by the character of the environment in which the cooling tower is
installed. A reasonable tolerance in the guarantee for a type of equipment as cooling towers
represent, is therefore, unavoidable.
43
Project Management
5.1 Project Plan
5.2 Contribution of Team Members
5.3 Project Execution Monitoring
5.4 Challenges and Decision Making
5.5 Project Bill of Materials and Budget

44
5.1 Project Plan Managing project completion time is very essential for undergraduate students. In this project
we set a flexible timeframe for all group members to complete the tasks in timely manner.
Following is the table that shows the main tasks and their completion date.
Table 5.1 Project's Time frame Task Completion date Budget and resources
(Examples are given below)
1 Literature review 27th of October - Internet resources- Journals, HVAC experts, Work colleagues
2 System design 31st of October CAD (solid works), Dr. Esam’s recommendations, Cooling tower manufacturing companies’ standards.
3 System Manufacturing and Assembly 20th of November Approximately 4500-5000 SAR.
4 System Testing and Experiment Design 5th of December Professor’s assistance, technology utilization.
5 Analysis and Findings 20th of December Compare experimental Vs. Theoretical data, feasibility study, cost effectiveness
The tasks are distributed among all group members. Biweekly reports explain the tasks
assigned to individuals (see appendix 1). In addition, the Gantt chart (figure 5.1) for this
project and timeline are shown below.
45
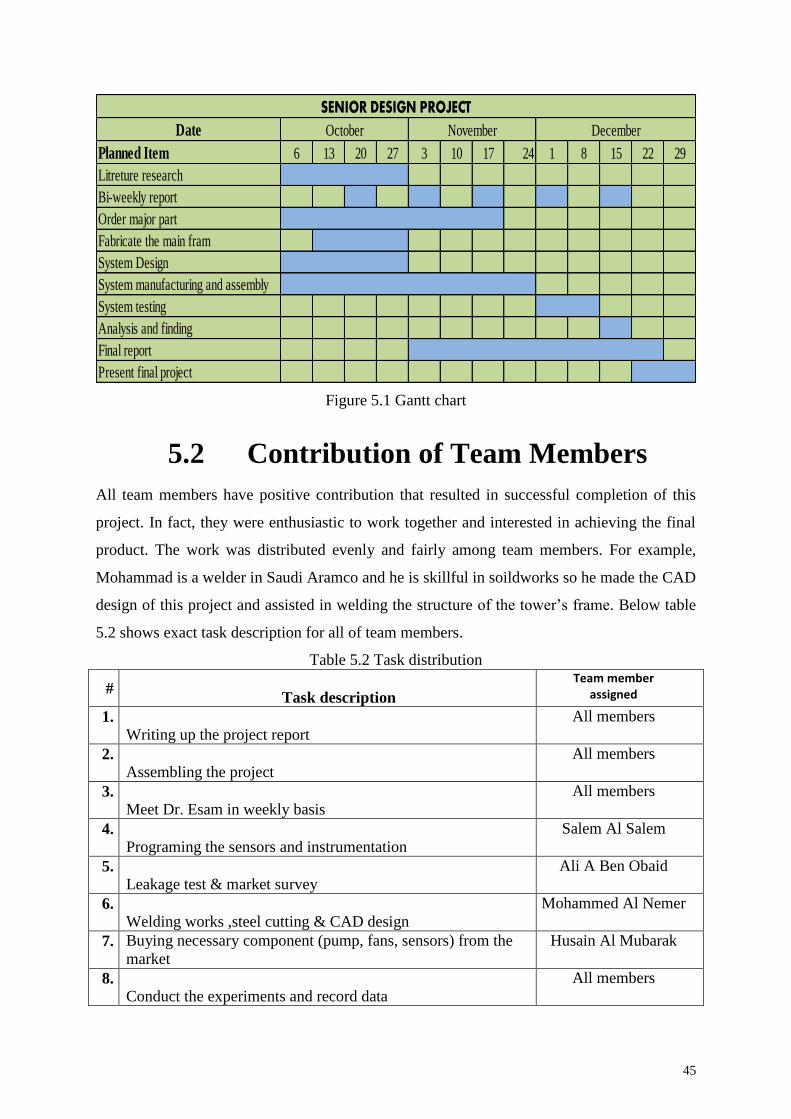
Figure 5.1 Gantt chart
5.2 Contribution of Team Members All team members have positive contribution that resulted in successful completion of this
project. In fact, they were enthusiastic to work together and interested in achieving the final
product. The work was distributed evenly and fairly among team members. For example,
Mohammad is a welder in Saudi Aramco and he is skillful in soildworks so he made the CAD
design of this project and assisted in welding the structure of the tower’s frame. Below table
5.2 shows exact task description for all of team members.
Table 5.2 Task distribution
Planned Item 6 13 20 27 3 10 17 24 1 8 15 22 29Litreture researchBi-weekly reportOrder major partFabricate the main framSystem DesignSystem manufacturing and assemblySystem testingAnalysis and finding Final reportPresent final project
SENIOR DESIGN PROJECT
October November DecemberDate
# Task description
Team member
assigned
1. Writing up the project report
All members
2. Assembling the project
All members
3. Meet Dr. Esam in weekly basis
All members
4. Programing the sensors and instrumentation
Salem Al Salem
5. Leakage test & market survey
Ali A Ben Obaid
6. Welding works ,steel cutting & CAD design
Mohammed Al Nemer
7. Buying necessary component (pump, fans, sensors) from the market
Husain Al Mubarak
8. Conduct the experiments and record data
All members

46
5.3 Project Execution Monitoring The project team members meet every Saturday of every week starting November 5th. The
meeting is a useful tool that helped all members to stay updated and posed of the work
progress done by individuals. Also, all members meet with the project advisor every Tuesday
for any concerns or inquiries as well as recommendations related to the project. A WhatsApp
group has been created for both group members and the advisor to stay connected at most of
the time.
5.4 Challenges and Decision Making In every engineering project, there are unexpected challenges that are experienced by
engineers. In this project, we faced some problems that luckily were solved and revoked.
Below are some the problems we faced and eventually were overcome.
Team members
All team members are employees and have many responsibilities other than the university.
Juggling from work to the university and then going back home is difficult, but we overcome
this challenge by time management. We specify every Saturday to work on the project
including writing its reports as well as reading more about it in our free time.
Materials Selection
Choosing the right materials that fits our project requirements was another challenge. We
wanted to select the best materials that could help us achieving our project’s objectives. We
were struggling whether to use wood, Aluminum or steel to construct our cooling tower.
Finally, we reviewed many standards and guidelines of designing cooling towers and found
out that stainless steel can be used in fill materials whereas carbon steel for the structural
elements. One of team members is working as welder and has helped us constructing the
frame structure.
Instrumentation
Due to the lack of knowledge in instrumentations, we were struggling which type of accurate
sensor is suitable to us. We needed two air sensors and another two water sensors. We
surveyed the local market and found that there is no availability of water proof sensors.
Therefore, we ordered the parts from abroad.

47
20%
25%
3%5%4%5%5%
13%
20%
Actual Summary
Structural Elements Fill Materials Submersible PumpFans Air Sensors Water SensorsInsulation Auxiliary Other
5.5 Project Bill of Materials and Budget Managing the pre-determined budget is a challenging for engineers. In this project, we were
lucky that the budget didn’t exceed the planned one. We almost spent as planned. Below are
the charts that specify the bill of materials with their cost.
These graphs represent the actual expenses of the designed project but not limited to other hidden expenditures like transporting, surveying ...etc.
DESIGN BUDGET

48
Project Analysis
6.1 Life-long Learning
6.2 Impact of Engineering Solutions
6.3 Contemporary Issues Addressed
49
6.1 Life-long Learning Senior design project is the milestone of the whole engineering degree courses. The
knowledge gained by study is applied in it. In fact, our project is mainly about heat transfer
and materials science. Additional skills that we learnt in this project are selection of sensors,
time management, technical report writing, reviewing standards and codes. We went through
different standards of international companies and organizations. We collected our
information and data from trusted sites and journal articles. This has helped us in researching
skills and improved our techniques in seeking for information.
Not only senior project has helped us in developing technical skills, but also it has helped us
building our personalities through leadership and team working skills. The six core
competencies have important roles of that, too. Being professional in all your works is a
result of exercising these competencies.
In this project, we faced difficulties in time management as we all have families and
responsibilities other than the Assessment III course. All team members are far from each
other. Ali lives in Thoqabah and Husain has a room in Qurrayyah dormitory whereas Salem
has an apartment in Qatif. Mohammad finds difficulties travelling from Dammam, too.
Whenever there is water. There is chance of leak! We couldn’t stop the leak in the beginning
because of the metal joints. We put rubber gaskets between the metal surfaces to seal off, but
unfortunately it didn’t work. Later we used adhesive sealant (silicone) to minimize the leak.

50
6.2 Impact of Engineering Solutions By developing methods to increase cooling tower efficiency, we can significantly contribute
in conservation of our environmental resources like water. Water is the life base of creations.
Therefore, this project developed ways to conserve water vaporization and losses through the
enhanced fill material and arrangement. Although implementing it could be costly, the
benefits will be obtained are valuable.
As discussed previously, a one degree Celsius increase can consume power of 2.7% of an
electrical compressor whereas reducing one degree Celsius in a cooling tower can save
energy of 5 kCal/kWh. So, this represents the importance of a cooling tower in industry. This
should motivate engineers further to look for possible ways to improve its efficiency without
affecting natural resources and the environment. In the long term, many benefits can be
obtained if proper methodology is employed.
6.3 Contemporary Issues Addressed Eastern Province of Saudi Arabia is a critical region to focus on due to its economic
resources. Most of Saudi Arabia’s income depends on the power plants and refineries located
in the Eastern Province. It is essential for us to study the performance of cooling tower
typically used in the Eastern Region power plants, factories, buildings …etc. The weather in
Eastern Province is variable and hence it affects the performance of cooling towers.
This project addressed the effect of humidity and cold weather temperature variations on
cooling tower efficiency. Insulation was used to eliminate any external elements that
contribute to deviating the project’s outcomes. The vaporization caused by splashing the
water over the cooling tower and ambient air is desirable whereas the one caused by external
factor is not. Sun heat directed the tower frame can cause water to evaporate and hence more
make up water is needed.

51
Conclusion & Recommendations
7.1 Conclusion
7.2 Future Recommendations
52
7.1 Conclusions For any engineering projects, existence of some challenges essentially requires analysis and
methods to overcome. However, overcoming these challenges needs effective utilization of
leadership skills and critical thinking of the problem as well. This may include the
engineering knowledge that is gained through studying courses in the university. As it can be
noticed from the results we gained, incorporating both forced and induced draft fans have
positive impact on cooling tower performance. They contributed in increasing the efficiency
of the cooling tower by enabling more volume of air to pass through the tower and hence
more heat will be dissipated. The zigzag water flow pattern has made the water movement to
slow down and longer time of water exposure to air is achieved. Stainless steel fills have
higher conductivity and this helped us in achieving as excellent results as 4 C of cooling.
The senior design project is a milestone for engineering degree students. In fact, we have
learned lots of useful information through conducting this experiment and writing up this
thesis. In the past, we were not aware of the composition of galvanized and stainless steel and
their thermal behavior and properties. The importance of a cooling tower in industries has
motivated us to study its performance and look for possible ways to increase its efficiency.
7.2 Future Recommendations For this project to give accurate results, we recommend that the temperature of the warm
water tank be controlled and maintained to certain temperature. This can be done by having
continuous heating to desired temperature. We also suggest having larger collection basin by
having over flow piping to drain the flooding water to a separate container. Larger induced
fan with higher flow rate is also recommended to have positive impact on the heat transfer
rate.
Accurate measurement of air flow rate as well as water flow rate is also recommended. This
will assist in evaluating and determining the heat dissipated in the system. Additionally, it is
to set the required make-up water and substitute the evaporated amount of water. It is highly
recommended to further look into possible engineering solutions to develop ways to
overcome such challenges like the scale deposits on fills (exchange surface), corrosion,
reducing water losses in cooling water systems and any other discoverable items that may be
faced in future. One of the recommendations is to use Nano particle in the water to be cooled
to enhance the heat transfer rates.
53
References
1. Bhupesh Kumar Yadav, S. L. (2015). Experimental Study of the Performance of Cooling. International
Journal of Science and Research (IJSR) .
2. Buecker, B. (2015, March 03). Cooling tower water treatment challenges. Retrieved October 21, 2016, from Energy-Tech: http://www.energy-tech.com/water/article_f6256e0c-c1c1-11e4-99a2-c33747236e5b.html?mode=story
3. Cooling Tower and its Industrial Applications. (2012, July 21). Retrieved from Harrison Cooling
Towers Pvt. Ltd.: http://coolingtowersolutions.blogspot.com/2012/07/cooling-tower-and-its-industrial.html
4. G.Srinivasan, B. (2016). IMPROVING PERFORMANCE OF COOLING TOWER & REDUCTION.
International Journal of Advanced Science and Engineering Research, 343-349.
5. H. Marmouch, J. O. (2008). Experimental and theoretical study on the effect. 6. Hasan, O. (2011). cooling tower chemistry and performnce improvment.
7. HDG Environmental Advantages. (2016). Retrieved from American Galvanizers Association:
http://www.galvanizeit.org/hot-dip-galvanizing/is-galvanizing-sustainable/hdg-environmental-advantages
8. Krishna S. Vishwakarma, A. S. (2015). Study the factors on which efficiency of cooling tower can be
critically acclaimed (A case Study). Journal of Engineering Research and Applications, 73-75.
9. Kuljeet Singh, R. D. (n.d.). An experimental and multi-objective optimization study of a forced. Energy Conversion and Management. Materials and Energy Engineering, Indian Institute of Technology Ropar, Punjab, India.
10. Lemouari M, B. M. (2010). Experimental investigation of the performance characteristics of a counter
flow wet cooling tower. International Journal of Thermal Sciences,.
11. Muangnoi T, A. W. (2007). An exergy analysis on the performance a counter flow wet cooling tower. Applied Thermal engineering.
12. Paolucci, A. (2002). Cooling Tower Analysis. University of Tennessee at Chattanooga.
13. Papaefthimiou VD, Z. T. (2006). Thermodynamic study of wet. International Journal of Energy
Research.
14. Ramkumar Ramkrishnan, R. A. (2013). Experimental study of cooling tower performance using ceramic.
15. Shivaraman, R. a. (2004). Cooling Towers. United Nations Environment Program.
16. The Secret History of Cooling Towers. (2016). Retrieved 10 24, 2016, from Delta Cooling Towers, Inc.: http://deltacooling.com/history-of-cooling-tower-systems/
17. What is a cooling tower. (2012-2015). Retrieved from Cooling Technology Institute:
http://www.cti.org/whatis/coolingtowerdetail.shtml
18. What is evaporative cooling. (2010). Retrieved from Baltimore Aircoil Company: http://www.baltimoreaircoil.com/english/what-is-evaporative-cooling

54
Progress Reports
1 Biweekly Report#1
2 Biweekly Report#2
3 Biweekly Report#3
4 Biweekly Report#4
5 Biweekly Report#5
55
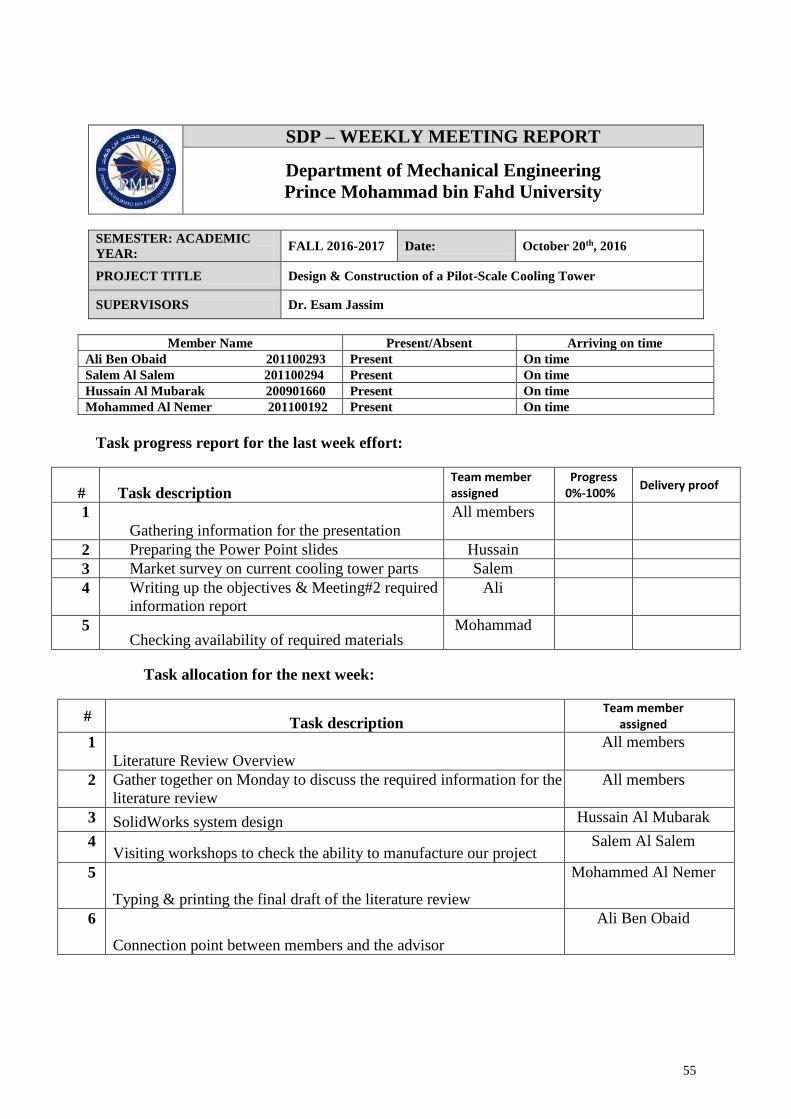
SDP – WEEKLY MEETING REPORT
Department of Mechanical Engineering Prince Mohammad bin Fahd University
SEMESTER: ACADEMIC YEAR:
FALL 2016-2017 Date: October 20th, 2016
PROJECT TITLE Design & Construction of a Pilot-Scale Cooling Tower
SUPERVISORS Dr. Esam Jassim
Member Name Present/Absent Arriving on time
Ali Ben Obaid 201100293 Present On time Salem Al Salem 201100294 Present On time Hussain Al Mubarak 200901660 Present On time Mohammed Al Nemer 201100192 Present On time
Task progress report for the last week effort:
# Task description Team member
assigned
Progress
0%-100% Delivery proof
1 Gathering information for the presentation
All members
2 Preparing the Power Point slides Hussain 3 Market survey on current cooling tower parts Salem 4 Writing up the objectives & Meeting#2 required
information report Ali
5 Checking availability of required materials
Mohammad
Task allocation for the next week:
# Task description Team member
assigned
1 Literature Review Overview
All members
2 Gather together on Monday to discuss the required information for the literature review
All members
3 SolidWorks system design Hussain Al Mubarak
4 Visiting workshops to check the ability to manufacture our project
Salem Al Salem
5
Typing & printing the final draft of the literature review
Mohammed Al Nemer
6
Connection point between members and the advisor
Ali Ben Obaid

56
Outcome f: An understanding of professional and ethical responsibility.
Criteria None (1) Low (2) Moderate (3) High (4)
F.1 Demonstrate professionally responsibility at all times.
Fails to demonstrate responsibility for his actions and does not deal with others professionally
Shows some sense of responsibility for his actions but needs improvement in dealing with others professionally
Takes full responsibility for his actions and deals with others professionally
Demonstrates high moral and professional ethics, takes complete responsibility for his actions and is excellent in interacting and dealing with others
Outcome d: An ability to function on multidisciplinary teams.
Criteria None (1) Low (2) Moderate (3) High (4)
d.1 Develop a work plan and distribute tasks
Fails to develop a work plan and tasks are assigned ad hoc
Develops a work plan without much thought and tasks distribution is not balanced
Develops a good work plan and distributes tasks in a balanced way
Develops a realistic and well thought out work plan and distributes tasks in a balanced way and according to the skills and expertise of the team members
d. 2 Take responsibility in team efforts to complete the assigned tasks.
Does not perform assigned tasks; often misses meetings and, when present, does not have anything constructive to say; relies on others to do the work;
Performs assigned tasks but needs many reminders; attends meetings regularly but generally does not say anything constructive; sometimes expects others to do his/her work;
Performs all assigned tasks; attends meetings regularly and usually participates effectively; generally reliable;
Performs all tasks very effectively; attends all meetings and participates enthusiastically; very reliable.
d.3 Show respect to other team members.
Often argues with team mates; doesn't let anyone else talk; occasional personal attacks and "put-downs"; wants to have things done his way and does not listen to alternate approaches;
Usually does much of the talking; does not pay much attention when others talk, and often assumes their ideas will not work; no personal attacks and put-downs but sometimes patronizing; when others get through to him, works reasonably well with them;
Generally listens to others' points of view; always uses appropriate and respectful language; tries to make a definite effort to understand others' ideas;
Always listens to others and their ideas; helps them develop their ideas while giving them full credit; always helps the team reach a fair decision.
Indicate the extent to which you agree with the above statement, using a scale of 1-4 (1=None; 2=Low; 3=Moderate; 4=High)
# Name Criteria (d1) Criteria (d2) Criteria (d3) Criteria (f1) 1 Ali Ben Obaid 4 4 4 4 2 Salem Al Salem 4 4 4 4 3 Hussain Al Mubarak 4 4 4 4 4 Mohammed Al Nemer 4 4 4 4
Comments on individual members
Name Comments
Ali Ben Obaid No comments
Salem Al Salem No comments
Hussain Al Mubarak No comments
Mohammed Al Nemer No comments

57
SDP – WEEKLY MEETING REPORT
Department of Mechanical Engineering Prince Mohammad bin Fahd University
Team#6 SEMESTER: ACADEMIC YEAR:
FALL 2016-2017 Date: November 3rd , 2016
PROJECT TITLE Design & Construction of a Pilot-Scale Cooling Tower
SUPERVISORS Dr. Esam Jassim
Member Name Present/Absent Arriving on time
Ali Ben Obaid 201100293 Present Yes Salem Al Salem 201100294 Present Yes Hussain Al Mubarak 200901660 Present Yes Mohammed Al Nemer 201100192 Present Yes
Task progress report for the last week effort:
# Task description Team member
assigned
Progress
0%-100% Delivery proof
1 Second draft literature review proof reading All members 100% Report attached
2 Writing up the background with its references Ali 100% Report attached
3 SolidWorks system design & completing the previous work section of second draft
Mohammad 90% Drawing attached
4 Following up the frame construction progress Ali 100% -------------
5 Writing up the comparative study section Salem 100% Report attached
Task allocation for the next week:
# Task description Team member
assigned
1 Start preparing for the next presentation All members
2 Gather together on Saturday to discuss the next step after constructing the frame (casing) and take photos.
All members
3 Finalize the SolidWorks system design
Mohammed Al Nemer Hussain Al Mubarak
4 Start working in chapter#3 section#1 of the final report Salem Al Salem
5 Complete section#2 of chapter#3 Ali Ben Obaid
6 Meet Dr. Esam on Tuesday to discuss our progress All members
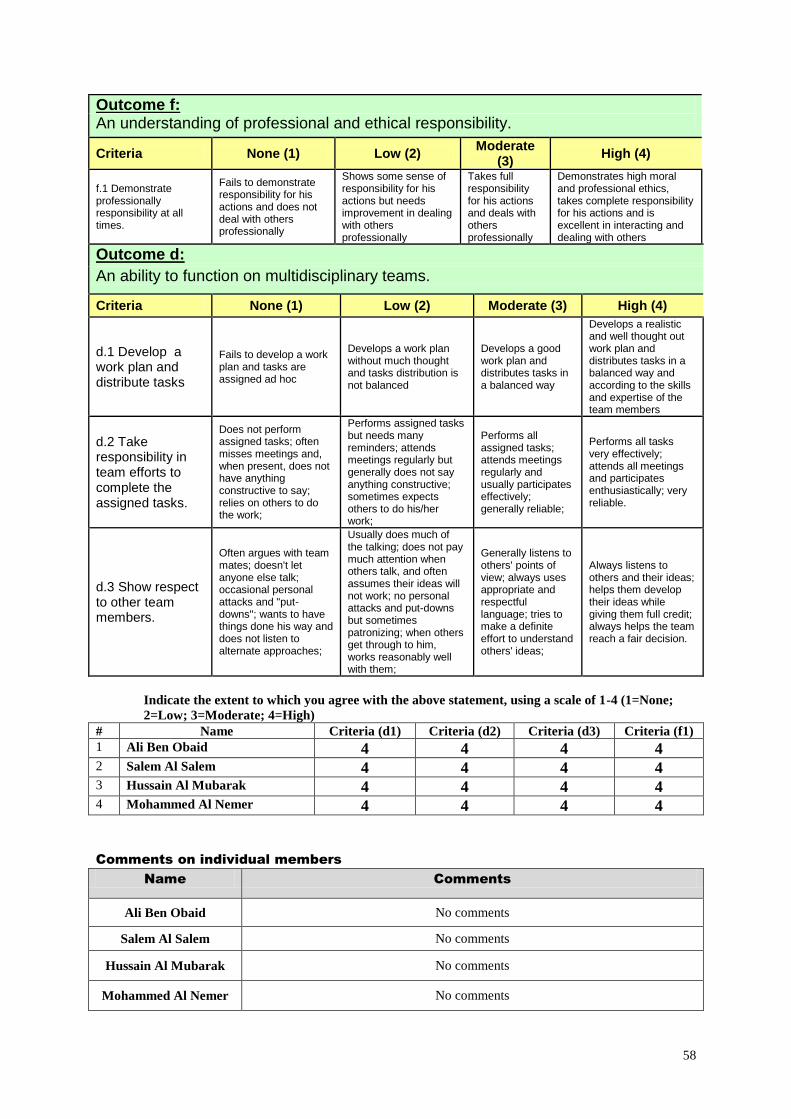
58
Outcome f: An understanding of professional and ethical responsibility.
Criteria None (1) Low (2) Moderate (3) High (4)
f.1 Demonstrate professionally responsibility at all times.
Fails to demonstrate responsibility for his actions and does not deal with others professionally
Shows some sense of responsibility for his actions but needs improvement in dealing with others professionally
Takes full responsibility for his actions and deals with others professionally
Demonstrates high moral and professional ethics, takes complete responsibility for his actions and is excellent in interacting and dealing with others
Outcome d: An ability to function on multidisciplinary teams.
Criteria None (1) Low (2) Moderate (3) High (4)
d.1 Develop a work plan and distribute tasks
Fails to develop a work plan and tasks are assigned ad hoc
Develops a work plan without much thought and tasks distribution is not balanced
Develops a good work plan and distributes tasks in a balanced way
Develops a realistic and well thought out work plan and distributes tasks in a balanced way and according to the skills and expertise of the team members
d.2 Take responsibility in team efforts to complete the assigned tasks.
Does not perform assigned tasks; often misses meetings and, when present, does not have anything constructive to say; relies on others to do the work;
Performs assigned tasks but needs many reminders; attends meetings regularly but generally does not say anything constructive; sometimes expects others to do his/her work;
Performs all assigned tasks; attends meetings regularly and usually participates effectively; generally reliable;
Performs all tasks very effectively; attends all meetings and participates enthusiastically; very reliable.
d.3 Show respect to other team members.
Often argues with team mates; doesn't let anyone else talk; occasional personal attacks and "put-downs"; wants to have things done his way and does not listen to alternate approaches;
Usually does much of the talking; does not pay much attention when others talk, and often assumes their ideas will not work; no personal attacks and put-downs but sometimes patronizing; when others get through to him, works reasonably well with them;
Generally listens to others' points of view; always uses appropriate and respectful language; tries to make a definite effort to understand others' ideas;
Always listens to others and their ideas; helps them develop their ideas while giving them full credit; always helps the team reach a fair decision.
Indicate the extent to which you agree with the above statement, using a scale of 1-4 (1=None; 2=Low; 3=Moderate; 4=High)
# Name Criteria (d1) Criteria (d2) Criteria (d3) Criteria (f1) 1 Ali Ben Obaid 4 4 4 4 2 Salem Al Salem 4 4 4 4 3 Hussain Al Mubarak 4 4 4 4 4 Mohammed Al Nemer 4 4 4 4
Comments on individual members
Name Comments
Ali Ben Obaid No comments
Salem Al Salem No comments
Hussain Al Mubarak No comments
Mohammed Al Nemer No comments

59
SDP – WEEKLY MEETING REPORT
Department of Mechanical Engineering Prince Mohammad bin Fahd University
Team#6 SEMESTER: ACADEMIC YEAR:
FALL 2016-2017 Date: November 20th , 2016
PROJECT TITLE Design & Construction of a Pilot-Scale Cooling Tower
SUPERVISORS Dr. Esam Jassim
Member Name Present/Absent Arriving on time
Ali Ben Obaid 201100293 Present yes Salem Al Salem 201100294 Present yes Hussain Al Mubarak 200901660 Present yes Mohammed Al Nemer 201100192 Present yes Task progress report for the last week effort:
# Task description Team member
assigned
Progress
0%-100% Delivery proof
1 Third draft literature review proof reading All members 100% Report attached
2 Writing up the design constraints Ali 100% Report attached
3 SolidWorks system design and finding out fan specifications
Mohammad 100% Drawing attached
4 Frame construction works Ali 100% Photos attached
5 Writing up the methodology and implementation sections
Salem 100% Report attached
6 Writing up the subsystems section of chapter#3 Husain 70% --------------
Task allocation for the next week:
# Task description Team member
assigned
1. Start preparing for the next presentation All members
2. Finalize chapter#3 draft and proofread Mohammed Al Nemer
3. Buying the required sensors and controllers Salem Al Salem
4. Buying the fans Ali A Ben Obaid
5. Meet Dr. Esam on Tuesday to discuss our progress All members
6. Apply the thermal insulation on the tower Mohammed Al Nemer
7. Specify the required water flow rate and buying the required pump Husain Al Mubarak
8. Gather together on Saturday to discuss the next step after constructing the frame (casing), assemble the project and take photos
All members

60
Outcome f: An understanding of professional and ethical responsibility.
Criteria None (1) Low (2) Moderate (3) High (4)
f.1 Demonstrate professionally responsibility at all times.
Fails to demonstrate responsibility for his actions and does not deal with others professionally
Shows some sense of responsibility for his actions but needs improvement in dealing with others professionally
Takes full responsibility for his actions and deals with others professionally
Demonstrates high moral and professional ethics, takes complete responsibility for his actions and is excellent in interacting and dealing with others
Outcome d: An ability to function on multidisciplinary teams.
Criteria None (1) Low (2) Moderate (3) High (4)
d.1 Develop a work plan and distribute tasks
Fails to develop a work plan and tasks are assigned ad hoc
Develops a work plan without much thought and tasks distribution is not balanced
Develops a good work plan and distributes tasks in a balanced way
Develops a realistic and well thought out work plan and distributes tasks in a balanced way and according to the skills and expertise of the team members
d.2 Take responsibility in team efforts to complete the assigned tasks.
Does not perform assigned tasks; often misses meetings and, when present, does not have anything constructive to say; relies on others to do the work;
Performs assigned tasks but needs many reminders; attends meetings regularly but generally does not say anything constructive; sometimes expects others to do his/her work;
Performs all assigned tasks; attends meetings regularly and usually participates effectively; generally reliable;
Performs all tasks very effectively; attends all meetings and participates enthusiastically; very reliable.
d.3 Show respect to other team members.
Often argues with team mates; doesn't let anyone else talk; occasional personal attacks and "put-downs"; wants to have things done his way and does not listen to alternate approaches;
Usually does much of the talking; does not pay much attention when others talk, and often assumes their ideas will not work; no personal attacks and put-downs but sometimes patronizing; when others get through to him, works reasonably well with them;
Generally listens to others' points of view; always uses appropriate and respectful language; tries to make a definite effort to understand others' ideas;
Always listens to others and their ideas; helps them develop their ideas while giving them full credit; always helps the team reach a fair decision.
Indicate the extent to which you agree with the above statement, using a scale of 1-4 (1=None; 2=Low; 3=Moderate; 4=High)
# Name Criteria (d1) Criteria (d2) Criteria (d3) Criteria (f1) 1 Ali Ben Obaid 4 4 4 4 2 Salem Al Salem 4 4 4 4 3 Hussain Al Mubarak 4 4 4 4 4 Mohammed Al Nemer 4 4 4 4
Comments on individual members
Name Comments
Ali Ben Obaid No comments
Salem Al Salem No comments
Hussain Al Mubarak No comments
Mohammed Al Nemer No comments

61
SDP – WEEKLY MEETING REPORT
Department of Mechanical Engineering Prince Mohammad bin Fahd University
Team#6 SEMESTER: ACADEMIC YEAR:
FALL 2016-2017 Date: December 1st , 2016
PROJECT TITLE Design & Construction of a Pilot-Scale Cooling Tower
SUPERVISORS Dr. Esam Jassim
Member Name Present/Absent Arriving on time
Ali Ben Obaid 201100293 present yes Salem Al Salem 201100294 present yes Hussain Al Mubarak 200901660 present yes Mohammed Al Nemer 201100192 present yes
Task progress report for the last week effort:
# Task description Team member
assigned
Progress
0%-100% Delivery proof
1 Presentation delivery All members 100% PPT attached
2 Completing report proof reading Ali 100% Report attached 3 Fan purchasing Mohammad 100% ----------
4 Purchasing instruments Salem 100% Photos attached
5 Pump’s installing Husain 100% Report attached
Task allocation for the next week:
# Task description Team member
assigned
1. Start writing the next chapter All members
2. Assembling the project All members
3. Programing the sensors and instrumentation Salem Al Salem
4. Leakage test Ali A Ben Obaid
5. Meet Dr. Esam on Tuesday to discuss our progress All members
6. Apply the thermal insulation on the tower Mohammed Al Nemer
7. Complete the solidworks drawing as per Dr. Nader’s recommendations
Husain Al Mubarak
8. Gather together on Saturday to have a first attempt of the experiment
All members
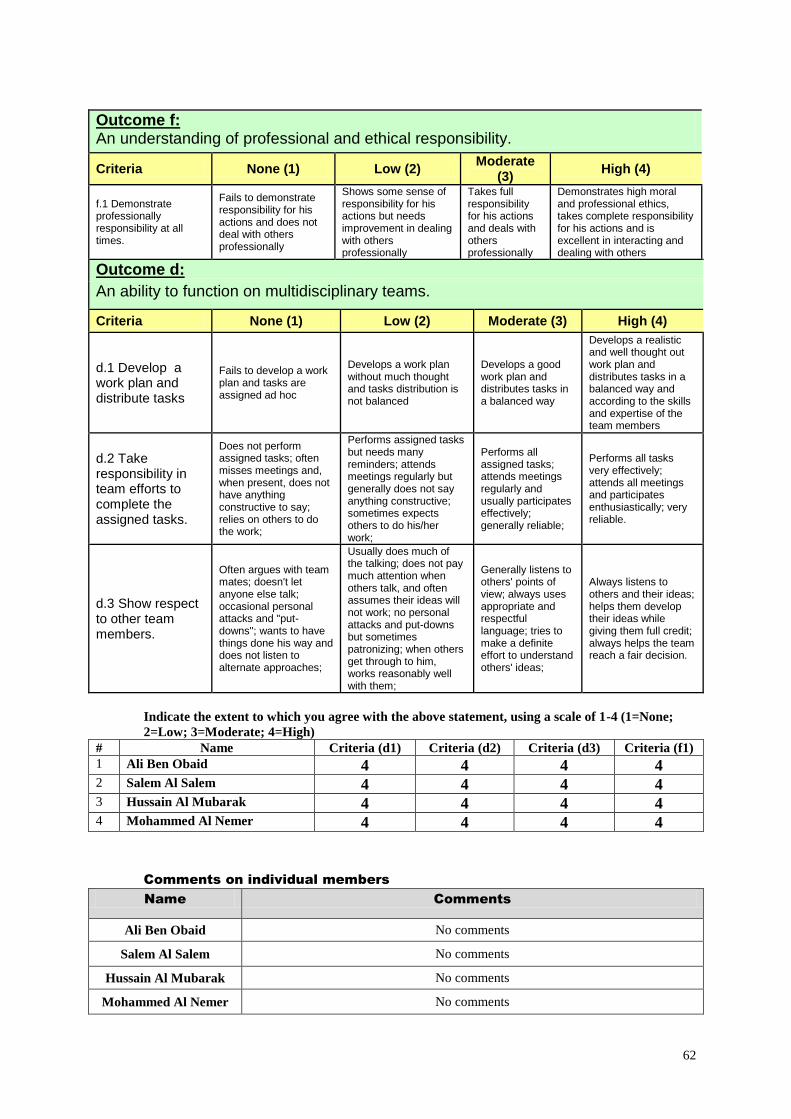
62
Outcome f: An understanding of professional and ethical responsibility.
Criteria None (1) Low (2) Moderate (3) High (4)
f.1 Demonstrate professionally responsibility at all times.
Fails to demonstrate responsibility for his actions and does not deal with others professionally
Shows some sense of responsibility for his actions but needs improvement in dealing with others professionally
Takes full responsibility for his actions and deals with others professionally
Demonstrates high moral and professional ethics, takes complete responsibility for his actions and is excellent in interacting and dealing with others
Outcome d: An ability to function on multidisciplinary teams.
Criteria None (1) Low (2) Moderate (3) High (4)
d.1 Develop a work plan and distribute tasks
Fails to develop a work plan and tasks are assigned ad hoc
Develops a work plan without much thought and tasks distribution is not balanced
Develops a good work plan and distributes tasks in a balanced way
Develops a realistic and well thought out work plan and distributes tasks in a balanced way and according to the skills and expertise of the team members
d.2 Take responsibility in team efforts to complete the assigned tasks.
Does not perform assigned tasks; often misses meetings and, when present, does not have anything constructive to say; relies on others to do the work;
Performs assigned tasks but needs many reminders; attends meetings regularly but generally does not say anything constructive; sometimes expects others to do his/her work;
Performs all assigned tasks; attends meetings regularly and usually participates effectively; generally reliable;
Performs all tasks very effectively; attends all meetings and participates enthusiastically; very reliable.
d.3 Show respect to other team members.
Often argues with team mates; doesn't let anyone else talk; occasional personal attacks and "put-downs"; wants to have things done his way and does not listen to alternate approaches;
Usually does much of the talking; does not pay much attention when others talk, and often assumes their ideas will not work; no personal attacks and put-downs but sometimes patronizing; when others get through to him, works reasonably well with them;
Generally listens to others' points of view; always uses appropriate and respectful language; tries to make a definite effort to understand others' ideas;
Always listens to others and their ideas; helps them develop their ideas while giving them full credit; always helps the team reach a fair decision.
Indicate the extent to which you agree with the above statement, using a scale of 1-4 (1=None; 2=Low; 3=Moderate; 4=High)
# Name Criteria (d1) Criteria (d2) Criteria (d3) Criteria (f1) 1 Ali Ben Obaid 4 4 4 4 2 Salem Al Salem 4 4 4 4 3 Hussain Al Mubarak 4 4 4 4 4 Mohammed Al Nemer 4 4 4 4
Comments on individual members
Name Comments
Ali Ben Obaid No comments
Salem Al Salem No comments
Hussain Al Mubarak No comments
Mohammed Al Nemer No comments
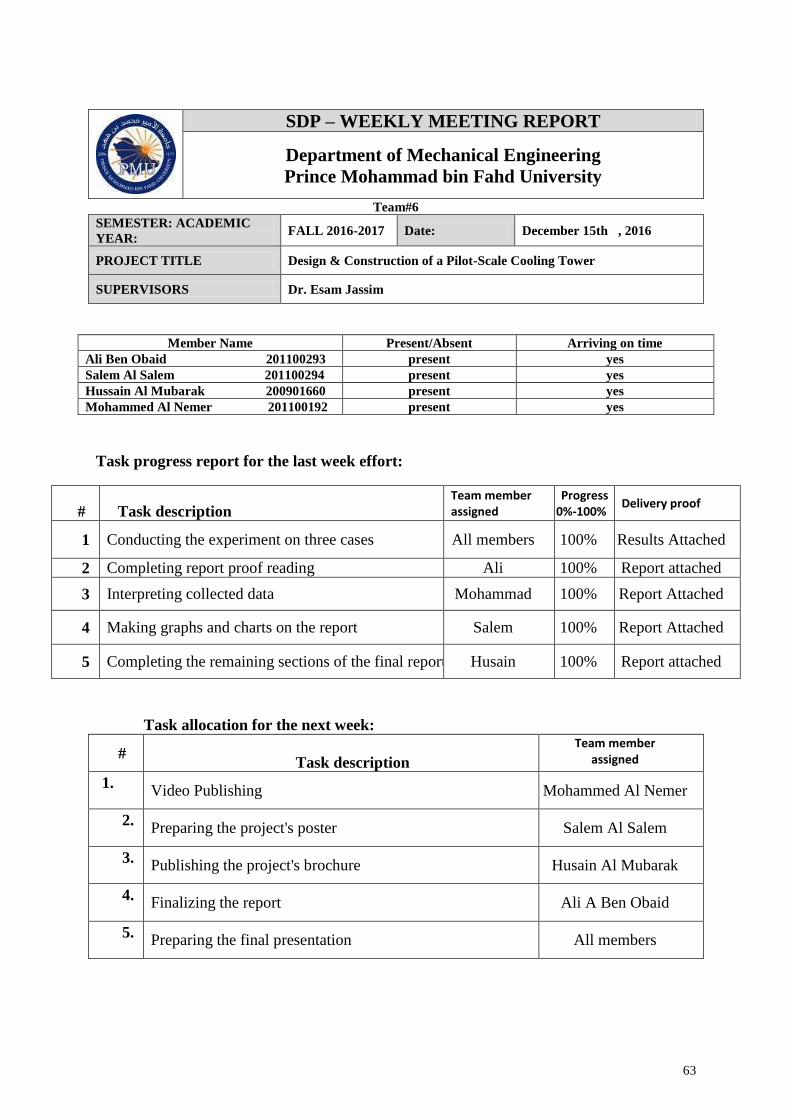
63
SDP – WEEKLY MEETING REPORT
Department of Mechanical Engineering Prince Mohammad bin Fahd University
Team#6 SEMESTER: ACADEMIC YEAR:
FALL 2016-2017 Date: December 15th , 2016
PROJECT TITLE Design & Construction of a Pilot-Scale Cooling Tower
SUPERVISORS Dr. Esam Jassim
Member Name Present/Absent Arriving on time Ali Ben Obaid 201100293 present yes Salem Al Salem 201100294 present yes Hussain Al Mubarak 200901660 present yes Mohammed Al Nemer 201100192 present yes
Task progress report for the last week effort:
# Task description Team member
assigned
Progress
0%-100% Delivery proof
1 Conducting the experiment on three cases All members 100% Results Attached
2 Completing report proof reading Ali 100% Report attached
3 Interpreting collected data Mohammad 100% Report Attached
4 Making graphs and charts on the report Salem 100% Report Attached
5 Completing the remaining sections of the final report Husain 100% Report attached
Task allocation for the next week:
# Task description
Team member
assigned
1. Video Publishing Mohammed Al Nemer
2. Preparing the project's poster Salem Al Salem
3. Publishing the project's brochure Husain Al Mubarak
4. Finalizing the report Ali A Ben Obaid
5. Preparing the final presentation All members

64
Outcome f: An understanding of professional and ethical responsibility.
Criteria None (1) Low (2) Moderate (3) High (4)
f.1 Demonstrate professionally responsibility at all times.
Fails to demonstrate responsibility for his actions and does not deal with others professionally
Shows some sense of responsibility for his actions but needs improvement in dealing with others professionally
Takes full responsibility for his actions and deals with others professionally
Demonstrates high moral and professional ethics, takes complete responsibility for his actions and is excellent in interacting and dealing with others
Outcome d: An ability to function on multidisciplinary teams.
Criteria None (1) Low (2) Moderate (3) High (4)
d.1 Develop a work plan and distribute tasks
Fails to develop a work plan and tasks are assigned ad hoc
Develops a work plan without much thought and tasks distribution is not balanced
Develops a good work plan and distributes tasks in a balanced way
Develops a realistic and well thought out work plan and distributes tasks in a balanced way and according to the skills and expertise of the team members
d.2 Take responsibility in team efforts to complete the assigned tasks.
Does not perform assigned tasks; often misses meetings and, when present, does not have anything constructive to say; relies on others to do the work;
Performs assigned tasks but needs many reminders; attends meetings regularly but generally does not say anything constructive; sometimes expects others to do his/her work;
Performs all assigned tasks; attends meetings regularly and usually participates effectively; generally reliable;
Performs all tasks very effectively; attends all meetings and participates enthusiastically; very reliable.
d.3 Show respect to other team members.
Often argues with team mates; doesn't let anyone else talk; occasional personal attacks and "put-downs"; wants to have things done his way and does not listen to alternate approaches;
Usually does much of the talking; does not pay much attention when others talk, and often assumes their ideas will not work; no personal attacks and put-downs but sometimes patronizing; when others get through to him, works reasonably well with them;
Generally listens to others' points of view; always uses appropriate and respectful language; tries to make a definite effort to understand others' ideas;
Always listens to others and their ideas; helps them develop their ideas while giving them full credit; always helps the team reach a fair decision.
Indicate the extent to which you agree with the above statement, using a scale of 1-4 (1=None; 2=Low; 3=Moderate; 4=High)
# Name Criteria (d1) Criteria (d2) Criteria (d3) Criteria (f1) 1 Ali Ben Obaid 4 4 4 4 2 Salem Al Salem 4 4 4 4 3 Hussain Al Mubarak 4 4 4 4 4 Mohammed Al Nemer 4 4 4 4
Comments on individual members
Name Comments
Ali Ben Obaid No comments
Salem Al Salem No comments
Hussain Al Mubarak No comments
Mohammed Al Nemer No comments

65
Bill of Materials
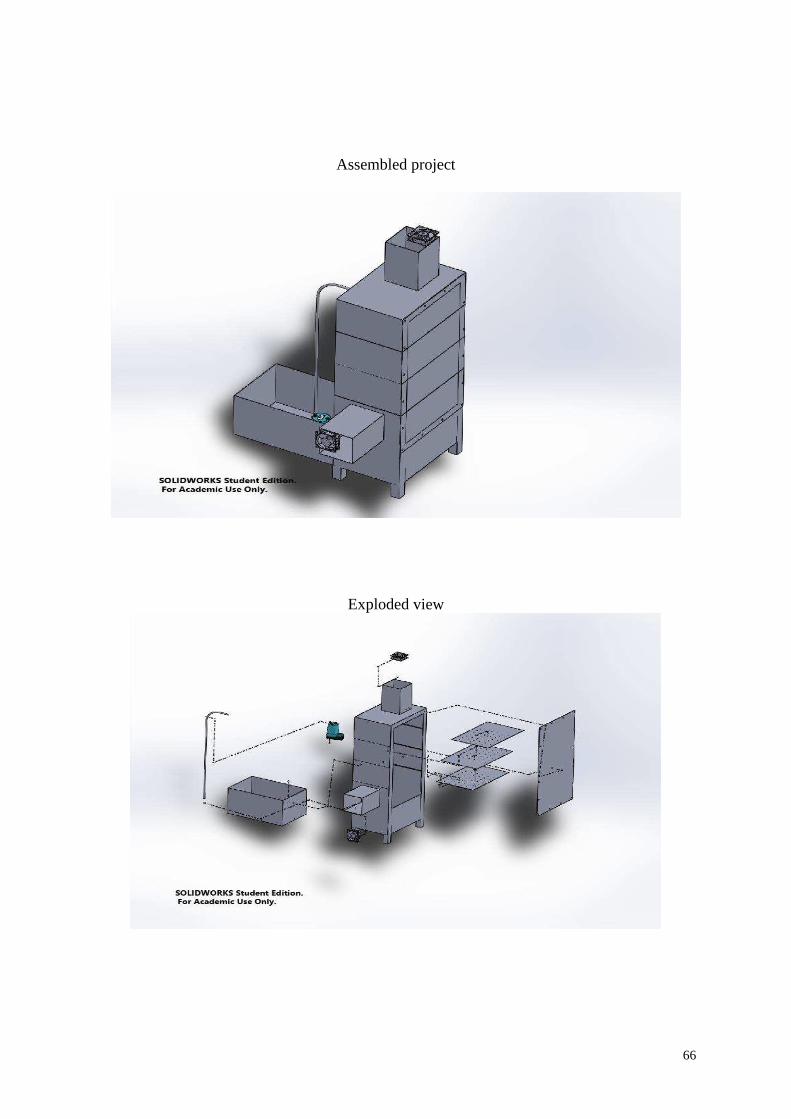
66
Assembled project
Exploded view
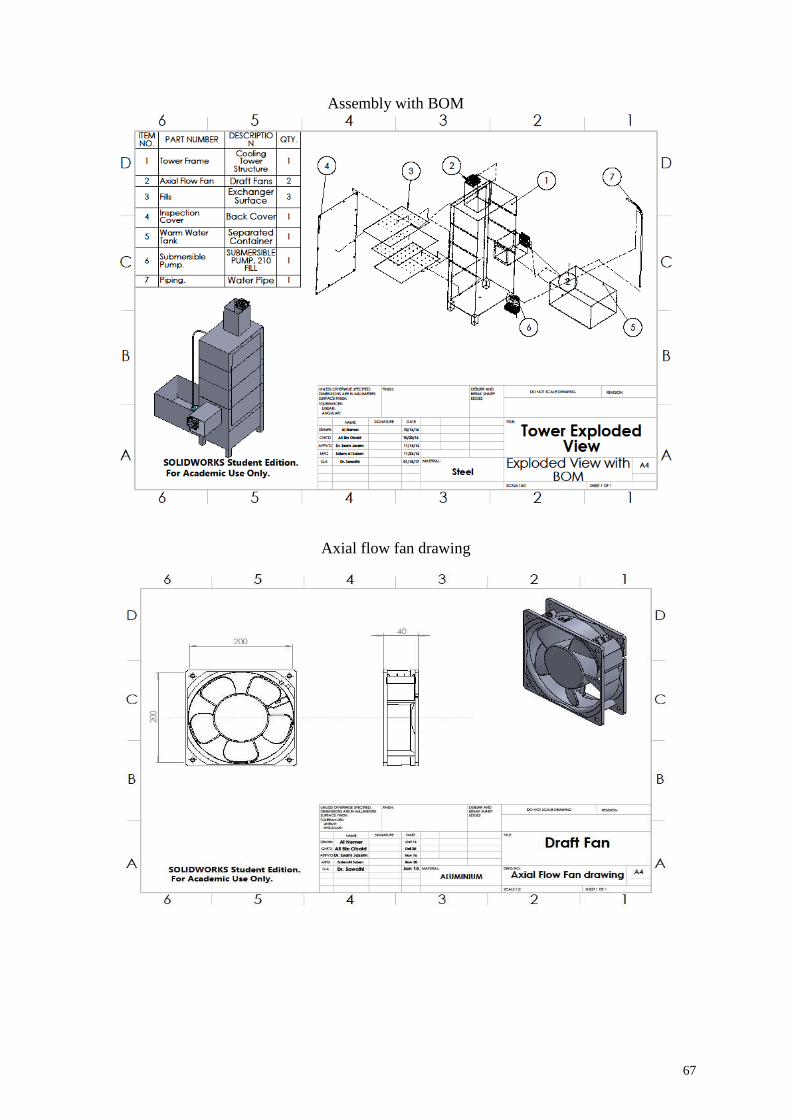
67
Assembly with BOM
Axial flow fan drawing
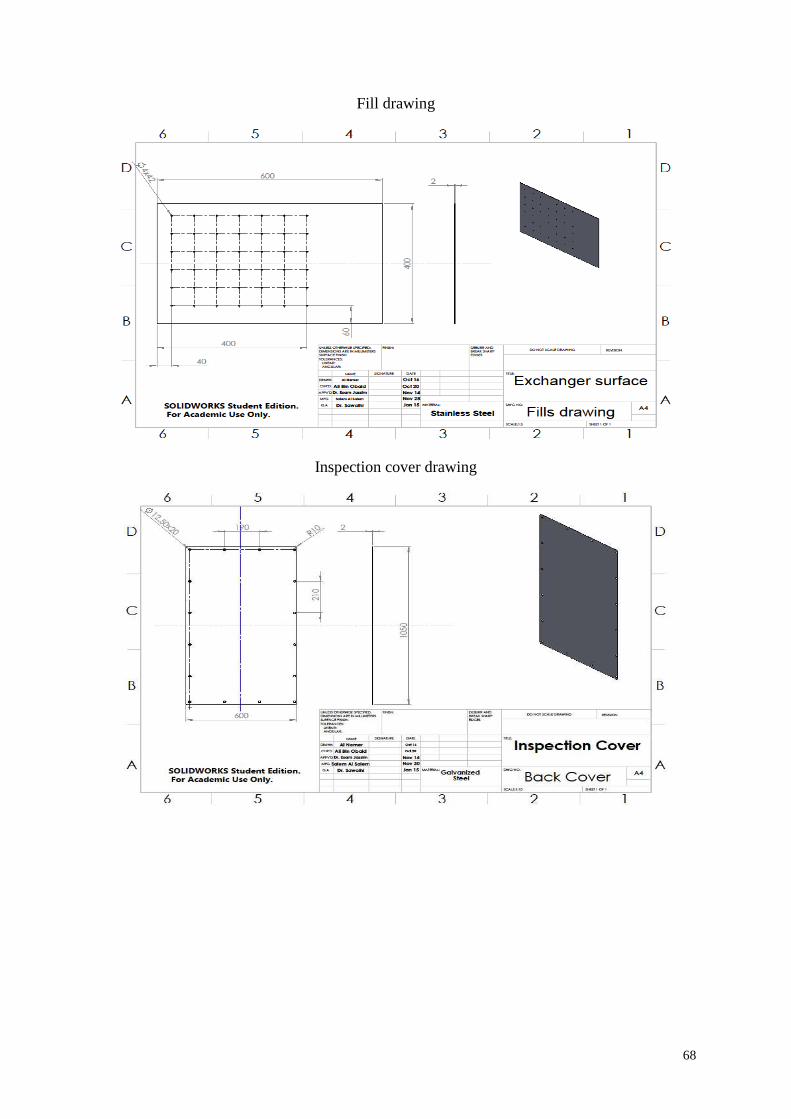
68
Fill drawing
Inspection cover drawing

69
Piping drawing
Submersible pump
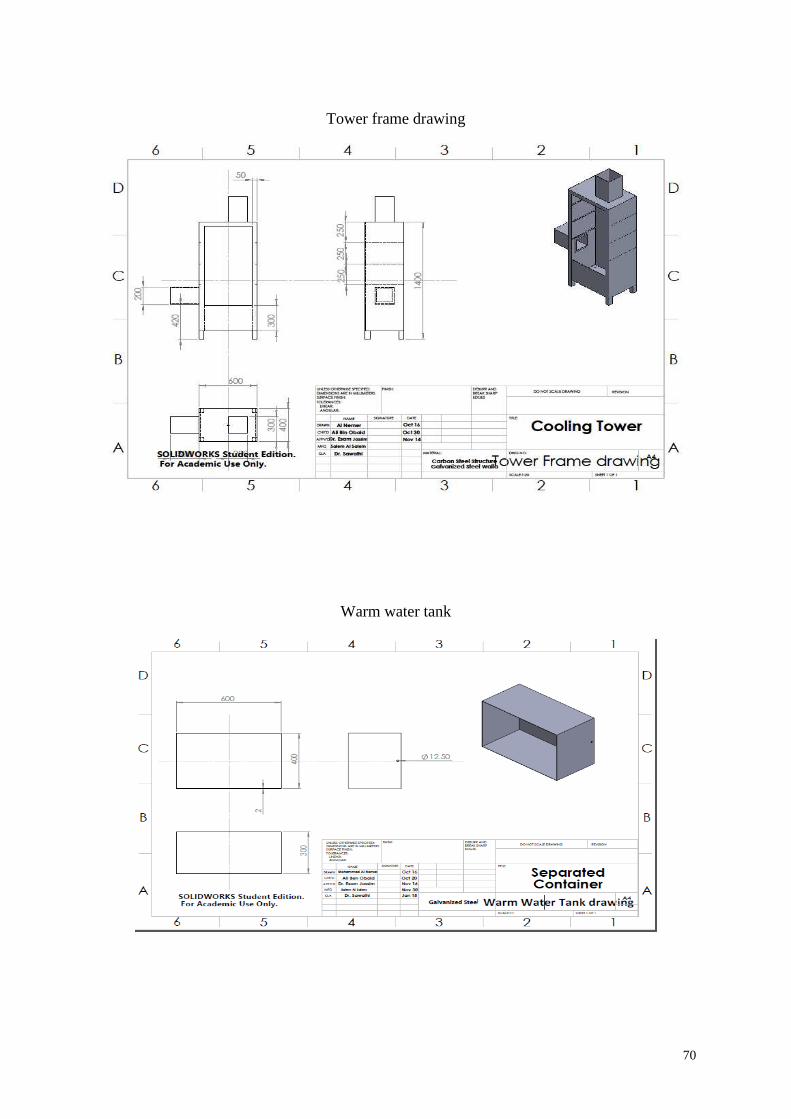
70
Tower frame drawing
Warm water tank

71
Operation Manual

72
To safely and properly operate the system, follow the below steps:
Fill in the separated tank with warm water (40-45 C) to a volume of 60L.
Plug in the electrical power wire to a power source of 220V.
Measure the warm water temperature and record.
Turn on the pump and observe the water flowing properly.
Measure and record the ambient air temperature.
Turn on the required fan either induced or forced draft.
*Note: forced draft fan is 110V power supply voltage.
Observe the system for any abnormalities.
Do your calculations (if any).
Make sure that cooled water outlet valve is open to drain the collection basin and
maintain proper flow throughout the tower.
Batteries of water sensors to be replaced with 1.5V once damaged or malfunctioned

���������ABC�D�EF�A
���������ABCDAE�FA����A������
���������AD
E�FA����A�������
E�FA����A����
�����������ABC�
DE�F���F�����������������������������
��DD�����
�E���������F�F������A�������DD��D��
�E��������F�������������������������
��DD�����
�E� BB����F�F��� �A�!����������
E�����A�A
������������A� A�A
!����"�����A�������A
#����A
���������ABC�D�EF�A
� "�#A�� $#���� %A�&�$#'B��&�$#�(�B� ��$!)A� ���*�+�#�A�# A��,�(��-� .�A!�%������������� .�A!�%�A/�A���� ,�B �#B�*�F���0B�B� 1��$� B���� 1������)�B
$�������

���������ABC�D�EF�A
%����������A
� ���" �����CA�����
� �����������CA� ������
� &����'��A��A�������
� %�������A��A���CA����A����� ��
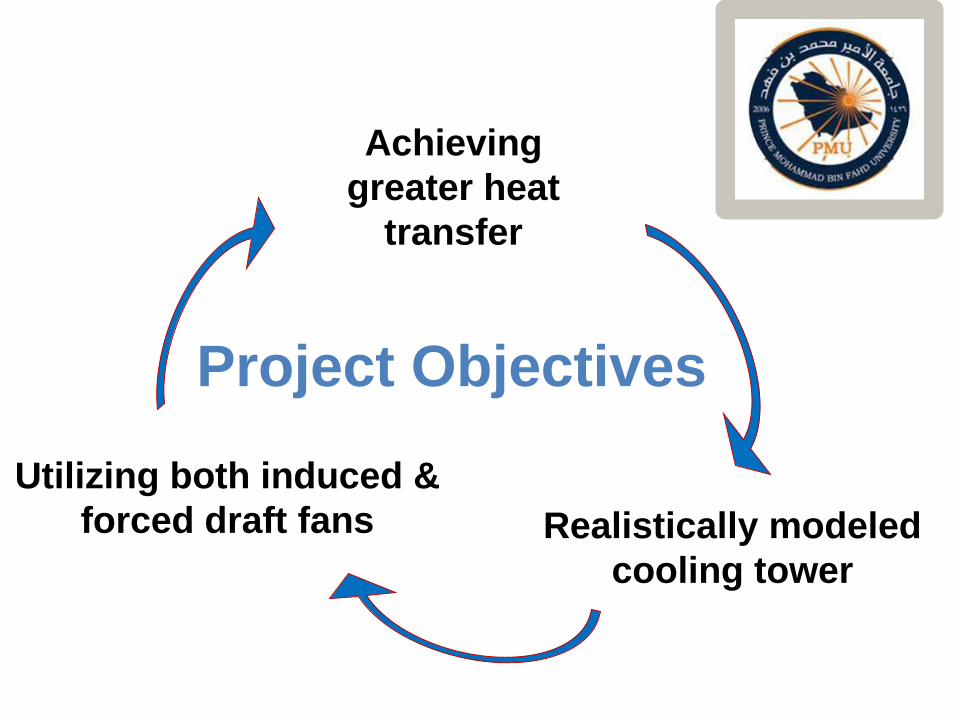
���������ABC�D�EF�A
(����)���A'���A�����A�
����A�� �A ���
*��������A
�������A����A
����� ��
+�����������CA�����A
�������A�����
!��,���A$',�������
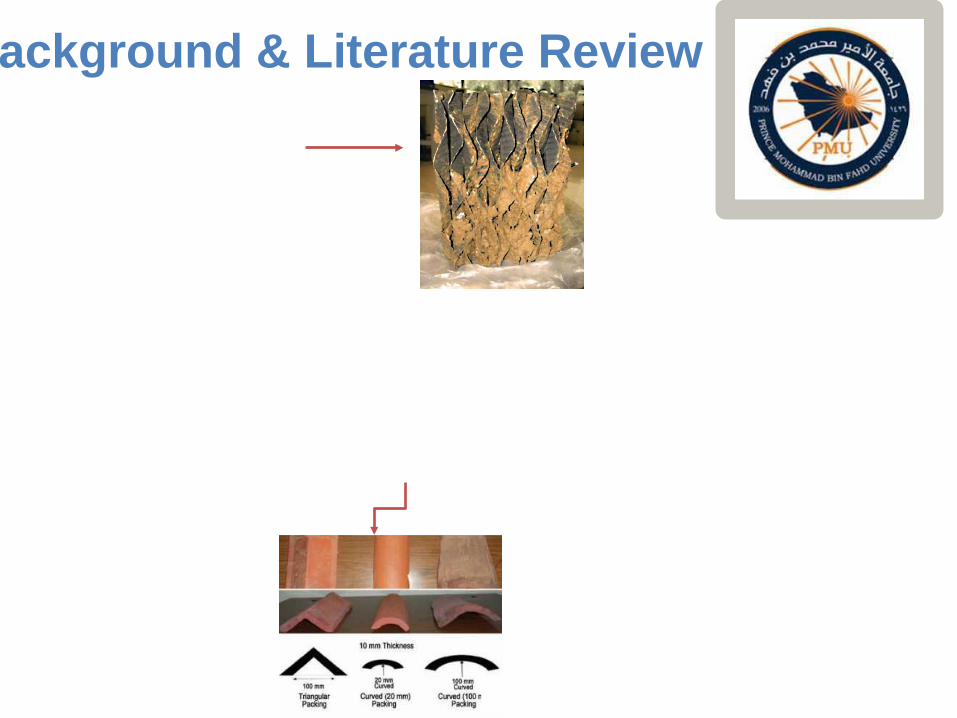
���������ABC�D�EF�A
B��-�����A�A.���������A+�����
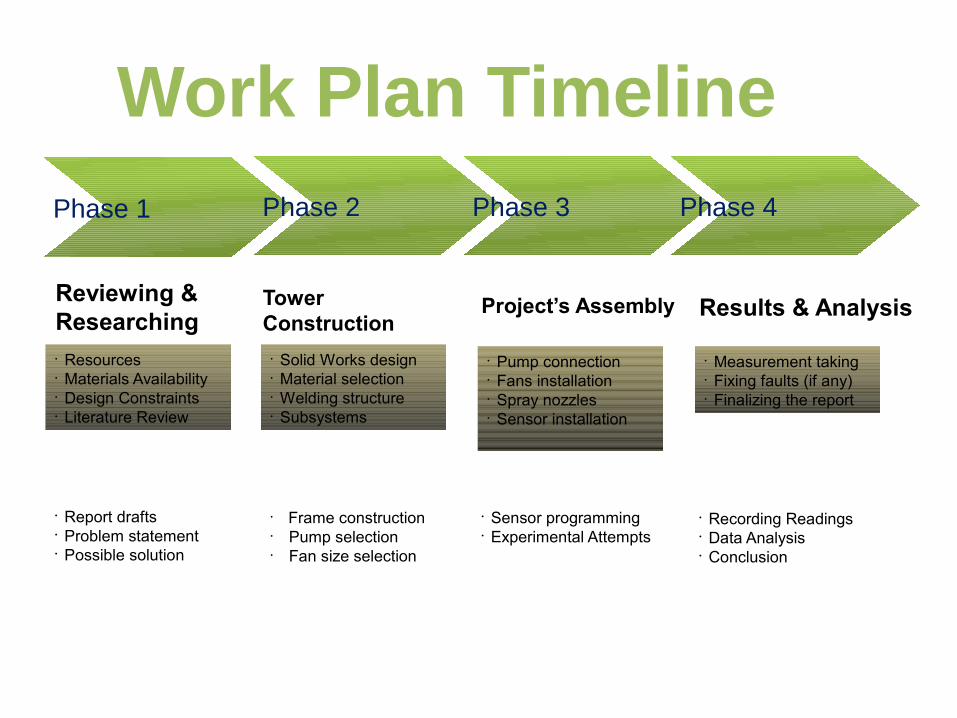
���������ABC�D�EF�A
%��B��D %��B��� %��B��� %��B���
�����������
��A�BCDE���F���C�
���A�C�D������C���D��A��AA�����
� ���������� AB��CAD�EF�ACDA�CDCB�� ���C��E����B�AC�B�� �CB��AB���E���C��
� ��DC�E�����E���C��� AB��CADE��D��BC��� ��D�C��E�B���B���� ������B���
� ����E������BC��� A��EC��BADDABC��� ���A�E��!!D��� ������EC��BADDABC��
� �A�������BEBA�C��� C"C��E#A�DB�E$C#EA��%� C�ADC!C��EB&�E�����B
� �����BE��A#B�� ����D��E�BAB����B� ����C�D�E��D�BC��
� �A��E����B���BC��� EE����E��D��BC��� EE A�E�C!�E��D��BC��
� ������E�����A��C��� '"���C���BADEFBB���B�
� ������C��E��A�C���� �ABAEF�AD��C�� ����D��C��
/��-A!���A#�������
��A���A����B��A�A
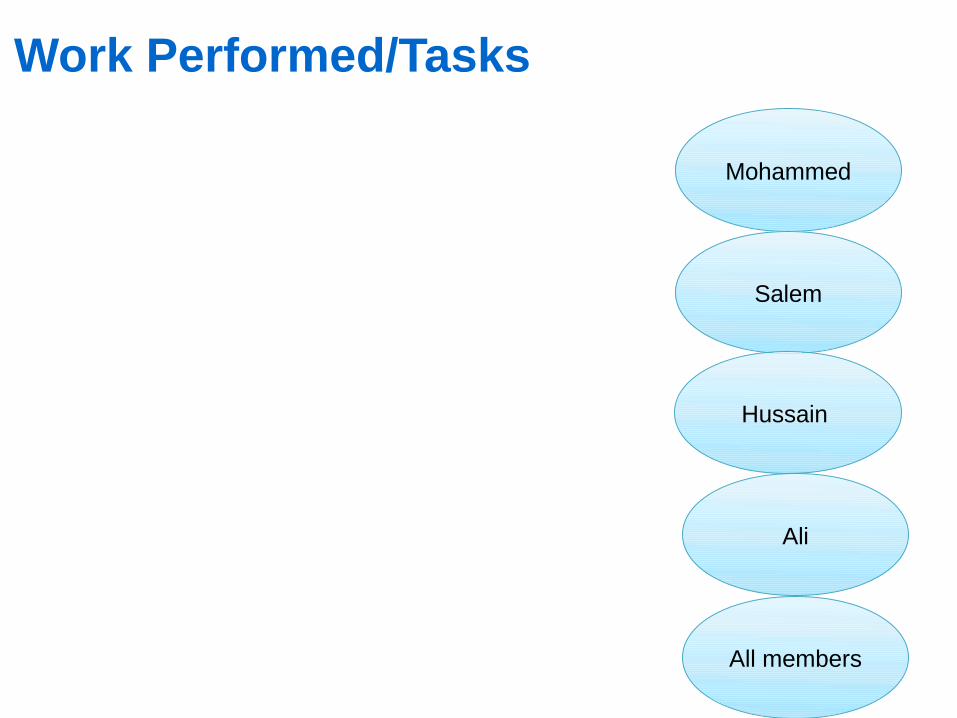
���������ABC�D�EF�A
/��-A!�� ����0#��-�A
2
��������
�����
F�������AB
F��
� BB����
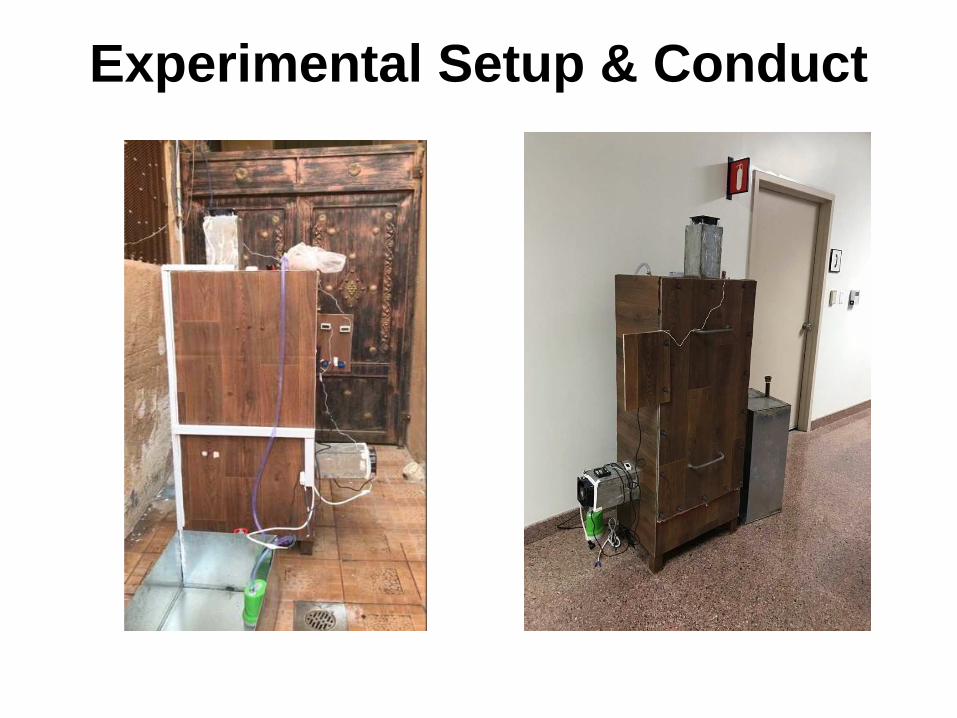
���������ABC�D�EF�A
������������A�����A�A������A

���������ABC�D�EF�A
����������A#������

���������ABC�D�EF�A
+������A�A*���C���
E�+������B�#�����//�A��$���#-����1.������.
E*���������B�#�����//�A��$���#-����-�#� ��#��3�A�# A������1.
E� ������C��B�,��)��4�5,��)��6�F33A��$�7��
E�����������A+���A8��2���9:;,;D29;�1�-��A��,��B�A��)������1��B�
-�#�A�/��-�A�#�
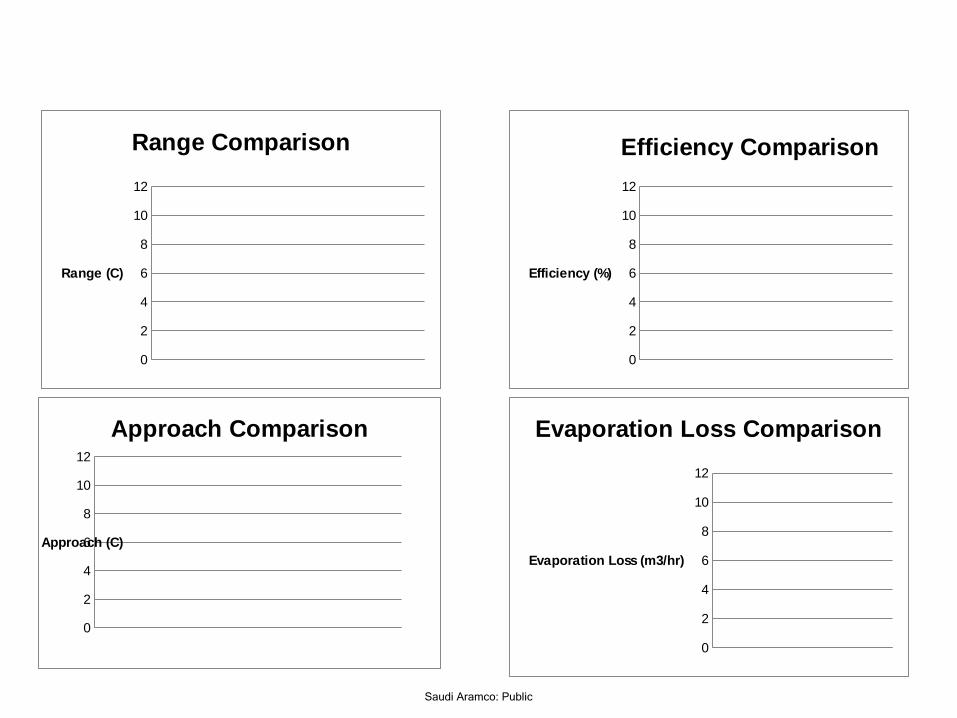
���������ABC�D�EF�A
�
�
�
�
9
D�
D�
+����A����������
+����A1�2
�
�
�
�
9
D�
D�
� ������CA����������
� ������CA132
�
�
�
�
9
D�
D�
*�������A����������
*�������A1�2
�
�
�
�
9
D�
D�
�����������A.���A����������
�����������A.���A1�40��2
��������AE���

���������ABC�D�EF�A
1��$� B����
"5��)��A��CA�����A ���A�������A
"(����A'���A ���A�������A��A��������A������
"���������A�����A ����A��A� ������
"6��CA'��� ���
���������ABC�D�EF�A
+�������������
6�������A���A����A�����A�����������
%�������A���A ���A�����
�����CA������CA������
(��A������A���A ���A����

���������ABC�D�EF�A
D2 ��#�A��������$#���
�2 +��!<
�2 ���������)����#�
�2 = ))���)�/A���-�A!�#�� ��(�AB�#0�#��
����
����������

���������ABC�D�EF�A
�������A����-�A��A6�A&�����C