Embed Size (px)
Citation preview

Design Group Meeting
• Full National Water Quality Monitoring Council
• Overview Presented yesterday
• Extended context to bring to today’s discussions
• Next steps

Yesterday’sOverview of Progress

Design Workgroup• Jeffrey L. Armstrong Orange County Sanitation
Distric• Tyler Baker TVA• Jerad Bales USGS• David Bayne Auburn University• Joe Boyer Florida International University• Charles Dvorsky Texas • Don Dycus Tennessee Valley Authority• Art Garceau Indiana• George Harman Maryland• Mike Hemsley Ocean.US• Steven R. Johnston Galveston Bay Estuary Program• Steve Jordan EPA• Ron Klein Alaska • Chris Knopp U.S. Forest Service

Design Workgroup
• Alfred Korndoerfer, Jr. New Jersey• Gail Mallard FED-U.S. Geological Survey• Thomas C. Malone IOOS• Dan McKenzie EPA• Brian D. Melzian, Ph.D. EPA• Tony Olsen EPA• Steven G. Paulsen, Ph.D. EPA• Robert P. Schreiber ASCE• Gene Lynn Sisk Alabama• GeneTurner & Eric Swenson Louisiana State University• Robert Ward Colorado State University• Dave Whitall, Ph.D. NOAA

Issues From Chapter 15
• Oxygen depletion• Nutrient enrichment• Toxic contamination• Sedimentation• Harmful algal blooms• Habitat degradation• Invasions by exotic
species
• Status of coastal habitats
• Sources and quantities of marine debris
• Coral communities
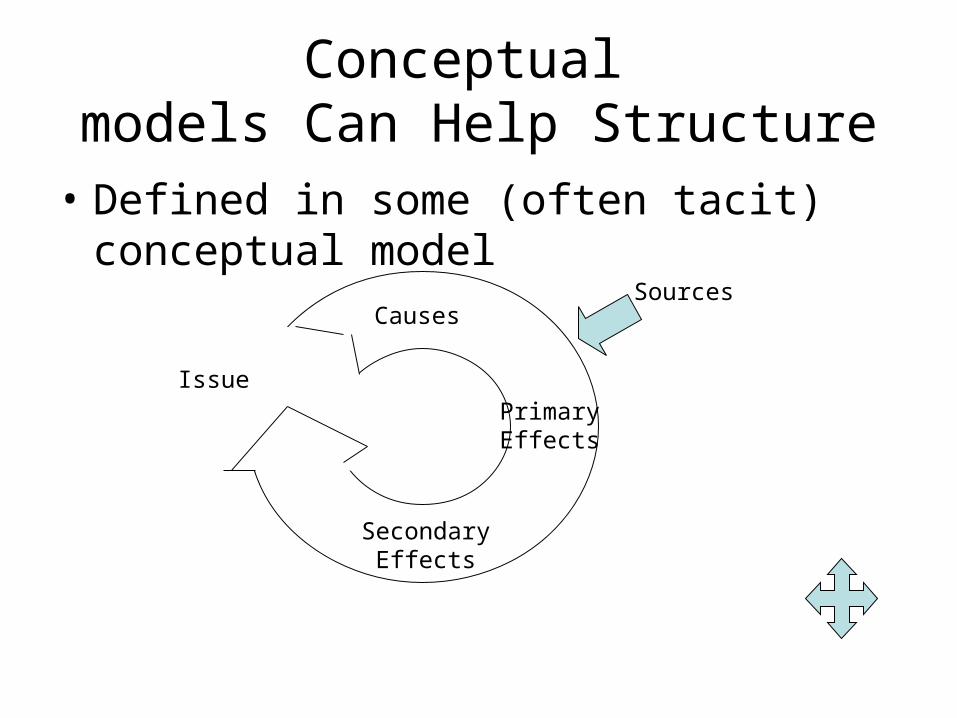
Conceptual models Can Help Structure
• Defined in some (often tacit) conceptual model
SourcesCauses
Primary Effects
Secondary Effects
Issue

Exclusive Economic Zones

National Estuary Programs

NERR: small blue in Delaware Bay

NCA Estuary and Marine

NPS: Assateague Island (pink)

HUC Regions

HUC Subregions (4-digit): coastal
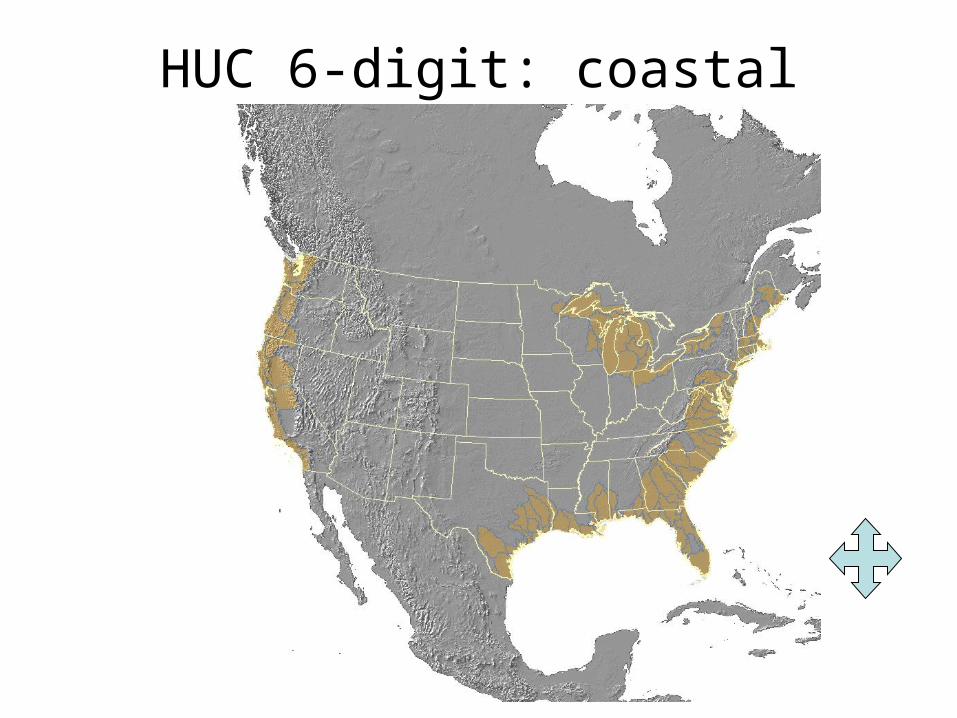
HUC 6-digit: coastal

HUC 8-digit: Gulf Coast

HUC 8-digit: rivers in one

Swenson Matrix Coverage
• Exclusive Economic Zone• Estuaries• Ocean- State & Territorial• Rivers
– Level 1– Level 2– Level 3– Level 4
• S. Jordan’s Parameter List

NATIONAL MONITORING NETWORK DESIGN MATRIX E. M. Swenson 4/8/2005
Resource Parameter Frequency Spatial DensityVertical
resolution Comments
Estuaries
Water temp. Continuous Define longitudinal and transverse gradients
Surface, mid-depth, bottom. May only need short term checks for vertical startification then change to single depth if possible
Fixed buoys or platfroms. Spatial gradients measured using monthly discrete data at dense sampling grid compared to fixed stations which define the backbone gradient
Salinity Continuous Define longitudinal and transverse gradients
Surface, mid-depth, bottom. May only need short term checks for vertical startification then change to single depth if possible
Fixed buoys or platfroms. Spatial gradients measured using monthly discrete data at dense sampling grid compared to fixed stations which define the backbone gradient
DO Continuous with probe? There are calibratuion issues
Define longitudinal and transverse gradients
Surface, mid-depth, bottom. May only need short term checks for vertical startification then change to single depth if possible
Fixed buoys or platfroms. Spatial gradients measured using monthly discrete data at dense sampling grid compared to fixed stations which define the backbone gradient
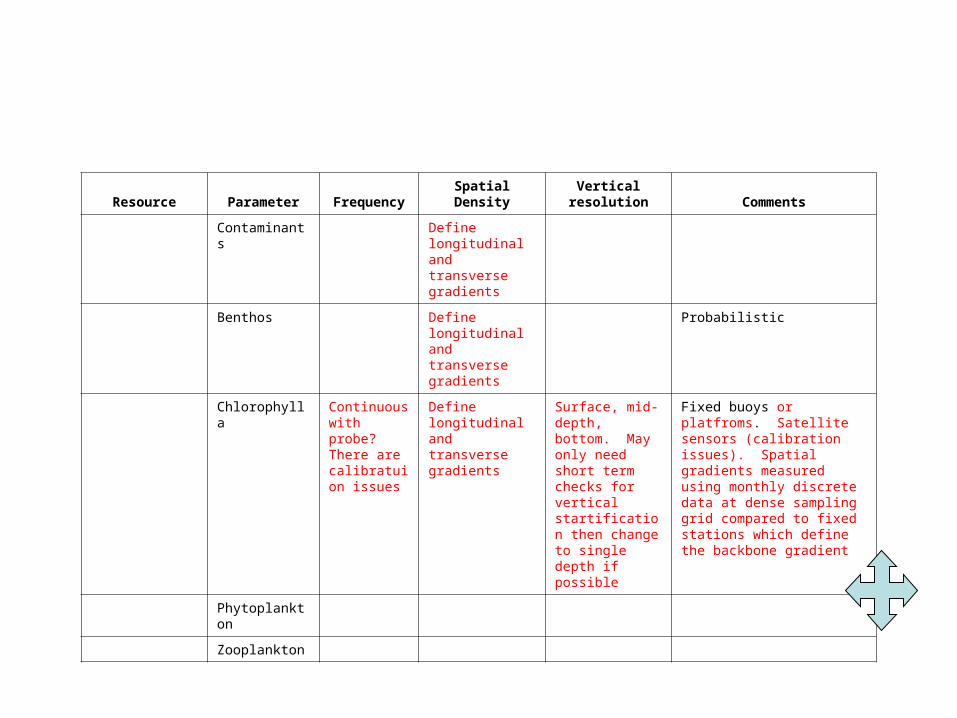
Resource Parameter Frequency Spatial DensityVertical
resolution Comments
Contaminants Define longitudinal and transverse gradients
Benthos Define longitudinal and transverse gradients
Probabilistic
Chlorophyll a Continuous with probe? There are calibratuion issues
Define longitudinal and transverse gradients
Surface, mid-depth, bottom. May only need short term checks for vertical startification then change to single depth if possible
Fixed buoys or platfroms. Satellite sensors (calibration issues). Spatial gradients measured using monthly discrete data at dense sampling grid compared to fixed stations which define the backbone gradient
Phytoplankton
Zooplankton

Resource Parameter Frequency Spatial DensityVertical
resolution Comments
Shellfish Target harvest areas
Fish community
Pathogens Recreational areas
Invasive species
Currents Continuous Define longitudinal and transverse gradients, major flow routes
Upward looking ADCP or side looking ADCP in channels
Fixed buoys or platfroms.
Water level Continuous Fixed buoys or platforms.
Met station, winds, precipitation, pressure, PAR
Continuous Fill in gaps in existing networks. Provide better data for model boundary conditions
Fixed buoys or platfroms.

Conclusion
We have
• Large, diverse group
• Concurrence on objectives
• Stuctures are evolving– Swenson Matrix– Parameter list– GIS coverages

Extended Council Context for the NMN Design
• Management Questions• Objectives• Environments• Resources of Primary Concern• Stressors affecting resources• Core Indicators List• Specific locations for measurement of
core indicators
Management Questions1. What is the condition of the Nation’s surface, ground, estuarine, and
coastal waters?
2. Where, how, and why are water-quality conditions changing over time?
3. Where are the problems related to water quality? What is causing the problems?
4. Are programs to prevent or remediate problems working effectively?
5. Are water-quality goals and standards being met?
6. What research activities are needed to support these important resources?

Objectives of the National Monitoring Network
1. Define status and trends of key water quality parameters and conditions on a nationwide basis.
2. Provide data relevant to determining whether goals, standards, and resource management objectives are being met, thus contributing to sustainable and beneficial use of coastal and inland water resources.
3. Provide data to identify and rank existing and emerging problems to help target more intensive monitoring, preventive actions, or remediation.
4. Provide data to support and define coastal oceanographic and hydrologic research, including influences of freshwater inflows.
5. Provide quality-assured data for use in the preparation of interpretive reports and educational materials.

The Five Environments
(Recognition that we cannot measure the entire resource)
• Major river systems and major tributaries of those primary drainages (HUC 8?)
• Estuaries
• Outlets of major estuaries and bays
• Near-shore coastal zone
• Regional aquifers

Resources of Primary Concern
• Aquatic life in each of the components we have identified
• Human use of water (recognize that a national monitoring network will not address drinking water at the tap)

Stressors Affecting Resources
• Oxygen depletion
• Nutrient enrichment
• Toxic contamination
• Sedimentation
• Harmful algal blooms
• Habitat degradation
• Invasions by exotic species

Core Indicator List
Indicators appropriate to each of the:
• resources,
• waterbody types,
• objectives, and
• management questions

Continuing Coordination
1. Inventory Workgroup needs to confirm your approach to plan its work
2. Methods and Comparability is now established, and seeks liaison

Next Steps
1. Discuss and link Management questions to the reporting envisioned in the 5 objectives
2. Focusing on indicators for:– Resources of Primary Concern– The Five Environments– The Stressors Affecting Resources

More Next Steps
3. Summarize progress for the May 12th SWAQ progress report
4. Prepare for the July Council Meeting