Embed Size (px)
Citation preview

aE N
Design guide
GE Plastics
release 05//1997

C o n t e n t s
1 Genera l In t roduct i on
1 Des i gn Deve l opm ent . . . . . . . . . . . . . . . 9
1.1 Introduction . . . . . . . . . . . . . . . . . . . . . . . . . . . . . . . . . . 9
1.2 Material design factors . . . . . . . . . . . . . . . . . . . . . . . 9
1.3 Development steps . . . . . . . . . . . . . . . . . . . . . . . . . . . 9
1.3.1 End-use requirements . . . . . . . . . . . . . . . . . . . . . . 9
1.3.2 Preliminary design . . . . . . . . . . . . . . . . . . . . . . . . . 10
1.3.3 Material selection . . . . . . . . . . . . . . . . . . . . . . . . . 10
1.3.4 Design modification . . . . . . . . . . . . . . . . . . . . . . . . 10
1.3.5 CAD/CAE . . . . . . . . . . . . . . . . . . . . . . . . . . . . . . . . . 10
1.3.5.1 Flow analysis . . . . . . . . . . . . . . . . . . . . . . . . . . . . 10
1.3.5.2 Stress analysis . . . . . . . . . . . . . . . . . . . . . . . . . . . 11
1.3.6 Prototyping and testing . . . . . . . . . . . . . . . . . . . . . 11
1.3.7 End-use testing . . . . . . . . . . . . . . . . . . . . . . . . . . . 11
2 Des i gn fo r s t i f fness . . . . . . . . . . . . . . . . 13
2.1 Introduction . . . . . . . . . . . . . . . . . . . . . . . . . . . . . . . . . . 13
2.2 How to determine stiffness . . . . . . . . . . . . . . . . . . . . 13
2.2.1 Material . . . . . . . . . . . . . . . . . . . . . . . . . . . . . . . . . 13
2.2.2 Geometry & loading . . . . . . . . . . . . . . . . . . . . . . . . 14
2.2.3 Other factors influencing stiffness . . . . . . . . . . . . 14
2.2.4 Calculating the stiffness . . . . . . . . . . . . . . . . . . . . 15
2.2.5 Modal analysis . . . . . . . . . . . . . . . . . . . . . . . . . . . . 15
2.2.6 Safety factors . . . . . . . . . . . . . . . . . . . . . . . . . . . . . 15
2.3 Increasing part stiffness . . . . . . . . . . . . . . . . . . . . . . 15
2.3.1 Ribs . . . . . . . . . . . . . . . . . . . . . . . . . . . . . . . . . . . . . 15
2.3.2 V-grooves . . . . . . . . . . . . . . . . . . . . . . . . . . . . . . . . 15
2.3.3 Corrugation . . . . . . . . . . . . . . . . . . . . . . . . . . . . . . . 16
2.4 Optimization of stiffness . . . . . . . . . . . . . . . . . . . . . . 16
2.4.1 Optimization for part weight . . . . . . . . . . . . . . . . . 16
2.4.1.1 Material Selection . . . . . . . . . . . . . . . . . . . . . . . . 16
2.4.1.2 Geometric considerations . . . . . . . . . . . . . . . . . . 16
2.4.2 Optimization for stiffness to cost ratio . . . . . . . . . 16
3 Des i gn fo r s t rength . . . . . . . . . . . . . . . . 19
3.1 Introduction . . . . . . . . . . . . . . . . . . . . . . . . . . . . . . . . . . 19
3.2 Material Strength . . . . . . . . . . . . . . . . . . . . . . . . . . . . 19
3.2.1 Ultimate strength . . . . . . . . . . . . . . . . . . . . . . . . . . 20
3.2.2 Yield strength . . . . . . . . . . . . . . . . . . . . . . . . . . . . . 20
Design gu ide 1 Contents
3.2.3 Strain to failure . . . . . . . . . . . . . . . . . . . . . . . . . . . 20
3.2.4 Proportional limit . . . . . . . . . . . . . . . . . . . . . . . . . . 20
3.2.5 Material toughness . . . . . . . . . . . . . . . . . . . . . . . . 20
3.2.6 Other measures . . . . . . . . . . . . . . . . . . . . . . . . . . . 20
3.3 Effects of various factors on strenght . . . . . . . . . . . 20
3.3.1 Other factors . . . . . . . . . . . . . . . . . . . . . . . . . . . . . 20
3.4 Part Strength . . . . . . . . . . . . . . . . . . . . . . . . . . . . . . . . . 21
3.4.1 Ultimate part strength . . . . . . . . . . . . . . . . . . . . . . 21
3.4.2 Part yield strength . . . . . . . . . . . . . . . . . . . . . . . . . 22
3.4.3 Part toughness . . . . . . . . . . . . . . . . . . . . . . . . . . . . 22
3.5 Improving part strength . . . . . . . . . . . . . . . . . . . . . . . 22
3.5.1 Material choice . . . . . . . . . . . . . . . . . . . . . . . . . . . 22
3.5.2 Geometry optimization . . . . . . . . . . . . . . . . . . . . . . 23
3.6 Design considerations . . . . . . . . . . . . . . . . . . . . . . . . 23
4 Des i gn fo r behav i our over t ime . . 25
4.1 Introduction . . . . . . . . . . . . . . . . . . . . . . . . . . . . . . . . . . 25
4.2 Static time dependent phenomena . . . . . . . . . . . . . . 25
4.2.1 Creep . . . . . . . . . . . . . . . . . . . . . . . . . . . . . . . . . . . 25
4.2.1.1 Creep recovery . . . . . . . . . . . . . . . . . . . . . . . . . . . 26
4.2.1.2 Creep failure modes . . . . . . . . . . . . . . . . . . . . . . . 26
4.2.1.3 Apparent modulus . . . . . . . . . . . . . . . . . . . . . . . . 26
4.2.2 Stress relaxation . . . . . . . . . . . . . . . . . . . . . . . . . . 27
4.2.3 Design considerations . . . . . . . . . . . . . . . . . . . . . . 28
4.3 Dynamic time dependent phenomena . . . . . . . . . . . 28
4.3.1 Fatigue . . . . . . . . . . . . . . . . . . . . . . . . . . . . . . . . . . 28
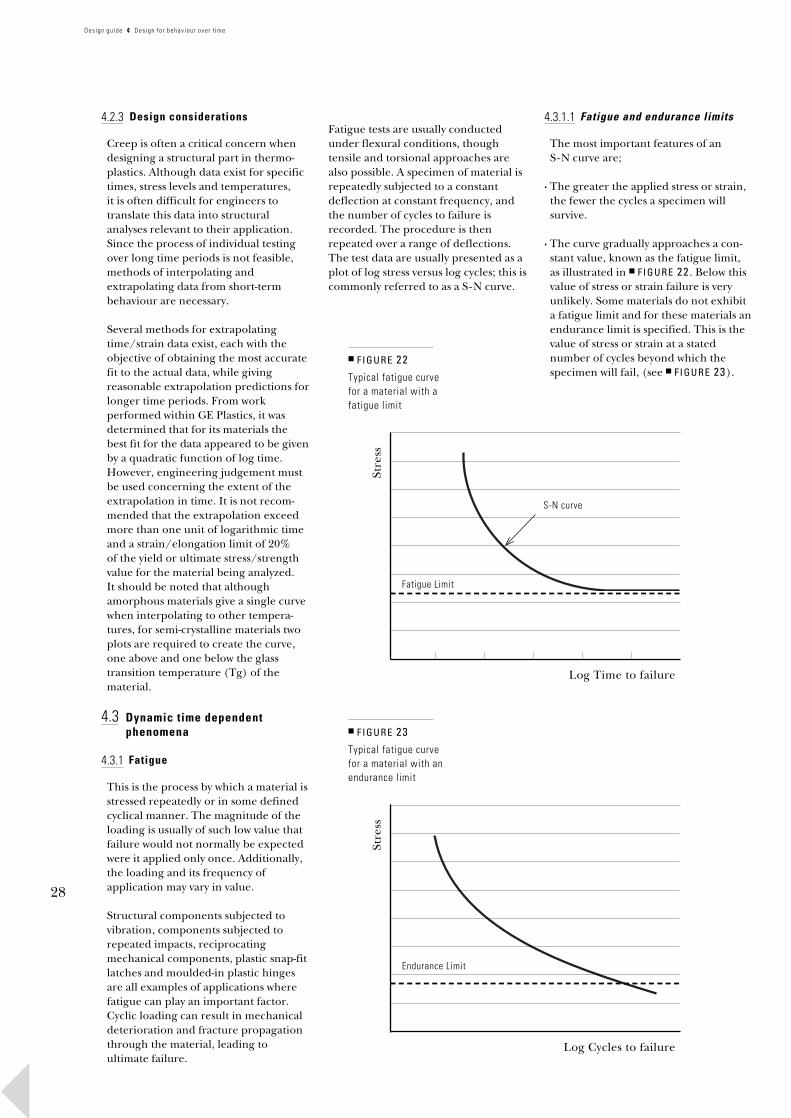
4.3.1.1 Fatigue and endurance limits . . . . . . . . . . . . . . . . 28
4.3.1.2 Factors affecting fatigue . . . . . . . . . . . . . . . . . . . 29
4.3.2 Wear resistance . . . . . . . . . . . . . . . . . . . . . . . . . . . 29
4.3.2.1 Types of wear . . . . . . . . . . . . . . . . . . . . . . . . . . . . 29
4.3.2.2 Factors affecting wear . . . . . . . . . . . . . . . . . . . . . 29
5 Des i gn fo r i m pact per formance . . 31
5.1 Introduction . . . . . . . . . . . . . . . . . . . . . . . . . . . . . . . . . . 31
5.2 Common impact testing methods . . . . . . . . . . . . . . . 31
5.2.1 Pendulum methods . . . . . . . . . . . . . . . . . . . . . . . . . 32
5.2.2 Falling weight methods . . . . . . . . . . . . . . . . . . . . . 32
5.3 Design considerations . . . . . . . . . . . . . . . . . . . . . . . . 33
Design gu ide 1 Contents

6 Des i gn fo r appearance . . . . . . . . . . . . 35
6.1 Introduction . . . . . . . . . . . . . . . . . . . . . . . . . . . . . . . . . . 35
6.1.1 General remarks . . . . . . . . . . . . . . . . . . . . . . . . . . . 35
6.2 Surface defects . . . . . . . . . . . . . . . . . . . . . . . . . . . . . . 35
6.2.1 Sink marks . . . . . . . . . . . . . . . . . . . . . . . . . . . . . . . 35
6.2.2 Weld lines . . . . . . . . . . . . . . . . . . . . . . . . . . . . . . . 35
6.2.3 Air traps . . . . . . . . . . . . . . . . . . . . . . . . . . . . . . . . . 35
6.2.4 Voids . . . . . . . . . . . . . . . . . . . . . . . . . . . . . . . . . . . . 36
6.2.5 Streaks . . . . . . . . . . . . . . . . . . . . . . . . . . . . . . . . . . 36
6.2.6 Delamination . . . . . . . . . . . . . . . . . . . . . . . . . . . . . 36
6.2.7 Jetting . . . . . . . . . . . . . . . . . . . . . . . . . . . . . . . . . . 36
6.2.8 Gate marks . . . . . . . . . . . . . . . . . . . . . . . . . . . . . . . 36
6.2.9 Summary . . . . . . . . . . . . . . . . . . . . . . . . . . . . . . . . . 37
7 Des i gn fo r p rec i s i on . . . . . . . . . . . . . . . 39
7.1 Introduction . . . . . . . . . . . . . . . . . . . . . . . . . . . . . . . . . . 39
7.1.1 Mould shrinkage . . . . . . . . . . . . . . . . . . . . . . . . . . . 39
7.1.2 Secondary effects . . . . . . . . . . . . . . . . . . . . . . . . . 39
7.2 Shrinkage phenomena . . . . . . . . . . . . . . . . . . . . . . . . . 39
7.2.1 Cooling . . . . . . . . . . . . . . . . . . . . . . . . . . . . . . . . . . 39
7.2.2 Packing . . . . . . . . . . . . . . . . . . . . . . . . . . . . . . . . . . 40
7.2.3 Orientation . . . . . . . . . . . . . . . . . . . . . . . . . . . . . . . 40
7.3 Materials and shrinkage . . . . . . . . . . . . . . . . . . . . . . . 40
7.3.1 Amourphous materials . . . . . . . . . . . . . . . . . . . . . . 40
7.3.2 Crystalline materials . . . . . . . . . . . . . . . . . . . . . . . 41
7.3.3 Reinforced materials . . . . . . . . . . . . . . . . . . . . . . . 41
7.4 Design related factors . . . . . . . . . . . . . . . . . . . . . . . . 41
7.4.1 Part wall thickness . . . . . . . . . . . . . . . . . . . . . . . . . 41
7.4.2 Ribs . . . . . . . . . . . . . . . . . . . . . . . . . . . . . . . . . . . . . 41
7.5 Mould related factors . . . . . . . . . . . . . . . . . . . . . . . . . 41
7.5.1 Gate location . . . . . . . . . . . . . . . . . . . . . . . . . . . . . 41
7.5.2 Gate type . . . . . . . . . . . . . . . . . . . . . . . . . . . . . . . . 42
7.5.3 Gate size . . . . . . . . . . . . . . . . . . . . . . . . . . . . . . . . . 42
7.6 Processing related factors . . . . . . . . . . . . . . . . . . . . . 42
7.6.1 Melt temperature . . . . . . . . . . . . . . . . . . . . . . . . . . 42
7.6.2 Mould temperature . . . . . . . . . . . . . . . . . . . . . . . . . 42
7.6.3 Injection time . . . . . . . . . . . . . . . . . . . . . . . . . . . . . 42
7.6.4 Packing pressure . . . . . . . . . . . . . . . . . . . . . . . . . . 42
7.7 Secondary effects . . . . . . . . . . . . . . . . . . . . . . . . . . . . 42
7.7.1 Thermal expansion . . . . . . . . . . . . . . . . . . . . . . . . . 42
7.7.2 Moisture absorption . . . . . . . . . . . . . . . . . . . . . . . . 42
Design gu ide 1 Contents

7.7.3 Post crystallization . . . . . . . . . . . . . . . . . . . . . . . . . 42
7.7.4 Creep under load . . . . . . . . . . . . . . . . . . . . . . . . . . 42
7.8 Simulation techniques . . . . . . . . . . . . . . . . . . . . . . . . 42
7.9 Summary . . . . . . . . . . . . . . . . . . . . . . . . . . . . . . . . . . . . 43
8 Des i gn fo r m ou l dab i l i t y . . . . . . . . . . . 45
8.1 Introduction . . . . . . . . . . . . . . . . . . . . . . . . . . . . . . . . . . 45
8.2 Material issues . . . . . . . . . . . . . . . . . . . . . . . . . . . . . . 45
8.2.1 Melt flow length . . . . . . . . . . . . . . . . . . . . . . . . . . . 45
8.2.1.1 Viscosity . . . . . . . . . . . . . . . . . . . . . . . . . . . . . . . . 45
8.2.1.2 Thermal properties . . . . . . . . . . . . . . . . . . . . . . . . 46
8.2.1.3 Shear properties . . . . . . . . . . . . . . . . . . . . . . . . . . 46
8.2.2 Melt temperature . . . . . . . . . . . . . . . . . . . . . . . . . . 46
8.3 Shrinkage . . . . . . . . . . . . . . . . . . . . . . . . . . . . . . . . . . . . 46
8.3.1 General remarks . . . . . . . . . . . . . . . . . . . . . . . . . . . 46
8.3.2 Warpage . . . . . . . . . . . . . . . . . . . . . . . . . . . . . . . . . 47
8.4 Cooling time . . . . . . . . . . . . . . . . . . . . . . . . . . . . . . . . . 47
8.5 Design considerations . . . . . . . . . . . . . . . . . . . . . . . . 48
8.5.1 General remarks . . . . . . . . . . . . . . . . . . . . . . . . . . . 48
8.5.2 Nominal wall thickness . . . . . . . . . . . . . . . . . . . . . 48
8.5.3 Projections . . . . . . . . . . . . . . . . . . . . . . . . . . . . . . . 48
8.5.4 Radii . . . . . . . . . . . . . . . . . . . . . . . . . . . . . . . . . . . . 49
8.5.5 Ribs . . . . . . . . . . . . . . . . . . . . . . . . . . . . . . . . . . . . . 49
8.5.6 Support ribs . . . . . . . . . . . . . . . . . . . . . . . . . . . . . . 49
8.5.7 Bosses . . . . . . . . . . . . . . . . . . . . . . . . . . . . . . . . . . 50
8.5.8 Undercuts . . . . . . . . . . . . . . . . . . . . . . . . . . . . . . . . 50
8.5.9 Coring . . . . . . . . . . . . . . . . . . . . . . . . . . . . . . . . . . . 51
8.5.10 Draft angles . . . . . . . . . . . . . . . . . . . . . . . . . . . . . . 51
8.5.11 Textures & lettering . . . . . . . . . . . . . . . . . . . . . . . 51
8.5.12 Flow leaders . . . . . . . . . . . . . . . . . . . . . . . . . . . . . 52
8.5.13 Moulded-in-stress . . . . . . . . . . . . . . . . . . . . . . . . . 52
8.5.14 Weld lines . . . . . . . . . . . . . . . . . . . . . . . . . . . . . . . 52
8.6 Processing considerations . . . . . . . . . . . . . . . . . . . . . 52
8.6.1 Venting . . . . . . . . . . . . . . . . . . . . . . . . . . . . . . . . . . 52
8.6.2 Gating . . . . . . . . . . . . . . . . . . . . . . . . . . . . . . . . . . . 53
8.7 Ejection . . . . . . . . . . . . . . . . . . . . . . . . . . . . . . . . . . . . . 54
9 Des i gn fo r recyc l ab i l i t y . . . . . . . . . . . 55
10 Des i gn fo r au tom at i on . . . . . . . . . . . 57
11 Append i x . . . . . . . . . . . . . . . . . . . . . . . . . . . 59
Design gu ide 1 Contents

1
In t roduct ion
The intention of this guide is toprovide the design and engineeringcommunities with an insight into theconsiderations necessary whendesigning applications in engineeringthermoplastics. Many of theseconsiderations relate to mouldingcriteria, so those involved in themanufacturing and processing ofplastics components should alsofind it useful.
Typically, design manuals deal with aspecific resin family, presentingproperties, design criteria, assembly andother related information. GE Plastics’product line includes crystalline,amorphous, thermoplastic elastomersand glass mat reinforced polymers.Because of this diversity, this brochurewill concentrate on issues common to allinjection mouldable thermoplastic
resins.This design guide differs from most byvirtue of its ‘Designing for’ concept,helping the reader move quickly to theissue that needs addressing.Consequently, discussion of certainaspects can occur in more than onesection, which demonstrates howintegral the process of designing forplastics is. Following the explanatorychapters is a section showing typicalengineering material performancegraphs for a range of GE Plasticsthermoplastic polymers.
Supplementary publications coveringassembly techniques, polymerprocessing considerations and overviewsof specific resins in the GE Plasticsproduct lines are available on request.In addition, monographs discussingdetailed design studies are releasedperiodically, covering these issues in
greater depth than is possible in thisgeneralized guide.3
1
Design deve lopment
1.1 Introduction
Throughout the process of productdesign, both functional and materialaspects must be considered. Functionaldesign factors relate to production andassembly. Material design factorsconcern the performance of a materialin service. This performance, whichincludes strengths, weaknesses andlimitations, is investigated to provide thestarting point of the design process.
1.2 Material design factors
Considerable information is needed bythe design engineer to develop aproduct design from the initial concept.This can be a smooth process if carefulattention is given to each step involved.The designer must know the end-use
performance requirements of theproposed application. To determinewhether a material can meet theserequirements, the designer must be ableto rely on information provided by theraw material supplier, indicating theenvironmental and physical capabilitiesof the material.1.3 Development steps
1.3.1 Establish end-use requirements
The development of any component
9
starts with careful consideration ofanticipated end-use requirements.In general, the lower strengthproperties of polymers compared withmetals and woods require that productsbe designed to utilize a largerpercentage of their available strength.
Specific information needed to establishend-use requirements includes:
(a) Anticipated structural requirements
L O A D S
These dictate the stresses a materialwill be subjected to, and they definecomponent deflections.
R A T E O F L O A D I N G
A thermoplastic may demonstratedifferent behaviour with changes inloading rate. Therefore, in additionto its magnitude, the rate at whichloading is applied should beinvestigated.
D U R A T I O N O F L O A D I N G
Initial negligible deflectionsresulting from a small load maybecome unacceptably large if the
load is maintained.I M P A C T F O R C E S
Because the application of highloads for short periods of time mayresult in premature failure, thenature of impact forces to which thecomponent will be subjected shouldbe determined.
V I B R A T I O N
This induces stress and deflectionchanges. Though these may besmall, component failure may occurthrough constant repetition.
F O R E S E E A B L E M I S U S E
Though structural requirements may
have been satisfied, and anappropriate design proposed, failurecan still occur as a result of misuse.To establish the anticipated risklevel, therefore, a ‘risk assessment’ ofthe product in use should be made.The ‘relevance tree’ method is idealfor this purpose, providing data tofacilitate assessment of foreseeablemisuse. The results should then be
weighed against the financial aspectsof the product. This exercise is oftencalled ‘Product Risk Analysis’.Additional details are not given heresince each company applies its ownmeasures.
General Electric Plastics is preparedto provide assistance in this matterand, if required, contact should bemade with the nearest GE Plastics’sales office.
(b) Anticipated environments
T E M P E R A T U R E E X T R E M E S
All materials possess a workingtemperature range. Outside thisrange the component cannotproperly perform its intendedfunction. In addition, the propertiesof the material may vary considerably
within working limits.As all thermoplastics are subject toattack by certain chemical agents,the service environment of theproposed component must beestablished.
Outdoor exposure for prolongedperiods may result in materialdegradation.
(c) Assembly and secondary operations
Usually a plastic component is notused in isolation but is just one of anumber of components making upthe end-product. The techniqueused for assembly, such asmechanical fastening, welding andadhesive bonding, needs to beconsidered at the initial design stageto optimize the component for easeof assembly, (and ease of handling inthe case of automated assembly), orease of disassembly for maintenanceand recycling.
10
Design gu ide 1 Design Deve lopment
Secondary operations, such aspainting, printing and hot stamping,also have to be given earlyconsideration in order to design thebest surface profile. This meansavoiding for example sink marks andsharp changes in shape to achieve ahigh quality smooth surface.
(d) Cost limits
The following should be established:
· Component cost resulting inprofitable sales
· Annual volume· Economic processing method(s)
with estimated cycle time(s)· Tooling cost(s) for selected
processing method(s)· The expected service life of
the component
(e) Regulations/standards compliance
Check which standards orregulations apply or can be appliedin the market place to thecomponent, product or appliance,for example:
S T A N D A R D S
IEC/CEE International ElectricalCommittee/Commité Européand’Electricité
ISO/CEN International StandardsOrganization/Commité Européande Normalisation
DIN Deutsche Industrie fürNormungen
BSI British Standards Institute
NF Normes Francais
ASTM American Society for Testingof Materials
R E G U L A T I O N S
UL Underwriters Laboratories
CSA Canadian Standards Association
CEE Publications of the CommitéEuropéan d’Electricité
Factory and building codes.
1.3.2 Establish a preliminary design
A preliminary concept sketch of theproposed component can help thedesigner to determine which aspects areinflexible, and which can be modified toachieve required performance.The preliminary sketch, therefore,should include both fixed and variabledimensions.
1.3.3 Select the material
A GE Plastics’ material should beselected that will satisfy initially defined,end-use requirements. The comparativeproperty data sheet should be the firstdocument which is consulted. Initialselection may subsequently be refinedby reviewing the time, temperature andenvironment-dependent propertiesrelevant to the particular application.
Supplementary data, such as abrasionresistance or ductility, may be neededto confirm the selection.Material properties can be divided intotwo main categories.
(a) Mechanical properties usedessentially for component designcalculations:
· Elastic limit· Tensile strength· Modulus vs temperature· Poisson’s ratio· Apparent (creep) modulus· Fatigue limit· Coefficient(s) of thermal
expansion· Coefficient of friction· Thermal conductivity· Density· Mould shrinkage
(b) Other relevant properties:
· Hardness· Impact strength· Chemical resistance· Weathering resistance· Abrasion resistance· Ductility· Flammability· Heat deflection temperature· Electrical properties
To design a plastic component,information concerning anycombination of material propertiesmay be required. If the data areunavailable, or assistance is neededin interpretation, contact should bemade with the nearest GE Plastics’sales office.
1.3.4 Modify the design
If this is necessary, four areas inparticular should be considered:
(a)The specific property balance of theselected grade, (e.g. tensile strength,impact resistance)
(b)Processing limitations, (e.g. wall thickness vs flow lengths)
(c) Assembly methods, (e.g. snap-fits, adhesives)
(d)Cost of modification and its impact on component and/or project bud-get, (refer to ■ F IGURE 1).
Strength of materials formulae shouldbe used in conjunction with materialproperty data to calculate necessary
dimensions such as wall thickness.(Refer to Chapter 3 ‘Design forstrength’). Design calculations of arepetitive or iterative nature, however,may warrant a computer-aidedapproach.1.3.5 CAD/CAE
Two particularly relevant computer-aided systems are Flow Analysis of aninjection moulding, and Stress Analysisof a final component. Both generallyuse the Finite Element Method. Thisapproach considers the geometry and
physical properties of the component asa continuum of small manageable parts,or finite elements. Each element of thestructure is individually investigated inrelation to its neighbouring elements,the total structure, and the physicalconstraints on the system. A largenumber of simultaneous equationsresult, the solution of which isparticularly suited to the repetitivecapabilities of a computer.1.3.5.1 Flow analysis
Because the performance of aninjection moulded component is largelydependent on the moulding process,consideration of the service conditionsof the component in isolation isinsufficient to ensure a successfulproduct. Simple shapes should not givematerial flow problems to theexperienced tool-maker and moulder.However, larger components ofcomplex geometry often presentdifficulties, for example positioning andnumber of gates, runner dimensionsand location of weld lines.

Design gu ide 1 Design Deve lopment
In the flow analysis process, a computermodel of the component is produced,and initial gating positions selected.The predicted manner in which thematerial will fill the cavity is thenpresented graphically and numerically.Isochronous temperatures andpressures throughout the system arecalculated, in addition to weld linelocations and undesirable conditionssuch as overpacking. Moulding variablesand/or gating positions are subsequent-ly changed, if necessary, in order toachieve an optimum flow pattern.
By means of this iterative approach,analyses of different options are possiblebefore commitment to actual toolproduction. Moreover, processingdifficulties are identified and may berectified at the design stage.
Nowadays, flow simulation is not theonly software available to the designer.Other injection moulding relatedsoftware prediction tools include:warpage, mould cooling, fibreorientation, (for example for glass-filledthermoplastics), moulded-in stressesand many more.
1.3.5.2 Stress analysis
A component in service will besubjected to forces which induce stressesin the material. To ensure that failureresulting from overstressing does not
■ F IGURE 1Influence of modificationto designs
occur, it is essential that the stresses donot exceed recommended design limits.
As with Flow Analysis, the investigationof a simple geometry should not presentany difficulty, since equations which canoften be solved by substitution havebeen derived for many commonlyencountered situations. However, theanalysis of a complex geometry, thoughnot generally suitable for this approach,may be solved by the finite elementmethod. A mathematical model of thecomponent, defining the geometry by x,y and z co-ordinates, is first described,together with the properties of the
11
Cost of modificationEase of modification
Specification Part Mould Mould Mould ProductionDesign Design Construction Commisioning
Time
material. The boundary and loadingconditions are then entered and specificoutput requested. Stresses in aparticular area may be of interest forexample.
Numerical values of deflections,diagrams of the distorted structure andof stress distribution may also contributeto a useful investigation. By this method,areas of unacceptably high stress ordeflection may be identified andsuitably modified.
1.3.6 Prototyping and testing
At this point in the procedure,a prototype should be constructed.The prototype and its testing can helpthe designer by:
· Establishing confidence in the design by confirming that component require-ments do not exceed design limits.
· Developing preliminary product performance information.
· Identifying potential problem areasin performance, manufacturing orassembly.
· Allowing pre-launch assessment andfeedback from consumer trials.
In order to obtain useful results,particular attention should be paid tocertain aspects of the testing:
· Proper analysis of component requirements.
· Close similarity to the proposedproduct, particularly in critical or suspect performance areas.
· Development of realistic simulated use and storage tests
· Commitment to the time and effortrequired for testing before product introduction
1.3.7 End-use testing
Tests should be conducted to simulateuse and storage of the component. Itshould be established which tests reflectdefined component requirements, andwhether they can be conducted in thelaboratory or in situ. Frequently, the testequipment developed can be used forfuture quality control testing.
Product performance tests can beconducted on functional prototypes orproduction parts. Since functionalprototypes may be produced using non-production tooling or part modelling,caution must be exercised duringtesting and interpreting the results.The prototype may not behave inexactly the same manner as aproduction component. The initialproduction components should also betested to confirm product performancetesting.
Several specialized techniques,examples of which follow, can be usedfor product performance testing:
· Strain gauge analysis · Brittle coating analysis· Photoelasticity· Stress analysis by thermal emission
· Infra-red light banks for radiant heateffect measurement· Environmental chambers for thermalcycling
· Life testing under simulated use cond-itions
· Accelerated ageing under elevated tem-perature, high humidity, or ultraviolet radiation conditions
· Holography
Although computer-aided techniquesallow accurate modelling of a proposeddesign, they should not exclude orreplace finished part testing.The construction of a functionalprototype is therefore advisable.
2
Design fo r s t i f fness
2.1 Introduction
The stiffness of a part is defined as therelationship between the load and thedeflection of a part. This Chapter willdiscuss what modifications can be madeto a part in order to influence andoptimize stiffness. It will also give someguidelines of how the stiffness of a partcan be calculated.
2.2 How to determine the stiffness
In general the stiffness of a part isdetermined by its material and itsgeometry.
2.2.1 Material
The most important material propertyfor stiffness is the stress/strain curve.In general, the Young’s modulus, which
is determined from the stress/straincurve, is the best parameter to be usedwhen comparing the stiffness ofmaterials. However, when the Young’smodulus is used, the stress/strain curveStre
ss
A
Y
Y*
s
str
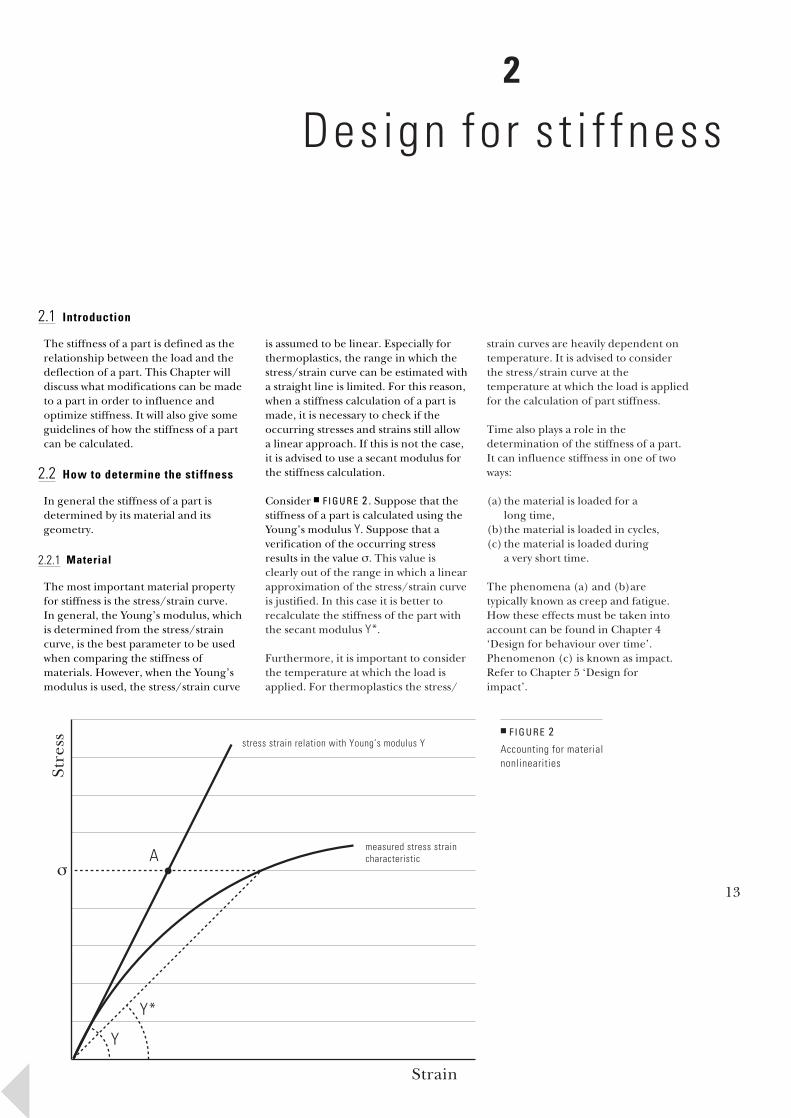
is assumed to be linear. Especially forthermoplastics, the range in which thestress/strain curve can be estimated witha straight line is limited. For this reason,when a stiffness calculation of a part ismade, it is necessary to check if theoccurring stresses and strains still allowa linear approach. If this is not the case,it is advised to use a secant modulus forthe stiffness calculation.
Consider ■ F IGURE 2 . Suppose that thestiffness of a part is calculated using theYoung’s modulus Y. Suppose that averification of the occurring stressresults in the value s. This value isclearly out of the range in which a linearapproximation of the stress/strain curveis justified. In this case it is better torecalculate the stiffness of the part withthe secant modulus Y*.
Furthermore, it is important to considerthe temperature at which the load isapplied. For thermoplastics the stress/
Strain
ess strain relation with Young’s modulus Y
measured stress straincharacteristic
strain curves are heavily dependent ontemperature. It is advised to considerthe stress/strain curve at thetemperature at which the load is appliedfor the calculation of part stiffness.
Time also plays a role in thedetermination of the stiffness of a part.It can influence stiffness in one of twoways:
(a) the material is loaded for along time,
(b)the material is loaded in cycles, (c) the material is loaded during
a very short time.
The phenomena (a) and (b)aretypically known as creep and fatigue.How these effects must be taken intoaccount can be found in Chapter 4
‘Design for behaviour over time’.Phenomenon (c) is known as impact.Refer to Chapter 5 ‘Design forimpact’.13
■ F IGURE 2Accounting for materialnonlinearities

14
Design gu ide 2 Design fo r s t i f fness
I=Aey2
■ F IGURE 3A part loaded in tension
■ F IGURE 4Cross section of a part
cF F
area A
dA y
■ F IGURE 5A rectangular cross-section
dA y
a
b
■ F IGURE 6Clamped part loadedat the end
cF
2.2.2 Geometry and loading
Besides the material, the geometry isalso important for part stiffness. Whichfactors of the geometry are important ismainly determined by the type of load-ing. It should be noted that, in general,a part is loaded in more than one of thefollowing types at the same time.
(a) Tensile loadingFor a part loading in tension,( ■ F IGURE 3), the cross-sectionalarea A and the length of the part care important.
(b) Compressive loadingWhen a part is loaded undercompression, again the cross-sectional area A and the length ofthe part are the geometricalparameters that determine the
stiffness. In this case, buckling of thepart is something that has to beconsidered separately.(c) Flexural loadingFor flexural loading, the moment ofinertia and the length are the geo-metrical parameters that determinethe stiffness. As can be seen in■ F IGURE 4 , the moment of inertia I
is defined as:where y is the directionperpendicular to the neutralbending axis and A is the cross-sectional area. For example, for arectangular cross-section, with thedimension a and b ( ■ F IGURE 5),I can be calculated with the formulamentioned above:
I=Aey2 dA
(d) Torsional loadingWhen a part is loaded in torsion,the polar moment of inertia and thelength are the importantgeometrical parameters thatdetermine stiffness. The polarmoment of inertia Ip can becalculated with a similar formula tothe moment of inertia.
dA = eay2 dy = 1/3 a y3 d = 1/12 a b3
-b_2
-b_2
b_2
b_2
As mentioned earlier, the stiffness ofa construction is determined by the combination of the material and thegeometry. The following two examplesillustrate how the stiffness of a part canbe calculated.
EXAMPLE 1A part under tension
For a part of length c, and constantcross-sectional area A, the deflectionf can be calculated with the formula:
f = Fc/ yA
where F is the tension force and Y is theYoung’s modulus of the material. From this formula it can be seen thatthe stiffness of this part can be increased
by decreasing I, increasing Y orincreasing A.EXAMPLE 2A part under bending
For a part of length c and moment ofinertia I, loaded by a force F at the end,( ■ F IGURE 6), the deflection f at theend can be calculated using:
f = Fc 3/ 3YI
where F is the force and Y the Young’smodulus of the material. The stiffness ofthis part can be increased by decreasingc, increasing Y and increasing I.Suppose that the part has a rectangularcross-section. Then I is given by 1/12 ab3,( ■ F IGURE 5). This means that I can beincreased by increasing either a or b,though increasing b has a much largereffect.
2.2.3 Other factors influencingstiffness
Besides the geometry and the material,other important factors have aninfluence on stiffness, such as the typeof loading or the restraints of the part.A load can, for instance, beconcentrated on a point, but it can alsobe a pressure on an area. Differentrestraints that are used in calculationsare clamped or simple supports. Notethat, in reality, the fixing system willalways be something in between fullyclamped and simply supported.

Design gu ide 2 Design fo r s t i f fness
2.2.4 Calculating the stiffness
Similar formulae to those given aboveare available for different cross-sections,for changing cross-sections, and so on.(Please refer to the Appendix foradditional sources of reference).
The application of formulae is limiteddue to different factors:
(a)The material behaviour is assumed to be linear, which means that the stress/strain curve of the material isa straight line.
(b)The geometrical effects are assumed to be linear. For large deflectionsthis leads to considerableinaccuracies.
(c) The formulae given above assume a
relatively simple shape.(d)In general, a part is not purely loaded in one mode, but in acombination of modes.
A simple way of accounting for materialnonlinearities is already given above.Taking into account the other factors ismore complicated. The simple formulaecannot be used anymore when these
effects play an important role. If thepart stiffness has to be determined forthis type of problem, the only possibilityis computer simulation using the finiteelement method. A computer model ofthe part has to be made and evaluatedwhich requires much more time thanhand calculations. Also, an appropriatecomputer system and software must beavailable.In general, the following guidelines canbe given:
(a)For simple geometries and smalldeflections, hand calculations can bemade.
15
(b)For more complex geometries with small deflections, linear finiteelement analysis techniques can beused.
(c) Only nonlinear geometrical finiteelement analysis can account forlarge deflections on complexgeometries.
Note that the analysis costs increasedramatically when going from step (a)to step (c).
2.2.5 Modal Analysis
Vibration resistance is important formany applications such as automotivecomponents. All parts designed inplastic or any other material will haveeigenfrequencies. These eigenfrequen-cies will, amongst other factors, dependupon the stiffness of the part. If a part isloaded with a vibration load with afrequency close to, or equal to, one ofits eigenfrequencies, a potential dangerof part damage exists.
In automotive components, it is oftendesirable to have the lowesteigenfrequency of any part to be abovethe normal operating frequencies of thevehicle. Therefore, although a part maybe stiff enough to meet static loadingrequirements, it may require additionalstiffness to increase the
eigenfrequencies.Finite element analysis can be used topredict the eigenfrequencies of the partas well as the vibration modes shape foreach of the eigenfrequencies. This typeof analysis is called modal analysis.Modal analysis results are very sensitiveto the type of loads, restraints and theirlocations on the part. Often it is possibleto significantly change the vibrationbehaviour of a plastic part byredesigning the way it is mounted orrestrained.
2.2.6 Safety factors
The use of safety factors in engineeringdesign is common practice with almostall types of material. Plastics are noexception to this rule. Conservativeassumptions should be made whenpossible and worst case loads should beconsidered. It is the responsibility of thedesign engineer to anticipate thatproducts will not always bemanufactured or used as intended orplanned. In some cases, product failureis acceptable under unusual loading, orfor an occasional poorly manufacturedpart. However, there are many cases inwhich safety factors must be considered.
There are numerous reasons why aproduct can have less than its originallyintended properties. Some of thesereasons are beyond the control of thedesigner and include:
· Exposure to chemicals which does notnormally occur
· Moulding issues such as insufficientdrying or excessive heating of the resin
· Tool wear resulting in dimensional changes of the part
· The part is used at temperatures above the expected maximum.
· The part is used in a manner other than what it was designed for.
· The part is assembled poorly or ‘forced’,incurring a pre-load
· Excessive moulded-in stresses resulting from high moulding pressures, too small gates and too low tool temperatures.
A safety factor is typically decided uponbased on prior experience with similardesigns. In general, the greater thepotential damage from failure, thegreater the factor of safety that shouldbe used. In many industries, safety codesand test procedures exist, which givestandards and recommendations forsafety factors.
2.3 Increasing part stiffness
Features like ribs and V-grooves can beused efficiently to improve the stiffnessand the load bearing possibilities of apart. This is accomplished by locating asmuch material as possible as far as pos-sible from the neutral axis of the part.This increases the moment of inertia.As can be seen from Example 2 inSection 2.2.2 (d), the moment of inertiaincreases to the third power of thedistance of the material to the neutralaxis, and only linearly with the distancealong the neutral axis. This is aprinciple that has to be kept in mindwhen designing stiffeners into a part.
2.3.1 Ribs
Ribs are the most commonly usedstiffeners. Processing and toolingdetermine certain requirements for theshape and the thickness of the ribs,(seeChapter 8). For a part under bending,the ribs should run perpendicular to thebending moment. For parts undertorsion, ribs most efficiently increase thestiffness if they are placed diagonally.For pure stiffness reasons, it isimportant to note that high ribs aremore efficient than thick ribs.
2.3.2 V-grooves
V-grooves, ( ■ F IGURE 7), are often in-corporated into parts where significantincreases in stiffness are necessary, andother requirements permit their use.V-grooves are very efficient stiffenersbecause they do not use large amountsof additional material and they do notrequire additional cooling time.However, V-grooves often cannot beused because they provide an uneventop and bottom surface.

16
Design gu ide 2 Design fo r s t i f fness
■ F IGURE 7V-grooved structure
■ F IGURE 8Corrugated structure
M1
M2
M1
M2
As with ribs, V-grooves provideadditional stiffness by increasing theaverage distance of material from theneutral axis of the part. For bendingproblems, V-grooves should be orientedin the direction perpendicular to thebending moment. V-grooves candecrease the bending stiffness when thebending moment is directed along theV-groove. The V-grooves given in■ F IGURE 7 are efficient for bendingmoment M1, but inefficient for bendingmoment M2.
2.3.3 Corrugation
Corrugation is similar to the V-groove.It also does not use large amounts ofadditional material and does notrequire additional cooling time, but,like the V-groove, often cannot be usedsince it provides an uneven top and
bottom surface. A stiffness increase isonly achieved for a bending momentperpendicular to the corrugated axis,and can even be reduced for bendingmoments along that axis.The corrugation shown in ■ F IGURE 8 isefficient for bending moment M1 butinefficient for bending moment M2.Note that for V-grooves and corrugatedstructures, when larger loads areapplied, the stiffness can decrease dueto the fact that the profile becomesflatter, and hence the moment of inertia
becomes smaller. This can be avoided byputting ribs perpendicular on the axisof the corrugated structure.2.4 Optimization of stiffness
Before an optimization study is started,the parameter that must be minimizedmust be determined. In most cases thisis either part weight or part costs.
2.4.1 Optimization for stiffness toweight ratio
2.4.1.1 Material selection
When designing for an optimum
stiffness to weight ratio, for exampleaircraft components, often a materialwith a high Young’s modulus and yieldstrength is recommended. Of course thematerial also has to meet otherrequirements like the mouldingcapability, aesthetics, environmentalresistance, and appropriate regulatoryor standard requirements. Often glass-fibre reinforced materials are selected,together with materials such as Ultem®polyetherimide resin because of theirstrength and stiffness.
Another important factor for partweight optimization is density. It is oftenrecommended to choose a material withthe highest ratio of elastic modulus todensity, which meets all the otherrequirements. A material with a verygood stiffness to density ratio isengineering structural foam.Furthermore, the larger wall thicknessat equivalent weight is a plus, since itgives a greater moment of inertia forbending loads.
Note that when a glass fibre-reinforcedmaterial is used, the stiffness is mainlyincreased in the direction, (orientation),of the glass fibres. This means that thedesign engineer must ensure that in thecritical areas the fibres are aligned inthe right direction in order to optimizethe performance of the glass-filledmaterial. The direction of the glass fibres
is dependent on the flow direction ofthe material during injection moulding.The gating of the part therefore has tobe designed in such a way that theincreased material stiffness due to glassfibre reinforcement is used.2.4.1.2 Geometric considerations
It is not possible to give a general ruleof how the geometry of a part should beoptimized, since it heavily depends onthe type of loading and other factors.
Furthermore, design limitationsimposed by the material and the processwill limit the designer’s freedom.In general, it can be stated that materialshould be added where it most effective-ly enhances the stiffness of the part.Finite element analysis techniques areparticularly useful for geometrical partweight optimization. Localized areas ofhigh and low stress can be easilyidentified and redesigned. Materialsituated in an area of low stress does notcontribute significantly to the partstiffness. Areas of high stress are areaswhere also large strains occur whichinduce large deflections. An optimum part design for stiffness, and strength,would result in the most uniform stressdistribution possible, subject to all otherlimitations.2.4.2 Optimization for stiffness tocost ratio
Designing for an optimum stiffness tocost ratio is often critical in applicationssuch as material handling pallets andbuilding and construction components.The situation is very similar to designingfor optimum stiffness to weight, exceptthat the final part weight must be

Design gu ide 2 Design fo r s t i f fness
■ F IGURE 10The cross-sections of the beam
■ F IGURE 9The restraint and the loadson the beam
c
c F_2
c_2
multiplied by the cost per kg. of thematerial. All of the techniquesmentioned above still apply.
When designing an application forwhich the cost is critical, all costs shouldbe considered, including material costs,processing costs, tooling costs,secondary costs and inventory costs.
EXAMPLE 3Comparison of a ribbed, V-groovedand corrugated structure.
This example shows how different levelsof stiffness can be reached using thesame amount of material. Furthermore,differences between hand calculations,linear finite element calculations, andgeometrically nonlinear finite elementcalculations are shown and discussed.
V-groove
Ribs
20
210y
x
Suppose that a beam, supported on twosides as shown in ■ F IGURE 9 is loadedwith a force in the middle. The length isassumed to be 800 mm. Suppose that forthe cross-sectional area a rectangle witha width of 20 mm and a height of 10 mmis available.
Three possible cross-sections are shownin ■ F IGURE 10 , each of them using thesame amount of material. A V-groove, a
■ TABLE I
Some geometrical properties of the cros
Quantity V-groove Ribs
J (mm4) 348.6 480.6
x-coord c.g. (mm) 10 10
y-coord c.g. (mm) 5.896 6.983
Area (mm2) 52.57 52.57
■ TABLE I I
Hand calculation and linear finite eleme
Deflection at 10N V-groove Ribs
Hand calc. (mm) 139 101
Linear f.e.m. (mm) 148 99.6
ribbed and a corrugated structure havebeen chosen. ■ TA B L E I summarizessome geometrical properties of thethree different sections. As can be seen,for the load on the beam, which resultsin bending moment around the y-axis,the corrugated beam has the higheststiffness.
For the beams with the three differentcross-sections, a hand calculation and alinear finite element simulation usingshell elements have been performed.For the finite element simulation, themid-lines of the cross-sections aremodelled and the thickness issuperposed on that. The results arepresented in ■ TA B L E I I . The formulafor the hand calculation to calculate thedeflection f is:
f = Fc 3/ (48YI )
where F is the force, c the length of thebeam, Y the Young’s modulus of thematerial and I the moment of inertia.
17
Corrugated
s-section
Corrugated
668.0
10
4.403
52.57
nt results
Corrugated
72.5
74.0
y
x
y
x
101.41
1.41 10
20
20

18
Design gu ide 2 Design fo r s t i f fness
■ F IGURE 11The cross-sections of the beamsin a finite element analysis withshell elements
V-groove
Ribs
Corrugated
The deviations between the results fromthe hand calculation and those from thelinear finite element method, (f.e.m.),are due to the fact that for f.e.m. I iscalculated from the thicknesssuperposed on the mid-line of the cross-section,( ■ F IGURE 11). This means thatthe stiffness is underestimated by thef.e.m. for the V-groove and to a lesserextent for the corrugated section.The stiffness is slightly over-estimatedfor the ribs.
■ F IGURE 12The difference betweena linear and a non-linearfinite element analysis
Forc
e ( N
)
40
35
30
25
20
15
10
5
00
Ft
Forc
e ( N
)
40
35
30
25
20
15
10
5
00
Ft
Forc
e ( N
)
40
35
30
25
20
15
10
5
00
Ft
In order to study the effect of a linearf.e.m. calculation versus a nonlinearf.e.m. calculation, geometricallynonlinear f.e.m. simulations have alsobeen performed. The results are shownin ■ F IGURE 12 . It can be seen that forlarger deflections, there is aconsiderable difference between thelinear and the nonlinear simulation.
Deflection (mm)50 100 150 200 250 300
non-linear
linear
orce deflection curve ofhe corrugated beam
Deflection (mm)50 100 150 200 250 300
non-linear
linear
orce deflection curve ofhe ribbed beam
Deflection (mm)50 100 150 200 250 300
non-linear
linear
orce deflection curve ofhe V-groove beam

3
Design fo r s t rength
3.1 Introduction
The strength of a part is defined as themaximum load that can be applied to apart without causing part failure undergiven conditions. In order to be able todetermine the strength of a part, firstfailure has to be defined. The rightdefinition of failure depends on theapplication. In some cases a part hasfailed if it shows a certain amount ofpermanent deformation, while in othercases this can be allowed and failure isdefined as breakage of the part. In othermore critical applications, failure mustbe defined as the load at which the firstcrack occurs in the material.
This chapter explains how to obtainstrength measures from standardmaterial data. Different failuredefinitions are discussed and ways of
determining the strength of a part arepresented. Furthermore, some generalguidelines to design for strength aregiven.Stre
ss strai
Proportional Limit
yield re
slope = elastic modulus
unfilled thermoplastic
glass-filledthermoplastic
3.2 Material strength
From a materials point of view, strengthis a stress/strain related propertyinherent in the material. There aremany different stress/strain issues whichcan relate to strength and which mustbe understood in order to design forstrength. A variety of standard tests isavailable to study the stress/strainbehaviour of a material under variousconditions. In general, the tensile testprovides the most useful information forengineering design. Other standardtests that are performed to obtainstrength data are flexural testing, sheartesting and compression testing.
Two typical stress/strain curvesobtained from a tensile test are shown in■ F IGURE 13 . One curve is from anunfilled thermoplastic and the other
curve is from a filled thermoplastic.For the unfilled thermoplastic, for smallstrains the stress increasesproportionally with the strain howeverStrain
n at fracture
maximum stress
necking/propagationgion
soon nonlinearities occur; a closeobservation of the stress/strain curveshows that actually a proportional partdoes not exist. For larger strains,yielding occurs and the maximum stressis reached. If the strain is increasedfurther, necking will occur and the neckwill propagate through the structureuntil the material fails.
For a glass-filled thermoplastic, thestress increases faster with an increasingstrain; a glass-filled thermoplastic has ahigher Young’s or elastic modulus. Forlarger strains, nonlinearities occur andthe part fails in brittle mode when thefailure strain is reached. The followingstrength measurements can be obtainedfrom these curves:
19
■ F IGURE 13Typical stress-straincurves for thermoplastics
20
Design gu ide 3 Design fo r s t rength
3.2.1 Ultimate strength
The ultimate strength, (tensile, flexural,compressive, or shear), of a material isthe maximum stress level in a sampleprior to failure. The ultimate tensilestrength of a material is the maximumload per unit area that the material willbear before failure. This value can beobtained from the maximum stressvalue on the stress/strain curve (see■ F IGURE 13). Simple formulae are oftenused to obtain strength values from theload-displacement output of non-tensiletype tests. Ultimate strength is afunction of temperature and strain rate.
3.2.2 Yield strength
The classical definition of the yieldstrength of a material is the stress levelwhich will cause a small amount of
permanent deformation, (standard is0.2 % strain). This definition originatesfrom the steel industry, but it alsoapplies to plastics. However, the yieldpoint of thermoplastics is difficult todetermine because of their viscoelasticnature. The yield point for classicalmaterials such as metals can easily bedetermined and tested by loading thesample to a point slightly beyond theproportional limit, (linear portion ofthe stress/strain curve), and thenunloading it and measuring thedeflection. Therefore, with someexperience it is easy to predict.When plastic materials are tested in asimilar manner, what originally appears■ TABLE I I I
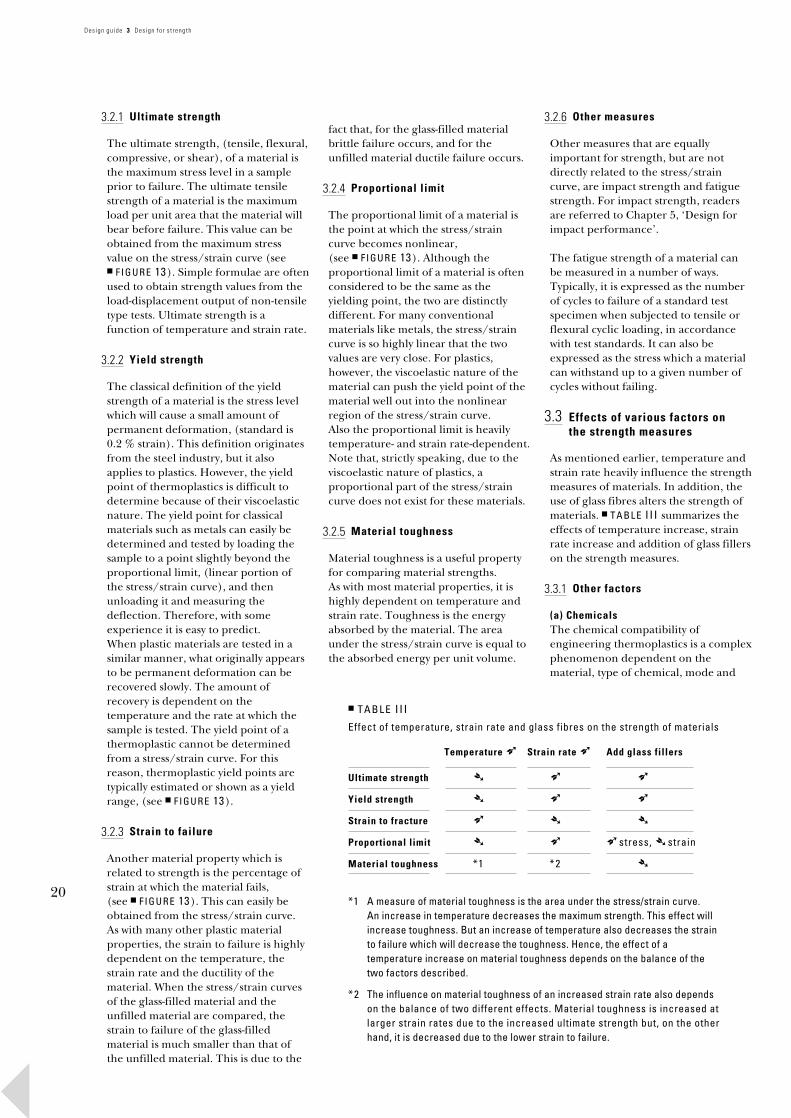
Effect of temperature, strain rate and glass fibres on the strength of materials
Temperature ➶ Strain rate ➶ Add glass fillers
Ultimate strength ➴ ➶ ➶
Yield strength ➴ ➶ ➶
Strain to fracture ➶ ➴ ➴
to be permanent deformation can berecovered slowly. The amount ofrecovery is dependent on thetemperature and the rate at which thesample is tested. The yield point of athermoplastic cannot be determinedfrom a stress/strain curve. For thisreason, thermoplastic yield points aretypically estimated or shown as a yieldrange, (see ■ F IGURE 13).
3.2.3 Strain to failure
Proportional limit ➴ ➶ ➶ stress, ➴ strainMaterial toughness *1 *2 ➴
*1 A measure of material toughness is the area under the stress/strain curve. An increase in temperature decreases the maximum strength. This effect willincrease toughness. But an increase of temperature also decreases the strainto failure which will decrease the toughness. Hence, the effect of atemperature increase on material toughness depends on the balance of thetwo factors described.
*2 The influence on material toughness of an increased strain rate also dependson the balance of two different effects. Material toughness is increased atlarger strain rates due to the increased ultimate strength but, on the otherhand, it is decreased due to the lower strain to failure.
Another material property which isrelated to strength is the percentage ofstrain at which the material fails,(see ■ F IGURE 13). This can easily beobtained from the stress/strain curve.As with many other plastic materialproperties, the strain to failure is highlydependent on the temperature, thestrain rate and the ductility of thematerial. When the stress/strain curvesof the glass-filled material and theunfilled material are compared, thestrain to failure of the glass-filledmaterial is much smaller than that ofthe unfilled material. This is due to the
fact that, for the glass-filled materialbrittle failure occurs, and for theunfilled material ductile failure occurs.
3.2.4 Proportional limit
The proportional limit of a material isthe point at which the stress/straincurve becomes nonlinear,(see ■ F IGURE 13). Although theproportional limit of a material is oftenconsidered to be the same as theyielding point, the two are distinctlydifferent. For many conventionalmaterials like metals, the stress/straincurve is so highly linear that the twovalues are very close. For plastics,however, the viscoelastic nature of thematerial can push the yield point of thematerial well out into the nonlinearregion of the stress/strain curve.Also the proportional limit is heavily
temperature- and strain rate-dependent.Note that, strictly speaking, due to theviscoelastic nature of plastics, aproportional part of the stress/straincurve does not exist for these materials.3.2.5 Material toughness
Material toughness is a useful propertyfor comparing material strengths.As with most material properties, it ishighly dependent on temperature andstrain rate. Toughness is the energyabsorbed by the material. The areaunder the stress/strain curve is equal tothe absorbed energy per unit volume.
3.2.6 Other measures
Other measures that are equallyimportant for strength, but are notdirectly related to the stress/straincurve, are impact strength and fatiguestrength. For impact strength, readersare referred to Chapter 5, ‘Design forimpact performance’.
The fatigue strength of a material canbe measured in a number of ways.Typically, it is expressed as the numberof cycles to failure of a standard testspecimen when subjected to tensile orflexural cyclic loading, in accordancewith test standards. It can also beexpressed as the stress which a materialcan withstand up to a given number ofcycles without failing.
3.3 Effects of various factors on
the strength measuresAs mentioned earlier, temperature andstrain rate heavily influence the strengthmeasures of materials. In addition, theuse of glass fibres alters the strength ofmaterials. ■ TA B L E I I I summarizes theeffects of temperature increase, strainrate increase and addition of glass fillerson the strength measures.
3.3.1 Other factors
(a) ChemicalsThe chemical compatibility ofengineering thermoplastics is a complexphenomenon dependent on thematerial, type of chemical, mode and

Design gu ide 3 Design fo r s t rength
duration of exposure, temperature, andlevels and state of stress present duringexposure. Different types of chemicalscan embrittle a thermoplastic materialor can cause it to become softened.However, it is not possible to classify thegeneral effect of chemicals on materials.For more specific information readersare invited to contact their GE Plastics’representative.
(b) MoistureMoisture can significantly affect thestrength of engineering thermoplastics,much in the same way as chemicals.The hydrolytic stability of engineeringthermoplastics is a complex issuedependent upon material type, modeand duration of exposure, temperature,and stress level and stress states in thematerial. Some materials like Noryl®
PPO ® resin have an excellent hydrolytic
stability, while others, such as Lexan®polycarbonate resin, can have hydrolyticstability problems at elevated tempera-tures. GE Plastics’ representatives cansupply more specific information.
(c) Processing conditionsProcessing conditions can have asignificant effect on the strength of amaterial in the final product. Moisture,small gate sizes, long residence times,
orce
(N
) Failure ■ F IGURE 14Sample load-deflection curveof a part
A
(material at melt temperature in thebarrel of the machine), sharp corners orwall transitions, or excessive use ofregrind can all cause degradation of thepolymer. Effectively this means that theaverage length of the molecular chainswhich comprise the material is reduced.This can embrittle the material or causeit to have a reduced modulus, yieldstrength or ultimate strength.
Other moulding parameters such as lowtool temperatures or high injectionpressures can cause a significantincrease in the levels of moulded-instresses. These, in turn, add to thestresses induced in the part by the load
21
F
Deflection (mm)permant deformation
B
C
and hence decrease the load bearingcapabilities of the part.
Another important aspect of processingis the occurrence and the location ofweld lines. The material strength on aweld line is significantly lower. Thismeans that it is important to avoid weldlines in areas where large stresses areexpected due to the applied loads.
3.4 Part Strength
The strength of a plastic part can havedifferent meanings depending on thepart. There are many different concepts
of what part strength really means.In some cases, stress limits like yieldstrength and ultimate strength are mostimportant, while in other cases yieldstrain and ultimate strain are important.
The meaning of the term strength of apart will depend upon the type ofapplication, the function of the part,loading conditions, restraint conditions,and the performance of competitive orcomparable parts. In this section threemeasures of part strength will bediscussed: ultimate part strength, partyield strength and part toughness.The material parameters that areimportant for part strength depend onboth the measure of part strength andon the type of loading. Two types ofloading will be distinguished: oad (or force) controlled applicationsand deflection controlled applications.
A load controlled application is definedas an application which must bear a loadof a certain magnitude. A deflectioncontrolled application is an applicationto which a deflection of a certainmagnitude is applied.3.4.1 Ultimate part strength
Consider the force deflection curve asdepicted in ■ F IGURE 14 . Suppose thiscurve is the result of a test on an actualplastic part. When the part is loaded topoint A, the part breaks. The force anddeflection level at which the part breakscan be defined as the strength of thepart. The maximum force level is usuallyreferred to as the ultimate strength,while the maximum deflection level isreferred to as the ultimate deflection.
This concept of strength is common inengineering design, especially whenfactors of safety and worst case loadingsare considered.
An example of this type of strengthconcept on a load controlledapplication is the design of load bearingaircraft components. In these designs,loads of many times the expected loadare considered in order to assure safety.Other part strength concepts likepermanent deformations are not ofconcern. In this case, the ultimate partstrength is dependent on the ultimatestrength of the material and on thegeometry of the part.
Another example is a flexible bearingcover in a car. In this case, theapplication is deflection controlled andit is possible that an extreme loading
condition on the bearing could producea deflection far beyond the normaloperating range, which can cause thepart to rupture. The ultimate strengthof a part is dependent on the strain tofailure of the material and thegeometry.In summary, when ultimate strength isconsidered, for load controlledapplications the ultimate strength is thegoverning material parameter, while fordeflection controlled applications thestrain to failure is the governingmaterial parameter. Materials should beselected accordingly.

22
Design gu ide 3 Design fo r s t rength
■ F IGURE 15Strain recovery
3.4.2 Part yield strength
Suppose that the part, (■ F IGURE 14)is loaded to point B and then unloaded.After a certain time, the part regains itsoriginal shape. If the part is loadedfurther, (for example to point C) andthen unloaded, it does not retain itsoriginal shape and a permanentdeformation will occur.
If at a certain level of permanentdeformation the part ceases to be usefuland must be replaced, then this is againa new strength criterion which isreferred to as the part yield strength.An example of a load controlledapplication is a thermoplastic spring.Permanent deformation of the springusually makes it non-functional. In thiscase, the part strength depends on boththe yield strength of the material and on
t af
ter
reco
very
10
min
.
100
90
80
70
mineral-filledmodified PPE PC - PBT
PBT
PC PEI
the geometry of the part. Anotherexample is a plastic snap-fit. A snap-fit isa deflection controlled feature whereover-extension can cause permanentdeflection. This can make the snap-fituseless if it cannot return to engage thestop. In this case, the part strengthdepends on both the yield stress,(or yield strain), of the material and onthe geometry of the part.■ TABLE IV
Governing material properties depenent on failure criterion and load type
ultimatedstrength part yield strength part toughness
Per
cen
Applied Strain (%)
60
503 4 5 6 7 8 9 10
A refinement of this failure criterioncould be the allowance of a certainamount of permanent deformation.If this is the case, strain recovery playsan important role. When a material isloaded and afterwards unloaded, (forexample up to point C in ■ F IGURE 14),the permanent strain will partlydisappear in time.
In order to acquire material data,a laboratory test was developed.Tensile specimens were loaded tovarious strain levels at a rate of 10%/sand then rapidly unloaded, while thestrain recovery was monitored.
no permanent somedeformation permanentallowed deformation
allowed
load ultimate yield stress maximum materialcontrolled material strain toughness
strength according to■ F IGURE 15
deflection strain to strain at yield maximum materialcontrolled failure strain toughness
according to
Since the rate of recovery was very smallafter 10 minutes, the percent recovery,which is defined as the ratio betweenthe residual strain and the appliedstrain, was plotted after this time as afunction of the applied strain.The results are depicted in ■ F IGURE 15 .As an example, a design rule of 90%recovery is shown in this Figure.It can be seen that in the case of PC amaximum strain of approximately 9.3%will be allowed, compared toapproximately 5.8% for PC-PBT.
3.4.3 Part toughness
Part toughness is often considered tobe a good measure of the strength ofthe part, and depends on materialtoughness and geometry. It is measuredby calculating the area under the load-deflection curve from initial load to partfailure. The toughness of a part is anissue for both load and deflectioncontrolled applications, and it is ameasure of the amount of energy thata part can absorb.
3.5 Improving the part strength
Once the strength criterion is decided,the strength of a part can be improved.This can be done by selecting the rightmaterial and/or by optimizing the partgeometry.
3.5.1 Material choice
Based on the strength criterion and theloading type of the application,■ TA B L E IV can be used to decide whichmaterial parameter should be increasedin order to improve the strength of thepart. Based on this information theoptimal material can be selected.
■ F IGURE 15

Design gu ide 3 Design fo r s t rength
3.5.2 Geometry optimization
Since the strength of a part depends onmany factors, like loads and restraintconditions, it is very difficult to givesome general guidelines on how tochange a design in order to improve thestrength of a part. However, somegeneral remarks can be madedependent on the type of loading onthe part. Of course when a design ismodified to improve the strength, thedesign rules that are summarized in thefollowing section have to be respected.
For load controlled applications, theamount of load that has to be carried bythe part is known. In the material thisload will be transformed to stresses.Areas of large stresses have to beidentified and material should be addedto the appropriate areas. The goal is to
have the load carried by a maximumamount of material. This will decreasethe occurring stress levels.For deflection controlled applicationsthe situation is different. In this case, acertain deflection is prescribed to thepart and this results in a given strain inthe material. The strength can beincreased by removing material in theareas where the largest strains occur. This will significantly decrease thestiffness of the part, so it must beverified if this is allowed.
For load controlled applications thearea of maximum stresses and fordeflection controlled applications thearea of maximum strains have to beidentified. In general, hand calculationsare not sufficient here, since the stressand strain levels are usually far beyondthe point at which the linearcalculations are valid. Even the results ofdetailed finite element analyses have tobe interpreted with care. The reason for
23
this is that the accuracy of especially thestresses and the strains is dependent onthe type of element used and on themesh density. This means that theaccuracy of the stress and strain levels isnot always as high as desired. However,finite element analysis is very well-suitedto identifying areas of the largeststresses and to comparing the effect ofdifferent possible design changes.
3.6 Design considerations
Some general guidelines for design forstrength are as follows:
(a) Avoid stress concentratorsStress concentrators can significantlyreduce the strength of a part and shouldbe avoided. These include sharpnotches, or internal corners, sharplyangled wall intersections, large wallthickness transitions and surfaceinterruptions such as holes and inserts.
(b) Avoid uncontrollableloading situationsExamples include pipe threads wherethe designer can have no control overhow much it is tightened, causing hoopstress.
(c) Design for compressive stress
As with many materials, unfilled plasticmaterials tend to be stronger incompression than in tension, as long asbuckling does not become critical.(d) In tension, design for a uniformcross-sectional areaIn a plastic part which is primarily intension, a uniform cross-sectional areashould be used to obtain a moreuniform stress distribution.
(e) In bending, design for momentof inertiaIn a plastic part which is primarilysubjected to flexural loading, themoment of inertia is critical indetermining the load bearing capability.For maximum load bearing strength,material should be located as far awayfrom the neutral axis as possible. For
maximum deflection without yield,material should be concentrated alongthe neutral axis.(f) Consider processing aspectsProcessing can be critical for thestrength of a part. Recommendationsinclude:
· Weld lines should be avoided or located in non-critical areas.
· The frozen-in stresses should be as low as possible.
· For fibre-reinforced plastics, thedifference in strength in the flow and the cross-flow direction should beconsidered
(g) Use safety factorsAs with all materials, it is impossible tocontrol all aspects of production anduse. For this reason, conservativeestimates and risk dependent safetyfactors should be applied whenappropriate.
(h) Consider worst caseIn addition to analyzing the expecteduse for a proposed part, a worst casescenario should also be studied.

4
Design fo r behav iorover t ime
4.1 Introduction
When discussing time related behav-iour, two types of phenomena should beconsidered. Static time dependentphenomena, such as creep, are causedby a single long-term loading of anapplication. Dynamic time dependentphenomena, such as fatigue, areproduced by cyclic loading of anapplication. Both types of behaviour areheavily influenced by material choice,operating environment and componentdesign.
The biggest problem experienced whenattempting to predict long-term loadingeffects, is the availability of data specificto an application; most data are basedupon standard tests performed uponmaterial specimens. However, thisinformation can be used to give an
Stra
in
constant stressvisc
oela
stic
■ F IGURE 16Typical creep behaviourof an amorphousthermoplastic,assuming no plasticdeformation
B
indication of the performance of acertain design and can be verified byactual physical testing of thethermoplastic components for therequired performance.
4.2 Static time dependentphenomena
Traditional structural calculationscentre around short-term material datain which the material exhibits perfectlyelastic behaviour. However, anotherimportant property exhibited bythermoplastics is that of viscoelasticity.
25
Log Time
elas
tic
A
0
This is the simultaneous demonstrationof both viscous flow and elasticdeformation under an applied load overa long time period. Short-term stress/strain behaviour usually occurs withinless than an hour of the load beingapplied and is often consideredinstantaneous. Viscoelastic behaviour,however, may continue throughout theworking life of a component, often overa period of years.
4.2.1 Creep
Under the action of a constant stress,(load), a viscoelastic material undergoesa time dependent increase in straincalled creep or cold-flow. Creep is there-fore the result of increasing strain overtime under a constant load. The creeprate for any material is dependent uponapplied stress, temperature and time.
Creep behaviour is initially examinedusing plots of strain as a function oftime, over a range of loads at a giventemperature. Measurement may betaken in the tensile, flexural orcompressive mode. In the tensile mode,a test specimen is subjected to aconstant tensile stress and the change inlength is measured as a function of time.The resultant stress/strain/time creepdata are normally presented as curves of
strain versus log time. Point A in■ F IGURE 16 illustrates the initialdeformation due to the applied load ona specimen. Up to this point, theresponse is elastic in nature andtherefore the specimen will fully recoverafter the load is removed. However,continued application of the load willresult in a gradual increase indeformation over time to point B; inother words, it ‘creeps’. In the flexuraland compressive modes, the specimen issubjected to either a constant bendingor compressive load and the deflectionis measured as a function of time.
The data may also be presented in otherforms to suit particular requirements.Sections taken through the creep curvesat constant times produce isochronousstress/strain curves, whilst isometricstress versus log time can be derivedfrom constant strain.

26
Design gu ide 4 Design fo r behav iour over t ime
4.2.1.1 Creep recovery
If the long-term process of creep isinterrupted by removing the load, animmediate but partial elastic recovery inthe deformation of the specimen can beseen, as illustrated in ■ F IGURE 17 frompoint B to point C. This represents therelease of energy stored elastically bythe material when it was first deformedto point A.
As time progresses, recovery continues;in fact, the shape of the curve frompoint B is almost an inverted copy of theshape up to point B. The amount ofrecovery depends upon the type ofmaterial, the applied stress, the tem-perature and the duration of loading.In some cases, there will eventually betotal recovery of the deformation, as
■ F IGURE 17Typical creep recoverydiagram of an amorphousthermoplastic, assuming noplastic deformation
■ F IGURE
Typical crewith one c
Stra
in
visc
oela
stic
elas
tic
A
0
illustrated by point D in ■ F IGURE 17 ,whilst in others, a significant amount ofpermanent plastic deformation willoccur, as illustrated by point E.
4.2.1.2 Creep failure modes
There are two failure modesencountered under the action of creep.
(a) Excessive deformation When the deformation of a componentexceeds the allowable limit for thatapplication.
(b) Creep Rupture This may result in either a brittle orductile fracture of the component.Measurement of creep rupture isperformed in the same manner as
18ep rapture data,ycle projection
constant stress
B
C
Stre
ss
measure
creep, except that higher stresses areused and time measured to failure.Results are usually presented as logstress versus log time to failure, as in■ F IGURE 18 .
4.2.1.3 Apparent Modulus
Though creep and creep rupture datagive an indication of the long-termbehaviour of a material, for practicaldesign purposes the correspondingreduction in modulus over time is ofgreater value. If a calculation isperformed on a component subjected toa continuous load, and short-termmoduli such as E, (modulus ofelasticity),or G, (shear modulus), are used, theresult is likely to be misleading sinceneither E nor G reflect the effects of
Log Timevi
scoe
last
ic
elas
tic
permanantdeformation
E
D
Log Time to failure
d data
one cycle projection

Design gu ide 4 Design fo r behav iour over t ime
creep. When the stress level andtemperature are known and creepcurves are available at the giventemperature, an apparent or creepmodulus, Eapp. may be calculated usingthe creep curves;
s1Eapp. = ec
Where;s is the calculated stress level. ec is the strain from the creep curve
at a given temperature and time.
The value Eapp. can then be substitutedfor E, or the like, in standard structuraldesign equations. Creep modulus curvesor log creep versus log time at eitherconstant stress or strain are usually de-rived from creep data, see ■ F IGURE 19 .
Stra
in
Log Time
Ap
par
ent
Mod
ulu
s (G
Pa)
2.5
2.0
1.5
1.0
0.5100 101 102 103 1
e1 e
4.2.2 Stress relaxation
Unlike creep where the strain increasesover time, stress relaxation is thereduction in stress in a component overtime under a constant strain. The areawhere stress relaxation is of greatestimpact is in component assembly. Thisincludes threaded assembly, inserts,press-fits and snap-fits, although anycomponent undergoing long-termdeformation may be affected to somedegree.
Initially, the material is subjected to astrain e1 which is maintained for a longperiod, that is to e2, (see ■ F IGURE 20).The immediate response of the materialwhen the strain is applied is an increasein stress from zero to s1. This value istemperature dependent and tends todecrease as a function of time, that is to
s2,(see ■ F IGURE 21).Log Time (s)04 105 106
23°C
40°C
60°C
■ F IGURE 19Typical CreepModulus curve ofApparant Modulusversus Log Time fora given material atdifferenttemperatures
Stre
ss■ F IGURE 20Graph illustratingconstant strainover time2 s1
Stress relaxation data can be generatedby applying a fixed strain to a sampleand measuring the gradual decay ofstress over time. The resultant data canthen be used to generate stressrelaxation curves which are very similarto isometric strain curves.
Stress relaxation data can be used togenerate a relaxation modulus, similarto the creep modulus.However, relaxation data are not ascommonly available as creep data.In such instances, however, it is possibleto approximate the decrease in load dueto stress relaxation by using the creepmodulus, Eapp.
The use of standard moduli, (E or G ),in structural calculations, is inapprop-riate for the long-term structuralperformance of assembled components
as it does not reflect the effects of stressrelaxation.27
Log Time
■ F IGURE 21Graph illustratingstress relaxationover time forconstant strain
s2
28
Design gu ide 4 Design fo r behav iour over t ime
■ F IGURE 22Typical fatigue curvefor a material with afatigue limit
4.2.3 Design considerations
Creep is often a critical concern whendesigning a structural part in thermo-plastics. Although data exist for specifictimes, stress levels and temperatures,it is often difficult for engineers totranslate this data into structuralanalyses relevant to their application.Since the process of individual testingover long time periods is not feasible,methods of interpolating andextrapolating data from short-termbehaviour are necessary.
Several methods for extrapolatingtime/strain data exist, each with theobjective of obtaining the most accuratefit to the actual data, while givingreasonable extrapolation predictions forlonger time periods. From workperformed within GE Plastics, it was
Stre
ss
S-N curve
Fatigue Limit
determined that for its materials thebest fit for the data appeared to be givenby a quadratic function of log time.However, engineering judgement mustbe used concerning the extent of theextrapolation in time. It is not recom-mended that the extrapolation exceedmore than one unit of logarithmic timeand a strain/elongation limit of 20%of the yield or ultimate stress/strengthvalue for the material being analyzed.It should be noted that althoughamorphous materials give a single curvewhen interpolating to other tempera-tures, for semi-crystalline materials two
■ F IGURE 23Typical fatigue curvefor a material with anendurance limit
Log Time to failure
Stre
ss
plots are required to create the curve,one above and one below the glasstransition temperature (Tg) of thematerial.
4.3 Dynamic time dependentphenomena
4.3.1 Fatigue
This is the process by which a material isstressed repeatedly or in some definedcyclical manner. The magnitude of theloading is usually of such low value thatfailure would not normally be expected
Log Cycles to failure
Endurance Limit
were it applied only once. Additionally,the loading and its frequency ofapplication may vary in value.
Structural components subjected tovibration, components subjected torepeated impacts, reciprocatingmechanical components, plastic snap-fitlatches and moulded-in plastic hingesare all examples of applications wherefatigue can play an important factor.Cyclic loading can result in mechanicaldeterioration and fracture propagationthrough the material, leading toultimate failure.
Fatigue tests are usually conductedunder flexural conditions, thoughtensile and torsional approaches arealso possible. A specimen of material isrepeatedly subjected to a constantdeflection at constant frequency, andthe number of cycles to failure isrecorded. The procedure is thenrepeated over a range of deflections.The test data are usually presented as aplot of log stress versus log cycles; this iscommonly referred to as a S -N curve.
4.3.1.1 Fatigue and endurance limits
The most important features of anS -N curve are;
· The greater the applied stress or strain,the fewer the cycles a specimen willsurvive.
· The curve gradually approaches a con-stant value, known as the fatigue limit,as illustrated in ■ F IGURE 2 2 . Below thisvalue of stress or strain failure is veryunlikely. Some materials do not exhibita fatigue limit and for these materials anendurance limit is specified. This is thevalue of stress or strain at a statednumber of cycles beyond which thespecimen will fail, (see ■ F IGURE 2 3).

Design gu ide 4 Design fo r behav iour over t ime
■ F IGURE 24Microscopic view ofsurfaces in contact
ear bond plane of motion
normal reactionbetween surfaces
4.3.1.2 Factors affecting fatigue
S-N curves, obtained under laboratoryconditions, may be regarded as ‘ideal’.However, practical conditions usuallynecessitate the use of a modified fatigueor endurance limit, as other factors mayaffect performance. These include:
Type of loading Results of tests performed under flexuremay not be directly applicable tocomponents subjected to axial ortorsional loading.
Size of component A deterioration in fatigue properties isusually experienced with increasingphysical dimensions.
Mean stress Amplitudes about a tensile mean stress
reduce fatigue and endurance limits,whereas an increase occurs when themean stress is compressive.Loading frequency At high frequencies, an increase intemperature may be experienced ifinadequate provision for heatdissipation exists. This may lead todeterioration in fatigue properties.
Amplitude The onset of fatigue failure may also beaccelerated at low frequency underconditions of high amplitude.
Fatigue testing provides only anindication as to a given plastic material’srelative ability to survive fatigue.Therefore, it is essential that tests areperformed on actual mouldedcomponents under actual end-useoperating conditions, in order todetermine the true fatigue enduranceof that component.
4.3.2 Wear resistance
Wear can be described as the reductionof a bearing surface due to the loss ofmolecular adhesion as a result ofmechanical friction, (see ■ F IGURE 24).There is no apparent consistentrelationship between friction and wear;friction may be high and wear low, andvice versa.
4.3.2.1 Types of wear
Adhesive wear Surface shearing, deformation andremoval of material at the points ofadhesion.
Abrasive wear Surfaces of different hardness incontact, with grooves being ploughed inthe softer material, the presence of an
w
abrasive medium and erosion abrasiondue to particles impacting the surfaces.
Fatigue Surface fatigue failure as a result ofsurface or sub-surface stress exceedingthe endurance limit of the material.
4.3.2.2 Factors affecting wear
The wear resistance of a thermoplastic isdependent on the environmentalconditions of the end-use application.
Temperature, surface contamination,(chemicals, grease, etc.), surfacestructure and contouring, all have aninfluence on wear resistance. Changesin the wear process occur with thedegree of surface roughness of thebearing materials. In the case of plastics,this is strongly dependent on themodulus of elasticity, (E-modulus), ofthe materials being used.Optimally moulded surfaces of Valox®
PBT resin components have a relativesmoothness which makes them ideallysuited to low friction, high wearresistance applications over a widerange of operating conditions.
29
In general, Valox resins exhibit very lowcoefficients of static and dynamicfriction against metals and also againstsimilar Valox resins. Other semi-crystalline resins generally exhibit anappropriate wear resistance againstmetals but invariably may not besuitable for applications where they bearagainst themselves. It is important to remember that theoperating environment of the end-useapplication should be taken intoconsideration when using frictionalvalues for engineering design purposes.

5
Design fo r impactper formance
■ F IGURE 25Graph illustratingeffect of tempera-ture upon impactresponse
Imp
act
valu
e
Ductile/brittle transition
Ductile behaviour
5.1 Introduction
Impact strength can be described as theability of a material to withstand animpulsive loading. By definition, anybody in motion possesses kinetic energyand, when this motion is stopped, theenergy must be dissipated.
There are several factors whichdetermine the ability of a plasticcomponent to absorb impact energy:
· Type of material · Wall thickness · Geometric shape of component · Size of component · Operating temperature · Rate of loading · Stress state induced by loading
For ductile polymers, the load at which
Temperature
Brittle behaviour
■ F IGURE 26Typical force/timecurves for ductileand brittle materialresponses, as
Forc
e
Forc
e
Brittle polymerDuctile polymer
yielding occurs in a component isaffected by the operating environmentas illustrated by the last three factorsdetailed above. Of even moresignificance to design is the fact that,under the appropriate circumstances,the impact behaviour of a ductilepolymer will undergo a transition fromductile and forgiving in its response, tobrittle and catastrophic.
Usually this change in behaviour isdescribed in terms of a transitiontemperature above which the failure ismore ductile in nature, and belowwhich it is more brittle, as illustrated in■ F IGURE 25 . However, both rate ofloading and stress state have an effecton this transition temperature.
5.2 Common impact testing methods
A number of tests are commonly used toprovide insight into the response ofplastics to impact loadings. Two generictypes of testing exist, pendulum andfalling weight methods. It is importantto note that none of these traditionaltest methods results in real, geometryindependent material data which can beused in engineering design calculations.
Time
Energie absorbed by specimen
They can be useful in applications forquality control and initial materialcomparisons, but even in this latter roledifferent tests will often rank materialsin a different order. Typical traces forboth ductile and brittle response to aninstrumented impact measurementsystem are illustrated in ■ F IGURE 26 .
31produced by aninstrumentedsystem
Time
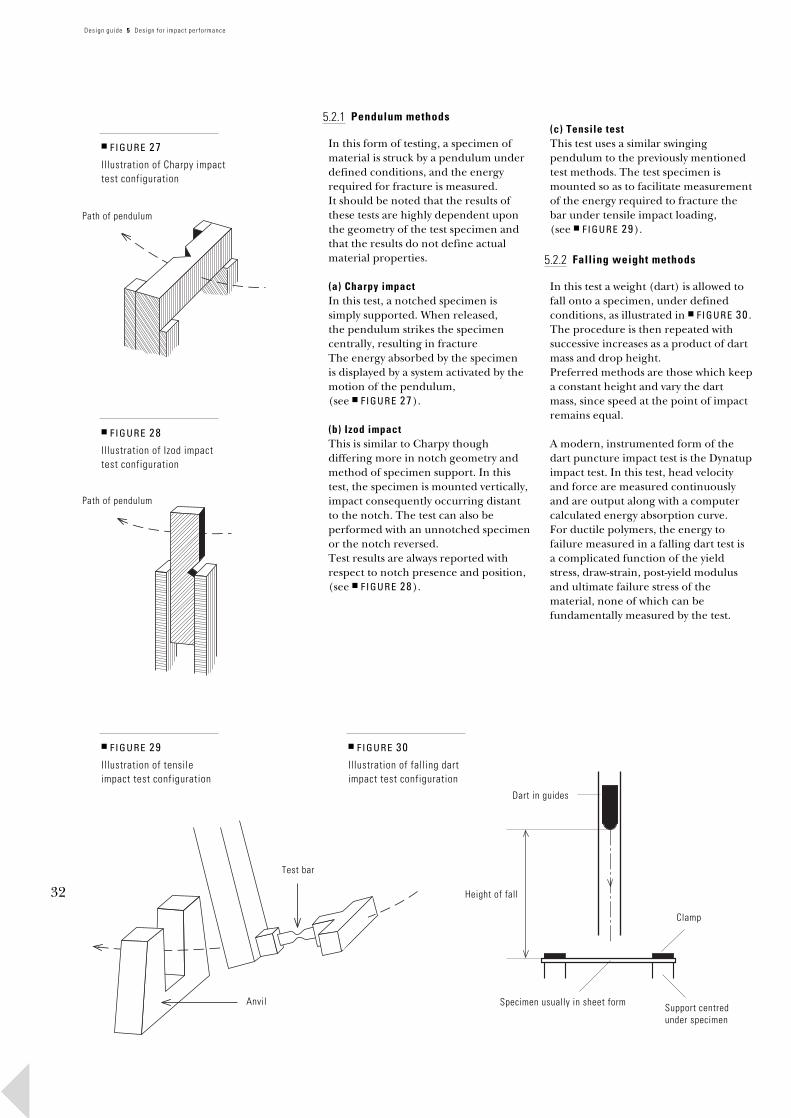
32
Design gu ide 5 Design fo r impact per formance
■ F IGURE 27Illustration of Charpy impacttest configuration
■ F IGURE 28Illustration of Izod impacttest configuration
Path of pendulum
Path of pendulum
■ F IGURE 29Illustration of tensileimpact test configuration
Test bar
Anvil
5.2.1 Pendulum methods
In this form of testing, a specimen ofmaterial is struck by a pendulum underdefined conditions, and the energyrequired for fracture is measured.It should be noted that the results ofthese tests are highly dependent uponthe geometry of the test specimen andthat the results do not define actualmaterial properties.
(a) Charpy impact In this test, a notched specimen issimply supported. When released,the pendulum strikes the specimencentrally, resulting in fractureThe energy absorbed by the specimenis displayed by a system activated by themotion of the pendulum,(see ■ F IGURE 27).
(b) Izod impact This is similar to Charpy thoughdiffering more in notch geometry andmethod of specimen support. In thistest, the specimen is mounted vertically,impact consequently occurring distantto the notch. The test can also beperformed with an unnotched specimenor the notch reversed.Test results are always reported withrespect to notch presence and position,(see ■ F IGURE 28).
■ F IGURE 30Illustration of falling dartimpact test configuration
Dart in
Specimen
Height of fall
(c) Tensile test This test uses a similar swingingpendulum to the previously mentionedtest methods. The test specimen ismounted so as to facilitate measurementof the energy required to fracture thebar under tensile impact loading,(see ■ F IGURE 29).
5.2.2 Falling weight methods
In this test a weight (dart) is allowed tofall onto a specimen, under definedconditions, as illustrated in ■ F IGURE 3 0 .The procedure is then repeated withsuccessive increases as a product of dartmass and drop height.Preferred methods are those which keepa constant height and vary the dartmass, since speed at the point of impactremains equal.
A modern, instrumented form of thedart puncture impact test is the Dynatupimpact test. In this test, head velocityand force are measured continuouslyand are output along with a computercalculated energy absorption curve.For ductile polymers, the energy tofailure measured in a falling dart test isa complicated function of the yieldstress, draw-strain, post-yield modulusand ultimate failure stress of thematerial, none of which can befundamentally measured by the test.
guides
usually in sheet form
Clamp
Support centredunder specimen

Design gu ide 5 Design fo r impact per formance
5.3 Design considerations
It is well-established that strain rate andtemperature have a distinct effect uponthe yield stress, (sigma-yield), of apolymer. The relationship betweenstress and strain rate takes the form:
sigma-yield = B1 + B2 * In (strain rate)
where B1 and B2 depend upon thepolymer and the temperature.In general, higher rates and lowertemperatures lead to high yield stresses,and lower rates and higher tempera-tures lead to lower yield stresses.
The interrelationship of strain rate andtemperature with regard to ductile-brittle transitions can be seen in■ F IGURE 31 . Two sets of curves areshown, one describing the brittle stress
at two strain rates for a hypotheticalpolymer as a function of temperature;the other describing the yield stress ofthe same material for the same strainrates.Stre
ss
H - High strain rateL - Low strain rate
H
L
Although the brittle failure stress usuallyshows only a small dependence on rate,the yield stress is affected much moresignificantly. Furthermore, the yieldstress usually also shows a strongerdependence on temperature than thebrittle failure stress as reflected in thesteeper yield curves as a function oftemperature. The net effect is that, asthe strain rate is increased, thetransition temperature defining theboundary between ductile and brittlefailure moves to a higher level.
Due to the many factors which caninfluence the ability of a plasticcomponent to absorb impact energy,combined with the problem of relatingstandard test results to applicationrequirements, it is recommended thatall final designs be fully tested forapplications where impact is a seriousperformance issue.
33
Temperature
Brittle stress O-B
Yield stress O-Y
■ F IGURE 31Graph illustrating ductile-to-brittle transition infailure
H
L

6
Design fo rappearance
■ F IGURE 32Styling features can be appliedto hide sinkmarks caused by ribsor bosses
6.1 Introduction
This Chapter looks at applying guide-lines to achieve the best possible surfaceappearance for parts produced by theinjection moulding process withengineering thermoplastic materials.
6.1.1 General remarks
The nature of the polymer chosen is animportant factor in obtaining a goodsurface finish. Glass-filled materials ingeneral have a relatively poor surfacefinish compared to unfilled polymers. The discussion about surface quality ofinjection moulded parts is not really anobjective one, because the perception ofquality is different from person toperson. The topics discussed in thischapter therefore should be consideredas guidelines to create surfaces with
■ F IGURE 33Gas-assist Injection MouldingTechnology can be used toreduce the sinkmark behind theboss. Gloss differences howevermay occur!
minimized defects rather than absolutequality criteria.
6.2 Surface defects
The surface defects discussed below areonly a selection of the wide varietywhich is possible, and are more or lessrelated to design. It should be notedthat mould steel quality and surfacefinish of the cavity play a major role inhiding surface defects.
6.2.1 Sink marks
Sink marks typically occur where
35
■ F IGURE 34The position of the gatedetermines the location of theweldline. Around apertures acorner is quite often the bestlocation to position a weldlinefrom cosmetic point of view.
weldline
gate
projections such as ribs or bosses meetthe main surface of a plastic compo-nent. The cause of this type of sink markis the local increase of thickness at thelocation of the projection in the visiblemain wall, which suffers a higher thanaverage shrinkage. (Refer to Chapter 8‘Design for Mouldability’, ■ F IGURE 50and 51). To minimize this effect, themating wall thickness should be keptdown to 50% of the main wall.
The amount of shrinkage is alsoinfluenced by gate design, material typeand process conditions. The risk remains
that a slight sink mark will occur,especially far away from the gatingpoint. A textured finish to the cavity wallmight hide the defects but it is seldompossible to create a high quality surfacewhen applying ribs, bosses or suddenwall thickness transitions.
A compromise can be found by usingstyling features like grooves or a step inthe surface where a rib is mating thecritical surface, (■ F IGURE 32).Gas-assisted injection moulding is atechnique which can greatly reduce sinkmarks, but gloss differences are difficultto avoid, (■ F IGURE 33). It has to berealized that locations far away from thegating points, combined with thin wallsand a relatively small gating system,increase the risk of unacceptable
sinkmarks.6.2.2 Weld lines
A further phenomenon causing possiblesurface defects is the formation of weldlines which occur where flow frontsmeet. It is recommended to locate theinjection points in the least sensitiveareas, (■ F IGURE 34), consideringcritical locations such as around holesor between gating points.
Flow simulation is a very useful way ofpredicting the location of weld linesbefore the gating system is cut into themould. Adequate venting in the weldline areas at the outer edge can reducethe visibility of weld lines, but, in mostcases, will not eliminate them.
6.2.3 Air traps
Air traps are undesired areas in amoulding which occur when there isinsufficient venting at the edge of amoulding, or when air is trapped as theouter area of a component fills beforethe area closest to the gate.This can result in burned spots dueto diesel effects.

36
Design gu ide 6 Design fo r appearance
possible airtrap or material damage
flow direction
flow direction
■ F IGURE 35Sharp transitions might causethe plastic to loose contact withthe mould for a short period oftime. This can result inairtrapping.
Improved design
Quite often this can be avoided by aslight wall thickness increase betweenthe gating point and the air tra flowleader.
Rib shapes blindly spark-eroded into amould can also cause air traps.This might cause problems when fillingthe rib, and the material might overheatby diesel effects. Venting has to beprovided in this case by ejector pins,porous inserts or other ventingconstructions.
Air traps can also occur on the surfaceof a part when sudden changes in wallthickness occur. The melt stream locallyloses contact with the cavity surface and,as pressure builds up, is then forcedagainst the surface with a volume of airbetween the plastic and the mould.This air is compressed at very high
speeds, which can raise the temperatureand degrade the surface locally, (referto ■ F IGURE 35). In practice this cancause for example bad paint adhesionor poor impact behaviour.6.2.4 Voids
Voids can be described as air bubbleswhich are only visible in transparentmaterials such as Lexan® resin.They can occur in very thick areas of acomponent and are caused by excessiveshrinkage. Normally this phenomenoncan be avoided by not using thicksections relative to the rest of the part.If these cannot be avoided, special careshould be taken to design a largeenough gating system and applysufficient packing pressure and time.
Voids can also occur due to insufficientpredrying or too much decompressionin the barrel in front of the screw.
6.2.5 Streaks
Streaks on the surface of a plasticcomponent can be caused by moisture,degradation in the machine barrel orhot runner system or by overshearing.Looking at the relationship with design,overshearing can occur due to a gatebeing too small. Computer simulationcan help to determine the level ofshearing and adapt the gate or runnerdimensions to achieve an acceptablelevel of shear. Typical safe shear levels ingates are 20.000 - 25.000 sec-1 for GEPlastics’ engineering thermoplastics.
6.2.6 Delamination
Delamination occurs when there isinsufficient adhesion between thefrozen skin and the molten innermaterial of a plastic component and,consequently, layers can be peeled offeasily. The main causes are processingwith material which is too hot and/orwith injection rates which are too high.If the problem cannot be solved byslower injection rates and suitable meltconditions, the gating system can bemodified with larger gate and runnerdimensions. This will reduce shear ratewhich can be one of the causes of localmaterial degradation.
6.2.7 Jetting
Small gate openings directing thepolymer flow into an open space can
cause jetting. The polymer expandsafter passing the gate, cools rapidly andbuilds a strand of relatively coldmaterial in the cavity, (see ■ F IGURE 3 6).After a certain time, pressure builds upin the cavity and the remaininginjection volume fills the cavitynormally. The initial cold strand isvisibly embedded in the rest of thepolymer and causes a reduction in themechanical strength of the material. To avoid jetting, gates should bepositioned so that the polymer stays incontact with the cavity wall after passingthe gate opening, (■ F IGURE 3 7).Injection speed and melt temperaturecan also influence jetting to a certain
extent; the lower the injection speedand melt temperature, the lesser therisk of jetting.6.2.8 Gate marks
When small gate openings are used incombination with high injection speeds,there is a risk of gate marks. These willshow up in general as matt spots aroundthe gate area. The explanation of thisphenomenon is that the material isextremely highly oriented in and
directly after the gate. The outer layer isfrozen in this highly oriented situation.After filling, the inner layer can relaxmuch more than the oriented thin outerlayer. This creates high stress levelsduring cooling, causing micro cracks.These will again show up as matt spots,because the light refraction is differentcompared to the environment of thegate area. This problem can also bereduced by larger gate and runnerdimensions and slower injection speeds.
Design gu ide 6 Design fo r appearance
■ F IGURE 36Small gates positioned oppositeopen cavity area can producejetting. The strand cools downand later on is embedded in thepart, causing bad cosmetics andlower mechanical properties.
Side view
Top view
6.2.9 Summary
Surface defects can be divided intothe following categories:
(a) Material degradation Material degradation can occur in themachine barrel or the hot runnersystem, (refer to Chapter 7 for process-related factors). Hot runner systems arequite often the cause of materialdegradation. Wrong dimensions,inadequate temperature control, andhang up areas are the most importantfactors. Flow simulation can help todetermine the correct hot runnerchannel diameters. They should be bigenough to prevent overshearing andsmall enough to achieve reasonableresidence times.
(b) Moisture in the material
■ F IGURE 37To avoid jetting put the gate insuch a way that pressure isbuild up immediately in thebeginning of the filling stage.
This problem can be prevented byproper predrying of the material beforemoulding. Water leakage in the mouldcan also be a cause of moisture streaks.
(c) Component design Wrong wall thickness ratios of bosses,ribs and other projections are commoncauses of sink marks. Basic designprinciples can help to avoid certainsurface defects. A typical ratio forfeatures perpendicular to the visiblesurface is 50% of the main wallthickness. The location of the featurerelative to the gate position isimportant: the further away from thegate, the bigger the risk of sink marks.
Wall thickness transitions are anothercause of visible marks on the surface ofthe part. These should be smooth and
37
If the design can not be changedaccording the exampleillustrated above, an ejectorpincan be used for gating.
not sudden.
Sharp corners in a mould can cause airtraps or damage the passing material.This should be avoided wheneverpossible.
(d) Runner and gate design Small cold runners and gates createhigh shear rates and temperatures inthe melt during the filling stage which,as discussed, can cause several types ofsurface defect. Flow simulation canassist in determining runner and gatesizes to achieve acceptable shear andpressure levels.

7
Design fo r prec is ion
7.1 Introduction
Designing for precision can be definedas applying guidelines when designing acomponent and the correspondingmould, to mass produce thermoplasticcomponents using the injectionmoulding process, within as narrow aspossible dimensional tolerances.The discussion of precision is stronglyrelated to the way a plastic componentshrinks after the injection mouldingprocess. This chapter deals with variousshrinkage mechanisms which occurboth during moulding and as secondaryeffects.
7.1.1 Mould shrinkage
Shrinkage or mould shrinkage can bedefined as the difference between themoulded component dimensions and
■ F IGURE 39Corners are difficult to cool atthe same rate internally andexternally. Tendency to distort.
the corresponding mould cavitydimensions. Normally this phenomenonis expressed as an average percentage.This is used by the mould maker to addto the desired component dimensions asa target for the mould dimensions.
As can be seen in ■ F IGURE 38 , theshrinkage of a component is a time/temperature related process. Most ofthe shrinkage occurs directly after part
Shri
nka
ge %
ejection. As the part cools down to roomtemperature, final mould shrinkage willbe reached. Quite often thisphenome-non creates warped parts, because theshrinkage of the component duringcooling to room temperature is noteven, depending on the design and theinjection moulding process.
7.1.2 Secondary effects
Sometimes components are heated aftermoulding for example during paintcuring. This operation can also causeboth permanent and temporarydimensional changes. External loads and moisture absorptionhave an added influence on dimensions.
7.2 Shrinkage phenomena
There are three key factors governingshrinkage behaviour: cooling, packingand orientation.
7.2.1 Cooling
Uneven cooling can cause differentialshrinkage. Uneven cooling is caused bymould surface temperature differencesduring the cooling process.
Time
■ F IGURE 38Most of the shrinkageoccurs directly afterpart ejection. As partcools down to roomtemperature finalmould shrinkage willbe reached
This problem can be minimized byoptimizing the cooling circuit.This means minimizing the temperaturedifference of the cooling medium between the beginning and the end ofcooling circuits, and selecting the rightdistance to the cavity wall and the rightdistance between channels.
Areas which are difficult to cool can beavoided by part design or through theuse of highly conductive metals in therelevant sections. Corners are difficultto cool evenly, as there is always thetendency for the outside to cool fasterthan the inside. As can be seen in■ F IGURE 39 , this phenomenon cancause walls of boxes to warp inwards.
39Applying a generous radius thecooling can be more even, henceless problems with distortion

40
Design gu ide 7 Design fo r p rec is ion
This effect can be reduced by givingthe corners an internal radius and bykeeping wall thickness constant.Location of cooling lines inside the partcan be optimized by positioning thechannel closer to the corner.Computer simulation programmes canassist in this process.
Depending on the nature of the plasticused, the level of mould temperaturedetermines the degree of crystallinity,which has an influence on the level ofvolumetric shrinkage.
7.2.2 Packing
The packing or holding pressure phasehas a significant effect on shrinkage.In general, the higher the holdingpressure and the longer it is effective,the smaller the shrinkage.
■ F IGURE
Typical PVrelationshamorphousHigher holpressure rvolumetric
Typical PVrelationshcrystallineCrystallineshrink moramorphousto crystall
This can be explained by the PVTrelationship of thermoplastics,(see ■ F IGURE 40).
In order to really influence the packingstage, it is important to createsufficiently large gate openings and coldrunners as the moment of gate orrunner freeze-off determines the end ofeffective packing.
7.2.3 Orientation
The third important factor related toshrinkage behaviour is the orientationof molecules and fibres. Orientationeffects cause different shrinkage in flowand cross-flow direction, which caninfluence the flatness of partssignificantly.Apart from material choice, the methodof gating plays a major role.
Spec
ific
Vol
um
e
Spec
ific
Vol
um
e m
3 /kg
Troom
40Tip for plastics.
dingeduces shrinkage
Tip for semi- plastics. materialse than ones due
inity.
V50V150
7.3 Materials and shrinkage
7.3.1 Amorphous materials
Amorphous materials exhibit lowershrinkage than semi-crystallinematerials. Furthermore, the levels ofshrinkage in flow and cross-flowdirection are closer for amorphousmaterials. It is therefore easier to produce preciseparts with amorphous, unfilledmaterials than with fibre-filled or semi-crystalline materials.Typical examples of GE Plastics’materials with a mainly amorphouscharacter are Lexan® polycarbonate,Ultem® polyetherimide resin, Cycolac ®
ABS resin, Cycoloy® polymer blend andNoryl® PPO® resin.
Temperature
TemperatureTfreeze
P0 MPa
P50 MPa
P100 MPa
P150 MPa
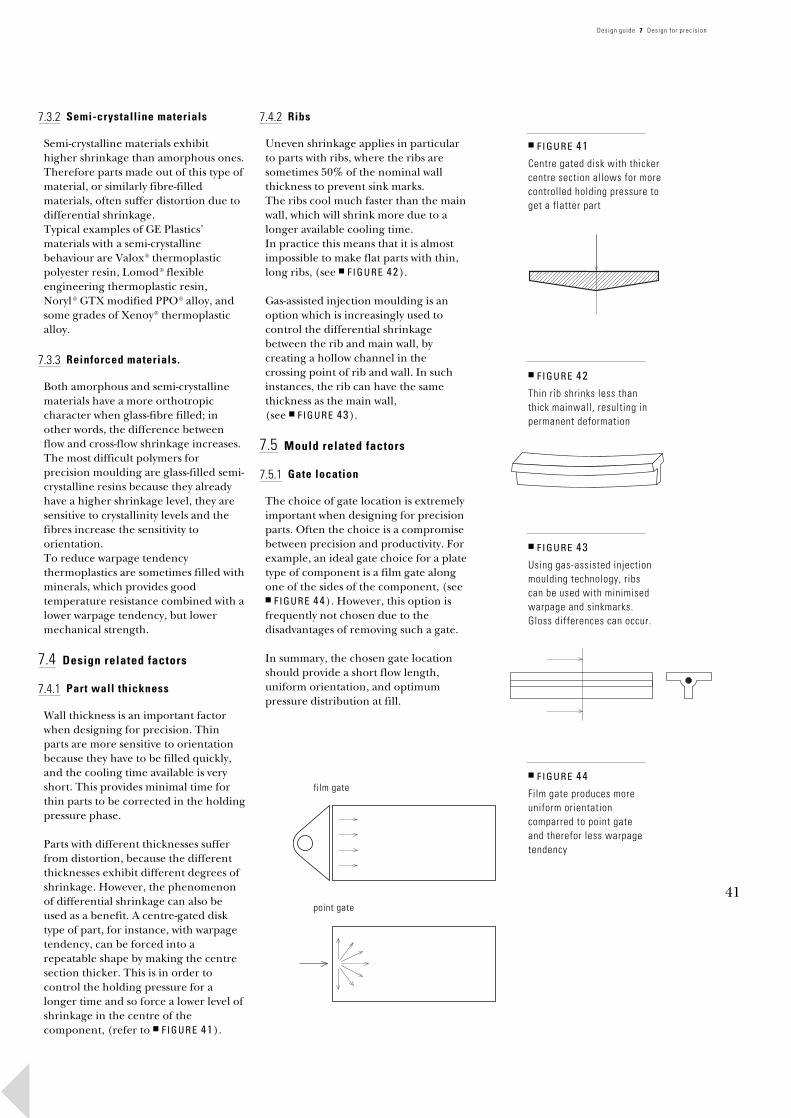
Design gu ide 7 Design fo r p rec is ion
■ F IGURE 42Thin rib shrinks less thanthick mainwall, resulting in
■ F IGURE 41Centre gated disk with thickercentre section allows for morecontrolled holding pressure toget a flatter part
7.3.2 Semi-crystalline materials
Semi-crystalline materials exhibithigher shrinkage than amorphous ones.Therefore parts made out of this type ofmaterial, or similarly fibre-filledmaterials, often suffer distortion due todifferential shrinkage. Typical examples of GE Plastics’materials with a semi-crystallinebehaviour are Valox® thermoplasticpolyester resin, Lomod® flexibleengineering thermoplastic resin,Noryl ® GTX modified PPO® alloy, andsome grades of Xenoy® thermoplasticalloy.
7.3.3 Reinforced materials.
Both amorphous and semi-crystallinematerials have a more orthotropiccharacter when glass-fibre filled; in
permanent deformation■ F IGURE 43Using gas-assisted injectionmoulding technology, ribscan be used with minimisedwarpage and sinkmarks.Gloss differences can occur.
other words, the difference betweenflow and cross-flow shrinkage increases.The most difficult polymers forprecision moulding are glass-filled semi-crystalline resins because they alreadyhave a higher shrinkage level, they aresensitive to crystallinity levels and thefibres increase the sensitivity toorientation.To reduce warpage tendencythermoplastics are sometimes filled withminerals, which provides goodtemperature resistance combined with alower warpage tendency, but lowermechanical strength.
7.4 Design related factors
■ F IGURE 44Film gate produces moreuniform orientationcomparred to point gateand therefor less warpage
film gate
7.4.1 Part wall thickness
Wall thickness is an important factorwhen designing for precision. Thinparts are more sensitive to orientationbecause they have to be filled quickly,and the cooling time available is veryshort. This provides minimal time forthin parts to be corrected in the holdingpressure phase.
Parts with different thicknesses suffer
41
tendency
point gate
from distortion, because the differentthicknesses exhibit different degrees ofshrinkage. However, the phenomenonof differential shrinkage can also beused as a benefit. A centre-gated disktype of part, for instance, with warpagetendency, can be forced into arepeatable shape by making the centresection thicker. This is in order tocontrol the holding pressure for alonger time and so force a lower level ofshrinkage in the centre of thecomponent, (refer to ■ F IGURE 41).
7.4.2 Ribs
Uneven shrinkage applies in particularto parts with ribs, where the ribs aresometimes 50% of the nominal wallthickness to prevent sink marks.The ribs cool much faster than the mainwall, which will shrink more due to alonger available cooling time.In practice this means that it is almostimpossible to make flat parts with thin,long ribs, (see ■ F IGURE 42).
Gas-assisted injection moulding is anoption which is increasingly used tocontrol the differential shrinkagebetween the rib and main wall, bycreating a hollow channel in thecrossing point of rib and wall. In suchinstances, the rib can have the samethickness as the main wall,(see ■ F IGURE 43).
7.5 Mould related factors
7.5.1 Gate location
The choice of gate location is extremelyimportant when designing for precisionparts. Often the choice is a compromisebetween precision and productivity. Forexample, an ideal gate choice for a platetype of component is a film gate alongone of the sides of the component, (see■ F IGURE 44). However, this option isfrequently not chosen due to thedisadvantages of removing such a gate.
In summary, the chosen gate locationshould provide a short flow length,uniform orientation, and optimumpressure distribution at fill.

42
Design gu ide 7 Design fo r p rec is ion
7.5.2 Gate type
The gate type is often predeterminedfor cosmetic or economic reasons.As with gate location, a compromise isoften necessary in its selection, becauseof the difficulty in combining optimumprecision, cosmetics and cost efficiency.
There are basically two gate types: theround gate like tunnels, direct spruesand pinpoints, and the rectangular-shaped gate such as tab gates and filmgates. It can be said that, in general,point gates create high orientationlevels in the gate area, which willfrequently lead to distortion, whereaswider film or tab gates tend to bring amore uniform orientation into acomponent.
If a point gate is really essential,
sometimes an increase in the number ofgating points can bring a more uniformorientation pattern to a component,as well as giving better control in theholding pressure stage due to shorterflow lengths.7.5.3 Gate size
Small gates create more shear,orientation and pressure loss thanlarger ones. They also limit the effect inthe packing stage. In general, the gatediameter or thickness should be at least60% the thickness of the main wall,although preferably larger, in order toprovide the largest possible processingwindow. Film gates have the advantage
of producing a low shear rate anduniform orientation, but are moredifficult to remove after moulding.7.6 Processing related factors
7.6.1 Melt temperature
Melt temperature has an effect onshrinkage as an absolute value. Lookingat shrinkage differences is lesssignificant. Of course a higher melt maylead to a reduced average shrinkagepercentage, and hence to lessdifferences, but it is not a major factorin shrinkage control within acomponent.
7.6.2 Mould temperature
Mould temperature has an influence onshrinkage. A higher mould temperatureallows for more crystallization of semi-crystalline materials. Furthermore, therelaxation time is longer, which meanssome orientation effects are reduced.
However the cooling times will belonger and extremely high mouldtemperatures require special equipmentlike oil heaters or high pressure hotwater devices.
7.6.3 Injection time
The time to fill a cavity influences theorientation level in a mouldedcomponent: the higher the injectionspeed, the more orientation occurs.
At the same time, the filling speed hasan influence on the temperaturedistribution at the moment the cavity isfilled and the packing pressure starts tobe effective. Depending on geometryand chosen gating, both the orientationand the temperature of the materialhave an effect on the final shape of thepart. The injection phase thereforeplays an important part in controllingthe shrinkage and warpage of aninjection moulded component.7.6.4 Packing pressure
Packing pressure is one of the most
important variables to consider whentrying to control shrinkage. The way acomponent is packed determines thefinal specific volumetric shrinkage ineach area of the component. The moreuniform the volumetric shrinkage overthe whole part, the more likely the partwill come close to the desired shape witha minimum of distortion.7.7 Secondary effects
After ejection and cool down, acomponent can still suffer unwanteddeformation.In particular when temperature changesoccur during usage, there are a numberof phenomena which can temporarily orpermanently cause dimensional changesdue to thermal expansion and postcrystallization.
7.7.1 Thermal expansion
When a component has to perform atelevated temperatures, thermalexpansion will cause the part to becomelarger. Glass- or mineral-filled materialswill suffer less from this phenomenon.If critical stress levels are reached,permanent deformation can occur,(refer to section 7.7.4 - Creep underload).
7.7.2 Moisture absorption
Another effect on dimensions will occurthrough water absorption. PA-basedmaterials such as Noryl® GTX resin areprone to this phenomenon.
7.7.3 Post crystallization
Semi-crystalline materials, such as
Valox®, Noryl® GTX and Lomod® resins,can exhibit post shrinkage, especiallywhen used at elevated temperatures dueto post crystallization.7.8 Simulation techniques
Today several computer programs areavailable to calculate the expectedshrinkage phenomena due to theinjection moulding operation. Theseprograms can assist the design engineer
in evaluating different alternatives ofgating and processing combinations,as well as comparing the shrinkagebehaviour of different materials.Thermal expansion and, to a lesserextent creep, can be computer-simulated with commercially availablenon-linear finite element analysisprograms, (see Chapter 2).

Design gu ide 7 Design fo r p rec is ion
7.9 Summary
Major factors influencing shrinkageinclude:
(a) Material:Amorphous materials exhibit lessshrinkage than semi-crystallinematerials; glass fibres increasesensitivity for orientation but have alower shrinkage.
(b) Gate locationThe choice of gate location dictatesthe orientation of material, whichcan have a dramatic effect onshrinkage and warpage behaviour.
(c) Gate shapeThe size and type of gate caninfluence the level of orientationand hence the shrinkage behaviour.
In addition, the gate and coldrunner size determines theeffectiveness of the packing phase,which has an impact on shrinkageand warpage.(d) Part thicknessWall thickness influences theorientation level of plastic parts: thethinner the wall, the moreorientation due to shorter injectiontimes. Minimum influence on thepacking stage limits the control overshrinkage.
(e) RibsRibs are normally thinner than themain wall thickness to reduce sink
marks. This causes a differentshrinkage in rib and main wall,resulting in distorted parts. Inparticular this is a problem with longribs.(f) Injection speedInjection speed is related to theorientation of the material: thehigher the injection speed, the moreorientation. Especially incombination with small pinpoint
gates, this effect is considerable.The end result will be increaseddifferential shrinkage between flowand cross-flow direction.
(g) Holding pressureThe effect of holding pressure leveland time is one of the most criticalfactors with respect to shrinkage.High and long holding pressurescreate less shrinkage than short andlow holding pressures. The size ofthe gating system has to be takeninto account; a small gating system,(gates and cold runners), can reducethe effects of holding pressuredramatically.
(h) Mould coolingMould temperature differences havea further effect on shrinkage.Temperature variations in the cavity
wall can cause different cooling ratesand hence different degrees ofshrinkage. Therefore mould cavitytemperature should be kept asconstant as possible.(i) Process consistencyIn addition to the basic principlesregarding shrinkage and warpage,the quality and consistency achievedduring processing are critical. Inparticular, temperature of melt andmould, injection profiles andpressure control play a major role inassuring shot-to-shot consistency foraccurate dimensions.
(j) Secondary effectsThe impact of additional loads ondimensional changes of injectionmoulded parts during usage shouldnot be overlooked. Heat loads,mechanical loads and waterabsorption are typical examples ofdetrimental external influences.
43

8
Design fo rmouldab i l i t y
8.1 Introduction
Optimum design for mouldabilityprovides the possibility to obtainthermoplastic parts in their finalfinished shape without any secondaryoperations and with no waste ofmaterial.
The injection moulding process iswidely used for the production of plasticcomponents. In the injection mouldingmachine the material is melted andhomogeneously plasticized by means ofa screw inside a heated cylinder. Themolten and homogeneous plastic massis injected under high pressure via themachine nozzle into the cavity of themould. In the mould cavity the materialis cooled down and the part is ejectedfrom the mould when sufficiently rigid.
gth ■ F IGURE 45
The injection moulding process offersmany advantages. In particular it offersthe possibilities for:
· Highly complex parts· Repeatability of tight tolerances· Moulded-in features like bosses,snap-fits, ribs, undercuts and holes
· High quality surface properties· Ease of automation for largeproduction runs.
8.2 Material issues
45
Flow
len
Wall thickness
melt temp = T1
melt temp = T2
Melt flow length
Injection pressure: xxxMold temperature: xxx
To obtain large parts from an injectionmoulding machine, the material’s flowproperties are critical.These are measured based on melt flowlength and melt temperature.
8.2.1 Melt flow length
The melt flow length of a material is ameasure of how easily a material canflow to fill a part. It indicates the lengththat a material can flow under a specificset of common moulding conditions.Determination of melt flow length isimportant when trying to predict if apart can be filled or not. It is commonly
shown in a graph as flow length versuswall thickness at a variety of initial melttemperatures, (see ■ F IGURE 45).
Melt flow data are generated using aspiral flow tool under processingconditions which are consideredcommon for the material. The initialmelt temperature, mould temperatureand injection pressure must be recordedtogether with the data curve becausethey significantly influence the distanceof flow.
The melt flow length of a material is afunction of viscosity, thermal propertiesand shear properties.
8.2.1.1 Viscosity
Viscosity determines the resistance ofthe material flow due to internalresistance at a given melt temperature.For example, water has a low viscosity,molasses a high viscosity and moltenplastic an even higher viscosity.The internal resistance of the material
Material: xxxx
flow is caused by the internal shearstresses within the melt. From achemical or molecular point of view, theviscosity of a material is a function of themolecular chain length of adjacentpolymers and the strength of thebonding between them. In other words,it is a function of the energy required tocause relative motion between theadjacent molecules.
Factors affecting viscosity: The viscosity of a material will largely bea function of its temperature and of theamount and type of any fillers oradditives present. Viscosity generallyfunctions inversely with respect totemperature: an increase intemperature usually causes a decrease inmaterial viscosity. Fillers and mineral
additives tend to increase viscosity, whileplasticizers, impact modifiers and wearenhancers tend to decrease viscosity.Molecular weight also significantlyinfluences viscosity: higher molecularweight polymers generally have higherviscosities.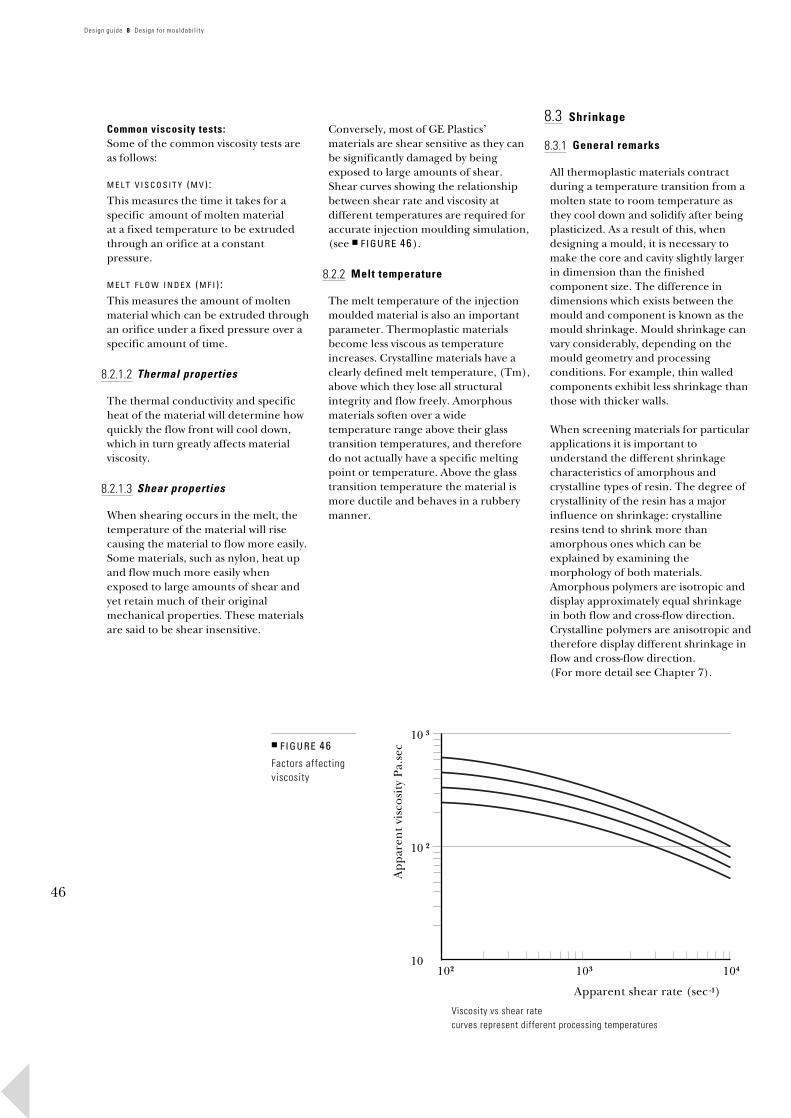
46
Design gu ide 8 Design fo r mouldab i l i t y
Common viscosity tests: Some of the common viscosity tests areas follows:
M E L T V I S C O S I T Y ( M V ) :This measures the time it takes for aspecific amount of molten materialat a fixed temperature to be extruded through an orifice at a constantpressure.
M E L T F L O W I N D E X ( M F I ) :This measures the amount of molten material which can be extruded throughan orifice under a fixed pressure over aspecific amount of time.
8.2.1.2 Thermal properties
The thermal conductivity and specificheat of the material will determine howquickly the flow front will cool down,
which in turn greatly affects materialviscosity.8.2.1.3 Shear properties
When shearing occurs in the melt, thetemperature of the material will risecausing the material to flow more easily.Some materials, such as nylon, heat upand flow much more easily whenexposed to large amounts of shear andyet retain much of their originalmechanical properties. These materialsare said to be shear insensitive.
■ F IGURE
Factors affviscosity
Conversely, most of GE Plastics’materials are shear sensitive as they canbe significantly damaged by beingexposed to large amounts of shear.Shear curves showing the relationshipbetween shear rate and viscosity atdifferent temperatures are required foraccurate injection moulding simulation,(see ■ F IGURE 46).
8.2.2 Melt temperature
The melt temperature of the injectionmoulded material is also an importantparameter. Thermoplastic materialsbecome less viscous as temperatureincreases. Crystalline materials have aclearly defined melt temperature, (Tm),above which they lose all structuralintegrity and flow freely. Amorphousmaterials soften over a widetemperature range above their glass
transition temperatures, and thereforedo not actually have a specific meltingpoint or temperature. Above the glasstransition temperature the material ismore ductile and behaves in a rubberymanner.Ap
par
ent
visc
osit
y P
a.se
c46ecting
Viscosity vs shear ratcurves represent diffe
10 3
10 2
10 2
102
8.3 Shrinkage
8.3.1 General remarks
All thermoplastic materials contractduring a temperature transition from amolten state to room temperature asthey cool down and solidify after beingplasticized. As a result of this, whendesigning a mould, it is necessary tomake the core and cavity slightly largerin dimension than the finishedcomponent size. The difference indimensions which exists between themould and component is known as themould shrinkage. Mould shrinkage canvary considerably, depending on themould geometry and processingconditions. For example, thin walledcomponents exhibit less shrinkage thanthose with thicker walls.
When screening materials for particularapplications it is important tounderstand the different shrinkagecharacteristics of amorphous andcrystalline types of resin. The degree ofcrystallinity of the resin has a majorinfluence on shrinkage: crystallineresins tend to shrink more thanamorphous ones which can beexplained by examining themorphology of both materials.Amorphous polymers are isotropic anddisplay approximately equal shrinkagein both flow and cross-flow direction.Crystalline polymers are anisotropic andtherefore display different shrinkage inflow and cross-flow direction.(For more detail see Chapter 7).
Apparent shear rate (sec -1)
erent processing temperatures
103 104

Design gu ide 8 Design fo r mouldab i l i t y
■ F IGURE 47Mould shrinkage
Mould cavity aim
Moulded component(after cooling)
Mould shrinkageexpressed as %
8.3.2 Warpage
Warpage typically occurs in anisotropicmaterials and is caused by differentshrinkage in flow and cross-flowdirection. Differential shrinkage can be caused byany of the following:
(a) orientation glass fibres With unfilled crystalline resins thegreatest shrinkage is usuallyencountered in the flow direction.With glass-reinforced polymers theshrinkage in the flow direction canbecome less than in cross-flowdirection due to the orientation ofthe fibres. Illustrations of mouldshrinkage can be seen in■ F IGURE 47 and 48 .
(b) geometric asymmetry
gate
mould cavity
■ F IGURE 48Shrinkage of anistropic resins
being moulded
Warpage can also be caused by thepart geometry. If a number ofparallel ribs are used on just one sideof a part which is intended to be flat,shrinkage in the ribs can cause thetop surface to warp.
(c) asymmetric cooling If cooling is not well-distributed inthe part, differential shrinkage canlead to warpage.
(d) highly aligned flow In semi-crystalline polymers, regionsof order tend to align themselveswith flow in parts where there is ahighly oriented flow pattern.
(e) voids
After ejection & cooling(Highly exaggerated)Cross flowshrinkage
If a thick section exists in the part,the material on the outside skin willcool down first and consolidate.As the centre area over the part wallthickness finally cools down and triesto shrink, the outer skin cannotaccommodate it because it hasalready frozen off. As it shrinks, thematerial in the centre area pullstowards the outer skin, forming avacuum bubble or void in the centre.
47flow directionshrinkage
(f) sink marks If a thick section exists in the part inareas such as intersections of thickribs with the nominal part wallthickness, the centre area in thisthick section can cause the surface ofthe outer wall to be distorted orpulled in.
(g) ejection problems If a circular, square or cylindricalshape is moulded, it will shrink onto
the core of the mould if adequate draft is not included. The shrinkagecan pull the sides of the part ontothe core and lock a vacuum whichprevents ejection.
8.4 Cooling time
The cooling rate is important toconsider when designing a plastic partbecause it is the primary determiningfactor of cycle time and thereforeprocessing costs. In general, coolingtime is strongly affected by the thermalconductivity and specific heat of thematerial and the part geometry.
(a) specific heat The specific heat of the materialdictates the thermal energy perdegree of temperature change whichis desired.
(b) thickness The thickest area of the part will bethe last to fully cool down. It willtherefore dictate the amount of timewhich the part must remain in thetool while cooling.
(c) tooling The tooling for the part should bedesigned with cooling lines incritical areas to remove heat. Up to apoint, the greater the capacity of thecooling system, the faster the partcan be cooled and removed from thetool. Once a certain point is reached,the conductivity between the steel
and the plastic in the tool will dictatethe rate of cooling regardless of afurther increase in the coolingsystem’s capacity. It should be notedthat excessively cooled cavities cancause the part surface to shrink awayfrom the cavity wall. This preventsthermal conduction and requiredthermal convection from being theprimary modes of heat transfer,thereby imposing much longercooling times.The cooling rate can be increased bythinning part walls and providingimproved cooling in the tool. Coolingtime for a part is often predicted usingmaterial cooling data. This is presentedin the form of a graph showing coolingtime as a function of maximum partthickness for a specific material. This iscalculated at the recommended melttemperature, under standard mouldingconditions and with adequate mouldcooling.

48
Design gu ide 8 Design fo r mouldab i l i t y
■ F IGURE 49Wall section transition
Sharp - not recommended
Tapered - better
Gradual - recommended
Direction of flow during injectionmoulding of compact resins
■ F IGURE 50Projection
part wallR
8.5 Design considerations
8.5.1 General remarks
When designing thermoplasticcomponents, general guidelines shouldbe considered. Exact recommendationsare sometimes impractical, sincevariables such as component geometry,production process and individualrequirements may dictate certain designfeatures.
8.5.2 Nominal wall thickness
The nominal wall thickness forms thebasic frame or shell of a component.All other details are added to this shellstructure and will affect, or be relatedto, the part wall thickness.It is important that the nominal partwall thickness should be correctly
designed. A wall section which is toothin can lead to structural failure orpoor insulation characteristics, whilst awall section which is too thick, evenlocally, can result in appearance defectsand an overweight or over-engineeredcomponent.The actual wall thickness is generallyrelated to the overall size of the part andgate locations. Also the flow characteris-tics of the particular material beingspecified should be taken into account.
Ideally the nominal wall thickness iskept constant due to shrinkage andcooling related issues, but in reality thisis usually impractical.In most applications, a thin, uniformwall with ribs is preferred to a thick wall,for optimum part requirements,strength to weight ratio and costeffectiveness.Where changes in thickness areinvolved, care should be taken that thedirection of the melt flow during themoulding process is always from a thickarea into a thinner section. This flowdirection promotes higher cavitypressures, which minimize sink marks
and reduce the risk that a part cannotbe completely filled. ■ F I G U RE 49 showsa series of wall section transitions, withthe arrows indicating the melt flowdirection during injection moulding.Wall thickness variation influencescooling rates of the moulded compo-nent and unequal thickness causes animbalance of cooling and possible flowproblems during moulding, which canresult in warping and appearancedefects. Additionally, sharp corners actas stress concentrators which can oftenlead to premature failure.
8.5.3 Projections
Due to shrinkage and cooling timerelated issues associated with thicksections, the projection determines thesize of the isolated mass or thickness.The projection can be determined byobtaining a large scale cross-sectionaldrawing of the intersection andinscribing the largest possible circle inthat area, as shown in ■ F IGURE 5 0 .
When considering alternative designsfor this area, the smaller this circle is,the better for cooling. A recommendedapproach is to estimate the radius as thelargest distance in all directions from asmall area of material to reach mouldsteel. This gives the distance which thethermal energy must conduct away fromthat area of material in order to get tothe steel where it can be removed.
8.5.4 Radii
Chapters 2 and 3, stiffness and strength,discussed a large number of mechanicaland performance related reasons forincorporating large radii. They are alsoimportant to the reduction of stressconcentration which can be defined asthe magnification of the level of anapplied stress in the region of a notch,void or hole. In most cases, the stressesin these regions will be far greater thancalculated stresses which are based onassumptions as to stress distribution.
Because of the general notch sensitivityof plastic resins, care should be taken toinclude generous fillets and radii inareas which include sharp changes insection or direction. In addition to these
structural reasons, the avoidance ofsharp corners:* facilitates part ejection: Sharp internalcorners tend to stick in the mould as thepart shrinks onto the core.
* provides smooth flow: Resin flowsmuch more easily and less turbulentlyaround smooth uniformly radiusedcorners than sharp corners.This reduces the pressure drop aroundthe corner, thereby reducing the totalrequired injection pressure.
* reduces shear: Shear induced by flowaround sharp corners can degrade thepolymer’s mechanical properties andcause blush and other aestheticproblems.

Design gu ide 8 Design fo r mouldab i l i t y
■ F IGURE 51Guidelines for proportioningribs
1. Base tickness t ² 0.5 T2. Height h ² 3 T
h
q
t
S
r
T
8.5.5 Ribs
To increase the load carrying ability orstiffness of a plastic structure, it isnecessary to increase either theproperties of the plastic material or thesectional properties of the structure.One method of increasing thecomponent stiffness, without increasingthe overall wall thickness or involving alarge weight increase, is theincorporation of ribs.
Ribs offer structural advantages but theycan also result in warping andappearance problems. To achieve asuccessful rib design the followingguidelines are suggested, (refer also to■ F IGURE 51):
(a)In order to reduce sink marks on prime appearance surfaces, the base
■ F IGURE 52Guidelines for introducingof support ribs
3. Corner radius r ³ 0.25 - 0.4 T4. Draft angle q ³ 0.5°5. Spacing S ³ 2 T
T
D
reinforcing edge
thickness of the rib should notexceed 50% of the adjoining wallthickness. This however, may beincreased when appearance is lesscritical.
(b)To reduce possible overstressing, filling and ejection problems, theheight of the ribs should not exceedthree times the adjoining wallthickness. When increased strengthis required, more ribs of thespecified proportions arerecommended in preference to anincrease in rib height.
1. Component wall thickness T2. Rib thickness A
A
B
Ccomponent wall
(c) A minimum radius of 25% of the adjoining wall thickness should beincorporated at the base of the ribs,since sharp corners act as stressconcentrators. Radii larger than 50%of the adjoining wall thickness onlygive marginal improvements andmay result in sink marks on theopposing surface.
(d)Ribs are most effective when placed
49
3. Distance between successiverib faces B
4. Length of rib face attachedto component C
5. Thickness of reinforcing edge D
· 0.7 T ³ A ³ 0.5 T· B ³ 2 T· C ³ 2 T
down the length of the areasubjected to bending.
(e)Rib spacing should be at least twice the nominal wall thickness.
(f) A draft angle of at least 0.5 degrees on each side should be incorporatedin order to facilitate release from thetool.
(g)Care should be taken to ensure adequate tool venting where gastraps are likely.
8.5.6 Support ribs
Support ribs may be considered as aform of reinforcement for corners, sidewalls or bosses. For the successfulintroduction of support ribs thefollowing guidelines are suggested,(refer also to ■ F IGURE 52):
(a)The thickness of the support rib should be between 50% and 70% ofthe component wall thickness.
(b)The minimum distance between faces of successive support ribsshould be twice the component wallthickness.
(c) The minimum length of the support rib face attached to the componentwall should be twice the wallthickness.
(d)Generous radii should be incorporated at the ends of the rib.
(e)A minimum draft angle of 0.5 degrees should be incorporated.
(f) The minimum length of the support rib face attached to a boss should befour times the wall thickness.

50
Design gu ide 8 Design fo r mouldab i l i t y
■ F IGURE 53Boss proportions that usuallyprovide sufficient strength,though accompanied by sinkmarks and residual stress
Strong possibility of sink markswhen W > 0.6 T
2D
W
D
T
R
E
T
■ F IGURE 54Reduced boss section withstrengthening gussets andincorporating radius
R = 0.25 TE ³ 4 T
■ F IGURE 55Attaching bosses to nearbywalls
8.5.7 Bosses
Bosses are features added to thenominal wall thickness of thecomponent and are usually used tofacilitate mechanical assembly.Under service conditions, bosses areoften subjected to loadings notencountered in other sections of acomponent. Hollow bosses may receiveself-tapping screws, ultrasonic welding,press-fits or moulded-in inserts, any ofwhich may exert an excessive hoopstress on the boss wall. This can bealleviated by the application ofsuggested boss design principles:
(a)General recommendations for the thickness of projections from anominal wall suggest a boss wallthickness of 50% to 70% of thenominal wall. This may not, however,
■ F IGURE 56Undercuts
provide sufficient strength towithstand the stresses imposed by aninsert. The increased strengthachieved by increasing the section isaccompanied by sink marks and highresidual stresses. For these reasons acompromise between aesthetics andstrength is frequently required,(refer to ■ F IGURE 53).
(b)Since external forces imposed on a boss also act on the wall from whichit projects, a minimum radius of 25%of the wall thickness at the base ofthe boss is recommended.
(c) Further strength may be achieved by gusset plate supports, as illustratedin ■ F IGURE 54 .
(d)Attaching the boss to a nearby wall with a rib results in increasedstrength. Furthermore, this assists inventing during mould filling.Examples are outlined in■ F IGURE 55 .
(e)In order to minimize sink marks opposite the boss, it is usuallynecessary to ensure that the core pinpartially penetrates the nominal wall.To avoid stress concentrations and tominimize material turbulenceduring mould filling, the head of thecore pin should incorporate agenerous radius.
8.5.8 Undercuts
Undercuts of part geometry in themould should be avoided if possiblethrough redesign. Ideally, mould toolsshould open in a direction parallel tothe movement of the injectionmoulding machine. Depending on thecomponent shape, slight undercuts canbe stripped from the tool.This is provided that sufficient taper is
given to avoid scuffing the surface of thecomponent. Certain design techniquescan give the desired geometry withouthaving to use mechanical devices.Examples of these techniques areillustrated in ■ F IGURE 56 .
Design gu ide 8 Design fo r mouldab i l i t y
For some complex components it isnecessary to use side cores,mechanically operated cams or loosecores. They can be dealt with ifnecessary as follows:
(a) cams: Cams or pneumatic cylinders move partof the mould out of the way to permitejection. They are quite expensive inthat the mould layout is much morecomplicated to machine. Controllers arerequired to operate in the mouldingcycle. Also the cycle time will beincreased.
(b) slides: Angled pins or rods are mounted in themould. Part of the mould forming anundercut or hole in the component willslide in the direction of the angled pinwhen the mould opens. Proper ejection
is then possible.(c) deflect: Small undercuts can often be deflectedby bending out the part from themould.
(d) inserts: Some undercuts can be produced usingremovable inserts which eject with thepart. This requires an extra operation toreplace an insert in the mould for thenext cycle and to remove the one fromthe ejected part.
(e) stepped parting line:
■ F IGURE 57Guidelines for introducing
q1
Often the parting line can be relocatedso that there is no longer an undercut.This can add some complexity to themould design but is the mostrecommended solution if possible.
8.5.9 Coring
The term coring in the injectionmoulding process refers to the additionof steel to the tool in order to reduce oreliminate material from a particulararea of the component.
51
of support ribs
q1 0,25° - 2° for smooth surfaces
q2 Larger angle required for textured surfaces and complex geometries
q2
A core which forms a hole, however,tends to limit natural material shrinkageand results in an area of relatively highresidual stress around the hole.To minimize stress concentrationpoints, irregularly shaped holes such asventilation slots incorporating sharpinternal corners should be avoided.Round holes are generally lesssusceptible, since the residual stressestend to be evenly distributed. Theinclusion of any hole results in aninterruption of the melt as it flowsaround the core. Where the melt
rejoins, it forms a weld- or a flow line.This is always a weak spot in thecomponent and may also beaesthetically undesirable.
To minimize these problems, andencourage the formation of strong weldlines, the following recommendationsshould be considered. Firstly, theshortest distance between the edges ofany two holes or slots should be greaterthan twice the nominal wall thickness.Secondly, when positioning a hole orslot near to the edge of a component,the shortest distance between the edgesof the hole and the component shouldexceed twice the nominal wall thickness.
Blind holes are created by a coresupported on only one side of the tool.
The core’s ability to withstand thebending forces induced by the flowingpolymer determines the maximum holedepth. In general, the depth of a blindhole should not exceed three times itsdiameter or minimum cross-sectionaldimensions. For small holes with adiameter of less than 6 mm, the length:diameter ratio should be kept to 1:2.With through holes it is possible to uselonger cores as they are supported onboth sides of the mould cavity.In general, for through holes the overalllength of a core can be twice as long asthat for a blind hole.
If the hole is to be used to mechanicallyfasten the component to a dissimilarmaterial, allowances should be made forexpansion and contraction.It is recommended that the diameter ofthe hole is greater than that of thefastener by 20%-40%, depending on
expected temperature fluctuations anddifferences between expansioncoefficients of the materials.
8.5.10 Draft angles
In order to facilitate componentremoval from the mould and hencereduce cycle time, a design shouldincorporate appropriate draft angles.For untextured surfaces, 0.25 degrees to2 degrees per side for both inner andouter wall is usually sufficient. In certainapplications the use of draw polish onthe mould surface may allow a smallerangle.
The mould parting line position on thepart can often be relocated in order tochange or split the required draft.If absolutely no draft is permitted due to
dimensional requirements, a cam orslide in the mould may be required.An illustrated example of draft angles isgiven in ■ F IGURE 57 .8.5.11 Textures and lettering
Textures and lettering can often bemoulded into the surface of a part. Thiscan be very helpful in that it can serve asan aesthetic or decorative surface at noadditional cost. It can also help to hidesurface imperfections such as weld lines.
Textured side walls require an
additional 0.4 degrees draft per 0.01mm depth of texture, though eachindividual case should be discussed withthe mould texturing supplier. For largerdrafts, up to as much as 10 degrees maybe required for particularly complexmouldings with textured finishes.
52
Design gu ide 8 Design fo r mouldab i l i t y
8.5.12 Flow leaders
Ribs and thickened sections can bedesigned into a part to function as flowleaders. While these can be used to helpfill a part in a predetermined way, theycan also lead to problems such asbackfilling and inappropriate weld linelocations.
Gate location and size play a big role indetermining the effectiveness of flowleaders. For example, a large centresprue gate positioned in a thick rib on alarge flat part will cause the resin to flowrapidly down the rib and then fan out tofill the part.
A further example is if a large flat parthas two crossing diagonal support ribsand the gate is located onto one ofthem. The flow will often first proceed
all of the way along the ribs. When theflow front reaches the end of the ribs,resistance to flow and hence pressurewill rise. In this case, the material willbegin to fan out into the flat portion ofthe part all of the way along both ribs.The flow fronts from this fanning outcan meet in the centre of the sectionsbetween the ribs forming four largeweld lines in the part surface. This effectcan be reduced by thinning the ribs orrelocating the gates.8.5.13 Moulded-in stress
Moulded-in stress is present in allmoulded plastic parts to some degree.In general, high levels of moulded-instress are undesirable and are caused byany of the following factors:
· high pressure in the moulding cycle · cold tool temperature· thin sections in high flow areas, especially in gates
· fine details at the extreme of flow· cold flow front from long flow lengths, including runners
· sharp corners in flow path· high viscosity materials· cold metal inserts in the mould · very fast cooling of plastic parts
High levels of moulded-in stress canresult in:
· lack of optical clarity · acceleration of chemical attack · reduction in load bearing capacity · warpage · inability to hold tight tolerances - anisotropic shrinkage
· difficulty in painting or plating uniformly
· reduction in impact strength · increase in ductile-brittle failure transition temperature
8.5.14 Weld lines
Weld lines are areas where two meltfronts come together and bond duringthe filling of a part. Weld lines willalways occur where the flow front isforced to go around an obstacle, like ahole, or where flow fronts meet, forexample coming from two differentgates at opposite ends of the part.Because melt fronts can be marginallycooled by contact with the mould, theyare often slightly less than fully molten.Thus the strength of a part in a weld linearea and the levels of moulded-in stressin a weld line area are reduced and
increased respectively.Parts should be designed with respect toweld lines as follows:
· Locate weld lines in structurallynon-critical areas.
· Locate weld lines in aestheticallynon-critical areas.
· Texture part surface in weld linearea if possible to hide aesthetic imperfection.
· Locate weld lines in areas wheregussets or thickened ribs can be used tostrengthen them if required.For example, if a weld line occurs on acylindrical boss, locate a support gussetat the weld line location.
· Use diaphragm or ring gates for
cylindrical parts when possible to eliminate weld lines.· If weld lines cannot be tolerated,locate them in a removable portion ofthe part, as is done for overheadfluorescent light covers.
8.6 Processing considerations
8.6.1 Venting
Adequate venting is essential to theproduction of consistently high qualitymoulded parts. In general, it is better toput in more vents than the minimumrequired because this will facilitate flowand assure removal of gases from themould. There are a number of problemswhich can result from inadequateventing:
No fill:A trapped air pocket in the mould cancause the section of the part not to fill.
High pressure:If air must be forced out throughinadequate venting, excessive pressuremay be required to fill the mould, andhigh levels of moulded-in stress canresult.
Slower fill cycle: If venting is inadequate, the fill cyclecan be slowed down.
Tool corrosion: Air which is trapped in a mould heats upwhile retaining its atmosphericmoisture. This can result in toolcorrosion in those areas.
Burn marks: Trapped air pockets can heat up andparts can suffer burning ordiscolouration.
There are a number of common types ofventing:
Parting line:A venting system can be designed intothe parting line of the mould so thattrapped air can escape all of the wayaround the part. Parting line gates arerelatively inexpensive because they canbe cut into the surface of the mouldalong with the part geometry.
Ejector pins:Flats can be ground onto ejector pins toproduce venting by allowing the gases toescape through the gap in the roundpin hole. Ejector pin gates are oftenused in blind pockets in the mould,such as those for part projections.
Dummy pins: Dummy pins can be used similarly toejector pins to provide venting incritical areas.
Vent sizes will depend upon thecharacteristics of the individual materialand moulding parameters. Vents whichare too small can be ineffective andeasily clog and become useless. Ventswhich are too large can flash undersome types of moulding conditions.The number of required vents willlargely depend on the process,geometry, material and mould quality.

Design gu ide 8 Design fo r mouldab i l i t y
8.6.2 Gating
As illustrated in ■ F IGURE 58 , there is awide variety of gate types which can beused for an injection mouldedcomponent.
(a) sprue gate:Sprue gates are usually located in thetop of the centre of the part with a cold-slug-well opposite the gate. They are ingeneral considered to be the best typeof gate with respect to fillingpossibilities. However, they must bemachined off as a secondary operationto the injection moulding process.
(b) pin point gate:Similar to a sprue gate, the centre gatehas a reverse taper and is self-degating.It is only feasible in a 3-plate toolbecause it must be ejected separately
■ F IGURE 58
from the part, in the opposite direction.The gate must also be weak enough sothat it will break off without damagingthe part.
(c) tab gate:A tab gate is a straight gate into the sideof a part. It is very inexpensive tomachine. However, it must be removed
(a) Direct centre sprue
taper 3-5 degrees
cold slug well
‘0’ mini
keep spshort asbreak sharp
corners minimum R 0,5
(g) Diaphragm gate
(d) Fan gate
L
t
non-impinging
full round runner
2x runnerwidth
part thickness =gate thickness
crot = L =
from the part after moulding whichleaves a mark on the edge or side of thepart. Due to sharp angles in the gatearea, melt shear can be more severe fora tab gate in comparison to the similarbut preferred fan gate.
(d) fan gate:The fan gate is similar to a tab gate butprovides large blending radii to reduceshear. A fan gate must be trimmed ormachined off and will leave a mark.However, it is the best type of side gatefor material flow.
(e) tunnel or submarine gate: These are very small gates on the sidesof a part. They are self-degating andleave very small marks, but cause largeamounts of shear in the material.Tunnel gates should have an included
angle of approximately 45 degrees.(f) jump gate: The jump gate provides gate location onthe bottom of the edge of the part.This is very desirable from an aestheticpoint of view, but can be expensive tomachine and cause problems with shear.
(b) Pin point gate
mum 5 mm
rue length possible
sucker pin
runner plate
cavity retainer plate
gate diameter
(e) tunnel gate
spruepart
gate
runner
runn
ss sectionminimum gate thickness - 10 mmmaximum gate land length - 1 mm
(g) Ring gate
(g) diaphragm gate: A circular gate inside the end of acylindrical part section, the diaphragmgate is ideal for the filling of circularparts. This is because no weld line formswhen the resin enters all of the wayaround the cylinder. However, this gateis among the most expensive to removesince it requires a mechanicaloperation.
(h) ring gate In this construction, a large diameterrunner goes all of the way around theoutside end of a cylindrical part andmaterial enter from all sides. As withdiaphragm gates, ring gates are verygood for circular section parts. Theycontain the weld line in the gate areaand do not typically produce any weldlines in the part. However, they must
also be mechanically removed. Ringgates are relatively inexpensive becausethey can be put in the parting line of themould and easily machined in themould half.53
Common gate types
(c) Tab gate
(f) Jump gate
tab
10 mm maximum
wall thickness
T
50% Tminimum
gate
er gate
runner
54
Design gu ide 8 Design fo r mouldab i l i t y
Recommendations:
As general recommendations, gatesshould be:
· As large as possible to permit highspeed and low shear material flow
· Radiused to reduce shear andfacilitate flow
· Designed to include a cold slug wellto catch the cooled melt front
· Located strategically to control weld line locations and flow length
· In thicker areas for injectionmoulded parts
8.7 Ejection
There is a variety of ejector mechanismsused in injection moulding machinesfor plastic components:
(a) pins: Pins are the most common types ofejector. Vents can often be machined onround ejector pins. Care must be takento ensure that there are enough ejectorpins of sufficient diameter to properlyeject the part without damage. It is alsoimportant that the ejection force isequally spread over the part for properejection from the mould.
(b) blades: Blades are very poor ejectors for anumber of reasons. They often damageparts, they bend or break and require alot of maintenance. Furthermore,
rectangular slots must be machined intothe mould to fit the blade ejector. Bladeejectors are most commonly used in thebase of pockets which produce ribs onthe part.(c) plates: Plates can be put in the mould toproduce large ejection surfaces. Ejector plates reduce part damage on ejection.
(d) stripper bars:
A stripper bar is a type of plate whichtakes the form of a bar attached to someheavy duty ejector pins. The back end ofa stripper bar should be tapered toprevent alignment problems.(e) air valves: Air valves are commonly used to assist inejection but not as a primary ejectionsystem. They release pressurized airwhen opening the valve.

9
Design fo rrecyc lab i l i t y
Manufacturing economics combinedwith environmental concerns areforcing the design engineer to re-thinkthe approach to product design, andconsider the disposal issues arising afterthe product is discarded. Because of thewaste disposal problems associated withplastics, it is necessary to think in termsof recyclability. This means that thematerial from which the ‘initial’ compo-nent was manufactured is reground andused for several generations of othercomponents, each requiring a reducedmaterial property profile compared tothat of the preceding component.A typical example of a totally recyclableplastic design would be one that uses nometal components, is easilydisassembled, uses no adhesives ordecorative/protective finishes, and hascomponents which are manufacturedfrom the same resin type and grade.
To achieve a totally recyclable design is,of course, a monumental task whenconsidering legislative, regulatory,technical and cosmetic demands, whichall impose restrictions on component/product design and material selection.The key criterion for ease ofrecyclability is ease of disassembly whichin turn is dependent on simplifiedassembly.
This is achieved by using fewer compo-nents through, for example, componentintegration, and by utilizing assemblyfeatures that can be ‘designed-in’ tothermoplastic components.
The following points are generalguidelines for the design of newproducts which are intended to berecyclable.
(a)Avoid using ‘moulded-in’ metal reinforcements in plasticcomponents. These are difficult toseparate and make recyclinguneconomical. This also applies tometal inserts for bushings ormachine screws.
(b)Where possible avoid usingself-tapping screws, and takeadvantage of the inherent properties
of thermoplastics to design snap-fitassembly features.(c) Bonding and cementing with polyester- and polyurethane-basedmaterials should be avoided as thesecontaminate the recycled material.If unavoidable then design ‘break-out’ features in the area of the bondline to facilitate removal. This alsoapplies to welded assemblies using
induction coils or powdered metals.When applied to both bonded andwelded assemblies the ‘break-out’technique also facilitates rapidseparation of the components.
(d)Where possible make the components from the same materialtype and grade. Where this is notpossible, code the components foreasy identification of the materialtype, by, for example, using barcodesor standard moulded-in colouridentification chips. Whendismantling assemblies which usedifferent resin types and grades, acoding procedure for materialsenables them to be easily identifiedand sorted.
(e)Avoid where possible using for example decorative paints, lacquers
and protective coatings. Carefullyselected resin colours incombination with surface texturingcan sometimes give an ideal cosmeticappearance without having to usesuch coatings.(f) When hot-foil decoration or printing is needed, separate, easy-to-removesecondary mouldings can be used asthe carrier/base.
55

10
Design fo r automat ion
Automation is a generic term used todescribe all production methods whichutilize mechanized assembly techniques.These include pick and place devices,manual manipulators and fullyrobotized production systems such ascomputer-aided manufacturingtechnology or advanced manufacturingtechniques.
Efficiency, flexibility, economy, qualityand reliability of end products are allfactors in the drive towards automation.The key to automation is design.High performance engineeringthermoplastics provide valuableopportunities for greater integration offunctions than can be achieved withtraditional construction materials suchas metal, wood or glass.Such integration results in fewercomponents and reduced inventory, but
requires a new approach to productdesign.Automation is an integral part ofproduct design which must beconsidered at the initial design stage.The following points should be viewedas guidelines when designing forautomation:
* Assembly can be rationalized throughproduct design by simplifyingcomponent assembly or by eliminatingit through component integration.
* Integration of functions reducescomponents and sub-assemblies andcreates larger, more easily handledparts.
* Reducing the number of componentsto a minimum is essential to facilitaterapid assembly.
* It is good design practice to create a
chassis as the carrier, with allcomponents being fixed by snap-fitfeatures ‘on-line’.* Snap-fit features should be designedinto components wherever possible, asscrews and bayonet fixings are amongthe most difficult fastenings to assemble.
* Components should incorporateguide surfaces and location features tohelp position components for ease ofassembly.
* It can be generally assumed thatproducts which are well-designed forautomated assembly are equally easy toassemble manually.
* Components that are equally easy toassemble and dismantle provide a goodbasis for recycling.
57

11
Appendix
Complementary reading
Roark’s formulae for Stress and Strain Warren C. Young McGraw-Hill Book Company, New York
Modern Plastics Encyclopedia McGraw-Hill Book Company, New York
Mechanics of Materials H.J. Hearn Longman Press, London
Design Engineering R.J. Matousec Hermes Verlag, Berlin
Mechanical testing of materials A.J. Ferner George Newnes Ltd.,London
Structural design with Plastics
B.S. Benjamin Van Norstrand, New YorkDesigning with Plastics G.W. Ernstein and G. Erhard McMillan Publishing Company,New York
Polymer Engineering H. Leverne Williams Elsevier Scientific Publishing, Oxford
Konstruieren mit Kunststoffen G. Schreger Hanser Verlag, Munich
Engineering Thermoplastics J. Margous Marcel Dekker Inc., New York
Thermoplastics: Materials Engineering L. Mascia Applied Science Publishing Ltd.,London
Plastics materials J.A. Brydson Butterworth Scientific, London
Machinery’s Handbook
E. Oberg, F.D. Jones, H.L. Horton Edited by H.L. Ryffel Industrial Press Inc., New York59

GE Plastics
Design guide
GE Plastics in Europe
European HeadquartersGeneral Electric Plastics B.V.1 Plasticslaan, PO Box 117NL - 4600 AC Bergen op Zoom The NetherlandsTel. (31) (164) 29 29 11Fax (31) (164) 29 29 40
Headquarters Sales RegionGeneral Electric Plastics B.V.Gagelboslaan 4NL - 4623 AD Bergen op Zoom The NetherlandsTel. (31) (164) 29 23 91Fax (31) (164) 29 17 25
Benelux Sales RegionGeneral Electric Plastics B.V.Gagelboslaan 4NL - 4623 AD Bergen op Zoom The NetherlandsTel. (31) (164) 29 11 92Fax (31) (164) 29 17 25
United KingdomGE Plastics LimitedOld Hall RoadSaleCheshire M33 2HG United KingdomTel. (44) (161) 905 50 00Fax (44) (161) 905 51 19
GermanyGeneral Electric Plastics GmbHEisenstraße 5D - 65428 Rüsselsheim GermanyTel. (49) (6142) 6010Fax (49) (6142) 65746
FranceGeneral Electric Plastics France S.à.R.L.Z.I. St. Guénault B.P. 67F - 91002 Evry-Cedex FranceTel. (33) (1) 60 79 69 00 Fax (33) (1) 60 77 56 53
ItalyGeneral Electric Plastics Italia S.p.A.Viale Brianza, 181I - 20092 Cinisello Balsamo (Milano) ItalyTel. (39) (02) 61 83 41Fax (39) (02) 61 83 42 11
RussiaGeneral Electric International A/OKosmodamianskaia Nab, 52Building 1113054 Moscow RussiaTel. (7) (095) 935 7312Fax (7) (095) 935 7317
SpainGeneral Electric Plastics Ibérica S.AAvenida Diagonal, 652-656Edificio D. Planta 308034 Barcelona SpainTel. (34) (93) 252 16 00Fax (34) (93) 280 26 19
SwedenGE Plastics LimitedBox 1242, Skeppsbron 44S-11182 Stockholm SwedenTel. (46) (8) 402 40 24Fax (46) (8) 723 12 92
TurkeyGE Plastics TurkeyIs Bankasi BloklariCemil Topuzlu CaddesiA Blok, Daire 1881030 FeneryoluIstanbul TurkeyTel. (90) (216) 386 7104Fax (90) (216) 386 5812
GE Plastics in India
GE Plastics India Ltd. 405-B, Sector 20Udyog Vihar Phase - IIIGurgaon, Haryana - 122 016, IndiaTel. (91) 124 341 801 to 806Fax (91) 124 341 817 or 815
GE Plastics in South Africa
GE Plastics South AfricaGeneral Electric South Africa (Pty) Ltd.15th floor Sandton Office Tower Sandton 2146Johannesburg, South AfricaTel. (27) 11 784 2108Fax (27) 11 784 2216
GE Plastics in the Americas
Worldwide Headquarters United StatesGE Plastics1 Plastics AvenuePittsfield, MA 01201USATel. (1) (413) 448 7110Fax (1) (413) 448 7493
CanadaGE Plastics Canada Ltd.2300 Meadowvale BoulevardMississauga, Ontario L5N 5P9CanadaTel. (1) (905) 858 5774Fax (1) (905) 858 5798
MexicoGE Plastics - Mexico S.A. de C.V.Av. Prolongacion Reforma #490, 4o. pisoColonia Santa Fe01207 Mexico, D.F.Tel. (11) 525 257 6060Fax (11) 525 257 6070
BrazilGE Plastics South America S.A.Av. Nações Unidas, 12995 - 20° andar -Cep 04578.000São Paulo - SPBrazilTel. (55) 11 5505 2800Fax (55) 11 5505 1757
GE Plastics in the Pacific
Pacific HeadquartersGE Plastics Pacific Pte. Ltd.240 Tanjong Pagar RoadGE Tower #09-00Singapore 0208Tel. (65) 326 3301Fax (65) 326 3303/(65) 326 3290
AustraliaGE Plastics Australia175 Hammond RoadDandenong, Victoria 3175AustraliaTel. (61) 3 794 4201Fax (61) 3 794 8563
ChinaGE Plastics ChinaBeijing, 3rd floorCITIC Bldg. No.19 Jian Guo Men Wai AvenueBeijing 100004ChinaTel. (86) (21) 270 6789Fax (86) (1) 512 7345
Hong KongGE Plastics Hong Kong Ltd.Room 1088 - Tower 1The Gateway, TshimshatsuiKowloonHong KongTel. (852) 2629 0827Fax (852) 2629 0800
JapanGE Plastics Japan Ltd.Nihombashi Hamacho Park Building2-35-4, Nihombashi-HamachoChuo-ku, Tokyo 103JapanTel. (81) 3 5695 4888Fax (81) 3 5695 4859
KoreaGE Plastics Korea Co. Ltd.231-8 Nonhyun-DongKangnam-KuSeoul 135-010Republic of KoreaTel. (82) 2 510 6250/1Fax (82) 2 510 66 66/7
SingaporeGE Plastics Singapore Pte Ltd.c/o 23 Benoi RoadSingapore 2262Tel. 65 846 3290Fax 65 861 3063
TaiwanGE Plastics Taiwan9/F 37 Min Chuan East Road Sec 3Taipei 10462Taiwan, Rep. of ChinaTel. (886) 2 509 2124/6Fax (886) 2 509 1625
ThailandGE Plastics Thailand21st FloorThaniya Plaza Building52 Silom RoadBangkok 10500ThailandTel. (66) (2) 231 2323Fax (66) (2) 231 2322
DISCLAIMER: THE MATERIALS AND PRODUCTS OF THE BUSINESSES MAKING UP THE GE PLASTICS UNIT OF GENERAL ELECTRIC COMPANY*, USA, ITS SUBSIDIARIES AND AFFILIATES (“GEP”), ARE SOLD SUBJECT TO GEP’S STANDARD CONDITIONS OF SALE, WHICH ARE INCLUDED IN THEAPPLICABLE DISTRIBUTOR OR OTHER SALES AGREEMENT, PRINTED ON THE BACK OF ORDER ACKNOWLEDGMENTS AND INVOICES, AND AVAILABLEUPON REQUEST. ALTHOUGH ANY INFORMATION, RECOMMENDATIONS, OR ADVICE CONTAINED HEREIN IS GIVEN IN GOOD FAITH, GEP MAKES NOWARRANTY OR GUARANTEE, EXPRESS OR IMPLIED, (I) THAT THE RESULTSDESCRIBED HEREIN WILL BE OBTAINED UNDER END-USE CONDITIONS, OR(II) AS TO THE EFFECTIVENESS OR SAFETY OF ANY DESIGN INCORPORATINGGEP MATERIALS, PRODUCTS, RECOMMENDATIONS OR ADVICE. EXCEPT AS PROVIDED IN GEP’S STANDARD CONDITIONS OF SALE, GEP AND ITSREPRESENTATIVES SHALL IN NO EVENT BE RESPONSIBLE FOR ANY LOSSRESULTING FROM ANY USE OF ITS MATERIALS OR PRODUCTS DESCRIBEDHEREIN. Each user bears full responsibility for making its own determination as to the suitability of GEP’s materials, products, recommendations, or advice for its ownparticular use. Each user must identify and perform all tests and analyses necessary toassure that its finished parts incorporating GEP materials or products will be safe andsuitable for use under end-use conditions. Nothing in this or any other document, norany oral recommendation or advice, shall be deemed to alter, vary, supersede, or waiveany provision of GEP’s Standard Conditions of Sale or this Disclaimer, unless any suchmodification is specifically agreed to in a writing signed by GEP. No statementcontained herein concerning a possible or suggested use of any material, product ordesign is intended, or should be construed, to grant any license under any patent orother intellectual property right of General Electric Company or any of its subsidiariesor affiliates covering such use or design, or as a recommendation for the use of suchmaterial, product or design in the infringement of any patent or other intellectualproperty right.
* Company not connected with the English company of a similar name.
Lexan®, Noryl®, Noryl® GTX®, Noryl® Xtra, Valox®, Ultem®, Xenoy®, Cycolac®, Cycoloy®
and Enduran® are Registered Trademarks of General Electric Co., USA.
Gelon™ is a Trademark of General Electric Co., USA.
Design Guide Eng/4M/0597