Embed Size (px)
Citation preview

Progress In Electromagnetics Research B, Vol. 58, 181–191, 2014
Design of a Compact Ultra-Wide Band Bow-Tie Slot AntennaSystem for the Evaluation of Structural Changes
in Civil Engineering Works
Florence Sagnard*
Abstract—A compact UWB bowtie-slot antenna (36× 23 cm2) fed by a CPW transition is proposedfor an improved ground-coupling radar. The antenna has an operating frequency band in the range[0.46; 4] GHz. Full-wave modeling using the FDTD approach has allowed to study in details the antennaradiation characteristics in air and in the presence of a soil. Afterwards, a radar system made of a pairof independent shielded bowtie antennas has been considered to probe the sub-surface very close to theair-soil interface. The polarization diversity in the E and H-planes is an important aspect which hasbeen studied in order to further detect the orientation of damages (cracks, delaminations . . . ) in civilengineering structures. Measurements in a dry and wet sand in different system configurations haveallowed to first characterize the GPR system and to draw comparisons with numerical results. Theability of the radar to detect small buried objects has been investigated.
1. INTRODUCTION
In the last decade, the recent development of an Ultra-Wide Band (UWB) Ground Penetrating Radar(GPR) as a non-invasive sensing tool for soils or man-made structures has opened opportunities toprovide more structural information and quantitative dielectric characteristics [1–3]. As our applicationsare mainly concerned with civil engineering to perform supervision, inventory, and soil characterization,improvements are needed in resolution and depth penetration. In general, a GPR system is composedof a pair of antennas (bistatic system), one for transmission and the other one for reception, thatare moved linearly above the soil surface to scan non-destructively the sub-surface. In this study, astepped-frequency continuous wave (SFCW) radar, working from 460MHz to beyond 4 GHz in air andoperating very close (a few cm) to the ground surface has been designed. As compared to air-coupledradar that suffers from a significant reflection at the ground interface, ground-coupled radar increasesenergy transfer of electromagnetic radiation in the sub-surface and penetration depth. On a commonsoil (ε′s = 5.5; σs = 0.01 S ·m−1), we hope that the lower frequency is close to 250 MHz. The major keycomponent in the present GPR system is the antenna geometry and its radiation characteristics; it hasto operate in an UWB, show a compact size to be used easily on sites, and shall not have a late-timeringing phenomenon in its time response that will cause the deterioration in the down range resolutionof the system.
Since the burst in 2002 of the UWB technology for communication systems in the [3.1; 10.6] GHzfrequency range, microstrip patch antennas (MPAs) have reached a sufficient maturity which has allowedto design many types of planar antennas that offer several advantages such as compact size, low-cost,ease of fabrication, lightweight, and various shapes. Thus, we have adapted this planar technology todesign an original triangle bowtie slot antenna on a FR4 substrate (h = 1.5mm, ε′r = 4.4; tan δ = 0.01)
Received 30 January 2014, Accepted 18 February 2014, Scheduled 24 February 2014* Corresponding author: Florence Sagnard ([email protected]).The author is with the Department COSYS, University Paris-Est, IFSTTAR, 14-20, Bd Newton, Champs-sur-Marne 77420, France.

182 Sagnard
at lower frequencies with reduced dimensions close to the A4 sheet size [4–9]. A tapered coplanarwaveguide (CPW) transmission line with a 50 Ω impedance at the antenna frontier has been defined.To eliminate undesirable reflections from the upper environment particularly at low frequencies, andreduce the coupling between the transmitting and the receiving units, a partial conductive shield onlyopened towards the ground and coated with an inner layered absorbing material has been added [9].The aim of this study is to assess the acquisition configuration, and characterize the polarization of theantennas for the detection and discrimination of discontinuities with small lateral dimensions (less than25mm) in civil engineering works to further consider structural features such as cracks, repair patches,buried utility cuts [1, 3]. The development of direct full-wave modeling based on the finite difference timedomain (FDTD) technique has allowed to study in details the UWB radiation properties of one antennain the E and H-planes in air and in a common soil (ε′s = 5.5; σs = 0.01 S·m−1). Afterwards, a parameterstudy associated with the geometrical configuration of the bistatic radar link in both polarizations andon a common soil has allowed to characterize the transmission link. Measurements have been madein the frequency domain, using a vector network analyzer (VNA) in the range [0.05; 4] GHz on a dryand wet sand and they have been compared to numerical results. The radar system has also beenpreliminary evaluated in the detection of canonical objects in a wet sand.
2. TRIANGLE BOWTIE SLOT ANTENNA DESIGN
2.1. Antenna Geometry
As the triangle bow-tie slot antenna visualized in Figure 1 is intended to be positioned close to thesoil surface, we have defined its overall dimensions to operate at low frequencies close to 250 MHz(return loss S11 dB(f) ≤ −10 dB) in the presence of a common dry soil with dielectric characteristics
Ls=332.2
W1=86.59
Wa=2.11
r2=20 r1=20
Ws =190.4
distances in mm
b=2.8
a=0.4 Wf =67.02
a'=1.84
l 3=20
(b) tapered feed line
Wa=2.11
L2=136.4
W f =67.02
L2=136.4
(a) CPW-fed triangle bow-tie slot antenna
b'=2.50
Figure 1. (a) Geometry of the triangle bowtie slot antenna modeled using FDTD simulations; (b) Topview of the tapered feed line (distances in mm).

Progress In Electromagnetics Research B, Vol. 58, 2014 183
ε′s = 5.5; σs = 0.01 S · m−1. The radiation characteristics have been studied using numerical FDTDsimulations (EMPIRE software). The antenna has been designed on a single-sided FR4 substrate(h = 1.5mm ε′r = 4.4; tan δ = 0.01, 35µm copper-clad). The overall dimensions of the antennaare Ws = 190.4mm and Ls = 332.2mm. The antenna is made of two rounded slot triangles(W1 = 86.59 mm and L1 = 276.47mm, radii r1 and r2 = 20mm) fed by a tapered CPW line with lengthWf = 67.02mm [8]. It is fed in port 1 from a SMA (subminiature version A) connector connected toa 50 Ω CPW line with a = 0.4mm and b = 2.8mm. The antenna feed line is tapered for impedancematching with dimensions at the feed-point a′ = 1.84mm and b′ = 2.50mm [7].
The surface current distribution jxy on the antenna at the frequency 450 MHz and visualized inFigure 2 highlights that the slot antenna has a principal radiation along axis Ox. A null is observed atthe front end in the middle of the antenna along axis Oy. Thus, the directional radiation characteristicwill be suitable for dual polarizations studies. To eliminate backward radiations in air induced by theclose environment, and to reduce the direct coupling between the transmitting and receiving antennasin the GPR system, each antenna has been enclosed in a perfectly conductive box opened towards theground surface as shown in Figure 3; the conductive box (height hc = 67.5mm, width Wc = 231 mm,and length Lc = 362mm) has been filled in the simulations with a three layered absorbing materialwhich is supposed to progressively absorb the electromagnetic waves and to reduce multiple reflectionsinside the cavity; consequently, the return loss in all the operating frequency band is slightly modifiedThe planar absorbing material has been modeled according to Atteia’s work that has considered aconductivity profile following the law σ = 10n−3 S ·m−1, where n is the layer number, and n = 1 is thelayer just in contact with the antenna [9]. Thus, according to a parametric study not presented here,the characteristics of the absorbing layers are finally: ε1,2,3 = 1.5, σ1 = 0.01 S · m−1; e1 = 24.2mm;σ2 = 0.1 S ·m−1; e2 = 29.3mm and σ3 = 1 S ·m−1; e3 = 14mm. As shown in Figure 3, the front andalso the printed face of the antenna is supposed to be positioned towards the soil surface at an elevationh close to 10 mm to better match the soil impedance and to consider potential irregularities on the soilsurface.
450 MHz
jxy
Figure 2. Surface current distribution jxy on theantenna at the frequency 450MHz.
3-layered absorbing
material
Lc=362 mm
W = 231 mmc
e2=29.3 mm e3=14 mm
e1=24.2 mm
soil ε' =5.5 s
σ =0.01 S ms−1.
Figure 3. Geometry of the shielded slot bowtiemodeled using FDTD simulations.
2.2. Theoretical Parameter Study
Main parameters which influence significantly the reflection coefficient S11 dB(f) such as a′ and l3 (feed-line), W1 (triangle width), Ls, and Ws (substrate dimensions) have been studied to define the finalantenna geometry as compact as possible. The operating frequency band extends beyond 4 GHz, butthe higher frequencies will not penetrate sufficiently into the soil to extract reflection signals from burieddiscontinuities.

184 Sagnard
Firstly, the antenna has been studied alone in air. As shown in Figure 4(a), the increase of the armlength L1 from 136.4 (original) to 148.1mm does not significantly modify the lower operating frequency(S11 (dB) < −10 dB) but increases the S11 (dB) amplitude between 0.870 and 3.5GHz. A compromisebetween the total arms length L1 and width W1 has to be found to extend the bandwidth towards lowerfrequencies while keeping a compact geometry. A width variation of around 8 mm as compared to theoriginal one shows that a higher value (W1 = 94.84mm) is responsible for a decrease of S11 (dB) until2.4GHz, but an increase is observed afterwards. A width decrease (W1 = 78.66mm) increases S11 (dB)until 2.5 GHz, and between 2.8 and 3.7 GHz. These observations justify the choice for W1 = 86.9mm.Then, the main influential feed-line parameters l3 and a′ on S11 (dB) whose values have been changedfrom 20 to 27 mm and from 2.5 to 2.7 mm respectively such as visualized in Figure 4(b) show both anincrease in amplitude from 2.2 to 3.3 GHz. Few changes are observed below 1 GHz. Parameter a′ seemsto induce significant change in the antenna impedance matching to the connector 50 Ω. Moreover, theinfluence of substrate length Ls and width Ws has been studied to reduce significantly the dimensions ofthe antenna. The results visualized in Figure 5(a) show that if Ws is changed from 190.4 to 185 mm, thereturn loss increases at the frequency 0.722 GHz, that corresponds to the higher amplitude inside thebandwidth and close to −10 dB; thus Ws = 190.4mm has been defined. Concerning the substrate lengthLs, we have remarked that the value 332.2mm gives a slightly lower return loss amplitude between 0.863and 1.6 GHz than the value 342 mm that explains the choice made for the lower value.
Afterwards, the structure of a partial shied has been studied in order to modify slightly the S11 (dB)amplitude in the overall bandwidth. Using a three layered absorbing material, FDTD simulations based
0 1 2 3 40
-50
-40
-30
-20
-10
0
frequency [GHz]
S11 [d
B]
ori gina l
W1=78.66 mm L1=148.1 mm
W1=94.84 mm
0 1 2 3 4-60
-50
-40
-30
-20
-10
0
frequency [GHz]
S11 [d
B]
ori gina l
l 3=27 mm
a'=2.7mm
(a) parameters arm length and width (b) feed-line parameters
Figure 4. Influence of antenna geometrical parameters on the return loss S11 dB(f); (a) Arm lengthand width; (b) Feed-line.
0 1 2 3 4-60
-50
-40
-30
-20
-10
0
frequency [GHz]
S1
1 [
dB
]
original
Ws=185 mm
Ls=342 mm
0 1 2 3 4-50
-40
-30
-20
-10
0
frequency [GHz]
S1
1 [
dB
]
original with shield
wi th shield (e 1=16 mm, e2=37.5 mm)
wi th shield (e 1=33 mm, e2=20.5 mm)
(a) parameters substrate length and width (b) parameters of the
three-layered absorbing material
0.721
Figure 5. Influence of antenna geometrical parameters on the return loss S11 dB(f); (a) Substratelength and width; (b) The three-layered absorbing material.

Progress In Electromagnetics Research B, Vol. 58, 2014 185
on sensitivity analysis have helped us to design a compact conductive box with length Ls = 432 mm,width Wc = 356.5mm and height hs = 82.5mm. Supposing that the overall height remains constant,the influence of the thicknesses associated with layers 1 and 2 (see Figure 3) has been studied; theresults presented in Figure 5(b) show that a decrease of e1 from the initial value 24.2 mm to 16mmgives a S11 (dB) amplitude greater and lower as compared to the nominal value along all the bandwidth.When increasing e1 to 33mm, the S11 (dB) amplitude remains generally slightly higher as compared tothe nominal case except for frequencies higher than 3.1GHz that are quite high for GPR applications.
The comparison of antenna responses in terms of S11 (dB) amplitude, without and with a shieldand collected in Figure 6, shows that the shield produces a shift towards the lower frequencies of thefirst frequency corresponding to S11 (dB) = −10 dB from 0.469 to 0.287GHz. In general, we observethat the shield smoothes the S11 amplitude. Moreover, the higher amplitude situated in the operatingbandwidth at 0.730 GHz reaches the amplitude −7.36 dB, thus slightly higher than −10 dB. In thepresence of a common soil at an elevation h = 1 cm above the soil surface, we observe that the S11 (dB)amplitude associated with the shielded antenna decreases significantly as compared to the case in air atfrequencies higher than 0.840 GHz. Moreover, we remark a slight shift on the left of the lower frequencycorresponding to S11 (dB) = −10 from 0.287 to 0.250 GHz that is induced by the presence of thedielectric soil; the first resonant peak remains almost at the same position. Thus, a satisfactory antennamatching with the soil is obtained.
0 1 2 3 4-60
-50
-40
-30
-20
-10
0
frequency [GHz]
S11
[dB
]
non shielded in air
shielded in a so il (ε'=5.5; σ=0.01)
sh ielded in air
0.2475
0.469
-7.36
Figure 6. Theoretical return loss S11 dB(f) without and with a shield, in air and in the presence of acommon soil (ε′s = 5.5; σs = 0.01 S ·m−1).
The radiation patterns of the shielded triangle bow-tie slot antenna in air at four frequencies 0.450,0.800, 1, and 2GHz are plotted in Figures 7(a), 7(b), 7(c), and 7(d) respectively in both planes E(xOz or φ = 0) and H (yOz or φ = 90). The backward radiation corresponds to the bottom halfplane situated in the range [−90; 90]. In the E-plane, we remark that the component Eθ is dominant
-50
-30
-10
10
60
120
30
150
0
180
30
150
60
120
90 90
Etheta,phi=0°
Ephi,phi=0°
Etheta,phi=90°
Ephi,phi=90°
(a) 450 MHz (b) 800 MHz
-50
-30
-10
10
60
120
30
150
0
180
30
150
60
120
90 90
-50
-30
-10
10
60
120
30
150
0
180
30
150
60
120
90 90
(c) 1 GHz (d) 2 GHz
-50
-30
-10
10
60
120
30
150
0
180
30
150
60
120
90 90
Figure 7. Theoretical radiation patterns in both E and H-planes associated with the shielded slotbowtie antenna in air at frequencies 450 MHz, 800 MHz, 1 GHz, and 2GHz.

186 Sagnard
and consequently the component Eφ can be assumed negligible; in air, without shield, the maximumgain is 5.4 dB at 0.800GHz. In the the H-plane, we observe in Figures 7(a), 7(b), 7(c), and 7(d) alower amplitude difference between both E-components in the angle range [30; 70] and [110; 150] atfrequencies 0.8 and 1 GHz. In both planes a maximum gain close to 4.2 dB is observed at 0.8 and 1 GHz,lower than without a shield that induces weak losses. In the direction 180, an attenuation higher than20 dB for the main components in both planes is noticed.
2.3. Measurements
First experiments have been made on a dry and wet pure sand coming from the Seine valley in France.The dry sand has been deposited in a large box (height 740mm, length 2 m, and width 1m) inside ourlaboratory (see Figure 8(d)) and the wet sand (height 480mm) has been found in the public squarePerichaux (Paris 15) close to our laboratory after two weeks of bad weather. Both sands have not beencompacted. The measurements have been made in the frequency domain [0.05; 4]GHz (1601 samples)with a portable VNA ANRITSU MS 2026B. The intermediate frequency bandwidth (IFBW) has beendefined to 500 Hz. A full two ports calibration has been made with 2m length radio frequency cables.Each antenna has its own shield made of a box with an inner conductive coating and filled with afive-layered absorbing foam HPS 125 (distributed by EUROMC) with a total thickness of 150mm.
0 1 2 3 4-60
-50
-40
-30
-20
-10
0
frequency [GHz]
S11
[dB
]
0 1 2 3 4-60
-50
-40
-30
-20
-10
0
frequency [GHz]
S1
1
[dB
]
measurements
shielded
simulations
unshielded
--- ε'=5.5 shileded
(a) measurements in a dry sand (b) measurements in a wet sand
measurements
simulations
shielded
unshielded
(c) measurements in a dry and wet
sand (shielded case)
0 1 2 3 4-60
-50
-40
-30
-20
-10
0
frequency [GHz]
S11
[dB
]
--- ε'=5.5 shileded
--- ε'=5.5 unshielded
ε'=3.5 unshielded
wet sand dry sand
simulations
(d) laboratory box filled with dry sand
0.292 1.35 3.07
simulations
--- ε'=5.5 unshielded
--- ε'=3.5 unshielded ---
Figure 8. Comparison of theoretical and experimental return losses S11 dB(f); (a) In a dry and (b) awet soil; (c) Comparison of measurement results only in a dry and a wet soil; (d) Experimental setupon a dry sand.
The comparison between experimental and theoretical reflection coefficients S11 in the presence ofboth types of sand is collected in Figures 8(a), 8(b), and 8(c). Considering the dry sand we remark inFigure 8(a) that the variations of the S11 experimental amplitudes with and without a shield appearsimilar; the presence of the shield slightly shifts S11 towards the left (lower frequency) because of thepresence of a real permittivity in the absorbing material. In the unshielded case, among both values3.5 and 5.5 for ε′s, the theoretical S11 amplitude variations associated with ε′s = 3.5 (σs = 0.01 S ·m−1)

Progress In Electromagnetics Research B, Vol. 58, 2014 187
appear close to the experimental curve. Concerning the wet sand, we remark from Figure 8(b) thatexperimental S11 variations show more resonances than the theoretical results. The theoretical resultsassociated with the shielded case with a soil value ε′s = 3.5 (σs = 0.01 S ·m−1) show amplitude variationsclose to the measurements. Moreover, we observe from Figure 8(c) that the wet sand introduces moredispersion in the return loss S11 as compared to the dry sand and particularly between frequencies 1.36and 3.07 GHz. The lower frequency 291 MHz corresponding to S11 = −10 dB does not appear modifiedwhen the sand is wet.
3. GPR SYSTEM
3.1. System Configurations
The radar system modeled, using FDTD simulations, is made of a pair of transmitting (externalinput impedance 50Ω) and receiving (impedance 10 kΩ for voltage retrieval) shielded triangle bow-tie slot antennas positioned on the ground at an elevation h = 1 cm. Three main configurations havebeen considered: the parallel configuration (see Figure 9(a)) where the antennas are aligned alongtheir larger dimension, the mirror configuration (see Figure 9(b)) where the antennas face each othersymmetrically along their larger dimension, and the cross-polarization configuration (see Figure 9(c))where the antennas are very close (a few cm) and are oriented at 90 to each other. For each of theseconfigurations, the influence of the offset between both antennas (see Figures 10(a), 10(b) and 10(c))on the amplitude of the transmission coefficient S21 (dB) considering a semi infinite homogeneous soil(ε′s = 5.5; σs = 0.01 S ·m−1) has been theoretically studied using FDTD simulations. The offset valueresults from a compromise between a weak direct path amplitude (low S21 in the first arrival timesresponsible for the clutter) and a sufficient high signal amplitude issued from the reflections inside thesoil induced by the buried objects or dielectric contrasts.
(a) Parallel configuration
of fse t
(160 mm)
of fset
P1 P2
(10 k
(50 Ω)
transmitting
antenna receiving
antenna air
PML
PML
PML
soil
(b) Mirror configuration
soil
PML
PML
transmitting
antenna
receiving
antenna
P1
P2
(c) Cross-polarization configuration
of fset
(30 mm) transmitting
antenna
receiving
antenna
P1
P2
soil
PML
PML
ε' =5.5 s
σ =0.01 S ms−1.
ε' =5.5 s
σ =0.01 S ms−1.
ε' =5.5 s
σ =0.01 S ms−1.
Ω)
Figure 9. The three GPR configurations modeled using FDTD simulations: (a) The parallelconfiguration; (b) The mirror configuration, and (c) the cross-polarization configuration.
Comparing the transmission coefficient S21 (dB) in the parallel and mirror configurations (seeFigures 10(a), and 10(b)) with offsets in the range [0; 160] mm, we remark that the antenna couplingappears significantly lower in the parallel case, and particularly at frequencies lower than 1 GHz (15–20 dB lower). In the mirror configuration (see Figure 10(b)), a marked peak having the highest amplitude
188 Sagnard
0 1 2 3 4-120
-110
-100
-90
-80
-70
-60
-50
-40
-30
frequency [GHz]
S1
1 [
dB
]
0 1 2 3 4-120
-110
-100
-90
-80
-70
-60
-50
-40
frequency [GHz]
S1
1 [
dB
]
offset 0 mm
offset 40 mm
offset 80 mm
offset 120 mm
offset 160 mm
offset 0 mm
offset 40 mm
offset 80 mm
offset 120 mm
offset 160 mm
(a) Parallel configuration (b) Mirror configuration
0 1 2 3 4-120
-110
-100
-90
-80
-70
-60
-50
-40
frequency [GHz]
S[d
B]
offset 10 mm offset 20 mm
offset 30 mm
offset 40 mm
(c) Cross-polarization configuration
S
[dB
]
S
[dB
]
21
21
21
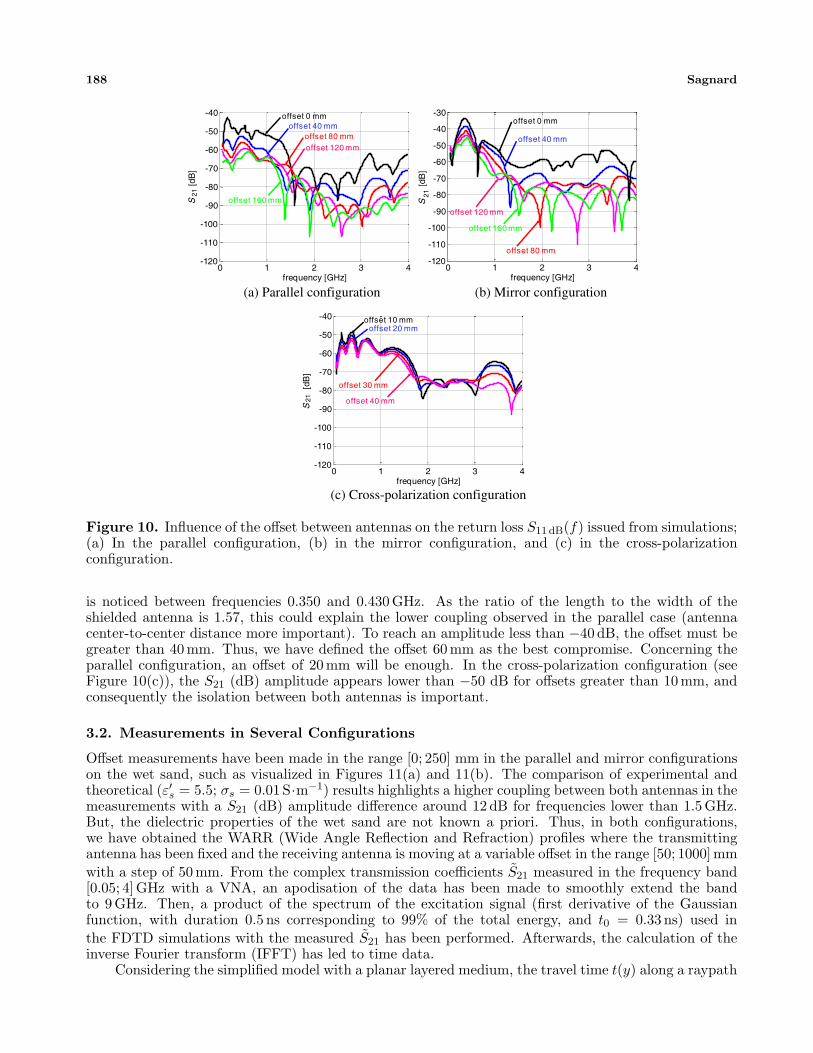
Figure 10. Influence of the offset between antennas on the return loss S11 dB(f) issued from simulations;(a) In the parallel configuration, (b) in the mirror configuration, and (c) in the cross-polarizationconfiguration.
is noticed between frequencies 0.350 and 0.430 GHz. As the ratio of the length to the width of theshielded antenna is 1.57, this could explain the lower coupling observed in the parallel case (antennacenter-to-center distance more important). To reach an amplitude less than −40 dB, the offset must begreater than 40 mm. Thus, we have defined the offset 60 mm as the best compromise. Concerning theparallel configuration, an offset of 20mm will be enough. In the cross-polarization configuration (seeFigure 10(c)), the S21 (dB) amplitude appears lower than −50 dB for offsets greater than 10 mm, andconsequently the isolation between both antennas is important.
3.2. Measurements in Several Configurations
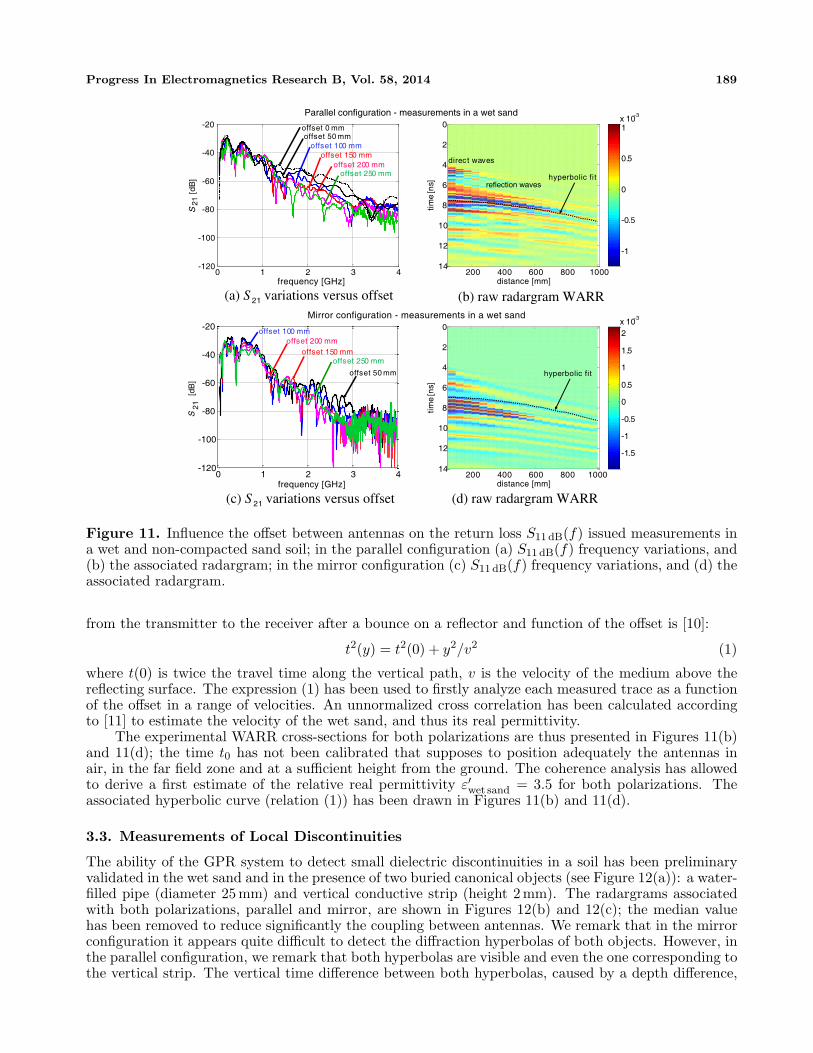
Offset measurements have been made in the range [0; 250] mm in the parallel and mirror configurationson the wet sand, such as visualized in Figures 11(a) and 11(b). The comparison of experimental andtheoretical (ε′s = 5.5; σs = 0.01 S·m−1) results highlights a higher coupling between both antennas in themeasurements with a S21 (dB) amplitude difference around 12 dB for frequencies lower than 1.5 GHz.But, the dielectric properties of the wet sand are not known a priori. Thus, in both configurations,we have obtained the WARR (Wide Angle Reflection and Refraction) profiles where the transmittingantenna has been fixed and the receiving antenna is moving at a variable offset in the range [50; 1000]mmwith a step of 50 mm. From the complex transmission coefficients S21 measured in the frequency band[0.05; 4] GHz with a VNA, an apodisation of the data has been made to smoothly extend the bandto 9 GHz. Then, a product of the spectrum of the excitation signal (first derivative of the Gaussianfunction, with duration 0.5 ns corresponding to 99% of the total energy, and t0 = 0.33 ns) used inthe FDTD simulations with the measured S21 has been performed. Afterwards, the calculation of theinverse Fourier transform (IFFT) has led to time data.
Considering the simplified model with a planar layered medium, the travel time t(y) along a raypath
Progress In Electromagnetics Research B, Vol. 58, 2014 189
0 1 2 3 4-120
-100
-80
-60
-40
-20
frequency [GHz]
S[d
B]
offset 50 mm
offset 100 mm
offset 150 mm
offset 200 mm offset 250 mm
offset 0 mm
Parallel configuration - measurements in a wet sand
(b) raw radargram WARR
Mirror configuration - measurements in a wet sand
0 1 2 3 4-120
-100
-80
-60
-40
-20
frequency [GHz]
S1
1 [
dB
]
offset 100 mm
offset 150 mm
offset 200 mm
offset 250 mm
offset 50 mm
(c) S variations versus offset21 (d) raw radargram WARR
S
[dB
]
200 400 600 800 1000
0
2
4
6
8
10
12
14
distance [mm]
tim
e [n
s]
-1
-0.5
0
0.5
1x 10
-3
hyperbolic fit
200 400 600 800 1000
0
2
4
6
8
10
12
14
distance [mm]
tim
e [n
s]
-1.5
-1
-0.5
0
0.5
1
1.5
2
x 10-3
hyperbolic fit
reflection waves
direct waves
(a) S variations versus offset21
21
2
1
Figure 11. Influence the offset between antennas on the return loss S11 dB(f) issued measurements ina wet and non-compacted sand soil; in the parallel configuration (a) S11 dB(f) frequency variations, and(b) the associated radargram; in the mirror configuration (c) S11 dB(f) frequency variations, and (d) theassociated radargram.
from the transmitter to the receiver after a bounce on a reflector and function of the offset is [10]:
t2(y) = t2(0) + y2/v2 (1)
where t(0) is twice the travel time along the vertical path, v is the velocity of the medium above thereflecting surface. The expression (1) has been used to firstly analyze each measured trace as a functionof the offset in a range of velocities. An unnormalized cross correlation has been calculated accordingto [11] to estimate the velocity of the wet sand, and thus its real permittivity.
The experimental WARR cross-sections for both polarizations are thus presented in Figures 11(b)and 11(d); the time t0 has not been calibrated that supposes to position adequately the antennas inair, in the far field zone and at a sufficient height from the ground. The coherence analysis has allowedto derive a first estimate of the relative real permittivity ε′wet sand = 3.5 for both polarizations. Theassociated hyperbolic curve (relation (1)) has been drawn in Figures 11(b) and 11(d).
3.3. Measurements of Local Discontinuities
The ability of the GPR system to detect small dielectric discontinuities in a soil has been preliminaryvalidated in the wet sand and in the presence of two buried canonical objects (see Figure 12(a)): a water-filled pipe (diameter 25 mm) and vertical conductive strip (height 2 mm). The radargrams associatedwith both polarizations, parallel and mirror, are shown in Figures 12(b) and 12(c); the median valuehas been removed to reduce significantly the coupling between antennas. We remark that in the mirrorconfiguration it appears quite difficult to detect the diffraction hyperbolas of both objects. However, inthe parallel configuration, we remark that both hyperbolas are visible and even the one corresponding tothe vertical strip. The vertical time difference between both hyperbolas, caused by a depth difference,

190 Sagnard
x (mm)
D =25 mm
d ~150 mm
trans mitter receiver offset
60 mm
e =2 mm
l =10 mm
0
wet sand
~500 ~1200
d ~130 mm
(a) scheme of the experimental setup (23 oct. 2012)
0
2
4
6
8
10
0 500 1000 150012
tim
e [n
s]
distance [mm]
-1.5
-1
-0.5
0
0.5
1
1.5x 10
-3
tim
e [n
s]
-3
-2
-1
0
1
2
3x 10
-3
(b) radargram with median value removed in the parallel configuration
(c) radargram with median value removedin the mirror configuration
3.3
12
21
2
~530 ~1210
0
2
4
6
8
10
12
3.15
0 500 1000 1500distance [mm]
~1295 ~578
Figure 12. Measurements on the wet sand with two buried canonical objects: a water-filled pipe(diameter 25 mm) and vertical conductive strip (height 2 mm); (a) Geometry of the soil with the buriedobjects, and radargrams (b) in the parallel, and (c) in the mirror configurations.
is around 0.2 ns; this value agrees with the delay calculated using the hyperbola analytical relationinvolving a cylindrical object (ε′wet sand = 3.5).
4. CONCLUSION
This work addresses the development and validation of a novel UWB triangle bowtie antenna forGPR applications, particularly in the civil engineering domain. The design of the antenna allowsto improve its radiation characteristics and modify them if necessary. Fullwave FDTD simulationshave allowed to study in details the antenna response in air and in the presence of a common soil(ε′s = 5.5; σs = 0.01 S · m−1) and to make comparison with experimental results. The polarization ofthe antennas has been particularly considered in a bistatic radar system in theory and in experimentalsituations to further examine the orientation of buried discontinuities or objects in the sub-surface. Firstmeasurements in the presence of canonical buried objects show the satisfying ability of the radar systemto detect quite smaller than the antenna dimensions. Current studies aim at comparing measurementsin the presence of different dielectric objects with full-wave simulations. Several data processing arecurrently developed that mainly concern clutter removing, automatic hyperbola detection, the slicingof the UWB into sub-bands to extract different types of information (penetration, shape, dielectriccharacteristics, frequency variations . . . ).
REFERENCES
1. Daniels, D. J., Ground Penetrating Radar, 2nd edition, The IEE, London, 2004.2. Yelf, R. J., “Application of ground penetrating radar to civil and geotechnical engineering,”
Electromagnetic Phenomena, Vol. 7, No. 1, 102–117, 2007.3. Diamanti, N. and D. Redman, “Field observations and numerical models of GPR response from
vertical pavement cracks,” J. Applied Geophysics, Vol. 81, 106–116, 2012.

Progress In Electromagnetics Research B, Vol. 58, 2014 191
4. Becker, J., D. Filipovic, H. Schantz, and S.-Y. Suh, “Ultra-wideband antennas,” InternationalJournal of Antennas and Propagation, Special Issue, Hindawi Publishing, 2008.
5. Wiesbeck, W., G. Adamiuk, and C. Sturm, “Basic properties and design principles of UWBantennas,” Proceedings of the IEEE, Vol. 97, No. 2, 372–385, Feb. 2009.
6. Rahel, K., S. Bashir, and N. Fazal, “Review of techniques for designing printed antennas for UWBapplication,” International Journal of Sciences & Emerging Technologies, Vol. 1, No. 2, 48–60,Feb. 2012.
7. Zheng, G., A. A. Kishk, A. W. Glisson, and A. B. Yakovlev, “Slot antenna fed by a CPW line withtapered transition,” Microwave and Opt. Technol. Letters, Vol. 38, No. 6, 465–467, Sep. 2003.
8. Wu, C.-J., I.-F. Chen, and C.-M. Peng, “A dual polarization bow-tie slot antenna for broad bandcommunications,” PIERS Proceedings, 217–221, Marrakesh, Marocco, Mar. 20–23, 2011.
9. Atteia, G. E. and A. A. Shaalan, “Wideband partially-covered bowtie antenna for ground-penetrating radars,” Progress In Electromagnetics Research, Vol. 71, 211–226, 2007.
10. Yilmaz, O., Seismic Data Analysis: Processing, Inversion, and Interpretation of Seismic Data:Volume 1, SEG Books, 2001.
11. Hamann, G. and J. Tronicke, “Assessing uncertainties in determining GPR ground wave velocities:An approach based on spectral velocity analysis,” 6th International Workshop of Advanced GroundPenetrating Radar (IWAGPR), 1–5, Aachen, 2011.