Embed Size (px)
Citation preview

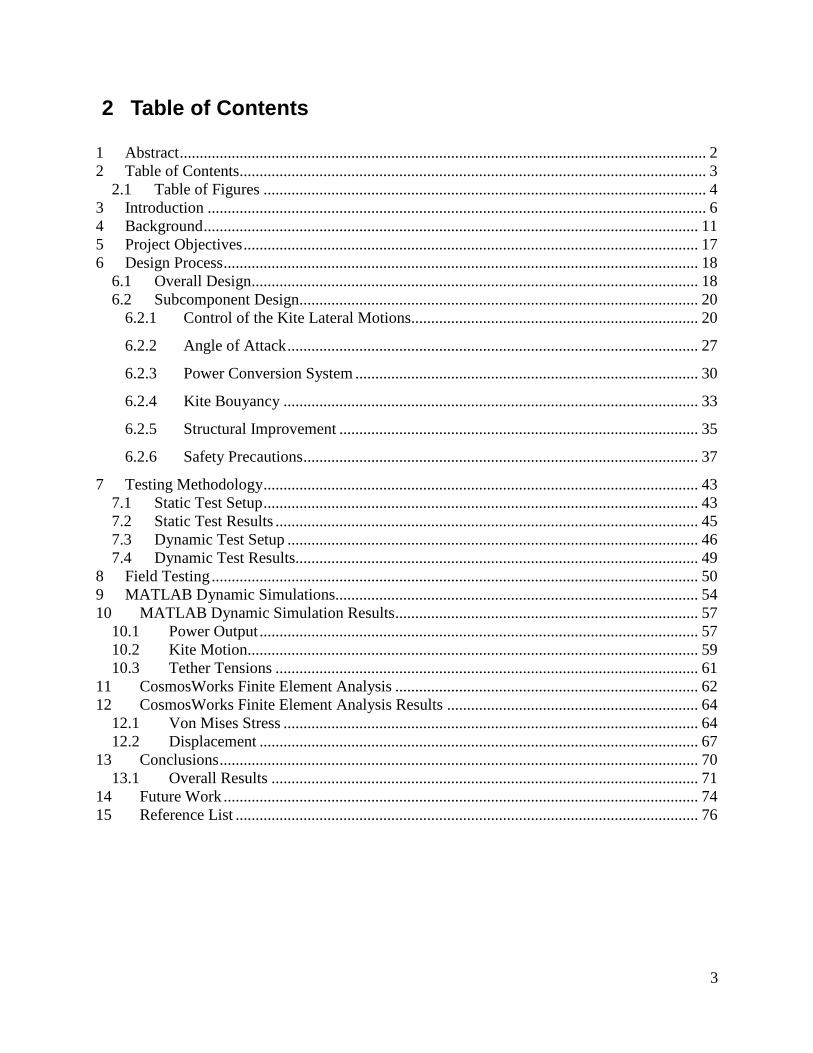
Project #: DJO - 0308
Design of a One Kilowatt Scale Kite Power System
A Major Qualifying Project Report Submitted to the Faculty
of the
WORCESTER POLYTECHNIC INSTITUTE
in partial fulfillment of the requirements for the Degree of Bachelor of Science
In Aerospace Engineering
SUBMITTED BY:
__________________________ Ryan Buckley
__________________________ Chris Colschen
__________________________ Michael DeCuir
__________________________ Max Hurgin
__________________________ Erik Lovejoy
__________________________ Nick Simone
Date: April 23rd, 2008
__________________________________
Professor David Olinger, Project Advisor

2
1 Abstract
The goal of this project was to design and build a one-kilowatt scale system for
generating power using a kite. Kite power has the potential to be more economical than using
wind turbines because kites can fly higher than turbines can operate. At higher altitudes, wind
speeds and available power are increased. In the developed system, a large windboarding kite
pulls the end of a long rocking arm which turns a generator and creates electricity. This motion
is repeated using a mechanism that changes the angle of attack of the kite during each cycle, thus
varying its lift force and allowing a rocking motion of the arm. The end of the arm turns a shaft
with a flywheel attached and spins a mounted generator, whose output then gets stored in
batteries for later use. A Matlab simulation was used to predict a power output for the system
of approximately one kilowatt. All sub-components of the system (power conversion
mechanism, angle of attack mechanism, and kite control mechanism) have been lab tested. The
complete kite power system has been field tested to confirm that the system structure can
withstand the structural loads imposed by the kite. The kite power system has produced power
for short time intervals with the rocking arm restricted to a portion of its full range of motion. A
future application for this system will be in a developing nation without access to a
power grid.
3
2 Table of Contents
1 Abstract .................................................................................................................................... 2 2 Table of Contents..................................................................................................................... 3
2.1 Table of Figures ............................................................................................................... 4 3 Introduction ............................................................................................................................. 6 4 Background ............................................................................................................................ 11 5 Project Objectives .................................................................................................................. 17 6 Design Process ....................................................................................................................... 18
6.1 Overall Design................................................................................................................ 18 6.2 Subcomponent Design.................................................................................................... 20
6.2.1 Control of the Kite Lateral Motions........................................................................ 20
6.2.2 Angle of Attack ....................................................................................................... 27
6.2.3 Power Conversion System ...................................................................................... 30
6.2.4 Kite Bouyancy ........................................................................................................ 33
6.2.5 Structural Improvement .......................................................................................... 35
6.2.6 Safety Precautions ................................................................................................... 37
7 Testing Methodology ............................................................................................................. 43 7.1 Static Test Setup ............................................................................................................. 43 7.2 Static Test Results .......................................................................................................... 45 7.3 Dynamic Test Setup ....................................................................................................... 46 7.4 Dynamic Test Results..................................................................................................... 49
8 Field Testing .......................................................................................................................... 50 9 MATLAB Dynamic Simulations........................................................................................... 54 10 MATLAB Dynamic Simulation Results ............................................................................ 57
10.1 Power Output .............................................................................................................. 57 10.2 Kite Motion................................................................................................................. 59 10.3 Tether Tensions .......................................................................................................... 61
11 CosmosWorks Finite Element Analysis ............................................................................ 62 12 CosmosWorks Finite Element Analysis Results ............................................................... 64
12.1 Von Mises Stress ........................................................................................................ 64 12.2 Displacement .............................................................................................................. 67
13 Conclusions ........................................................................................................................ 70 13.1 Overall Results ........................................................................................................... 71
14 Future Work ....................................................................................................................... 74 15 Reference List .................................................................................................................... 76

4
2.1 Table of Figures Figure 1: Global Wind Power Capacity .......................................................................................... 6 Figure 2: US Wind Consumption Statistics .................................................................................... 7 Figure 3: Power output and wind velocity for turbine and kite of 10 m2 area ................................ 9
Figure 4: Conyne Kite from Goela, 1983 ..................................................................................... 12 Figure 5: Goela Spring Model View 2, From Goela (1983) ......................................................... 14 Figure 6: Final System .................................................................................................................. 18
Figure 7: Kite Control Bar ............................................................................................................ 20
Figure 8: Kite Motion ................................................................................................................... 22
Figure 9: Kite Control Mechanism ............................................................................................... 23 Figure 10: Conceptual Sketch of First Kite Control Mechanism Design ..................................... 24
Figure 11: Strengthened Spring Control Mechanism ................................................................... 24 Figure 12: Design of New Concept for Kite Control Mechanism ................................................ 25 Figure 13: New Kite Control Mechanism as Built ....................................................................... 26 Figure 14: Kite Control Mechanism Attached to Rocking Arm ................................................... 27 Figure 15: Rocking arm diagram .................................................................................................. 28
Figure 16: AOA change mechanism ............................................................................................. 29 Figure 17: Rocking arm angles vs. weight.................................................................................... 30 Figure 18: Diagram of power conversion system ......................................................................... 31 Figure 19: Kite with buoyancy locations ...................................................................................... 34 Figure 20: Original mechanism .................................................................................................... 35
Figure 21: Structural Redesign of the Pivot Point ........................................................................ 36 Figure 22: Structural Improvements ............................................................................................. 37 Figure 23: Lock Out Mechanism .................................................................................................. 39 Figure 24: Lock Out Mechanism in Place .................................................................................... 39 Figure 25: HVAC Duct Lining ..................................................................................................... 40
Figure 26: Setup of Cantaloupe Test ............................................................................................ 41 Figure 27: Outcome of Cantaloupe Test ....................................................................................... 41 Figure 28: Release Mechanism ..................................................................................................... 42
Figure 29: Vertical Test Setup ...................................................................................................... 43
Figure 30: The Beam Weighted Down ......................................................................................... 44 Figure 31: Vertical Loading, Weight vs. Deflection ..................................................................... 45 Figure 32: Lateral Weight vs. Deflection ..................................................................................... 45 Figure 33: Free Fall into Tire Pile................................................................................................. 46
Figure 34: Dynamic Test Setup .................................................................................................... 47
Figure 35: Loading Over Time ..................................................................................................... 48
Figure 36: Roll stability test .......................................................................................................... 51
Figure 37: Kite flying on fixed arm .............................................................................................. 52
Figure 38: First power generated .................................................................................................. 53
Figure 39: Visualization of MATLAB Simulation ....................................................................... 55 Figure 40: Instantaneous Power - 10m2 kite ................................................................................. 58
Figure 41: Instantaneous Power - 6m2 kite ................................................................................... 58
Figure 42: Motion of 10 m2 kite ................................................................................................... 59
Figure 43: Motion of 6 m2 kite ..................................................................................................... 60 Figure 44: CosmosWorks Constraints and Loads ......................................................................... 62

5
Figure 45: Von Mises Stress, Bottom of Stroke ........................................................................... 65 Figure 46: Von Mises Stress, Horizontal Ascent .......................................................................... 65 Figure 47: Von Mises Stress, Just Before AOA Change .............................................................. 66 Figure 48: Von Mises Stress, Horizontal Descent ........................................................................ 66 Figure 49: Deflection, Bottom of Stroke ...................................................................................... 67 Figure 50: Deflection, Horizontal Ascent ..................................................................................... 68 Figure 51: Deflection, Just Before AOA Change ......................................................................... 68 Figure 52:Deflection, Horizontal Descent .................................................................................... 69 Figure 53: Main poster for EPA conference ................................................................................. 72 Figure 54: Supplementary poster for EPA conference ................................................................. 73

6
3 Introduction
If current global energy consumption trends continue, rough estimates show that non-
renewable energy sources could be depleted by as early as 20541. These estimates are
obviously not indicative of actual circumstances because as the energy sources diminish,
consumption will presumably adjust to those conditions. However, it important to
understand the inevitable fate of non-renewable energy; simply stated, it will run out.
Renewable energy alternatives have thus become increasingly popular in the modern world.
Among those alternatives, one largely untapped resource is wind power. In addition to
being renewable, wind power is a clean energy source, not contributing to harmful
byproducts such as carbon dioxide which may be contributing to global climate change.
Figure 1 shows the increasing popularity of wind power, which is currently second only to
hydropower, according to the Renewable Energy Policy Network2.
Figure 1: Global Wind Power Capacity2

7
Along with increasing global demand, the domestic demand for wind power is also
increasing. Figure 2 shows that although the fraction of renewable energy consumption in the
US has not significantly increased over the past 15 years, the fraction of wind energy
consumption to total energy consumption has significantly increased. Furthermore, the fraction
of wind energy within the renewable energy sector has also increased dramatically.
Figure 2: US Wind Consumption Statistics3
0.000
2.000
4.000
6.000
8.000
10.000
1990 1995 2000 2005 2010% R
en
ew
ab
le E
ne
rgy
Year
% Renewable Energy of Total US Consumption
vs. Year
0.000
0.100
0.200
0.300
1990 1995 2000 2005 2010
% W
ind
Po
we
r
Year
% Wind Power of Total US Consumption vs.
Year
0.000
1.000
2.000
3.000
4.000
5.000
1990 1995 2000 2005 2010
%W
ind
Po
we
r
Year
% Wind Power of US Renewable Energy
Consumption vs. Year
8
Wind turbines account for nearly one hundred percent of wind power being produced
today. One major disadvantage of the wind turbine is that as the height is increased (to access
higher wind velocities) the turbine blades become more difficult to structurally support, and
manufacturing stronger towers can become increasingly expensive. Another significant
downside to wind turbines that should not be overlooked is the noise that they produce. Nina
Pierpont, MD, PhD, who is a wind turbine noise expert asserts that “it is critical that industrial
wind turbines not be placed within a minimum of 1.5 miles of human dwellings.”4 Her studies
show a vast array of medical and behavioral symptoms, which she even deems “Wind Turbine
Syndrome”, that arise in situations where people reside close to wind turbines. This effect
obviously limits the locations in which they can be employed. In addition to the noise pollution,
there is also visual pollution associated with wind turbines. Many people consider wind turbines
to be aesthetically unpleasing, and there is strong opposition to many wind farm projects from
land owners and nature conservation groups.5
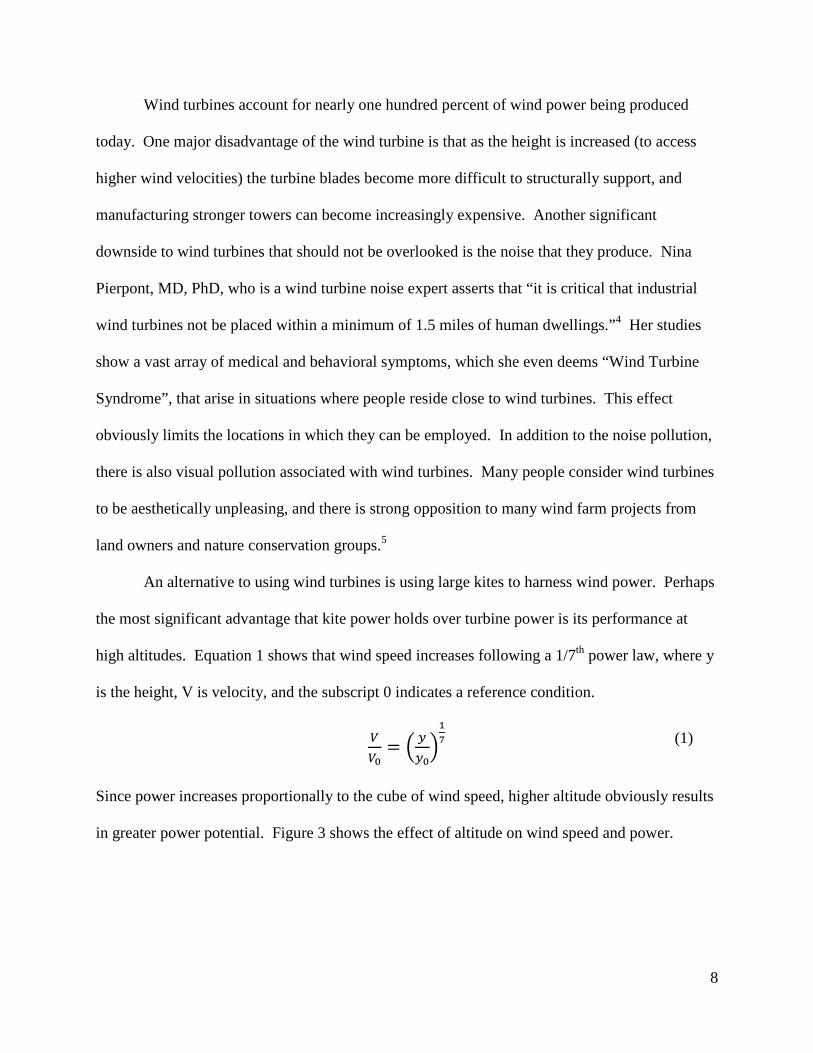
An alternative to using wind turbines is using large kites to harness wind power. Perhaps
the most significant advantage that kite power holds over turbine power is its performance at
high altitudes. Equation 1 shows that wind speed increases following a 1/7th power law, where y
is the height, V is velocity, and the subscript 0 indicates a reference condition.
���� � ����
��
Since power increases proportionally to the cube of wind speed, higher altitude obviously results
in greater power potential. Figure 3 shows the effect of altitude on wind speed and power.
(1)

9
Figure 3: Power output and wind velocity for turbine and kite of 10 m2 area6
Whereas turbine blades are held up by a rigid tower, a kite provides its own lift and is
only attached to kite lines. Increasing the altitude of the kites merely implies increasing the
length of the kite lines. Consequently, once a robust system of power harnessing with kites is
achieved, accessing higher power at higher altitudes is simple and inexpensive. For example,
flying a kite at 150m compared to operating a turbine at 50m would approximately double the
available wind power.
The goal of our project is to design and build a prototype one kilowatt scale kite power
system. An application of this kite power system would be in a rural area of a developing nation,
specifically one that did not have or could not afford access to the main power grid. This project
was started by an MQP team last year7, and this year we built on their work to develop a
functional prototype. The most difficult challenges of the project were to autonomously control

10
the kite and to efficiently convert its movement into electrical energy. These tasks required both
mechanical design prowess and a fundamental understanding of the kite’s dynamics.

11
4 Background
Though kite powered wind energy has not until recently become a popular concept, its
principles and potential have been considered for almost thirty years.
In 1979, Loyd8 investigated the potential for kite powered energy. According to Loyd, G.
Pocock had contemplated the use of kites to provide mechanical energy as far back as 1825 but
was limited by lack of advancement in the field of aerodynamics at the time. Pocock’s research
did establish that kites were a feasible source of mechanical energy as he was able to move loads
across the ground using only kite power with marginal effectiveness. Loyd built upon these
concepts by developing systems of equations governing crosswind kite motion and applying
them to modern airfoils. Extrapolating his results to technology similar to sophisticated wind
turbines, Loyd estimated that a 2000m2 kite flying at 1200m could produce 45MW (for
comparison, the average production of an industrial coal power plant is about 667MW).
At nearly the same time Dr J.S. Goela was conducting similar research at the Indian
Institute of Technology Kanpur. While Dr. Goela published a number of yearly reports in the
70’s and 80’s, our project focused on concepts and theories explored in his reports from 19769,
198310, and 198611. Specifically, our project is interested in the equation of kite motion and
power outlined in Goela. The goal of this work was to “experimentally demonstrate that systems
employing kites can be used to convert wind energy into useful mechanical energy.”11
Goela mathematically analyzed the steady state motion of kites and developed equations
to predict the kite’s motion and power output. To do so, he broke the kite’s cycle into two
phases, the ascent and descent. During ascent the kite produces power. The power output during
the ascent can be optimized for given conditions.
12
The effect of tether line drag on power output was also studied. Goela found that for the
thick tethers being used for this application, both gravity and wind resistance must be included in
determining the overall transmission efficiency (the ratio of tether tension at the kite to the
tension experienced at the ground). In doing so, he noted that the tether’s static profile and
behavior vary significantly from a common catenary, but could actually be modeled as a straight
line if shorter than 1000 meters and inclined 80o or greater.
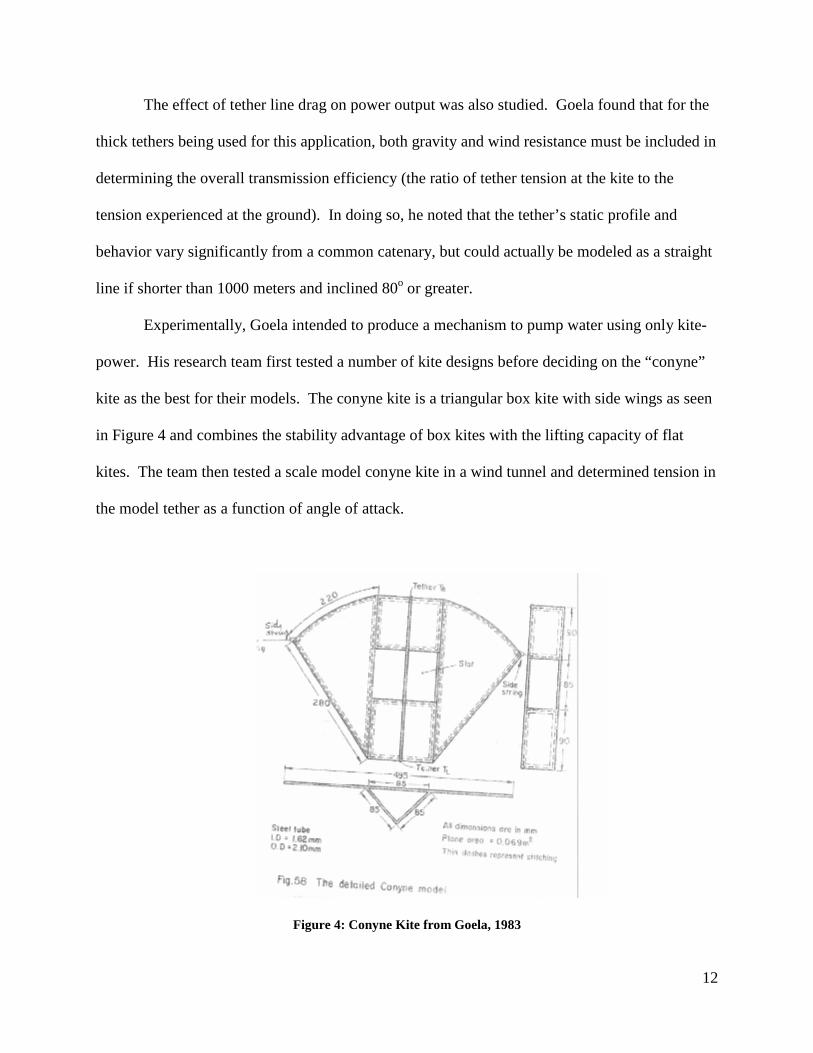
Experimentally, Goela intended to produce a mechanism to pump water using only kite-
power. His research team first tested a number of kite designs before deciding on the “conyne”
kite as the best for their models. The conyne kite is a triangular box kite with side wings as seen
in Figure 4 and combines the stability advantage of box kites with the lifting capacity of flat
kites. The team then tested a scale model conyne kite in a wind tunnel and determined tension in
the model tether as a function of angle of attack.
Figure 4: Conyne Kite from Goela, 1983

13
Goela’s team also designed a mechanical device to raise a bucket of water from a well
using the kite’s lift and then lower the bucket by reducing the kite’s angle of attack, and
consequently lift. Goela’s kite-pump mechanism was explained by the previous year’s MQP as:
The mechanism that Dr. Goela and his team designed consisted of a balanced
beam on a fulcrum with spring-loaded assists as shown in Figure 4. The springs in
the system were used as a switching mechanism in order to change the angle of attack
of the kite, cycling from ascent to descent. As the balanced-beam reaches the top of
its path, the water is discarded from the bucket, decreasing its weight bucket as the
angle of attack is decreased with the flip of the lever. The motion described above is
portrayed in the two stage view in Figure 5. Once the angle of attack is changed the
bucket is slightly heavier than the tension in the tether and the kite is pulled back
down to its starting point. The cycle restarts once the lever is triggered in the opposite
direction during the descent of the bucket and kite.7
Dr Goela, whose research and designs have heavily influenced the WPI Wind Power from
Kites project, has also lent his support as a technical consultant for this MQP. He has
reviewed the work on the project and participated in field testing of the kite power system.

14
Figure 5: Goela Spring Model View 2, From Goela (1983) Recently, the idea of kite powered energy generation is again being studied, however the
focus is often on larger power (MW scale) systems with kites flying at higher altitudes. The Kite
Gen group, based in Milan, Italy is currently working on a massive kite-driven power plant
aiming to replace nuclear plants in the future. The Kite Gen design involves a number of kites
tethered to a large ring. As the kites fly and produce power, the ring rotates about a shaft,
producing mechanical energy. Kite Gen’s kites are controlled by a system of winches attached
to the tethers of each kite, driven by complex avionics software developed for this specific use.
Kite Gen currently has plans for 100 MW and 1 GW plants.
In 2005 David D. Lang12 performed a detailed analysis of six different kite powered
systems considering factors such as maximum energy capacity, scalability, autonomy, and ease
of production. The Kite Gen design, labeled KIWI Gen in Lang’s presentation, scored the

15
highest overall rating. While each having unique advantages and disadvantages, the five other
designs in Lang’s report were lacking in either power output or feasibility.
Scoring second was Lang’s own design, the Reel mechanism. This small-scale, one-kite
design is theoretically simple, but mechanically inefficient in that motors are required to pull the
kite back to the start of a cycle decreasing overall net power output. In the reel design, a kite is
let out and allowed to rise with a high angle of attack; as the kite rises its turns a reel attached to
gears. At the end of this power stroke, the kite is depowered and reeled in by a motor. Other
designs included a highly productive but equally unfeasible “ladder” system which relies on a
chain of kites cycling up into the atmosphere and back again and turning a flywheel in the same
manner as a belt.
This project has also benefited from the work done by an MQP7 in 2006-2007. The
previous year’s team researched and analyzed kite power designs before deciding on a
conceptual design similar to Dr Goela’s, utilizing an rocking arm with a sliding mechanism to
change angle of attack. In this conceptual design power is produced by a combination sprag
clutch/pump jack which produced power on its up stroke and relied on the weight of the raised
beam to return the kite to its original position in the down-stroke. The team also analyzed and
tested a number of kites and agreed that a large, airfoil-shaped kite-boarding kite was the best for
the application. These decisions and how they have impacted the current project’s development
will be covered in more detail in the following sections of this report.
In 2008 Olinger and Goela published an ASME report6 on the preliminary findings from
this work. This paper was the first to include a detailed examination of kite aerodynamics in an
analysis of a kite power system. Using a Runge-Kutta scheme and assuming a straight line
tether, Olinger and Goela numerically solved the governing equations describing how the

16
performance parameters of the system such as output power, cycle time, and tether tension varied
with a number of system variables. This work verified the plausibility of a 10 m2 kite producing
1kW of power at wind speeds below 11m/s.

17
5 Project Objectives
The goals of this project are as follows:
• Design a prototype of a one kilowatt kite power system capable of harvesting wind
energy to produce useful mechanical energy
• Improve prototype existing structure from 2006-2007 project
• Develop an understanding of kite dynamics through field testing for use in autonomous
control
• Test structure and subcomponents over a range of expected conditions to ensure stability
and safety
• Present results at the 4rth annual National Sustainable Design Exposition for out project
sponsor, the US Environmental Protection Agency (EPA)

18
6 Design Process
6.1 Overall Design Below is a labeled photograph of our final kite power system (attached to an electrical
system designed by separate IQP project).
Figure 6: Final System
The kite power system consists of a commercially available kite-boarding kite and
tethers (1), a wooden A-frame, an aluminum rocking arm mounted at a series of pillow blocks
(4), an angle of attack mechanism (3), a roll stability mechanism (2), and the power conversion
system (5).

19
The kite (1) is attached to the end of a rocking arm at (2). A roll stability mechanism
autonomously ensures that the kite flies in a stable cycle. This mechanism works by rotating the
kite’s control bar as a reaction to lateral motion. As the rocking arm is lifted up, it in turn pulls a
spring loaded rope. The rope turns a shaft and a system of gears and belts with a gear ratio of 6:1
transmit this energy to another shaft. The second shaft attaches to an electrical generator and
also contains a flywheel to maintain its motion while on the down-stroke (5). Once the rocking
arm has rotated to a given angle, a weight in the angle of attack mechanism slides down, pulling
the kite’s trailing edge controls and stalling the kite. As the kite stalls and stops producing lift,
the arm falls due to gravity and the angle of attack mechanism resets the trailing edge lines to
their original tension. The kite again produces lift, restarting the cycle again.
This system has successfully been tested by component and as a whole in a battery of lab
and field tests.

20
6.2 Subcomponent Design
6.2.1 Control of the Kite Lateral Motions
Two kites are used for the project. Both are Peter Lynn kites from a well known
manufacturer and supplier of kite boarding kites, with the primary difference between them
being the size. The larger kite initially used by the team had a span from wingtip to wingtip of
twenty feet with a chord length of five feet. The smaller kite had a span of fifteen feet with a
chord length of four feet. Both kites used for the project used a similar control scheme,
consisting of a four line setup with two lines attached to the leading edge and two lines attached
to the trailing edge. These are attached to a control bar mechanism as shown in Figure 7.
Figure 7: Kite Control Bar
The two center lines are the leading edge lines. These lines experience the highest
amount of tension as most of the lift generated by the kite is translated through them to the ring,
which for kite boarding would be anchored to the kite boarder. For the kite power system, this

21
line is anchored to the rocking arm. The two outer lines are the trailing edge lines. These lines
are under far less tension than the leading edge lines and are the primary means of controlling the
kite.
Using the control bar, the kite boarder is able to vary the angle of attack of the kite as
well as maneuver its lateral (side-to-side) motion within the power window. The power window
is the area in which the kite is able to operate. This is the center 45 degrees of a half-hemisphere
volume downwind from the kite anchor point on the rocking arm. Lateral control is achieved by
simply rotating the control bar, causing the kite to bank and move in the specified direction. The
angle of attack is controlled by moving the control bar in and out while keeping the bar
horizontal. Pulling the control bar all the way towards the user, as shown in Figure 7, pulls the
trailing edge lines in, increasing the angle of attack so that the kite stalls. At this point the kite is
“depowered”. As the control bar is moved outward, the angle of attack decreases and the lift
generated by the kite increases. The kite is fully powered, generated the maximum amount of
lift, when the control bar is approximately three quarters of the way out, which can be seen in
Figure 7. Moving the control bar beyond this point is referred to as “auto-zenithing.” In this
mode, the kite has very little pull and flies almost directly overhead with little or no user input.
In order to achieve the goal of autonomous power generation, a mechanism had to be
designed to control the lateral motion of the kite. With no control input, disturbances such as
wind gusts can cause the kite to move to the side, as shown in Figure 8.

22
Figure 8: Kite Motion
Uncorrected, this behavior often results in the kite crashing. After a largely evolutionary
design process, we arrived at the design shown in Figure 9. The basic premise of this design was
to apply a rolling control input in the opposite direction of the kite motion. The pivoting center
arm would be able to move from side to side as the kite moved to either direction. As it does
this, the side control arms would hold the control bar, in effect rotating it with respect to the kite.
This causes the kite to move back towards the center of the window. The angle of attack slide
allows the entire mechanism to be moved in and out to allow for lateral control at all angles of
attack. Field testing showed that this design was able to satisfactorily control the lateral motion
of the kite in reasonable wind conditions, allowing it to remain in the air indefinitely. Field
testing will be further discussed later.

23
Figure 9: Kite Control Mechanism
Initial designs focused on the use of springs to dampen the lateral motion of the kite.
Two springs would be attached to the control bar, one to each end. Lateral motion of the kite
would cause the control bar to rotate. As the bar rotated, one spring would be put into tension
while the other was put into compression which would create a force in opposition to the rotation
of the control bar. A conceptual sketch of the mechanism is shown in Figure 10.

24
Figure 10: Conceptual Sketch of First Kite Control Mechanism Design
A sliding mechanism was incorporated into this design in order to allow for angle of
attack control. The springs were attached to the sliding part so that they would slide with the bar,
keeping the tension constant at all angles of attack. This design was tested on several occasions,
with modifications made between each testing session. Initial modifications centered on
strengthening the mechanism to allow it to withstand the high forces exerted by the kite.
Changes were also made to allow the control bar to slide more freely. Figure 11 shows a later
design of the spring concept.
Figure 11: Strengthened Spring Control Mechanism
25
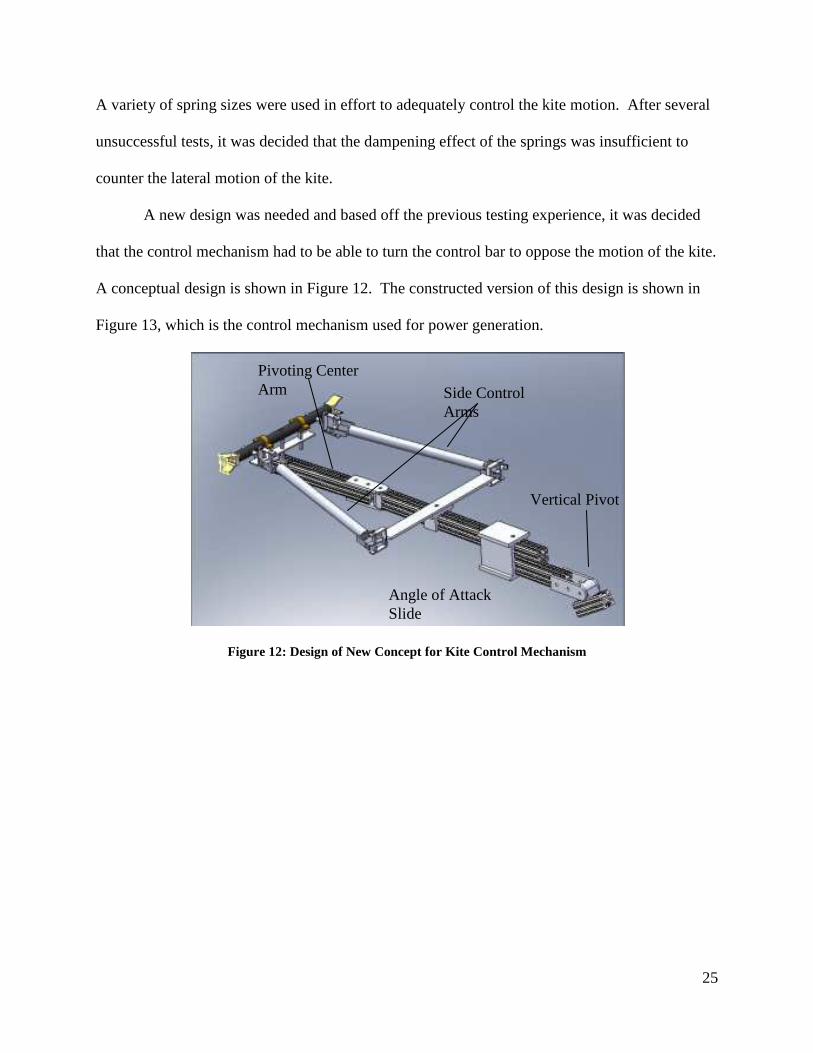
A variety of spring sizes were used in effort to adequately control the kite motion. After several
unsuccessful tests, it was decided that the dampening effect of the springs was insufficient to
counter the lateral motion of the kite.
A new design was needed and based off the previous testing experience, it was decided
that the control mechanism had to be able to turn the control bar to oppose the motion of the kite.
A conceptual design is shown in Figure 12. The constructed version of this design is shown in
Figure 13, which is the control mechanism used for power generation.
Figure 12: Design of New Concept for Kite Control Mechanism
Side Control Arms
Angle of Attack Slide
Vertical Pivot
Pivoting Center Arm

26
Figure 13: New Kite Control Mechanism as Built Any lateral motion of the kite would pull the control bar and the center pivot in the same
direction. The two shafts attached to either side of the control bar force the control bar to rotate
in the opposite direction, exerting a force on the kite to bring it back to center. Video showing
the operation of this mechanism during field testing in Rhode Island can be found on Youtube13.
Field testing showed that this design was capable of controlling the lateral motion of the
kite. Initial testing was done with the control mechanism anchored to the trailer hitch on a
pickup truck. Occasional user input was still required to handle drastic kite motion. However,
for reasonably small perturbations, the mechanism was able to control the lateral motion of the
kite, keeping it in the power window. Several modifications were made to improve the design. A
new bearing was added to the sliding mechanism which was better able to handle the high off-
center loads applied by the kite. The pivot which allows the mechanism to rotate vertically as
the kite powers and depowers was strengthened, again to better withstand the off center forces.

27
With these modifications, the kite could be flown for extended periods of time with
almost no human intervention required for lateral control. The only user input required was to
control the angle of attack, which was made significantly easier by the new bearing. Once the
design had proved itself under those conditions it was attached to the rocking arm of the kite
power system. Figure 14 shows the control mechanism attached to the rocking arm.
Figure 14: Kite Control Mechanism Attached to Rocking Arm This setup was tested and shown to be able to handle to large forces exerted by the kite.
With this final step completed, the team had a mechanism in place which was capable of
controlling the lateral motion of the kite while allowing for the angle of attack to be changed in
order to create the power/depower cycle necessary to create electricity.
6.2.2 Angle of Attack
The reason that the kite can generate power is its cyclical action between a powered and a
depowered mode. This behavior is caused by changing the angle of attack (AOA) of the kite
which powers the kite at lower AOAs and stalls it at higher AOAs. Consequently, the
mechanism which changes the AOA is crucial to the functioning of the entire system.

28
Figure 15: Rocking arm diagram6
There are two control lines attached to the leading edge of the kite and two attached to
the trailing edge. When the arm is in the position shown in Figure 15, the weight, which is
attached to the rear control lines, rolls towards point B. This increases the AOA, pulls on the
trailing edge lines, and stalls the kite to decrease lift. When the retraction spring pulls the arm
back down, the weight rolls back to A and the trailing edge lines are released, which decreases
the AOA and increases the lift on the kite. The arm then rises again and the cycle repeats,
causing the rocking motion of the arm to be converted to electrical energy.
Since it is very difficult to predict the required weight, length of motion, and timing of
the rolling weight, it was necessary to develop a flexible design where those three properties
could be varied. To deal with the issue of exactly when the weight should start rolling to change
the AOA, we designed a system where the weight, before moving, would have to roll past a
tensioned gate. For this we used spring hinges frequently found on two-way screen doors. There
is one gate on both ends of the weight’s track to control the start time of descent for the power
and depower cycle. In addition, the hinges have tension control which we can use to fine tune

29
the timing of the weight. The weight rolls on two trolleys which fit into strut channels and the
amount of weight can easily be changed. Lab testing was conducted on the mechanism to
determine angles at which the rolling weight overcomes the tension in the hinge. Figure 17
shows the results.
Figure 16: AOA change mechanism

30
Figure 17: Rocking arm angles vs. weight
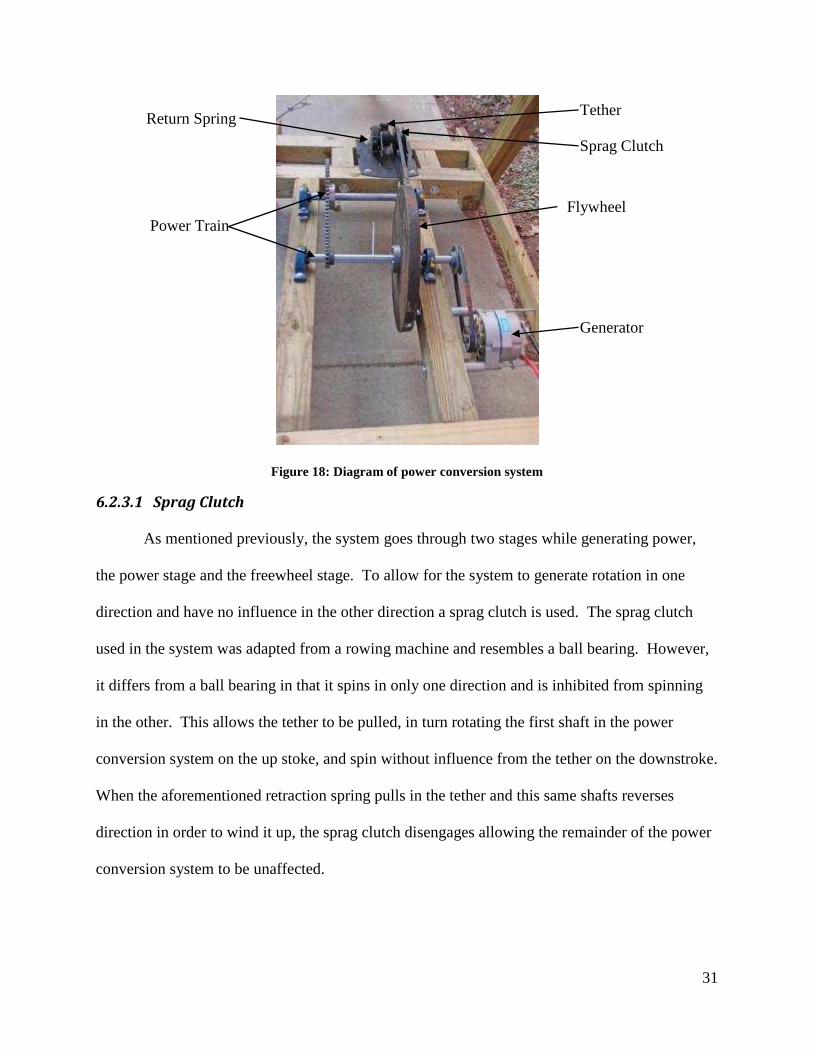
6.2.3 Power Conversion System The power conversion system is responsible for converting the linear motion of the arm
into rotational motion, then transferring that rotational motion to a generator. The system also
contains a flywheel to store mechanical energy, which allows the system to stay spinning when
the rocking arm is on its down stroke. Lastly the power conversion mechanism utilizes a
retraction spring to rewind the tether that links the beam to the power conversion system.
0
5
10
15
20
25
30
35
5 9 15A
ng
le (
de
gre
es)
Weight (lbs)
Rocking Arm Angles vs. Weight
Low Tension Medium Tension High Tension
31
Figure 18: Diagram of power conversion system
6.2.3.1 Sprag Clutch As mentioned previously, the system goes through two stages while generating power,
the power stage and the freewheel stage. To allow for the system to generate rotation in one
direction and have no influence in the other direction a sprag clutch is used. The sprag clutch
used in the system was adapted from a rowing machine and resembles a ball bearing. However,
it differs from a ball bearing in that it spins in only one direction and is inhibited from spinning
in the other. This allows the tether to be pulled, in turn rotating the first shaft in the power
conversion system on the up stoke, and spin without influence from the tether on the downstroke.
When the aforementioned retraction spring pulls in the tether and this same shafts reverses
direction in order to wind it up, the sprag clutch disengages allowing the remainder of the power
conversion system to be unaffected.
Sprag Clutch
Power Train
Return Spring Tether
Generator
Flywheel

32
6.2.3.2 Power Train In order to transfer the rotational motion to the generator, a power train was developed.
Also the power train was designed to provide a final gear ratio of approximately .6:1. This
“gearing up” allowed the final shaft that would be connected to the generator to be spinning at a
much higher RPM, approx 1200, than the shaft with the tether attached to it. This was necessary
to get adequate voltage from the generator.
6.2.3.3 Flywheel This system depends on the switching between power and freewheel cycles, which could
lead to times where the power conversion system would be spinning at high speed and then not
at all. What was desired was to have the system continue to spin while in the freewheel stage.
This is desirable because when the system spins at a constant rate the power output from the
generator will also be constant. When this system is spun normally the resistance from the
generator and the natural friction of the system causes it to stop spinning immediately after the
beam stops influencing the power conversion mechanism. In order to get a more constant spin a
flywheel was added into the power train. The flywheel is basically a large metal disc with a high
rotational moment of inertia, which means once it starts spinning it will resist the frictional
forces and keep spinning. Two flywheels were used during testing. Their specifications are
included in Table 1.
Mass 20.4 kg 11.3 kg
Diameter 44 cm 26.9 cm
Moment of Inertia 0.483 kg m2 0.103 kg m2
Table 1: Flywheel Specifications

33
Moment of inertia was calculated using the thin disc assumption where, � ��
�. M is the
mass of the disc and R is the radius.
The down side of a flywheel is that while it will spin for longer, it takes a lot of force to
get it spinning in the first place. This resistance to spinning makes it difficult for the system to
get the flywheel up to operating speed, and it usually takes 2-3 power cycles to achieve this.
6.2.4 Kite Bouyancy An important technical hurdle to overcome is the issue of a no-wind condition. Although
large kites can fly in very low wind speeds, and higher altitude winds are much more persistent
and strong than ground-level winds, there is still the possibility of a complete loss of wind, in
which case the kite would fall to the ground. This presents several issues, including the
necessary re-launching of the kite, as well as possible impacts on objects below. To solve this
problem, our team investigated the use of helium to buoy the kites in case of a loss of wind.
Because our kites are twin-membrane, with a hollow interior, it is possible to insert
helium bladders into the individual cells of the kite. To this end, we created openings in the
trailing edge of 11 cells on our 10 sq. meter kite and sewed Velcro strips into the trailing edge in
order to seal these openings during flight. This allows for access into these cells, where the
helium filled bladders or balloons can be inserted. The usable volume of these cells was
computed, and then experimentally confirmed, to effectively allow for the helium bladders to loft
approx. half of the kite’s weight. Although this does not make the kites completely buoyant, it
will allow for the kite to fly in lower speeds due to the decrease in lifting force necessary to loft
the kite’s weight.

34
In order to make the kite completely buoyant, rip stop nylon sleeves were sewn to
accommodate the remaining necessary helium external to the kite. These sleeves are roughly 5
feet long, with a diameter of approximately 3 feet. They will be attached at the wing tips of the
kite, between the leading and trailing edge control lines. Filling these sleeves with helium
bladders will account for the remaining buoyancy required to lift the kite.
Figure 19: Kite with buoyancy locations
In the future, this solution to the kite buoyancy issue will need to be further addressed in
several areas. First, the flight dynamics of the kite with the helium bladders will need to be
assessed through flight testing, as well as using the kite simulation developed by Olinger and
Goela (2008). The main issues will be the increase in drag associated with the internal bladders
and external sleeves, as well as the effect of a buoyant force on the dynamic equations of motion.
Additionally, it will have to be determined whether or not the kite will still be able to crash, even
if it is effectively weightless. Also, the helium bladders add a significant amount of weight to

35
the kite, meaning more helium is required. A possible solution is to use a helium-tight kite,
which introduces added cost and complexity. In conclusion, a helium-lofted kite does seem to
be the most simple and effective way of preventing the kite from falling due to a loss of wind,
but a continuation of our team’s analysis will be needed to determine the most effective method
of implementation.
6.2.5 Structural Improvement
The structure for the power generation mechanism is an A-frame structure which
supports the aluminum rocking arm. The original structure built by the 2006-2007 MQP team is
shown in Figure 20 below. Initially, the arm was mounted to the top cross-beam of the base
structure by two pillow block bearings attached to the steel sleeve which supports the center
piece of the aluminum arm. These pillow blocks shared a common shaft with two other pillow
block bearings mounted on the wooden cross-beam, and it was around this shaft which the entire
arm rotated.
Figure 20: Original mechanism
36
However, this construction presented two major problems. First, the considerable length
of the aluminum arm meant that any sideways force at the end of the arm subjected the pivot
point to significant moments about the vertical axis. These moments proved too large for the
pillow blocks mounted on the wooden cross-beam as the bearings were beginning to wiggle their
bolts loose. Consequently, the arm would experience significant yaw for even relatively small
sideways forces applied to the ends of the arm. Second, the large moments were also inducing
high magnitudes of stress in the wooden structure, especially at the intersection of the wooden
cross-beam and the legs of the structure. Our goal was to eliminate the yaw of the arm, and
better allow the structure to handle the large moments developed by the sideways forces that will
be applied to the arm when the mechanism is in use.
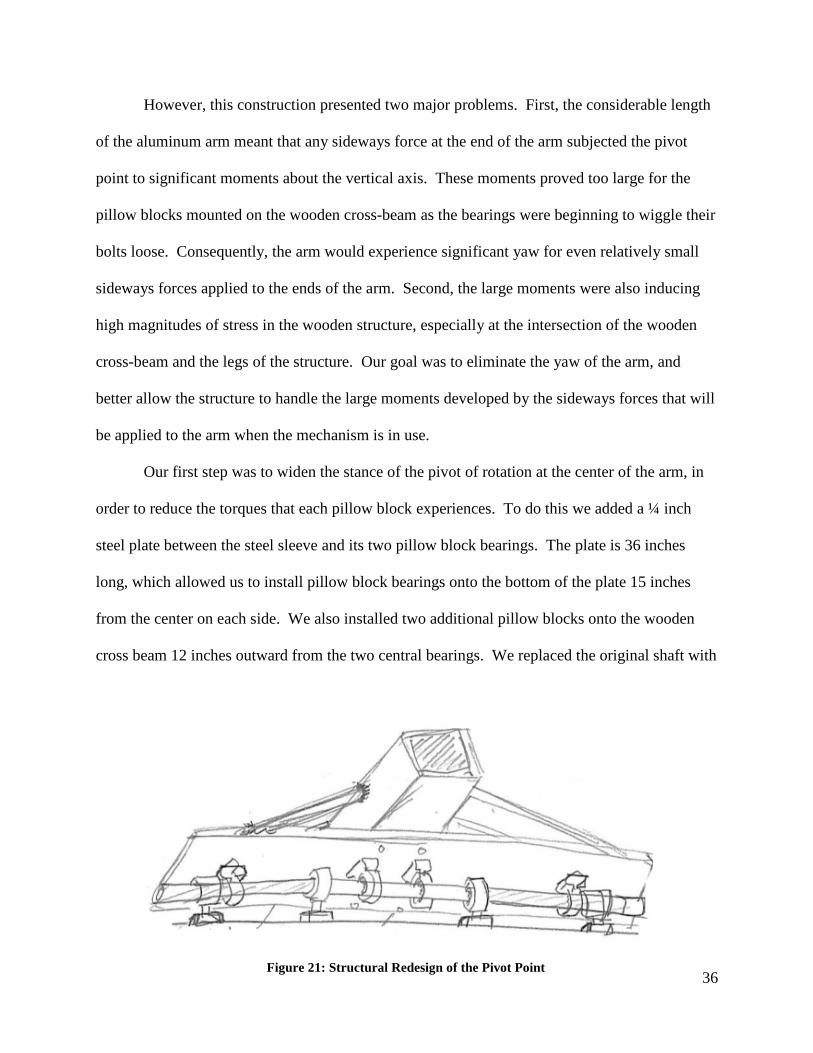
Our first step was to widen the stance of the pivot of rotation at the center of the arm, in
order to reduce the torques that each pillow block experiences. To do this we added a ¼ inch
steel plate between the steel sleeve and its two pillow block bearings. The plate is 36 inches
long, which allowed us to install pillow block bearings onto the bottom of the plate 15 inches
from the center on each side. We also installed two additional pillow blocks onto the wooden
cross beam 12 inches outward from the two central bearings. We replaced the original shaft with
Figure 21: Structural Redesign of the Pivot Point

a new 4 foot shaft which all eight pi
Additionally, we bolted four struts diagonally from the plate to the arm itself to further
brace the arm against yaw. The struts were made from ¾ inch aluminum conduit tubing. The
installed plate and struts are shown here.
Bracing of the wooden structure involved installing metal angle brackets onto the
weakest corners of the structure, and anchors at the base of the le
ground during operation.
A rigorous stress analysis was
6.2.6 Safety Precautions Considering the magnitude
created in the kite power system, safety was one of the most important aspects for the team to
look at. Several precautions were taken, not only to prevent an accident from occuring, but to
also to curb injury in unexpected incidents. In addition to always maintaining awareness and
Figure
a new 4 foot shaft which all eight pillow block bearings now share (Figure 21).
lly, we bolted four struts diagonally from the plate to the arm itself to further
brace the arm against yaw. The struts were made from ¾ inch aluminum conduit tubing. The
installed plate and struts are shown here.
Bracing of the wooden structure involved installing metal angle brackets onto the
weakest corners of the structure, and anchors at the base of the legs to hold the structure to the
alysis was later conducted to test these improvements.
magnitude of the kite forces (approximately 200 lbf tether tension)
the kite power system, safety was one of the most important aspects for the team to
look at. Several precautions were taken, not only to prevent an accident from occuring, but to
also to curb injury in unexpected incidents. In addition to always maintaining awareness and
Figure 22: Structural Improvements
37
lly, we bolted four struts diagonally from the plate to the arm itself to further
brace the arm against yaw. The struts were made from ¾ inch aluminum conduit tubing. The
Bracing of the wooden structure involved installing metal angle brackets onto the
gs to hold the structure to the
improvements.
(approximately 200 lbf tether tension)
the kite power system, safety was one of the most important aspects for the team to
look at. Several precautions were taken, not only to prevent an accident from occuring, but to
also to curb injury in unexpected incidents. In addition to always maintaining awareness and
38
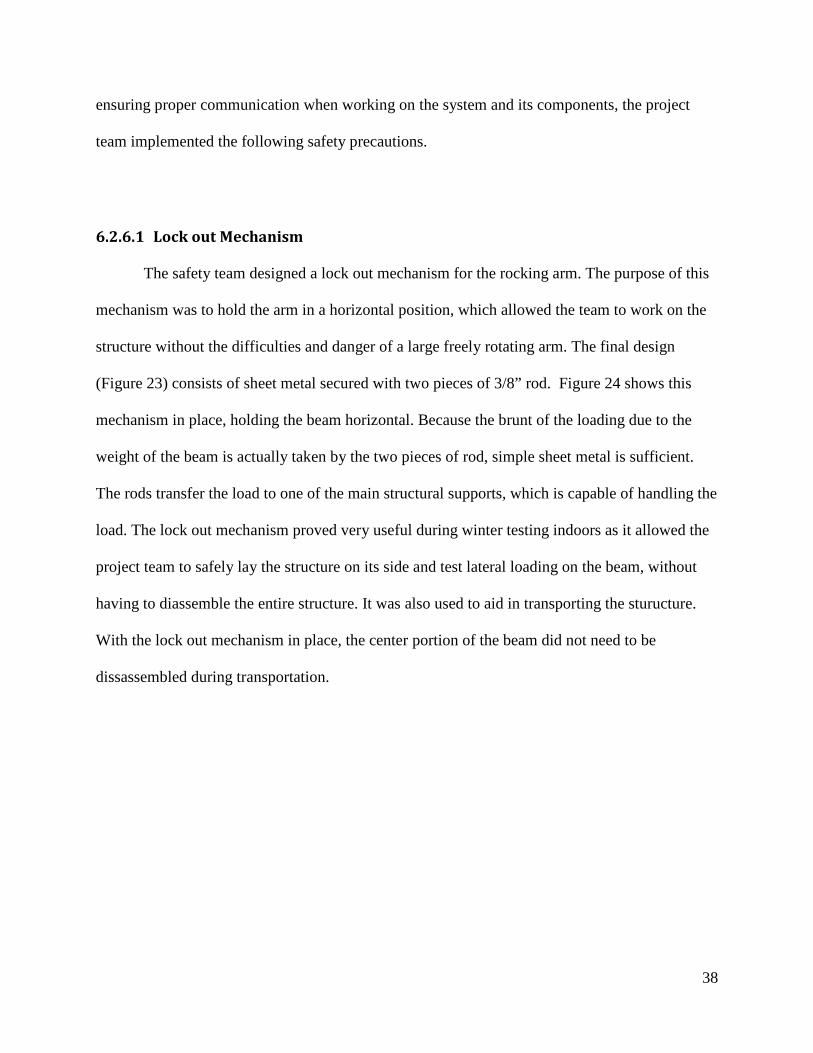
ensuring proper communication when working on the system and its components, the project
team implemented the following safety precautions.
6.2.6.1 Lock out Mechanism
The safety team designed a lock out mechanism for the rocking arm. The purpose of this
mechanism was to hold the arm in a horizontal position, which allowed the team to work on the
structure without the difficulties and danger of a large freely rotating arm. The final design
(Figure 23) consists of sheet metal secured with two pieces of 3/8” rod. Figure 24 shows this
mechanism in place, holding the beam horizontal. Because the brunt of the loading due to the
weight of the beam is actually taken by the two pieces of rod, simple sheet metal is sufficient.
The rods transfer the load to one of the main structural supports, which is capable of handling the
load. The lock out mechanism proved very useful during winter testing indoors as it allowed the
project team to safely lay the structure on its side and test lateral loading on the beam, without
having to diassemble the entire structure. It was also used to aid in transporting the sturucture.
With the lock out mechanism in place, the center portion of the beam did not need to be
dissassembled during transportation.

39
Figure 23: Lock Out Mechanism
Figure 24: Lock Out Mechanism in Place

40
6.2.6.2 Hard Hats/Safety Padding To prevent serious head injury from the weight of the rotating beam, the team took two
main actions; hardhats and padding. Hard hats were required to be worn by anyone in the
vicinity of the structure. This procedure was important not only while working on the beam, but
also during testing of other components throughout the duration of the project. To further soften
the impact of the beam striking anything, the team chose to line the bottom with ahigh density
HVAC duct lining Figure 25. This padding was an ideal choice mainly because of its high
density, which allows maximum distortion and energy absorption. The padding was originally
fastened to the beam using hose clamps. However, due to the difficulty of installing and
removing the hose clamps, a design change was implemented in which nylon straps with velcro
replaced the hose clamps.
To test the effectivness of the hard hats and padding, a “Cantaloupe Test” was conducted.
This test consisted of dropping the beam from a raised position onto a cantaloupe direcetly
underneath the beam. The setup of the test can be seen in Figure 26. The cantaloupe was placed
on small table to simulate someone crouching, possible working on a piece of the structure. Two
Figure 25: HVAC Duct Lining

41
cases were tested. The first consisted of dropping the beam with no padding of the bottom onto a
bare cantaloupe; the second with the HVAC liner and a cantoloupe with a hard hat. Figure 27
demonstrates the comparison between the outcomes of the two cases, with the first test on the
left and the second on the right. As one can see from the pictures, the beam completely smashes
the first cantoloupe, while the second cantaloupe remains intact. These experiments gave the
project team reassurance in the effictiveness of the hard hats and padding, as well as a good
example of why hard hats always need to be worn.
Figure 26: Setup of Cantaloupe Test
Figure 27: Outcome of Cantaloupe Test

42
6.2.6.3 Release Mechanism Another area the safety team needed to look at was the design of a mechanism that would
allow for remote release of the rotating arm while the kite was attached. This was especially
important for early tests with the kite attached. Because the team anticipated the kite would be in
the powered region and have a fair amount of pull, the arm needed to be secured in the lowered
position while the kite was being attached. For this reason, it is best to have everyone clear of
the arm when it was released. The release mechanism designed for this problem Figure 28
consists of a short piece of chain, a 3/8” latch pin, and a metal bracket. One end of the chain is
attached to a brace on the bottom of the structure and the other is attached to the arm via the
metal bracket and latch pin. The latch pin has a 6 ft. long piece of rope which allows it to be
pulled out, releasing the arm from a distance and allowing for a safe remote operation.
Figure 28: Release Mechanism

43
7 Testing Methodology
Before field testing of the entire kite power system could be considered, each component
was lab tested to determine its performance under load. The first series of tests were static,
meaning forces applied did not change over time. Static tests were followed by dynamic tests.
Dynamic tests were involved to verify the beam and structure’s ability to endure short to mid-
term cyclical testing in conjunction with the kite during future development. The sections to
follow describe, in more detail, the test setups and the results obtained after completing those
tests.
7.1 Static Test Setup As summarized previously, the function of the static tests is to verify the arm’s
performance and structural rigidity under load. For this test the rocking arm was fixed in a
horizontal position with one end chained down to the structure. On the opposite end a metal
basket was attached to the beam using chain and an eye bolt inserted through a previously drilled
hole in the beam. Weight of the basket and accessories summed to approximately 200 lb. Figure
29 shows a sketch of a side view of the test setup.
Figure 29: Vertical Test Setup
44
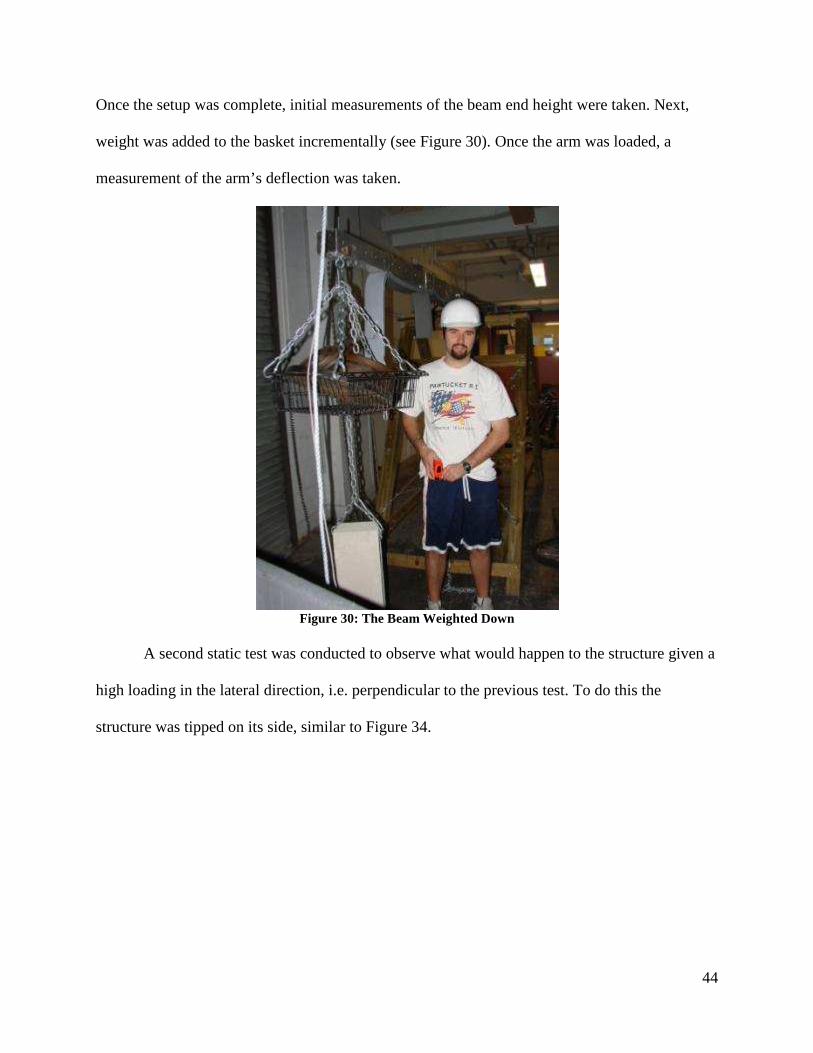
Once the setup was complete, initial measurements of the beam end height were taken. Next,
weight was added to the basket incrementally (see Figure 30). Once the arm was loaded, a
measurement of the arm’s deflection was taken.
Figure 30: The Beam Weighted Down
A second static test was conducted to observe what would happen to the structure given a
high loading in the lateral direction, i.e. perpendicular to the previous test. To do this the
structure was tipped on its side, similar to Figure 34.

45
7.2 Static Test Results
The beam loading test results can be seen below in Figure 31 and Figure 32. As you can
see, the deflection from the beam did not exceed 2.5 inches, even under a loading of over 150
lbf. Based on the length of the rocking arm, these deflections were acceptable.
Figure 31: Vertical Loading, Weight vs. Deflection
Figure 32: Lateral Weight vs. Deflection
0.00
0.50
1.00
1.50
2.00
2.50
0 50 100 150 200
De
fle
ctio
n (
in)
Weight (lb)
Vertical Beam Deflection
0.00
0.50
1.00
1.50
2.00
2.50
0 50 100 150 200
De
fle
ctio
n (
in)
Weight (lb)
Lateral Beam Deflection

46
7.3 Dynamic Test Setup
In order to simulate the potential wear and tear the kite and its motion will have on the
structure, dynamic testing was a combination of two setups. First a rope was attached to the
beam end where the kite is planned to be attached. That rope was then routed through a pulley on
the ceiling so that the beam could be lifted up and down via the rope while the operator stood at a
safe distance. The critical part of the test was cycling the beam up and down, allowing it to free
fall into a pile of used tires, Figure 33.
Figure 33: Free Fall into Tire Pile

47
The test was continued through 1000 cycles with time taken to observe the beam and structure at
about every 100 cycles.
The second setup involved turning the structure on its side. A rope, identical to the one
mentioned previously, was attached to the beam end at approximately the location where the kite
will attach. Next a loop (or bight) was tied into the rope so that a spring and weight system could
be implemented (Figure 34).
Figure 34: Dynamic Test Setup The spring that was used is a large garage door spring, rated to lift a 175lb door. Approximately
82 lbs was attached to the spring and then set into oscillation by displacing the weight such that it
would cycle with an amplitude of 18 inches. This effectively simulates cyclical side forces that
mimic those the kite will apply as it flies across the sky. The amplitude of the loading was
calculated and can be seen in Figure 35 below. The test was conducted through a few cycles,
with careful observation taken during and post test.

48
Figure 35: Loading Over Time
In order to get a benchmark for a worst case scenario, the test above was done without the
spring. This creates an impact loading that creates a large force over a short time; effectively
simulating the kite rapidly changing direction. Given the limitations of those conducting the
experiment, the amount of weight was set at 50 pounds and was dropped from approximately
two feet. Based on the deflection of the beam, the drop was estimated to be the equivalent of a
175 pound side load, applied over a period of about .25 seconds. Deflection was estimated by
observing a tape measure placed next to the beam during the test.
0
20
40
60
80
100
120
140
160
0 2 4 6 8
Loa
d (
lbf)
Time (s)
Force Vs. Time for 82 lb Load/18 in. Amplitude

49
7.4 Dynamic Test Results
The data taken from the dynamic tests was made up entirely of observations of the
structure, the beam, and all of the points of attachment. It can be generalized that the structure
showed little to no damage after both cycle tests and should hold up well during long term use.
While the effects of weathering on durability could not be directly determined from these tests, it
would most certainly decrease the lifespan of the structure. Even during the drop test, the
maximum deflection was only approximately two inches.

50
8 Field Testing
In addition to our laboratory testing, which was mainly conducted to evaluate the structural
strength of our mechanisms, field testing was conducted to determine their real world
performance. The majority of our testing took place at a public beach in Seabrook, NH, due its
consistent wind conditions, and Mesa Farm in Rutland, MA, nearby to Overlook Farm. The tests
dates were heavily influenced by the weather, as most of our testing fell during the winter
months in New England. We were able to test on days when the weather co-operated, especially
the wind conditions. We determined the approximate wind speeds in advance using NOAA’s
website14, which gives accurate predictions of wind velocity and direction several days in
advance.
The majority of our testing was devoted to developing and refining the kite control
mechanism, as this presented the most pressing technical challenge of our project. The initial
design, two springs configured on either sides of the control bar, was tested two times in A term
2007. The initial test, conducted at Mesa Farm, was unsuccessful, so the team decided to test
again using springs of different force constants. When the second test once again proved
unsuccessful, the team realized a new design was necessary. Our experience in these tests, as
well as our observations of the basic fundamentals of kite control, helped us to realize that the
kite control mechanism needed a complete re-design. This design can be seen in more detail in
the roll stability subcomponent section.
Our first field test of the second design resulted in a near-immediate failure of a bolt
holding the device to the truck hitch that the kite was anchored to; another example of the
considerable force the kite is capable of generating. Upon inspection, we found we had attached
51
the kite leading edge tether lines improperly to a bolt on the control mechanism as opposed to the
truck hitch. As a result, this small bolt took the entire kite load.
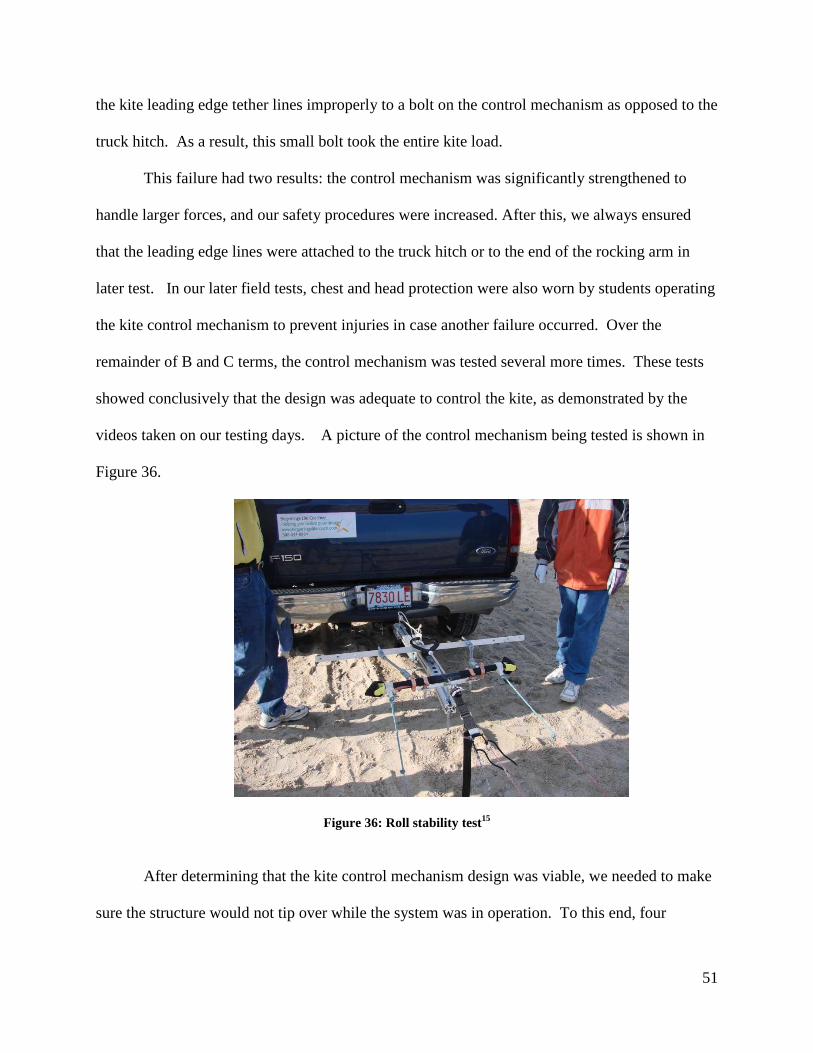
This failure had two results: the control mechanism was significantly strengthened to
handle larger forces, and our safety procedures were increased. After this, we always ensured
that the leading edge lines were attached to the truck hitch or to the end of the rocking arm in
later test. In our later field tests, chest and head protection were also worn by students operating
the kite control mechanism to prevent injuries in case another failure occurred. Over the
remainder of B and C terms, the control mechanism was tested several more times. These tests
showed conclusively that the design was adequate to control the kite, as demonstrated by the
videos taken on our testing days. A picture of the control mechanism being tested is shown in
Figure 36.
Figure 36: Roll stability test15
After determining that the kite control mechanism design was viable, we needed to make
sure the structure would not tip over while the system was in operation. To this end, four

52
anchors were attached to the A-frame structure and planted in the beach at Seabrook. A rope
was then attached to the end of the arm at the point where the kite exerts force. Four members of
the team pulled on the rope to simulate several hundred pounds of side force exerted by the kite,
significantly more than the kite will generate. After repeating this test several times without the
structure tipping, we determined that the anchors would be sufficient to stabilize the structure
while in operation.
With the structure having passed all its structural tests, and with the team being confident
that the control mechanism could successfully control the kite, the next step was to fly the kite,
attached to the rocking arm which was fixed, by attaching the arm to an anchor. This test was
conducted at Mesa Farm on March 26, 2008 in approximately 13 knot winds. The kite flew for
over a minute and completed several power cycles, without failure in the structure or control
system, as shown in Figure 37.
Figure 37: Kite flying on fixed arm16
This led to our last, and most exciting test which was generating power for the first time.
This test was conducted at Seabrook, NH on April 6, 2008 in approximately 18 knot ground level

53
winds. Once again, the rocking arm was fixed to the ground, but this time approx. 1-2 feet of
arm stroke was allowed so the generator could be turned. The kite successfully completed
several power cycles and turned the power conversion mechanism and generator shaft. Since the
arm stroke was very limited, only a small percentage of the system’s potential power was
generated. However, the system did produce measurable power over several minutes, thus
proving that our kite power system is feasible and capable of extracting power from the wind. In
the near future, tests allowing a greater arm stroke will be conducted, culminating in a full-scale
test, which will allow us to see the full power potential of the system.
Figure 38: First power generated17

54
9 MATLAB Dynamic Simulations The project team utilized a MATLAB simulation developed by Dr. David Olinger and
Dr. Jitendra Goela. The theoretical basis for the model is derived from the previously mentioned
work done by Dr. Geola. The work done by Dr. Goela was modified to more accurately represent
the kite power system developed by the project team by including the power conversion system,
which requires incorportation of the gearing and flywheel into the dynamics of the simulation. A
brief overview of the governing equations for the model will be given here. A detailed derivation
is available in Olinger & Goela6.
Before introducing the main governing ODEs for the simulation, the following variables
must be defined:
The model is based on energy conservation throughout the individual components of the
kite power system. A general visualization of the the way the model works is shown below in
Figure 39, adapted from Olinger & Goela6. When the arm is pulled up by the kite, the clutch and
flywheel are engaged and accelerate as the arm moves up. A load is also attached to the system

55
and the load raises as the the flywheel rotates. When the arm is on its downstroke, the clutch and
flywheel are disengaged from the arm. However, the flywheel continues to rotate and raise the
load. Power output is measured by calculating the overall increase in height of the weight for
each cycle. Other outputs from the simulation include arm angles, tether angles, tether forces,
flywheel speeds and flight path of the kite.
Figure 39: Visualization of MATLAB Simulation6
The five governing ODEs for the model are shown below. Equation 2 relates the
acceleration of the end point of the arm to the forces acting upon it. Equation 3 relates the
acceleration of the kite in the direction normal to the tether to the forces acting upon the kite.
Equation 4 shows that the energy that is put in or taken away from the flywheel goes into raising
the load. Equation 5 and Equation 6 describe how the change in angle of the kite tether and
rocking arm is related to the normal velocity of the kite and velocity of the end of the arm,
respectively.

56
(2)
(3)
(4)
(5)
(6)

57
10 MATLAB Dynamic Simulation Results
The project team ran the MATLAB simulation for both of the kites utilized throughout
the development of the kite power system. The main parameter changes between the two runs
were the area of the kites and the weight of the kites. These runs were completed with the overall
gear ratio of 6:1 and flywheel size (45 lbf weight plate) present on the actual system. The team
was mainly interested in three outputs: potential power production, kite motion and tether
tensions. The tether tensions were of interest because they would be used to for a Finite Element
Analysis in CosmosWorks on the rocking arm. For this reason, the tensions for the 10 m2 kite
would be used as it was the kite that would pull with the most force.
10.1 Power Output
The instantaneous power output for the 10 m2 and 6 m2 kites are shown in Figure 40 and
Figure 41, respectively. The graphs show an approximately 15 second interval from the middle
portion of the run. This interval was chosen to allow transients in the start up of the system to
steady out. One can clearly see the cyclic nature of the system, visible in the peaks and valleys of
the graphs. The power produced by the 10 m2 kite oscillates between about 2.2 kW and 3.2 kW,
while the power produced by the 6 m2 kite ranges from just over 1 kW to about 2 kW. The
average power output, over all the cycles, for the larger kite is 2.82 kW, while the smaller kite
produces about 1.67 kW. Both of these numbers are on par with what is expected to be produced,
as other effects such as friction in the gearing and heat dissipated in generator would lower the
power actually produced in the actual system.

58
Figure 40: Instantaneous Power - 10m2 kite
Figure 41: Instantaneous Power - 6m2 kite
0
500
1000
1500
2000
2500
3000
3500
25 30 35 40
Po
we
r (W
att
s)
Time (s)
Instantaneous Power
0
500
1000
1500
2000
2500
25 30 35 40
Po
we
r (w
att
s)
Time (s)
Instantaneous Power

59
10.2 Kite Motion
The horizontal and vertical motion of the 10 m2 and 6 m2 kite during the simulation are
shown in Figure 42 and Figure 43, respectively. This is the motion an observer would see if they
were looking at the system from the side (similar to Figure 39 shown earlier). The path on each
graph shows the relative movement of the kite; each kite begins the simulation at the origin (0,0)
and moves from there. The motion shown for each kite is the stable loop each kite eventually
enters after several cycles. It is interesting to note the different positions the kite enter their stable
loops in, with the larger kite sitting more in front of the rocking arm than the smaller kite.
Figure 42: Motion of 10 m2 kite
-2
-1.5
-1
-0.5
0
0.5
1
1.5
2
0 1 2 3 4 5
Ve
rtic
al
Po
siti
on
(m
)
Horizontal Position (m)
Kite Motion

60
Figure 43: Motion of 6 m2 kite
-0.5
0
0.5
1
1.5
2
2.5
3
-3 -2.5 -2 -1.5 -1 -0.5 0 0.5 1 1.5 2
Ve
rtic
al
Po
siti
on
(m
)
Horizontal Position (m)
Kite Motion

61
10.3 Tether Tensions
As previously mentioned, the MATLAB simulation was also used to determine
anticipated tether tensions to use in a CosmosWorks Analysis on the rocking arm. These results
from the MATLAB simulation are summarized in the CosmosWorks Section of the report.

62
11 CosmosWorks Finite Element Analysis
To ensure that the rocking arm would be able to withstand the loads placed on it by the
kite during normal operation, a rough Finite Element Analysis was conducted using the
CosmosWorks add-in for SolidsWorks. A solid model was completed of the three individual
sections of the rocking arm and the individual components were put together in an assembly. The
material for the arm was 6063-T6 Aluminum and a standard mesh was used. The constraints and
loads placed on the beam can be seen in Figure 44.
The pink arrow closest to the center of the arm represents the force of the cord where the
power conversion system is attached. The two pink sets of arrows toward the end of the arm
represent the force from the kites tether lines. One force is perpendicular to the arm and one is
parallel to the arm because the kite tethers pull at an angle to the beam. These two forces allow
for the force to be decomposed into its components. The green bundle of arrows in the center of
the arm shows that all six degrees of freedom in that location are constrained. This was
acceptable for a simple analysis, as the arm was going to be examined separately at four different
positions of the beam.
Figure 44: CosmosWorks Constraints and Loads

63
The four positions of the beam the project team wished to look at were: arm at the bottom
of its stroke, arm at the horizontal position on ascent, arm at the top of its stroke as the angle of
the attack of the kite is changed and arm at the horizontal position on descent. The kite tether
tensions and angles were taken from the dynamic simulations conducted in MATLAB and the
cord tension was calculated from a moment equilibrium on the arm, representing a situation
where the beam is moving at a constant angular velocity.

64
12 CosmosWorks Finite Element Analysis Results
The summary of the loads from the MATLAB simulation us in the CosmosWorks cases
are summarized below in Table 2. The most extreme case was when the arm is at the bottom of
its stroke. This high spike is only for a very short time due to the quick deceleration of the beam,
but is nonetheless an important case to look at.
Table 2: CosmosWorks Cases
Case
Kite Line
Tension (lbf)
Cord Tension
(lbf) Angle (deg, wrta) F_n (lbf) F_p (lbf)
Lowest Beam angle
(max condition) 766 1099 97 760 -97
Horizontal on Ascent 106 143 68 99 40
Just before AOA change 181 182 44 126 130
Horizontal on Descent 28 35 60 24 14
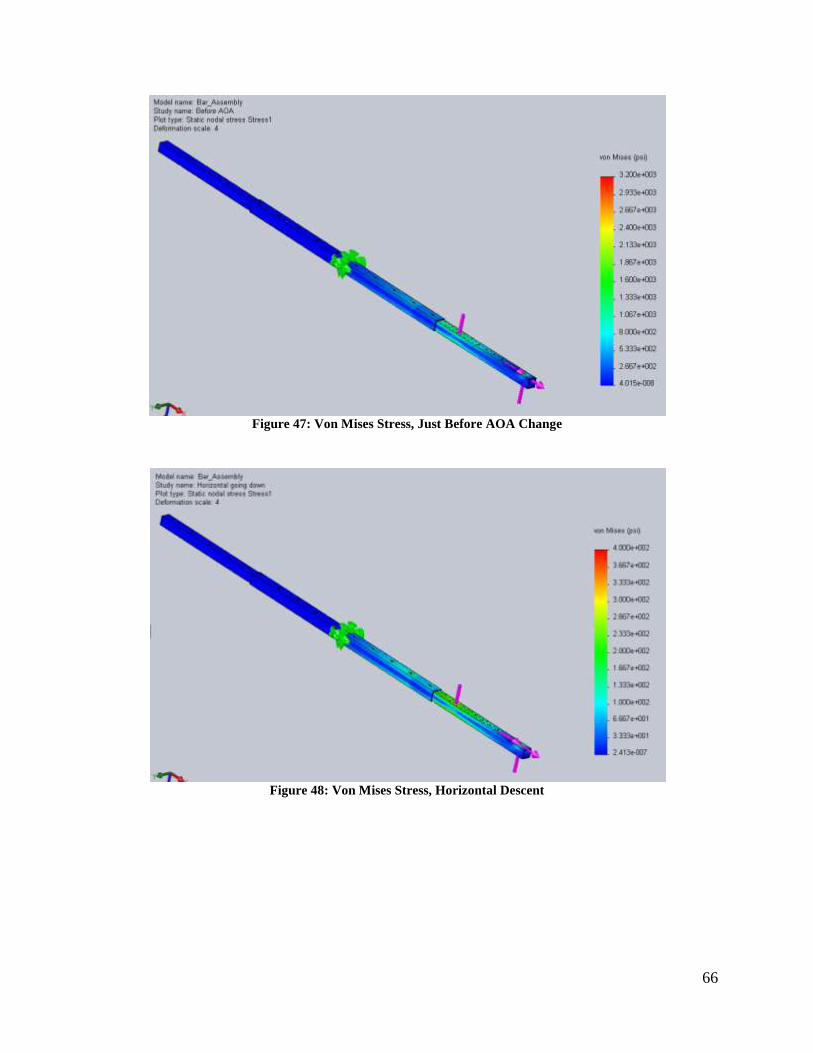
12.1 Von Mises Stress
The stress results from the CosmosWorks analysis are shown in Figure 45 through Figure
48. The arm in each figure is shown with a deformation scale of 4, but each stress scale is
different in order to better visualize the stress distribution in the arm. The largest stresses are
seen in the case 1 (bottom of the arm’s stroke - Figure 45). In this figure, the top of the stress
scale is set to be the yield strength of the material, 32 ksi. This is by far the highest load case and
the stresses are still well below the yield stress of the material. The maximum stress seen in the
beam is about 10 ksi where the two sections of the arm fit together. The other cases show that the
stresses are relatively low for the other positions of the arm, confirming that the arm should be
able to take the forces due to the kite and normal operation of the system.

65
Figure 45: Von Mises Stress, Bottom of Stroke
Figure 46: Von Mises Stress, Horizontal Ascent
66
Figure 47: Von Mises Stress, Just Before AOA Change
Figure 48: Von Mises Stress, Horizontal Descent

67
12.2 Displacement
The displacement results from the CosmosWorks analysis are shown in Figure 49-Figure
52. The deflection scale for all of the figures is once again 4 and overall the displacement of the
beam under normal operation is very low. The highest displacement occurred on case 1 and was
a mere .93 inches at the end of the arm. This is very low considering that the arm is about 7 feet
long. All of the other deflections were less than ¼ inch. These results further confirm that the
forces imposed on the beam are acceptable.
Figure 49: Deflection, Bottom of Stroke

68
Figure 50: Deflection, Horizontal Ascent
Figure 51: Deflection, Just Before AOA Change

69
Figure 52:Deflection, Horizontal Descent

70
13 Conclusions
By the end of this project, we successfully utilized kites to harness wind power to show
that it is feasible and in fact a very desirable way to produce power. We were able to design a
kite control mechanism which autonomously could keep the kite flying for several minutes.
Overcoming this challenge was very significant because it proves that a kite will remain in the
air with no input. Although time restraints prevented us from attaching the angle of attack
apparatus to the kite, we are confident that our flexible design would be able to properly perform
its function. These developments demonstrate a kite power system which can harness power.
To convert the power into usable electricity, we developed a powertrain to convert the
mechanical energy into electrical energy. We also rigorously lab tested every component of the
system to ensure that it they could sustain the required loads. One major problem that we
encountered was addressing the problem of a sudden loss of wind. We conducted several low-
level experiments with helium balloons to keep the kite afloat but soon realized that a deeper
investigation into the problem was necessary.
Our final test, resulting in an electrical output with the kite attached, proved that this type
of system can work. Considering the current global state of energy, it is noteworthy that we have
developed a functional prototype for harnessing a sustainable, clean, cheap energy. We
anticipate that future work in this area will yield excellent results.
On April 20-22, our MQP group will be presenting this project to the Environmental
Protection Agency during their fourth annual National Sustainable Design Expo. There, we will
be competing to get Phase II funding for the project. This funding would be used to further
develop the prototype and implement a functional wind power system in Namibia, Africa.

71
13.1 Overall Results
• Developed a working kite power demonstrator
o Roll stability
o AOA change
o Power conversion
• Rigorous lab and field testing
• Cosmosworks stress analysis
• Matlab simulation predicting system output
• Proved that kite power is a feasible, renewable, energy technology

72
Figure 53: Main poster for EPA conference

73
Figure 54: Supplementary poster for EPA conference

74
14 Future Work
Despite the great strides made by the project, many opportunities remain to continue to
develop and improve the kite power concept. The primary goal for future work should be to
fully achieve the objective of autonomous kite generated electricity. Further field testing is
required, in which the beam would be allowed its full range of motion. Initially, a system for
manually controlling the kite should be used. Eventually, the kite control systems should be
developed to the point where they are capable of keeping the kite in the air while going through
cycling between powered and depowered modes. The lateral kite control mechanism is currently
capable of keeping the kite in the air for short periods of time and should be sufficient for initial
testing. More testing needs to be done to determine when the angle of attack needs to change in
order to power and depower the kite at the appropriate time. The angle of attack mechanism then
needs to be developed so that it can use this information to run the kite through the power cycle.
An intermediate goal would be to modify the current system to allow for an operator to
manually control the kite from a safe location, such as a “cockpit” built into the A-frame itself.
This should be far simpler than autonomous power generation, as it removes the complexities of
trying to control the kite using mechanical systems. This type of system would allow a user to
generate power as needed, be it to charge batteries for a specific use or for tasks such as water
pumping and grain milling.
Further research and development also needs to be done to improve the longevity of the
system. Most of the current components were built as prototypes to test specific ideas and
designs. These systems need to be refined and likely redesigned in order to improve their
durability. In order to compete with options such as wind turbines, the system needs to be able
to generate power continuously for extended periods of time with minimal maintenance.

75
Towards this end, more research must be done to find a method of keeping the kite in the air
during periods of minimal wind. The use of lighter than air substances such as helium to keep
the kite aloft were examined as part of this project, but further research is required to determine
the feasibility of this option.
Work can also be done to improve computer simulations of the kite dynamics.
Specifically, a better aerodynamic model of the kite is necessary as well as the modeling of
additional effects such as unsteady winds. The simulation can also be improved by gathering
more accurate data for the inputs in the model. This can be done by using more sophisticated
instruments to measure tether line tension, rocking arm angles, shaft rotation and power output.
Once a fully functional system is developed, more work can be done to develop the
system and prove the concept in an actual working environment. An ideal location for this work
would be WPI’s project center in Namibia, Africa. Namibia is in great need of the low-cost,
clean electricity this system is designed to generate. The WPI project center focuses largely on
sustainable development and would be well suited to sponsor the installation and operation of a
kite power system. These are just some of the opportunities for continuing the work done by this
project.

76
15 Reference List 1 http://www.scoop.co.nz/stories/HL0505/S00054.htm 2 http://www.ren21.net/globalstatusreport/download/RE_GSR_2006_Update.pdf
3 http://www.eia.doe.gov/emeu/aer/overview.html 4 http://www.ninapierpont.com/pdf/Health_effects_of_wind_turbine_noise_3-2-06.pdf 5 http://www.scoop.co.nz/stories/HL0505/S00054.htm 6 Olinger D., Goela J.S., “Performance Characteristics of a One-Kilowatt Scale Kite Power
System”, Proceedings of Energy Sustainability, 2008 7 http://www.wpi.edu/Pubs/E-project/Available/E-project-042607-112625/ 8 Loyd, M.L., 1980, “Crosswind Kite Power”, J. Energy, 4(3), pp 106-111. 9 Goela, J.S., 1979, “Wind Power Through Kites”, Mech. Engg 10 Goela, J. S., 1983, “Project Report II on Wind Energy Conversion Through Kites”, DST
Project Report No. DST/ME(JSG)/81-84/26/2, IIT Kanpur. 11 Goela, J.S., Vijaykumar, R. and Zimmermann, R.H., 1986, “Performance Characteristics of a
Kite-Powered Pump”, J. Energy Resource Tech 12Lang et al., “Electrical Power Generation Using Kites”, 2005 13 http://www.youtube.com/watch?v=0BOdLbQN36Q 14 http://www.weather.gov/forecasts/graphical/sectors/massachusetts.php#tabs 15 http://www.youtube.com/watch?v=0BOdLbQN36Q 16 http://www.youtube.com/watch?v=10JMr_3UN0g&feature=related 17http://www.youtube.com/watch?v=IHim2Vnkikw&feature=related