Embed Size (px)
Citation preview
DESIGN OF AN AUTOMATIC DOOR SYSTEM FOR AN AUTOMATED TRANSIT NETWORK VEHICLE
A Project
Presented to
The Faculty of the Department of Mechanical Engineering
San José State University
In Partial Fulfillment
of the Requirements for the Degree
Master of Science
by
Hao Wang
December 2015

© 2015
Hao Wang
ALL RIGHTS RESERVED
SAN JOSÉ STATE UNIVERSITY
The Undersigned Committee Approves
DESIGN OF AN AUTOMATIC DOOR SYSTEM FOR AN AUTOMATED TRANSIT NETWORK VEHICLE
by
Hao Wang
APPROVED FOR THE DEPARTMENT OF MECHANICAL ENGINEERING
Dr. Burford Furman, Committee Chair Date
Dr. Neyram Hemati, Committee Member Date
Dr. Ken Youssefi, Committee Member Date
ABSTRACT
DESIGN OF AN AUTOMATIC DOOR SYSTEM FOR AN AUTOMATED TRANSIT NETWORK VEHICLE
By Hao Wang
A 1:3 scale prototype door system for the Spartan Superway automated network transit
(ATN) project vehicle was designed and tested. The designed door system is fully autonomous
and able to provide necessary accessibility control with maximum protection for the passengers.
The major achievement of this project is the development of a door system prototype that
meets design criteria based on the investigation about door system design alternatives for the
ATN vehicle. Through the prototyping process, an engineering approach to successfully deliver a
door system design from conceptualized users’ requirements was established. The mechanical
assembly of the system was designed via commercially computer aided design software.
Maximum von Mises stress of 111.3 MPa was yielded in the FEA simulation with the
deformation within the dimension design tolerance.
The prototype model built in this project has a door opening of 270 mm and motion duration of
4.55 seconds. The prototype is also capable of reporting door operation status and detecting hand
crush hazard while the door is closing. The design was validated with simulations and field tests.
A control system was designed to fulfill the system operation logic.

v
ACKNOWLEDGEMENTS
First of all, I dedicate this work to my family who give their priceless support in my
pursuit for this graduate degree. Also, I would like to thank my committee members, Dr. Burford
Furman, Dr. Ken Youssefi and Dr. Hemati for all these long time support and instruction
throughout the project.
vi
TABLE OF CONTENTS
ABSTRACT ................................................................................................................................... iv
ACKNOWLEDGEMENTS ............................................................................................................ v
TABLE OF CONTENTS ............................................................................................................... vi
LIST OF TABLES ....................................................................................................................... viii
LIST OF FIGURES ....................................................................................................................... ix
Chapter 1 – Introduction ................................................................................................................. 1
1.1 Objectives ......................................................................................................................... 3
1.2 Literature Review .................................................................................................................. 5
1.2.1 Introduction to Literature Review .................................................................................. 5
1.2.2 Door Mechanism for Powered Automatic Doors ........................................................... 6
1.2.3 Design Criteria based on Regulations and Design Standards for Transportation ........ 10
1.2.4 Observation and Sensors for Door Systems ................................................................. 17
1.2.5 Case Study .................................................................................................................... 23
1.2.6 Conclusion and Implication of Literature Study .......................................................... 35
Chapter 2 – Methodology ............................................................................................................. 37
Chapter 3 – Results and Discussion .............................................................................................. 39
3.1 Design Criteria of This Automatic Door System ................................................................ 39
3.2 The Full Scale Door System’s Mechanism Design ............................................................. 41
3.2.1 Stress Analysis of Critical Parts ................................................................................... 44
3.2.2 Finite Element Analysis of the Strength Problem ........................................................ 48
3.3 1:3 Scale Prototype Model .................................................................................................. 57
3.3.1 Mechanism Design of The Scale Down Model ............................................................ 57
3.3.2 Controller and Hardware Used in the Prototype .......................................................... 65
3.3.3 Logic Control Design of 1:3 Scale Prototype ............................................................... 68
3.3.4 Motor Test and Input Guidance .................................................................................... 72
Chapter 4 – Conclusion and Recommendations ........................................................................... 92
REFERENCE ................................................................................................................................ 95
Appendix A: User Guides for 1:3 Scale Demonstration Prototype ............................................ 100
vii
Appendix B: Door System Design Guide for A Full Scale Model ............................................. 103
Appendix C: Bill of Materials for the 1:3 Scale Prototype ......................................................... 106
Appendix D: Selected Content from M335 User Manual .......................................................... 107
Appendix E: Selected Drawings of Customized Parts for 1:3 Scale Model ............................... 108
Appendix F: Selected Drawings of Customized Parts for Full Scale Model .............................. 113
Appendix G: Code for Arduino Mega Controller ....................................................................... 117

viii
LIST OF TABLES
Table 1. ULTra PRT loading and unloading times ....................................................................... 27 Table 2. Summary of Design Criteria ........................................................................................... 41 Table 3. Stepper Motor Specifications .......................................................................................... 67
ix
LIST OF FIGURES
Figure 1. Principle of electric motor powered swing plug door mechanism. ................................. 7 Figure 2. Principle of electric motor powered sliding door mechanism ........................................ 8 Figure 3. Principle of electric motor powered plug sliding door mechanism ................................ 8 Figure 4. Point of hazard for finger draw in ................................................................................. 12 Figure 5. Point of hazard for head & body trap ............................................................................ 13 Figure 6. Platform screen doors in Shanghai Metro ..................................................................... 13 Figure 7. Sensor coverage for hand crush protection ................................................................... 14 Figure 8. Functionality of crush observation system with crews involved. ................................. 19 Figure 9. FOV of a photoelectric sensor mounted on the top of the door .................................... 21 Figure 10. An ULTra PRT vehicle with the door opened. ........................................................... 24 Figure 11. The interior panel of an ULTra vehicle ...................................................................... 25 Figure 12. Heathrow four-berth station and A “open environment” station ................................ 26 Figure 13. Chassis and the track of Taxi 2000 system and cross section view ............................ 28 Figure 14. An Taxi 2000 vehicle with the sliding door opened ................................................... 29 Figure 15. Guard fence in a Morgantown PRT station ................................................................ 34 Figure 16. The overall layout of the door mechanism .................................................................. 42 Figure 17. The arm system to support the door panel .................................................................. 42 Figure 18. The guideway of the mechanism ................................................................................ 43 Figure 19. The sleeve mechanism at the bottom of the door panel .............................................. 43 Figure 20. Ball screw guide driving the arm system .................................................................... 44 Figure 21. Loads applied on the panel support ............................................................................. 44 Figure 22. Diagrams of bending force and bending moment ...................................................... 44 Figure 23. Combined loading with bending and torsion .............................................................. 45 Figure 24. The cross section view of the panel support ............................................................... 46 Figure 25. A typical sliding door roller can be found in the market ............................................ 48 Figure 26. Fixed supports on the labelled surfaces to simulate mounting ................................... 49 Figure 27. Loads applied in the simulation .................................................................................. 49 Figure 28. The result of the FEA simulation on full scale digital mode ...................................... 50 Figure 29. Deformation of the structure ....................................................................................... 51 Figure 30. Strain energy convergence of the simulation .............................................................. 51 Figure 31. The maximum stress convergence plot of the simulation ........................................... 52 Figure 32. Converengence of deformation with 1% error ............................................................ 52 Figure 33. Layout of a commercial model ................................................................................... 53 Figure 34. Installation space comparison ..................................................................................... 54 Figure 35. Maximum stress located at the panel support for the commercial model ................... 54 Figure 36. Deformation performance of the commercial model .................................................. 55 Figure 37. Converengence of strain energy with 1% error .......................................................... 55 Figure 38. Non-converengence of VM stress ............................................................................... 56
x
Figure 39. Converengence of deformation with 1% error ............................................................56 Figure 40. Overall layout of the 1:3 scale model .........................................................................58 Figure 41. Roller Assembly ..........................................................................................................58 Figure 42. Speed Profile with 20% steps for acceleration ............................................................61 Figure 43.Angular velocity of the motion study ..........................................................................62 Figure 44. Reading of angular acceleration and deceleration ......................................................62 Figure 45. Motor torque measurement in motion study ...............................................................62 Figure 46. Driving force measurement in motion study ...............................................................63 Figure 47. Pressure force on the basement panel .........................................................................63 Figure 48. Pitch up moment due to sliding out motion ................................................................64 Figure 49. Motor control diagram ................................................................................................67 Figure 50. One of the limit switches ............................................................................................67 Figure 51. State machine diagram of the prototype .....................................................................68 Figure 52. Diagram of duty cycle concept ...................................................................................73 Figure 53. A typical speed profile ................................................................................................74 Figure 54. Ratio of step and relative error of approximation .......................................................77 Figure 55. Delay of 2nd order approximation ...............................................................................77 Figure 56. Speed profile mapping with 2nd order approximation .................................................78 Figure 57. Speed profile mapping with treatment on ............................................................. 79 Figure 58. Speed profile mapping with treatment on ............................................................. 79 Figure 59. Speed profile mapping with constant pulse width ......................................................80 Figure 60. Input verus output in frequency for Accelstepper code ..............................................81 Figure 61. Input versus output in frequency for Stepper.h code ..................................................81 Figure 62. Comparison of sample deviation .................................................................................82 Figure 63. Minimum pusle width failed to start the motor for Stepper.h code ............................83 Figure 64. Constant speed difference between the two codes ......................................................83 Figure 65. Comparison of constant speed delay ...........................................................................84 Figure 66. Total delay in a speed profile running with treatment on for 6750 steps ..............86 Figure 67. Total delay in a speed profile running with treatment on for 6750 steps ..............86 Figure 68. Total delay in a speed profile running with treatment on for 27000 steps ............87 Figure 69. Total delay in a speed profile running with treatment on for 27000 steps ............87 Figure 70. Total delay in a speed profile running by using stepper.h code for 6750 steps .......... 88 Figure 71. Total delay in a speed profile running by using stepper.h code for 27000 steps ........ 88 Figure 72. Maximum rpm mapping versus speed profile ............................................................. 89 Figure 73. Performance of Accelstepper code via using a triangular speed profile ..................... 90 Figure 74. Performance of Stepper.h code via using a triangular speed profile .......................... 91
1
Chapter 1 – Introduction
The development of city transportation systems today has two main tendencies. In
Europe and Asia, scheduled public transportation modes like bus, metro and train contribute to
the majority of transport capacity. In North American, automobiles are still the main modal
choice for most travelers. A transportation system operating in an urban environment, which is
highly reliant on automobiles, has many inherent problems. Fossil fuel pollution, declining
petroleum reserves worldwide, and traffic jams are leading to worsening quality of life.
Although these features can be alleviated to some degree by current public transportation
approaches, the current public transportation system is lacking as a perfect solution. Since many
public transportation systems in use today are not fully autonomous, the system cannot be
operated for 24 hours a day as the system requires manpower on station when operating.
Travelers need time to familiarize themselves with the systems’ availability in the area as routes
can be very limited in some communities and early arrival at the station is usually necessary to
avoid the crowd in rush hours. Many alternative forms of public transportation have been tried
in several major cities in the United States, public transportation systems have not been widely
adopted due to high cost for initial investment and sustaining funding required for maintenance
and operation. In order to contribute to the innovation of transportation solution, the Spartan
Superway Automated Transit Network (ATN), also called as Sustainable Mobility System for
Silicon Valley (SMSSV), is an interdisciplinary project being developed in San José State
University to design a Personal Rapid Transit (PRT) system using solar power.
This report presents work done as part of the larger Superway development effort, which
is under the supervision of Prof. Burford Furman. The Superway system features small
2
autonomous vehicles operating on a network of exclusive and usually elevated guideways. The
guideways are arranged in a network topology and passenger stations are located adjacent to, but
off the main routes. The ATN system provides direct origin-to-destination service with no
transfer or stops at intermediate stations. The vehicles are sized for individual or small group
travel, and each vehicle typically carries no more than four to six passengers. The system is fully
automated with availability of 24 hours a day, 7 days a week in all weather conditions. Users can
schedule their travel according to personal demands (Furman et. al., 2014, p.7). This on-demand
traveling mode offers the maximum convenience to passengers as the system is designed to adapt
to passengers’ needs and schedule rather than the other way around, which is what mostly
happens in traditional public transportation. The overall system is powered by electricity
gathered by solar panels that are mounted above and along the network of guideways and
stations. Additionally, a potential benefit may be attractive that each station is able to perform as
a charging location for light electric or hybrid powered vehicles on conventional traffic ways,
since the ATN itself is a clean energy generator network (Krueger, 2014, p.2).
The features of ATN introduce several requirements to the vehicle door system.
Referring to existing operational ATN systems, it is not hard to find the vehicles usually have
one door per each side (Furman et al, 2014, p.42). When vehicles are in-station, only the door on
the platform side will be opened, and the other stays closed under the control of door signal. In
order to increase station capacity and efficiency of transit, the designer of the system must
consider vehicle dwell time in station as one of the important factors. Vehicle dwell time in
station consists of vehicle maneuvering time to reach the stopped position, door opening time,
unloading time, loading time, door closing time, and maneuvering time to departure. The door
system is responsible for conducting correct door movement within the required operating time.
3
Shortening the opening and closing time will be a plus to station operation efficiency (Furman et
al, 2014, p.42).
Modern power door systems applied in transit vehicles employ components like DC
motors or pneumatic actuators to open and close door leafs and are controlled by electrical
circuits (Federal Railroad Administration, 2014, p.16984). The power module must have certain
reliability performance, usually measured as mean time or mean distance between failures,
according to standards of transportation authorities. Basic dimensions of door opening need to
meet requirements for easy accessing for passengers with disability, emergency egress and
rescue access (Federal Railroad Administration, 2014, p.16984).
Door control commands can be given by human operators, sensors or other digital
devices which connect to transportation system control. The sensing sub-system associated with
the door control module are required to provide warning when doors are in motion, respond to
obstruction against the closing doors, and perform automatic locking when the vehicle is in
motion. Door system design must not only take into considerations for requirements of the
vehicle design, but also from consideration for station configuration and operation. This is a must
for the door systems in ATN applications if they are to achieve fully autonomous operation with
minimum human involvement.
1.1 Objectives
The successful accomplishment of this project is to fulfill the main objective, which is to
deliver a prototype design of the customized automatic door system for the Superway project.
The system should meet all the functional requirements with concern for passenger safety. It
4
must be noted that design work of this kind is typically implemented by vendors of the door
system rather than by the engineering personnel from the main project team when the Superway
project goes into actual operation. As the cabin designs for different transportation project varies
from each other, the door system design mission has its own uniqueness. Based on the basic door
mechanics, changes in geometry, mounting solution and corresponding sensors for safe operation
will be customized according to special requirements for a particular transportation project.
Moreover, it is important to note that Spartan Superway project is in its early prototyping
phase, and all the sub-projects are aimed to deliver engineering models which carry different
systematic functions. Available budgets need to be spent with best cost effectiveness. Therefore,
hiring vendors from industry to carry out the door system prototyping work is not a feasible
option at this point. Through the engineering processes of this project, the related team members
of Spartan Superway project will gain adequate knowledge about customizing sub-systems of the
vehicle, and this will contribute to future design work for the overall ATN system.
The engineering work of this door system design project is divided into two main
categories, mechanical design and control design. The corresponding control ensures correct
door operation. Also, this design project is the first time for the Spartan Superway project team
to consider problems in accessibility control, system control, and communication between
different sub-systems. The study in this paper also includes station operation and establishment
of communication protocol in a systematic scope.
In parallel, a mobile door frame was designed to carry the door system. Demonstrating
the early prototypes in conferences and community meetings is one of the main approaches for
Spartan Superway team to acquire sponsorship and rise funding. A mobile test bed best suits this
5
purpose. Also, rather than directly installing the door mechanics into a cabin prototype, the stand
alone door system enjoys the maximum freedom of project progress as no interference from the
progress in cabin design work will affect the steps in the door system designing.
The engineering work of this master project can be divided into several stages. The
objectives that were set for these stages were to:
Investigate door mechanics design alternatives for the ATN vehicle
Conceptualize a viable door system design approach for the Spartan Superway ATN
Investigate and embody regulations & industrial standards for the ATN vehicle’s door
system
Design and fabricate a door system prototype
Validate design by simulation and physical prototyping
Accomplishment of these stage objectives will guarantee successful delivery of an
automatic door system design to meet the design requirements.
1.2 Literature Review
1.2.1 Introduction to Literature Review
Door system design for an ATN vehicle must consider various aspects. First of all, the
geometry layout of the door mechanics is required to fit into the indoor space of the vehicle.
Selection of the proper door mechanics is based on vehicle design and station configuration.
The first part of the literature review contributes introduction and discussion for the choice of
door mechanism. The second part gives an overview of regulations and design standards
6
published by several transportation authorities, including concern about door system’s
functionality and safety in different operation environment. Next comes clarification of the
door observation problem and related sensor technology for the solution. Case studies were
reviewed for some existing PRT projects and concepts where practical emphasis on the door
system were involved. The integration of the traffic control and accessibility control is the
major focus. The PRT projects researched were ULTra PRT, Taxi 2000, Vectus, and the
Morgantown PRT (Furman et al, 2014, p.42). The literature review attempts to provide detailed
discussion in the stated problems and the study can benefit the development of the master
project via constructing thorough and rational theoretical preparation for methodology.
1.2.2 Door Mechanism for Powered Automatic Doors
The geometry layout and the physical mechanism of the onboard door system should
meet the space requirement and users’ convenience. Although there are many manufacturers of
door system for transportation purpose, like IFE, Tamware, Norgren etc, the basic mechanism
of their products are quite similar. Among the current products in the market, the door
mechanism in use can be summarized as, swing plug door, sliding door and plug sliding door.
These designs can also be classified as pneumatic powered and electric powered by the
category of power supply.
Swing door design is the simplest approach and its high reliability is resulted from the
mechanism simplicity (Van der Gucht et al, 2014, p.471). However, swing doors require
relative larger indoor space for swinging, and these door systems are commonly seen to be
installed on large train or metro coaches, buses and buildings. A swing plug door mechanism is
7
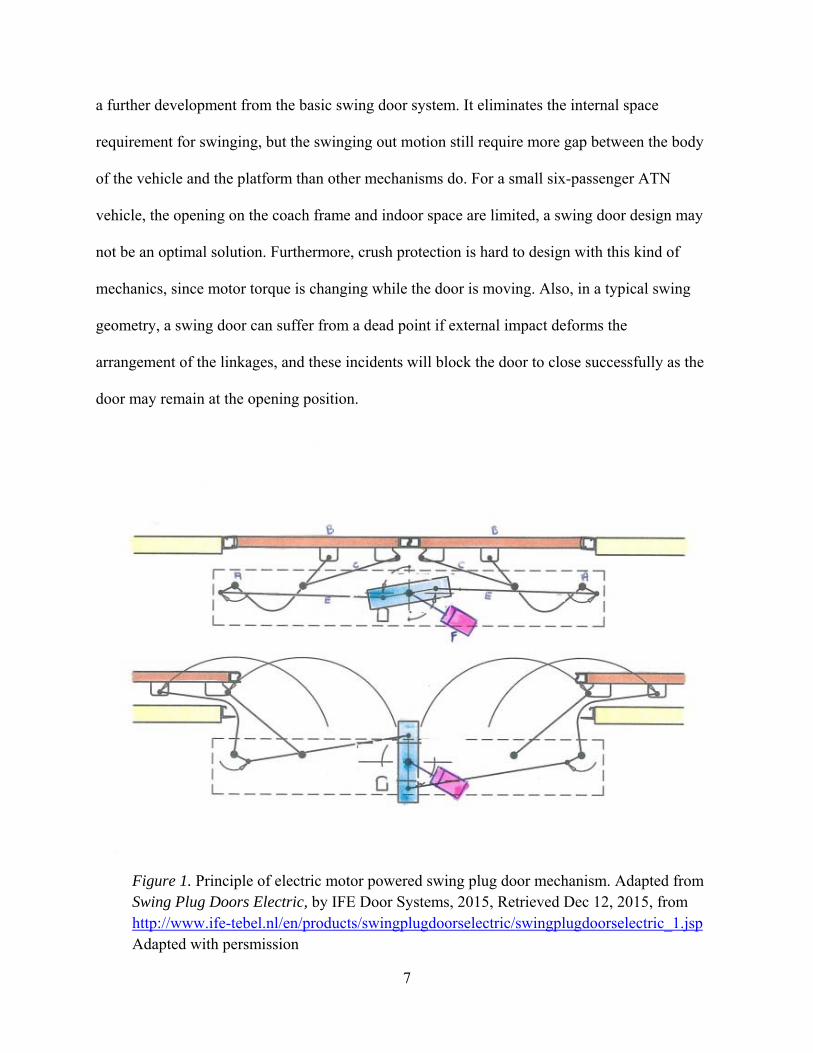
a further development from the basic swing door system. It eliminates the internal space
requirement for swinging, but the swinging out motion still require more gap between the body
of the vehicle and the platform than other mechanisms do. For a small six-passenger ATN
vehicle, the opening on the coach frame and indoor space are limited, a swing door design may
not be an optimal solution. Furthermore, crush protection is hard to design with this kind of
mechanics, since motor torque is changing while the door is moving. Also, in a typical swing
geometry, a swing door can suffer from a dead point if external impact deforms the
arrangement of the linkages, and these incidents will block the door to close successfully as the
door may remain at the opening position.
Figure 1. Principle of electric motor powered swing plug door mechanism. Adapted from Swing Plug Doors Electric, by IFE Door Systems, 2015, Retrieved Dec 12, 2015, from http://www.ife-tebel.nl/en/products/swingplugdoorselectric/swingplugdoorselectric_1.jsp Adapted with persmission
8
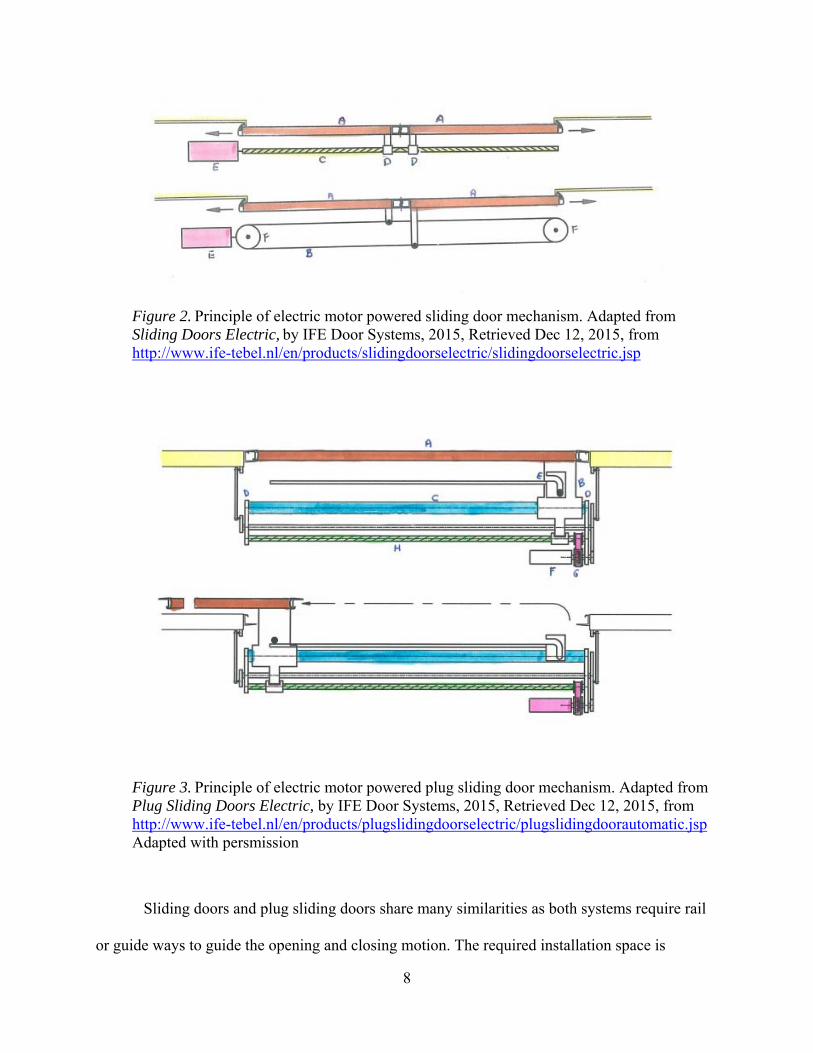
Figure 2. Principle of electric motor powered sliding door mechanism. Adapted from
Sliding Doors Electric, by IFE Door Systems, 2015, Retrieved Dec 12, 2015, from
http://www.ife-tebel.nl/en/products/slidingdoorselectric/slidingdoorselectric.jsp
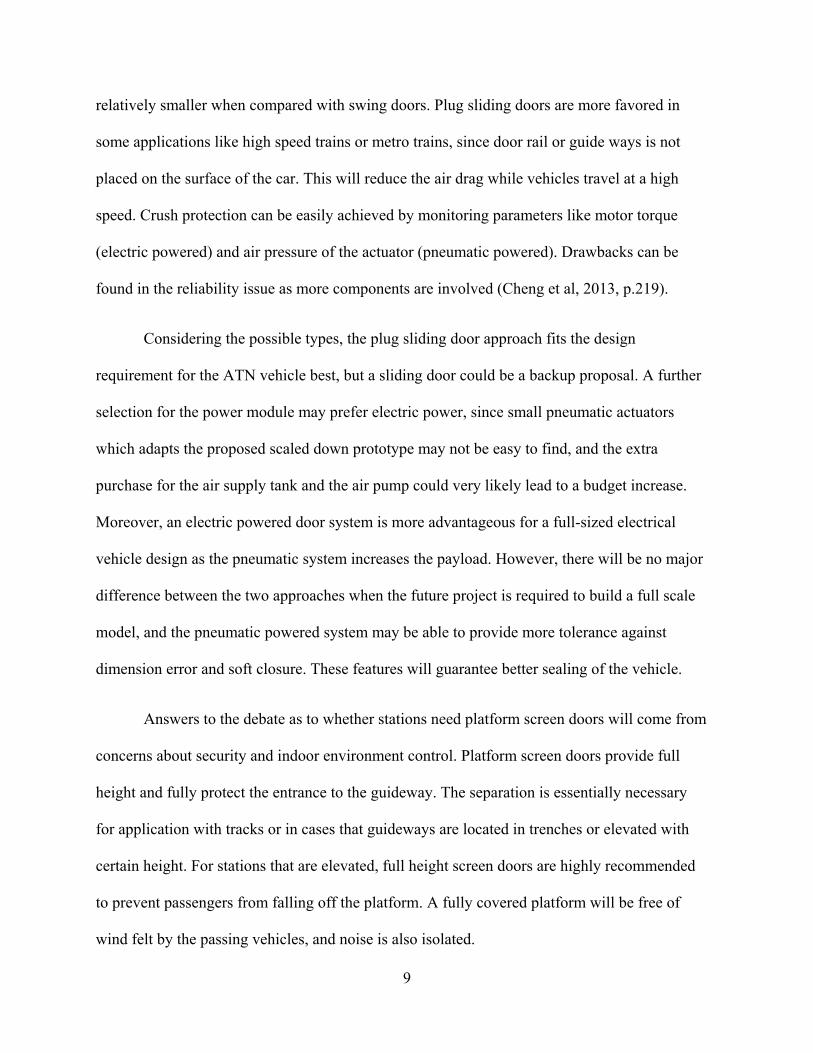
Figure 3. Principle of electric motor powered plug sliding door mechanism. Adapted from
Plug Sliding Doors Electric, by IFE Door Systems, 2015, Retrieved Dec 12, 2015, from
http://www.ife-tebel.nl/en/products/plugslidingdoorselectric/plugslidingdoorautomatic.jsp Adapted with persmission
Sliding doors and plug sliding doors share many similarities as both systems require rail
or guide ways to guide the opening and closing motion. The required installation space is
9
relatively smaller when compared with swing doors. Plug sliding doors are more favored in
some applications like high speed trains or metro trains, since door rail or guide ways is not
placed on the surface of the car. This will reduce the air drag while vehicles travel at a high
speed. Crush protection can be easily achieved by monitoring parameters like motor torque
(electric powered) and air pressure of the actuator (pneumatic powered). Drawbacks can be
found in the reliability issue as more components are involved (Cheng et al, 2013, p.219).
Considering the possible types, the plug sliding door approach fits the design
requirement for the ATN vehicle best, but a sliding door could be a backup proposal. A further
selection for the power module may prefer electric power, since small pneumatic actuators
which adapts the proposed scaled down prototype may not be easy to find, and the extra
purchase for the air supply tank and the air pump could very likely lead to a budget increase.
Moreover, an electric powered door system is more advantageous for a full-sized electrical
vehicle design as the pneumatic system increases the payload. However, there will be no major
difference between the two approaches when the future project is required to build a full scale
model, and the pneumatic powered system may be able to provide more tolerance against
dimension error and soft closure. These features will guarantee better sealing of the vehicle.
Answers to the debate as to whether stations need platform screen doors will come from
concerns about security and indoor environment control. Platform screen doors provide full
height and fully protect the entrance to the guideway. The separation is essentially necessary
for application with tracks or in cases that guideways are located in trenches or elevated with
certain height. For stations that are elevated, full height screen doors are highly recommended
to prevent passengers from falling off the platform. A fully covered platform will be free of
wind felt by the passing vehicles, and noise is also isolated.

10
Ventilation and air conditioning are more effective in a closed environment. For an
ATN application, the ticket machines could be installed right next to the platform screen doors
and offer easy accessibility at the station entrance. In this configuration, motion sensors
mounted on the doorframes would be able to cover the waiting area and the ticket machines, so
monitoring of the motion of passengers would be easier to achieve, and the system could
determine cases where vehicles are requested by passengers, but the passengers do not get
onboard. After a certain time of waiting, the system may dispatch the empty vehicle to another
location. This will largely help to improve efficiency and autonomy of the overall ATN system.
The main drawback for platform screen doors is their cost. Projects with limited budgets may
opt instead for an automatic platform gate approach in which the doors are not full height but
can still reach chest-height. However, gates of chest-height are less effective against passengers
jumping into guideways on purpose, for example, in suicide attempts. Platform gates are also
not recommended for stations which have certain requirements about indoor environment.
Sliding door mechanics are compatible with platform screen door/gate systems.
1.2.3 Design Criteria based on Regulations and Design Standards for Transportation
Transportation authorities worldwide have regulations and design standard to give
guidelines and basic requirements for onboard door systems. General requirements fall into the
categories of door opening, door function in emergency situation, door design to avoid hazards
and etc. The design guides for door systems on metro, light rail and train coaches can be useful
reference as the existing regulations and standards are tested in the transportation applications.
Metro light rail design criteria manual recommends a minimum door opening of 48 inches wide
11
and 80 inches high (Valley Metro Transit System, 2007, p.7-6).
For easy accessibility of wheelchairs, The Americans with Disabilities Act (ADA)
standard requires a clear door opening of 32 inches. The horizontal gap between the vehicle
floor and the platform edge should not exceed four inches, and the minimum two inch vertical
step is enforced. This accessibility feature still needs to be maintained when the vehicle reaches
50% of its full capacity (The U.S. Access Board, 1992, p.16). These regulations are achieved
by designating the door opening at the proper position on the vehicle body. Furthermore, the
automatic pneumatic leveling system used on modern ATN vehicles is able to help to maintain
the vehicle floor at the desired attitude in three dimensions when berthing at the station (Raney
& Young, 2004, p.10), and a classic vehicle design approach with the chassis as the base is easy
to apply such kind of systems. However, an ATN system approach with a suspended vehicle
may require more effort in vehicle attitude stability.
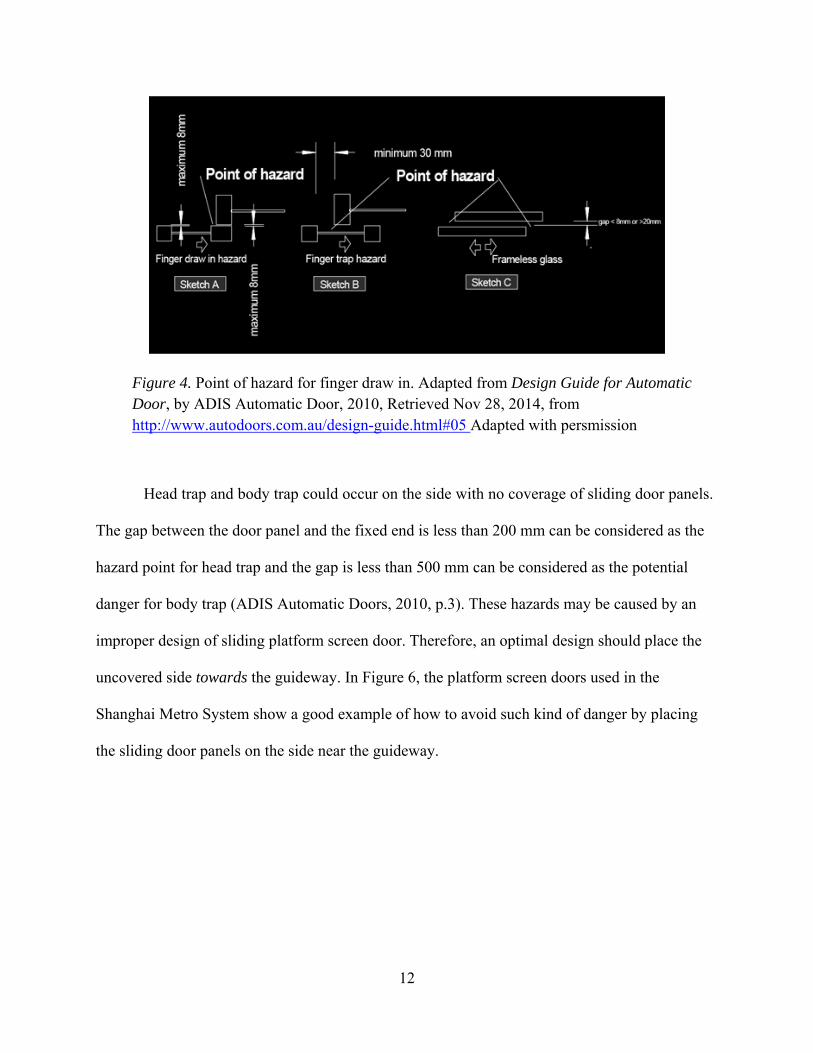
The dimensions of the door design are also the result of several considerations to avoid
hazards of finger trapping, hand crushing, or potential trapping of any part of the body. For the
case of fingers drawn into the space between two door panels of a sliding door, the gap should
not be greater than 8 mm. A gap larger than 20 mm will be considered free of hand trap hazard
between the two panels trap (ADIS Automatic Doors, 2010, p.2). Finger draw-in and hand
insertion could be very likely to happen in an automatic sliding door system with frameless
glass panels as the door leafs. For the applications in ATN, vehicle doors are usually designed
to slide within the gap between the inner and the outer panels of the vehicle body. For platform
screen doors, frameless glass door panels are most often applied, and the best approach to avoid
this kind of hazards is to cover the gap with rubber strips or weather seal for potential insertions.
12
Figure 4. Point of hazard for finger draw in. Adapted from Design Guide for Automatic Door, by ADIS Automatic Door, 2010, Retrieved Nov 28, 2014, from http://www.autodoors.com.au/design-guide.html#05 Adapted with persmission
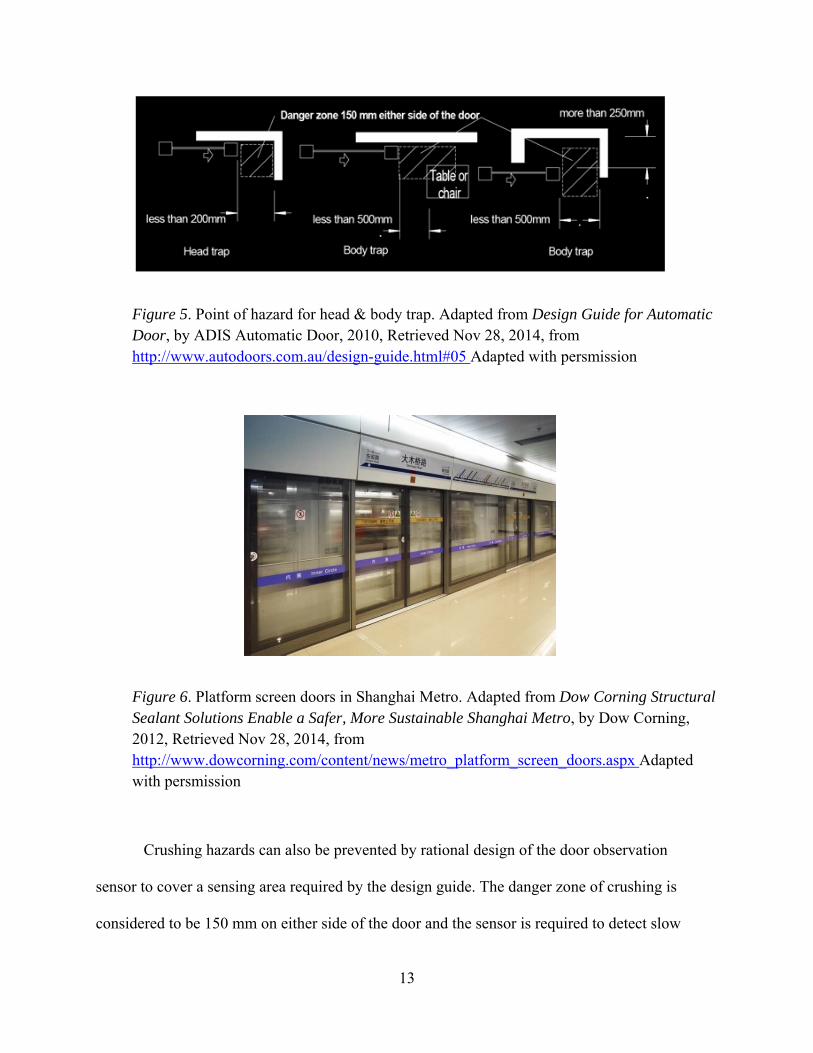
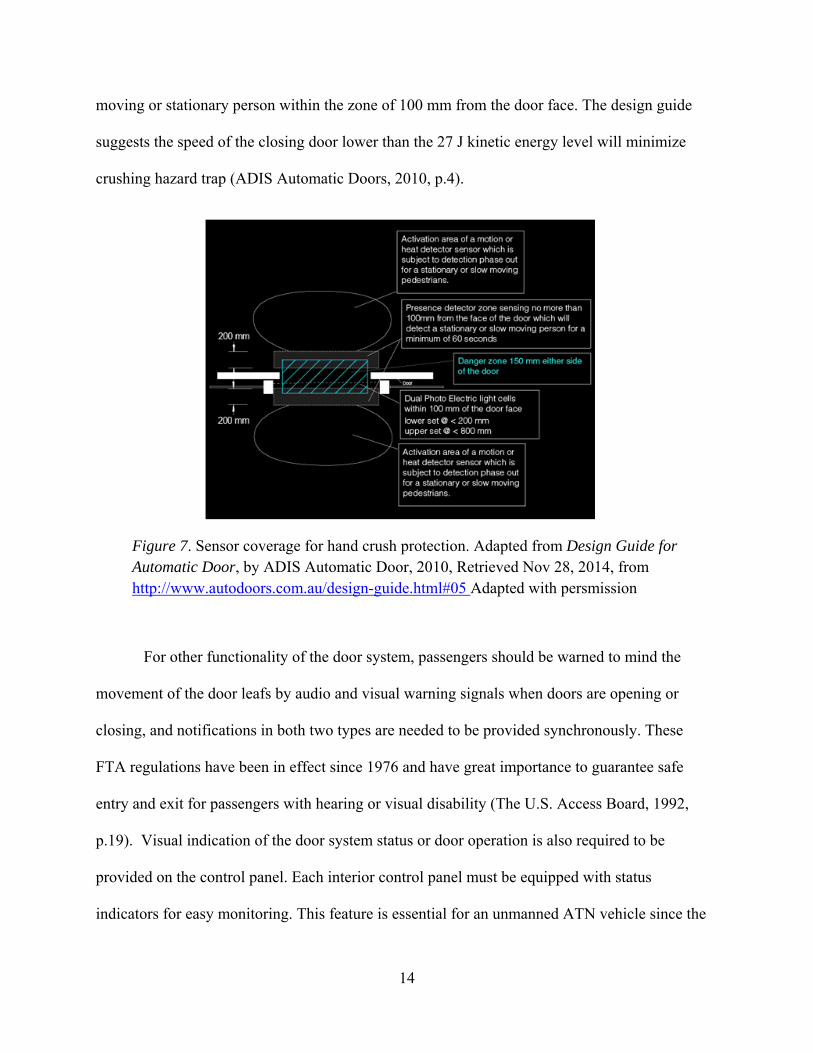
Head trap and body trap could occur on the side with no coverage of sliding door panels.
The gap between the door panel and the fixed end is less than 200 mm can be considered as the
hazard point for head trap and the gap is less than 500 mm can be considered as the potential
danger for body trap (ADIS Automatic Doors, 2010, p.3). These hazards may be caused by an
improper design of sliding platform screen door. Therefore, an optimal design should place the
uncovered side towards the guideway. In Figure 6, the platform screen doors used in the
Shanghai Metro System show a good example of how to avoid such kind of danger by placing
the sliding door panels on the side near the guideway.
13
Figure 5. Point of hazard for head & body trap. Adapted from Design Guide for Automatic Door, by ADIS Automatic Door, 2010, Retrieved Nov 28, 2014, from http://www.autodoors.com.au/design-guide.html#05 Adapted with persmission
Figure 6. Platform screen doors in Shanghai Metro. Adapted from Dow Corning Structural Sealant Solutions Enable a Safer, More Sustainable Shanghai Metro, by Dow Corning, 2012, Retrieved Nov 28, 2014, from http://www.dowcorning.com/content/news/metro_platform_screen_doors.aspx Adapted with persmission
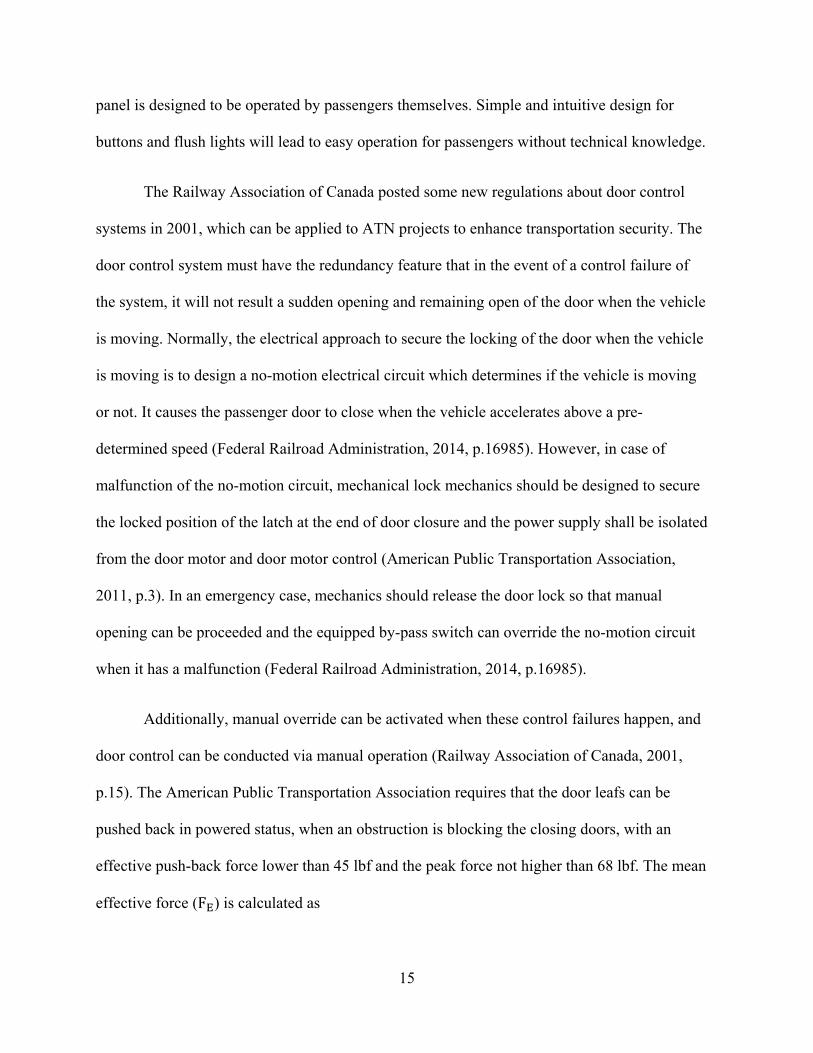
Crushing hazards can also be prevented by rational design of the door observation
sensor to cover a sensing area required by the design guide. The danger zone of crushing is
considered to be 150 mm on either side of the door and the sensor is required to detect slow
14
moving or stationary person within the zone of 100 mm from the door face. The design guide
suggests the speed of the closing door lower than the 27 J kinetic energy level will minimize
crushing hazard trap (ADIS Automatic Doors, 2010, p.4).
Figure 7. Sensor coverage for hand crush protection. Adapted from Design Guide for Automatic Door, by ADIS Automatic Door, 2010, Retrieved Nov 28, 2014, from http://www.autodoors.com.au/design-guide.html#05 Adapted with persmission
For other functionality of the door system, passengers should be warned to mind the
movement of the door leafs by audio and visual warning signals when doors are opening or
closing, and notifications in both two types are needed to be provided synchronously. These
FTA regulations have been in effect since 1976 and have great importance to guarantee safe
entry and exit for passengers with hearing or visual disability (The U.S. Access Board, 1992,
p.19). Visual indication of the door system status or door operation is also required to be
provided on the control panel. Each interior control panel must be equipped with status
indicators for easy monitoring. This feature is essential for an unmanned ATN vehicle since the
15
panel is designed to be operated by passengers themselves. Simple and intuitive design for
buttons and flush lights will lead to easy operation for passengers without technical knowledge.
The Railway Association of Canada posted some new regulations about door control
systems in 2001, which can be applied to ATN projects to enhance transportation security. The
door control system must have the redundancy feature that in the event of a control failure of
the system, it will not result a sudden opening and remaining open of the door when the vehicle
is moving. Normally, the electrical approach to secure the locking of the door when the vehicle
is moving is to design a no-motion electrical circuit which determines if the vehicle is moving
or not. It causes the passenger door to close when the vehicle accelerates above a pre-
determined speed (Federal Railroad Administration, 2014, p.16985). However, in case of
malfunction of the no-motion circuit, mechanical lock mechanics should be designed to secure
the locked position of the latch at the end of door closure and the power supply shall be isolated
from the door motor and door motor control (American Public Transportation Association,
2011, p.3). In an emergency case, mechanics should release the door lock so that manual
opening can be proceeded and the equipped by-pass switch can override the no-motion circuit
when it has a malfunction (Federal Railroad Administration, 2014, p.16985).
Additionally, manual override can be activated when these control failures happen, and
door control can be conducted via manual operation (Railway Association of Canada, 2001,
p.15). The American Public Transportation Association requires that the door leafs can be
pushed back in powered status, when an obstruction is blocking the closing doors, with an
effective push-back force lower than 45 lbf and the peak force not higher than 68 lbf. The mean
effective force (F ) is calculated as
16
∑
(1)
where F is the sampled measurement at the same measurement point for several trails and can
be calculated as:
1
2
and time between t and t is the pulse duration. The peak force is the measured maximum
value of the force applied on the closing door during the pulse (American Public Transportation
Association, 2011, p.7). Specific values for door closing force and speed are varied from
regional regulations and standards. The designers should check the design guide as requested.
Typical value of force for manual pushing should not exceed 30 pounds for full range of door
motion is reported by the Metro light rail design criteria manual and the desired door panel’s
average closing speed shall not go beyond 7 ft-lb for powered status and 2.5 ft-lb for power
deactivated (Valley Metro Transit System, 2007, p.8-4).
Before entering revenue service, the designed door system is required to perform safety
tests, including Failure Modes, Effects, and Criticality Analysis (FMECA) and achieve certain
reliability standards. For a typical onboard door system, the mean distance between component
failure of the door system should be not lower than 90,000 miles and mean time to repair is not
allowed to be over 0.75 hour (Valley Metro Transit System, 2007, p.8-11).
17
1.2.4 Observation and Sensors for Door Systems
In spite of automatic door motion control, another feature of the door system is the
safety concern. National transport regulation and safety protocol should be executed while the
vehicle is in operation. The research of Transportation Research Board under National
Research Council in 1995 indicated serious consequences resulted from faulty door system
design or failure of door control. From the statistical data collected by the Metropolitan
Transportation Authority—New York City Transit (MTA-NYCT), 516 door related incidents
occurred from 1988 through September 1993, on average, 92 incidents yearly. The Toronto
Transit Commission (TTC) reported 82 incidents from January 1992 to July 1993. Among
these, two were from faults in door control, and 44 are related to passengers being struck while
by closing doors (National Research Council et al, 1995, p.13). Obstacle detection sensors
play a vital role to prevent crushing and enhance overall safety of transit. Since the proposed
ATN system is designed to fully autonomous, no crew will be available to identify and
respond to all the situations if passenger crushing occurs; the observation sub-system will take
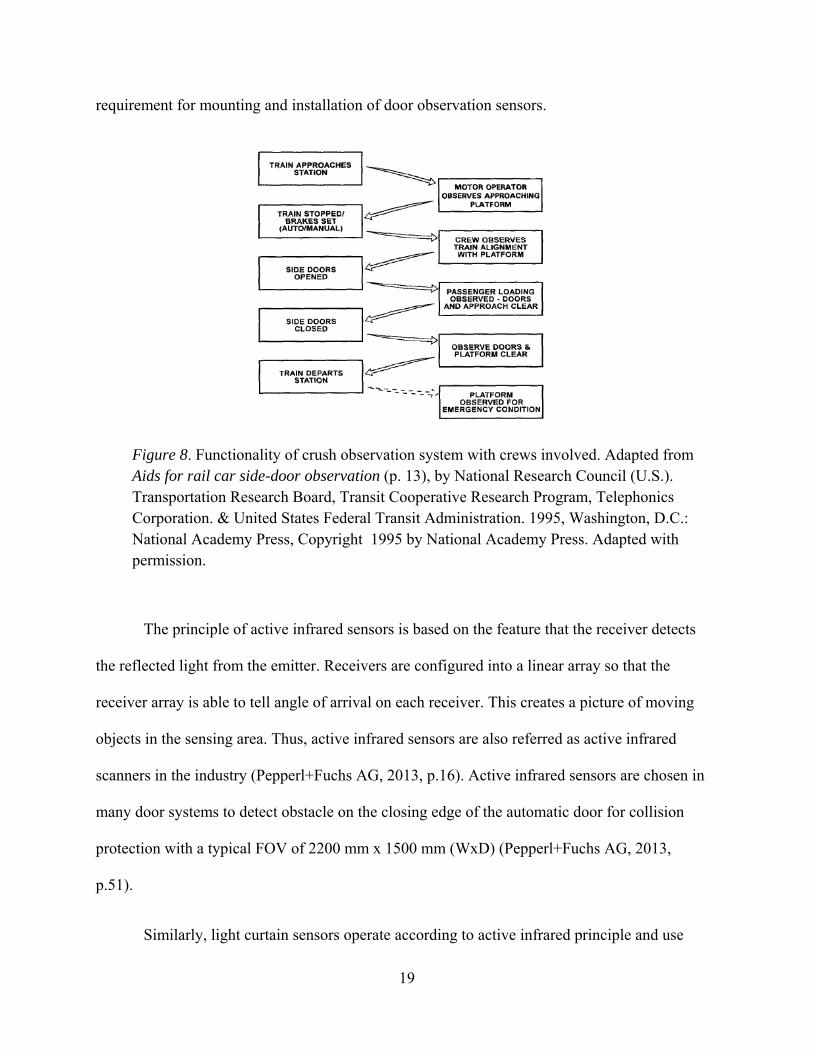
the full responsibility to obstacle detection, crush protection, and door system control. Typical
observation procedures are shown in Figure 8.
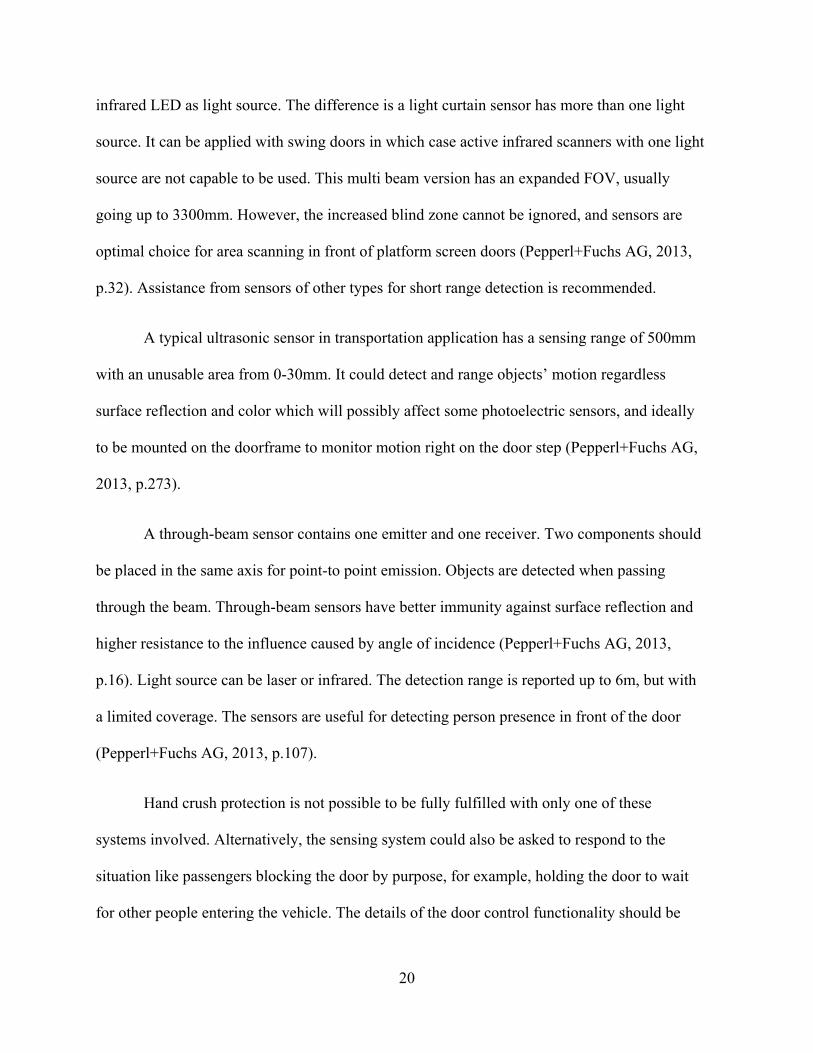
Unloading and loading processes at the station can be divided into three phases for
monitoring. First, passengers get off the vehicle as the door opens. Second, boarding begins as
the door remains open. Third, late-arriving passengers rush to the door as the door is about to
fully closed. The latter two phases require side-door observation as the first phase is the
common time when danger with accessibility occurs (National Research Council et al, 1995,
p.13).
18
Closed-circuit television (CCTV) based observation systems are largely used to
monitor obstruction for door obstruction. However, these systems are not feasible to
automatically send out the warning signal when a blockage occurs. Moreover, manpower
monitoring is always required for a CCTV system. For an ATN station with high automation,
the manpower can be spared to monitor every CCTV screen is not possible. In other words,
reducing the CCTV cameras for door observation helps to increase the automation of station
operation that limited CCTV cameras could be used to area surveillance for security. Therefore,
other forms of sensing and monitoring are recommended to be deployed. Another feature
should be noticed that a platform with only automatic platform gates or without equipment to
deny accessibility to the guideway will be asked to pay special attention in monitoring
unauthorized trespassing like suicide attempts or homicides by pushing a passenger off the
platform into the path of an oncoming vehicle.
Sensors which can be applied to obstacle detection in transportation area are classified
into the major categories of active infrared, light curtain, ultrasonic, and through-beam
(Pepperl+Fuchs AG, 2013, p.5). These classic solutions easily challenge limited budgets, since
the price of the detecting system largely depends on the procurement of sensors. A new fashion
of electro-optical (EO) sensing with imaging process algorithms may offer an additional cost
saving approach (Bombini et al, 2011, p.10). It has to be pointed out all sensors which are
introduced previously have some blind zone due to the installation angle and the sensors’
aperture angle. Excluding ultrasonic sensors which usually have short detection range, Field of
View (FOV) of many other sensors is designed to focus at the region, 1-2 m ahead or
backward the door (Bircher Reglomat AG, 2014, p.9). Ideal sensing coverage should be
referred to the related contents in law enforced regulations and design guides for design
19
requirement for mounting and installation of door observation sensors.
Figure 8. Functionality of crush observation system with crews involved. Adapted from Aids for rail car side-door observation (p. 13), by National Research Council (U.S.). Transportation Research Board, Transit Cooperative Research Program, Telephonics Corporation. & United States Federal Transit Administration. 1995, Washington, D.C.: National Academy Press, Copyright 1995 by National Academy Press. Adapted with permission.
The principle of active infrared sensors is based on the feature that the receiver detects
the reflected light from the emitter. Receivers are configured into a linear array so that the
receiver array is able to tell angle of arrival on each receiver. This creates a picture of moving
objects in the sensing area. Thus, active infrared sensors are also referred as active infrared
scanners in the industry (Pepperl+Fuchs AG, 2013, p.16). Active infrared sensors are chosen in
many door systems to detect obstacle on the closing edge of the automatic door for collision
protection with a typical FOV of 2200 mm x 1500 mm (WxD) (Pepperl+Fuchs AG, 2013,
p.51).
Similarly, light curtain sensors operate according to active infrared principle and use
20
infrared LED as light source. The difference is a light curtain sensor has more than one light
source. It can be applied with swing doors in which case active infrared scanners with one light
source are not capable to be used. This multi beam version has an expanded FOV, usually
going up to 3300mm. However, the increased blind zone cannot be ignored, and sensors are
optimal choice for area scanning in front of platform screen doors (Pepperl+Fuchs AG, 2013,
p.32). Assistance from sensors of other types for short range detection is recommended.
A typical ultrasonic sensor in transportation application has a sensing range of 500mm
with an unusable area from 0-30mm. It could detect and range objects’ motion regardless
surface reflection and color which will possibly affect some photoelectric sensors, and ideally
to be mounted on the doorframe to monitor motion right on the door step (Pepperl+Fuchs AG,
2013, p.273).
A through-beam sensor contains one emitter and one receiver. Two components should
be placed in the same axis for point-to point emission. Objects are detected when passing
through the beam. Through-beam sensors have better immunity against surface reflection and
higher resistance to the influence caused by angle of incidence (Pepperl+Fuchs AG, 2013,
p.16). Light source can be laser or infrared. The detection range is reported up to 6m, but with
a limited coverage. The sensors are useful for detecting person presence in front of the door
(Pepperl+Fuchs AG, 2013, p.107).
Hand crush protection is not possible to be fully fulfilled with only one of these
systems involved. Alternatively, the sensing system could also be asked to respond to the
situation like passengers blocking the door by purpose, for example, holding the door to wait
for other people entering the vehicle. The details of the door control functionality should be
21
addressed in future studies.
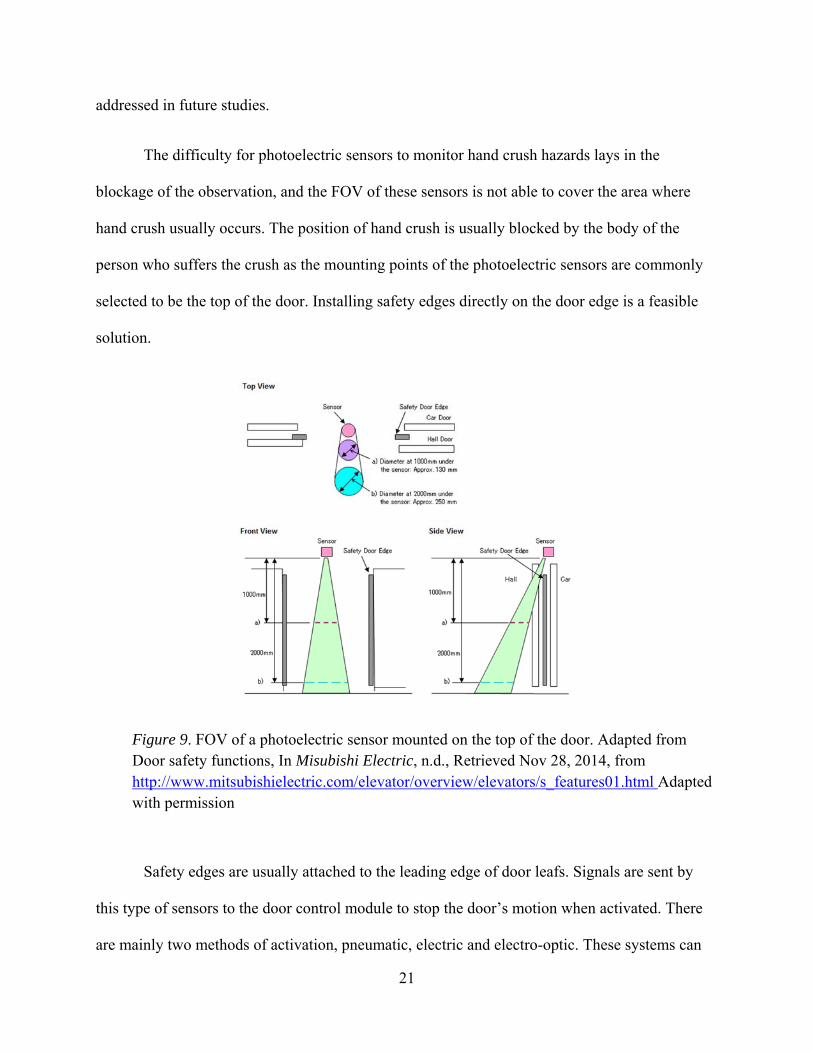
The difficulty for photoelectric sensors to monitor hand crush hazards lays in the
blockage of the observation, and the FOV of these sensors is not able to cover the area where
hand crush usually occurs. The position of hand crush is usually blocked by the body of the
person who suffers the crush as the mounting points of the photoelectric sensors are commonly
selected to be the top of the door. Installing safety edges directly on the door edge is a feasible
solution.
Figure 9. FOV of a photoelectric sensor mounted on the top of the door. Adapted from Door safety functions, In Misubishi Electric, n.d., Retrieved Nov 28, 2014, from http://www.mitsubishielectric.com/elevator/overview/elevators/s_features01.html Adapted with permission
Safety edges are usually attached to the leading edge of door leafs. Signals are sent by
this type of sensors to the door control module to stop the door’s motion when activated. There
are mainly two methods of activation, pneumatic, electric and electro-optic. These systems can
22
be wired or wireless. Choices of different sensing edges are made referring to the door
configuration and monitoring requirements. Sensors can also be activated by pressing or
blocking to achieve holding-door function.
A pneumatic sensing edge contains a flexible hose, which is usually made with rubber
to form a closed air chamber, and a pneumatically activated electric switch. Air pressure
increase will activate the electric switch when the closing door hits the obstacle. Damage to the
sealed air chamber will result failure in detection (DASMA Corporation, 2002, p.1). Advanced
design could include pressure monitoring mechanism to solve this problem. This kind of
sensing edges need pressure calibration after installation to fit the pressure date when the door
is at the closure position with the designed clamping force.
An electrically activated safety edge consists two adjacent conductive strips in the
rubber outer cover. Normally, the two strips are separated by a small gap to perform an open
circuit. When the edge hits the obstruction, the contact is made and the signal is sent out via
the closed circuit. An electric sensing edge can be in 2 wire or 4 wire configuration. Wires are
connected to both ends of each conductive strip in 4 wire configuration and the system can
self-monitor open or short condition of the edge. 2 wire configuration requires frequent test of
conductivity of the strip whether breaks exist on the strip which will jeopardize the
functionality of the system (DASMA Corporation, 2002, p.2).
An electro-optical safety edge detects the crush when the hand blocks the transmission
of the light beam between the emitter and the receiver (DASMA Corporation, 2002, p.2). The
light source is usually laser. The emitter and the receiver can be designed to be buried in the
weather seal. The system can be configured to multi parallel beam arrangement or crossing
23
beam arrangement. In the parallel beam configuration, the smaller separation between each
pair of emitter and receiver is, the better the coverage. These electro-optical systems
commonly have built-in self-monitoring function to detect system failure. However, the price
of electro-optical safety edges is higher than the two previous types and much more suitable
for applications with wide door opening, for example, industrial gates for hangers and
warehouses.
1.2.5 Case Study
Several ATN systems are operational or under construction, and many concepts are still
developing which could be possibly introduced to commercial operation status in near future.
The study about door systems in current PRT applications or concept designs will assist the
development for the automatic door system which will be applied to Spartan Superway project.
In this part of the literature review, four mature PRT cases will be discussed. Each case has a
system overview and emphasized analysis on the door system onboard or at the platform. The
study focuses on the door mechanics used, door control signal transmission and the interaction
between traffic or systematic operation and door operation. These systems included in the
study are ULTra PRT, Taxi 2000, Vectus and Morgantown PRT.
ULTra PRT
The ULTra PRT system started operating at London Heathrow airpower in 2010. It has
a 4 km guideway, three stations and 21 vehicles. Each vehicle can carries four passengers. The
vehicles operate with a present headway of 4 seconds and one track is able to donate the
capacity of 3600 seats per hour (Lowson, 2011). There is no guided track involved in the
system, and all vehicles are autonomously steered on the front wheel and run with four rubber
24
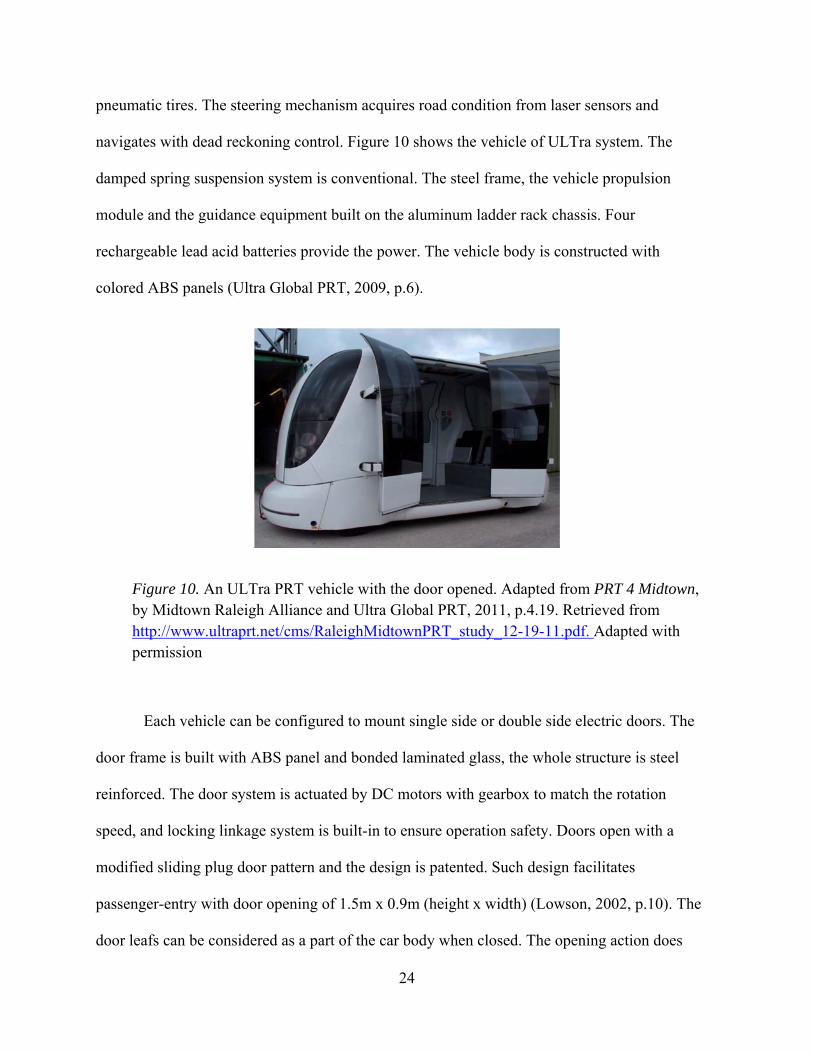
pneumatic tires. The steering mechanism acquires road condition from laser sensors and
navigates with dead reckoning control. Figure 10 shows the vehicle of ULTra system. The
damped spring suspension system is conventional. The steel frame, the vehicle propulsion
module and the guidance equipment built on the aluminum ladder rack chassis. Four
rechargeable lead acid batteries provide the power. The vehicle body is constructed with
colored ABS panels (Ultra Global PRT, 2009, p.6).
Figure 10. An ULTra PRT vehicle with the door opened. Adapted from PRT 4 Midtown, by Midtown Raleigh Alliance and Ultra Global PRT, 2011, p.4.19. Retrieved from http://www.ultraprt.net/cms/RaleighMidtownPRT_study_12-19-11.pdf. Adapted with permission
Each vehicle can be configured to mount single side or double side electric doors. The
door frame is built with ABS panel and bonded laminated glass, the whole structure is steel
reinforced. The door system is actuated by DC motors with gearbox to match the rotation
speed, and locking linkage system is built-in to ensure operation safety. Doors open with a
modified sliding plug door pattern and the design is patented. Such design facilitates
passenger-entry with door opening of 1.5m x 0.9m (height x width) (Lowson, 2002, p.10). The
door leafs can be considered as a part of the car body when closed. The opening action does
25
not require the sliding-guide rail to be installed on the outer surface of the body in which way
donates a clean surface body and reduces air drag while driving. There is no level change
between the platforms and the vehicle floor (Lowson, 2002, p.8). The door system is fully
automatic and controlled by microprocessor (Midtown Raleigh Alliance, 2011, p.4.19).
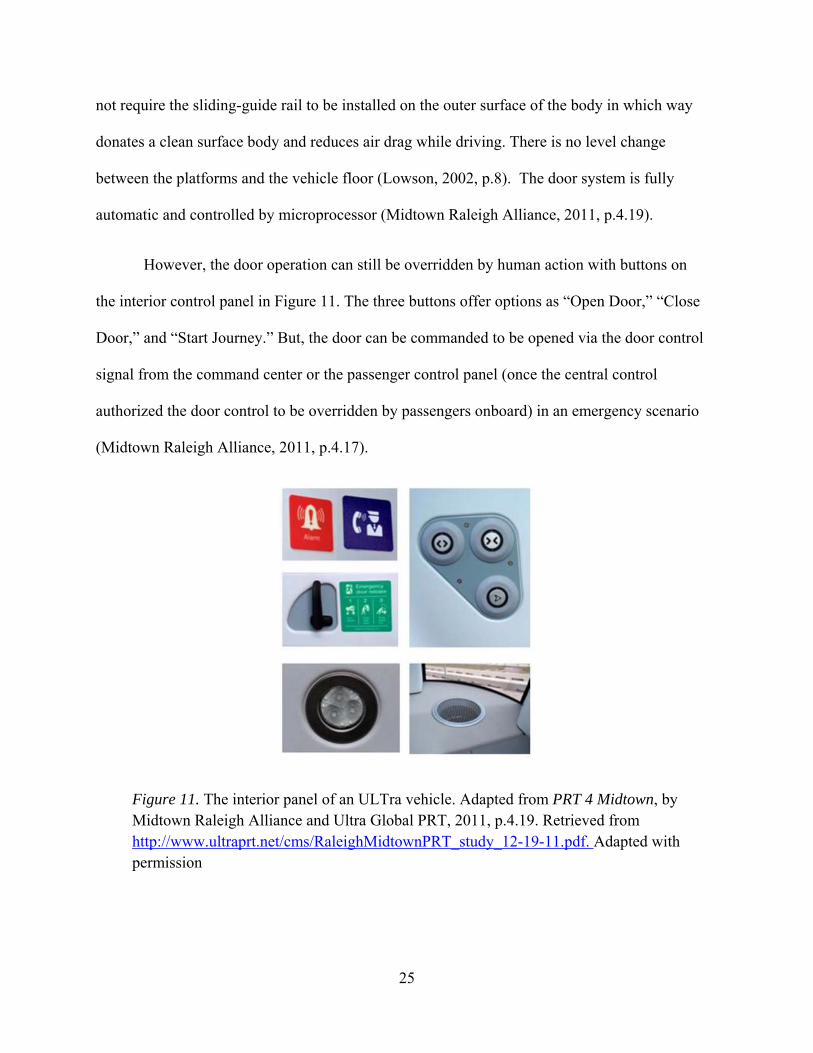
However, the door operation can still be overridden by human action with buttons on
the interior control panel in Figure 11. The three buttons offer options as “Open Door,” “Close
Door,” and “Start Journey.” But, the door can be commanded to be opened via the door control
signal from the command center or the passenger control panel (once the central control
authorized the door control to be overridden by passengers onboard) in an emergency scenario
(Midtown Raleigh Alliance, 2011, p.4.17).
Figure 11. The interior panel of an ULTra vehicle. Adapted from PRT 4 Midtown, by Midtown Raleigh Alliance and Ultra Global PRT, 2011, p.4.19. Retrieved from http://www.ultraprt.net/cms/RaleighMidtownPRT_study_12-19-11.pdf. Adapted with permission
26
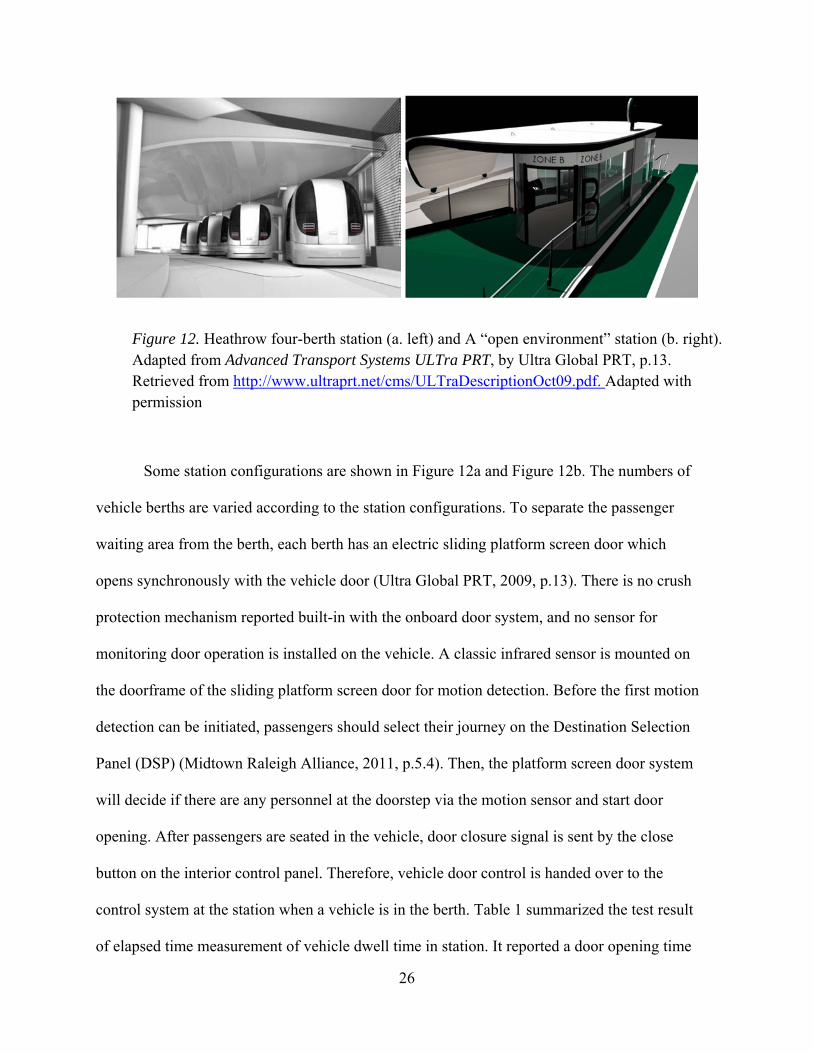
Figure 12. Heathrow four-berth station (a. left) and A “open environment” station (b. right). Adapted from Advanced Transport Systems ULTra PRT, by Ultra Global PRT, p.13. Retrieved from http://www.ultraprt.net/cms/ULTraDescriptionOct09.pdf. Adapted with permission
Some station configurations are shown in Figure 12a and Figure 12b. The numbers of
vehicle berths are varied according to the station configurations. To separate the passenger
waiting area from the berth, each berth has an electric sliding platform screen door which
opens synchronously with the vehicle door (Ultra Global PRT, 2009, p.13). There is no crush
protection mechanism reported built-in with the onboard door system, and no sensor for
monitoring door operation is installed on the vehicle. A classic infrared sensor is mounted on
the doorframe of the sliding platform screen door for motion detection. Before the first motion
detection can be initiated, passengers should select their journey on the Destination Selection
Panel (DSP) (Midtown Raleigh Alliance, 2011, p.5.4). Then, the platform screen door system
will decide if there are any personnel at the doorstep via the motion sensor and start door
opening. After passengers are seated in the vehicle, door closure signal is sent by the close
button on the interior control panel. Therefore, vehicle door control is handed over to the
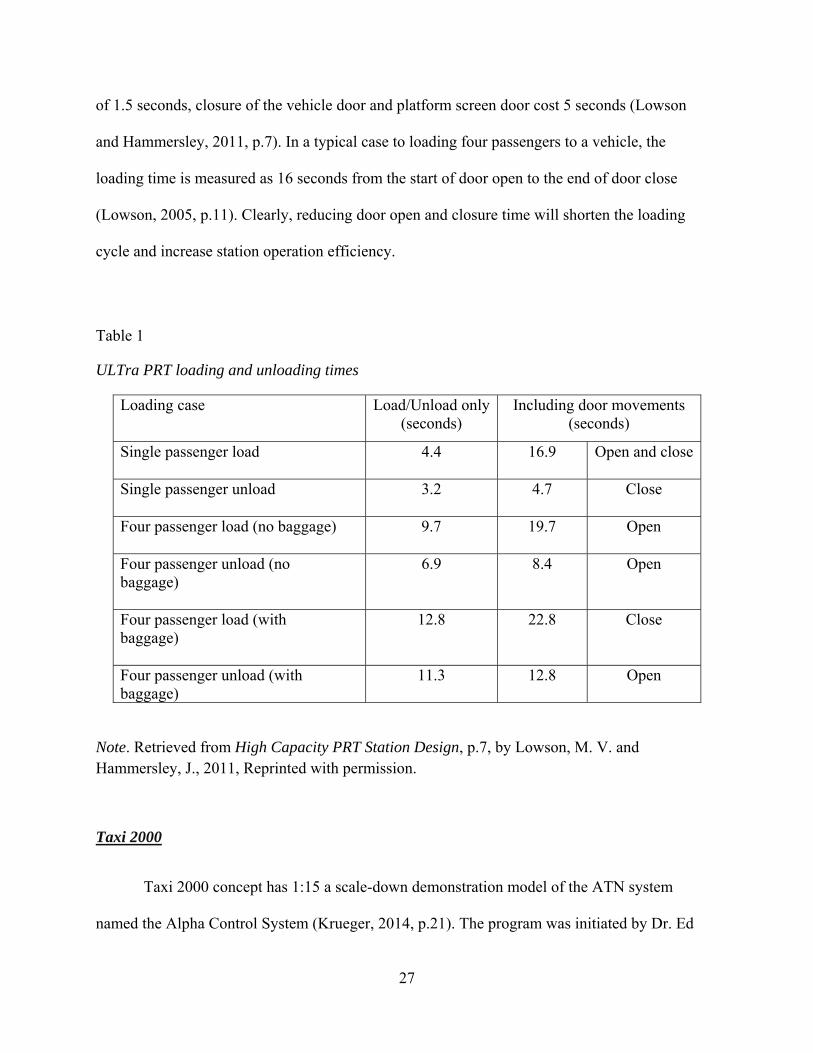
control system at the station when a vehicle is in the berth. Table 1 summarized the test result
of elapsed time measurement of vehicle dwell time in station. It reported a door opening time
27
of 1.5 seconds, closure of the vehicle door and platform screen door cost 5 seconds (Lowson
and Hammersley, 2011, p.7). In a typical case to loading four passengers to a vehicle, the
loading time is measured as 16 seconds from the start of door open to the end of door close
(Lowson, 2005, p.11). Clearly, reducing door open and closure time will shorten the loading
cycle and increase station operation efficiency.
Table 1
ULTra PRT loading and unloading times
Loading case Load/Unload only (seconds)
Including door movements (seconds)
Single passenger load 4.4 16.9 Open and close
Single passenger unload 3.2 4.7 Close
Four passenger load (no baggage) 9.7 19.7 Open
Four passenger unload (no baggage)
6.9 8.4 Open
Four passenger load (with baggage)
12.8 22.8 Close
Four passenger unload (with baggage)
11.3 12.8 Open
Note. Retrieved from High Capacity PRT Station Design, p.7, by Lowson, M. V. and Hammersley, J., 2011, Reprinted with permission.
Taxi 2000
Taxi 2000 concept has 1:15 a scale-down demonstration model of the ATN system
named the Alpha Control System (Krueger, 2014, p.21). The program was initiated by Dr. Ed
28
Anderson ten years ago and never developed beyond the demonstration. The first Taxi 2000’s
SkyWeb Express system was constructed and tested by Raytheon in Marlborough, MA. Today,
the system is still functional by the control of echoTM (Greenville County Economic
Development Corporation, 2014, p. 22). The system is consisted with a 1 mile test track, 3 off-
line stations and 20 battery powered vehicles. Each vehicle has a capacity of 3 passengers and
runs on a slot track. The guideway has a 3-feet-wide by 3-feet-deep cross section, each track
module is fabricated in length of 60 to 90 feet (The Ohio-Kentucky-Indiana Regional Council
of Governments, 2001, p.4-4). The system does not occupy the space for conventional traffic
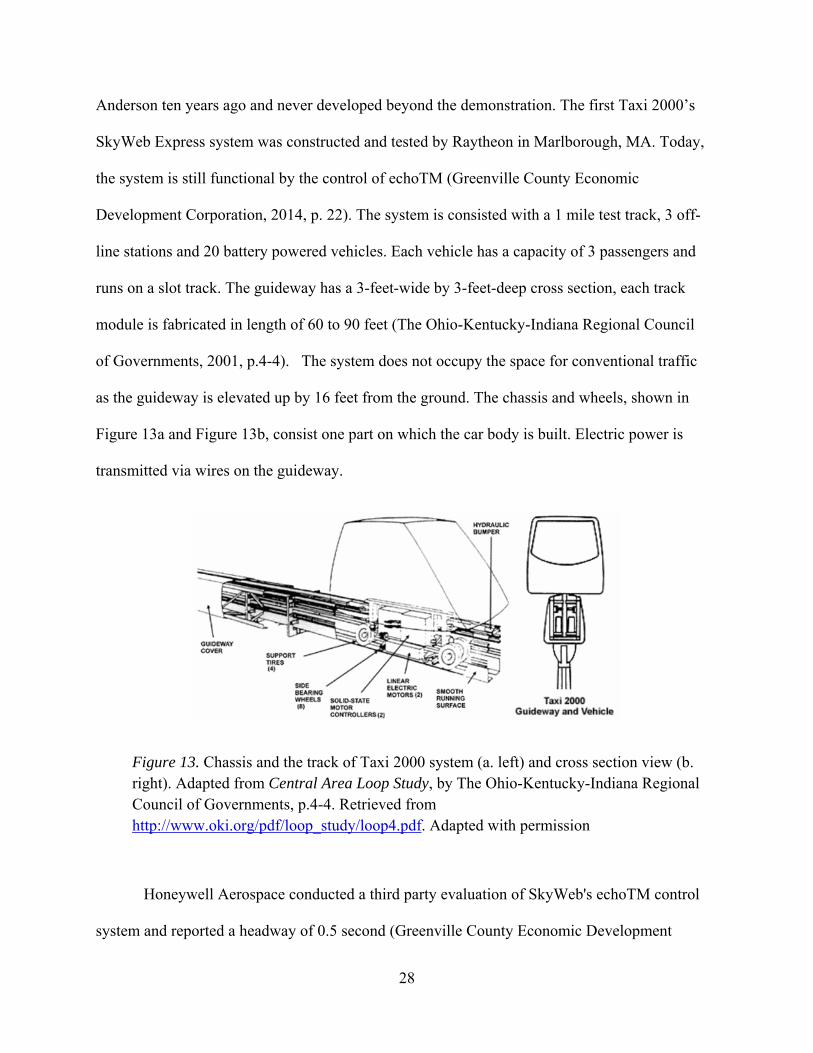
as the guideway is elevated up by 16 feet from the ground. The chassis and wheels, shown in
Figure 13a and Figure 13b, consist one part on which the car body is built. Electric power is
transmitted via wires on the guideway.
Figure 13. Chassis and the track of Taxi 2000 system (a. left) and cross section view (b. right). Adapted from Central Area Loop Study, by The Ohio-Kentucky-Indiana Regional Council of Governments, p.4-4. Retrieved from http://www.oki.org/pdf/loop_study/loop4.pdf. Adapted with permission
Honeywell Aerospace conducted a third party evaluation of SkyWeb's echoTM control
system and reported a headway of 0.5 second (Greenville County Economic Development
29
Corporation, 2014, p. 22). The vehicle control network uses a star topology and all vehicles’
movement is monitored by a real time server at the central control. Dual-way communication
is only possible between each vehicle and the central control (Taxi 2000 Corporation, 2010,
p.12). Thus, the central control is responsible for collision prevention, boarding control and
station approaching control. Unlike other PRT systems which apply self-steerable vehicles,
Taxi 2000 vehicles can only travel in the direction as the guideway leads. The off-line station
is constructed with a classic track platform fashion, and the ingress vehicles only can be served
in series. One obvious disadvantage is that a long waiting time of the previous vehicle will
produce a dramatic lag on the schedule of the latter vehicle.
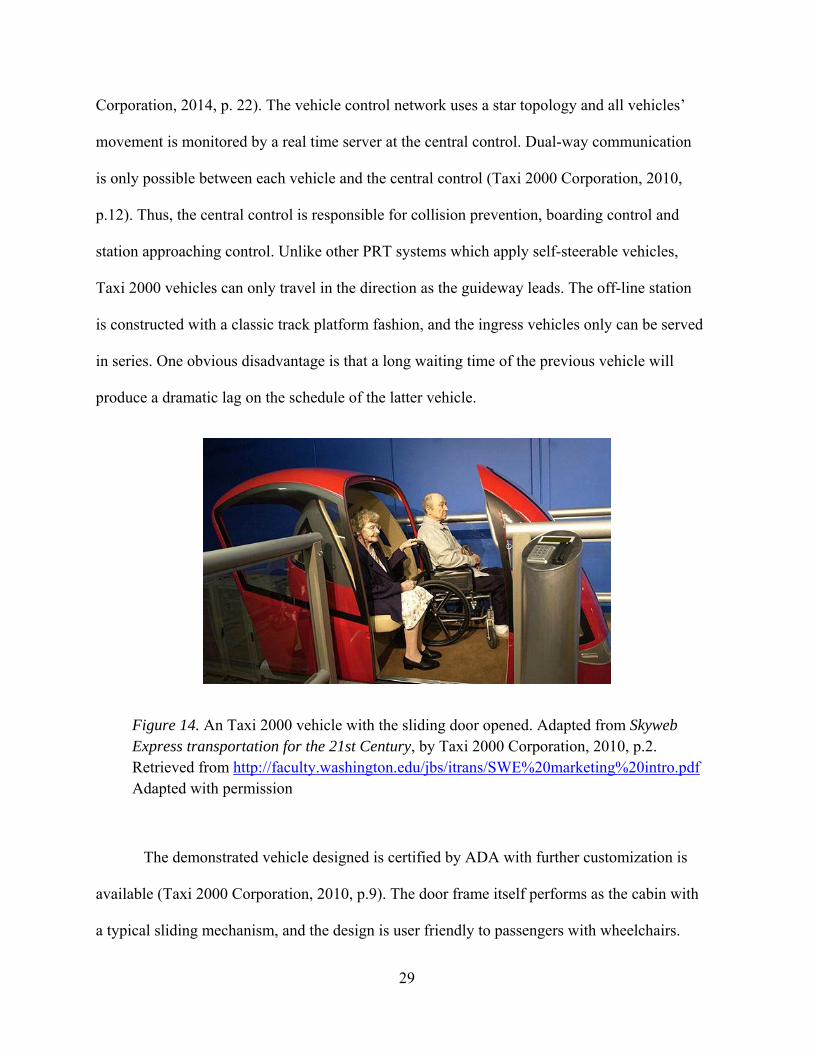
Figure 14. An Taxi 2000 vehicle with the sliding door opened. Adapted from Skyweb Express transportation for the 21st Century, by Taxi 2000 Corporation, 2010, p.2. Retrieved from http://faculty.washington.edu/jbs/itrans/SWE%20marketing%20intro.pdf Adapted with permission
The demonstrated vehicle designed is certified by ADA with further customization is
available (Taxi 2000 Corporation, 2010, p.9). The door frame itself performs as the cabin with
a typical sliding mechanism, and the design is user friendly to passengers with wheelchairs.
30
The guide rails for the sliding door are installed on the vehicle floor. The passenger interface
offers three action buttons; “Go,” “Next Stop,” and “Emergency.” Pressing the “Go”
button will start the journey to the desired destination. Pressing “Next Stop” button commands
the vehicle to drive to the next station (Taxi 2000 Corporation, 2010, p.9). The “Emergency”
button will initiate communication between the vehicle and the control center. The vehicle
door will automatically close once passengers press the buttons to start their journey (The
Ohio-Kentucky-Indiana Regional Council of Governments, 2001, p.4-7). Note that the system
is elevated from the ground and the door should maintain closed while the vehicle is traveling.
Thus, the door system is fully automatic and no passenger interference is allowed, door
emergency opening should be authorized by the control center even in an emergency situation.
The onboard door system of the demonstrated vehicle model was not reported to have
any motion detection or crush protection functions. However, it is highly recommended that
further design should have the ability to detect passenger boarding and leaving the vehicle. The
platform edge is on the same level with the vehicle floor, and the gap between the platform
edge and the vehicle door should be minimized to protect passengers from falling from the
platform. Some study suggested obstacle detection is necessary for platform screen doors in
Taxi 2000 approach to enhance safety so that passengers could be allowed to clear the
doorway if the door closure is retarded (The Ohio-Kentucky-Indiana Regional Council of
Governments, 2001, p.4-7).
Vectus
Vectus is a PRT project initiated by POSCO, a South Korean steel giant. The
construction of the full-size test track started in 2005 after the top level control and logistics
31
were valid. The test track is located in a former football field in Uppsala, Sweden with a length
of 400m. One station is on the off-line loop and three vehicles run on the test track. In 2007,
tests started to verify the possibility for a commercial operation. The system applied a
conventional railway fashion and the switch from the main loop to the off-line loop was
performed by classic track-switches. Vehicles are captive to the track and each pod has four
driving wheels and four unpowered guide wheels on the sides. Instead of using battery-rotary
motor approach for power, the system was powered by linear induction motors (LIMs) in-track
and onboard. This approach lowered the technology threshold and the overall cost of the
system (Gustafsson, 2009, p.4). The test track was retired in 2012 after all the tests were
completed.
A commercial system was introduced later in Suncheon Bay, South Korea in 2013. The
two-way track is 5km long with 40 vehicles operational, and two stations are located at each
end of the track. Typical headway is 4-5 seconds, and the system can transport 1313
passengers per hour in one direction (Pemberton, 2012, p.8). The track is elevated from the
ground about 5 meters. Each station has four berths, and the track and the platform are
separated by the screen door. A vehicle has its own vehicle control system for sensing and
monitoring, the central control links with all vehicles via radio communication. The network is
applied asynchronously with distributed topography. The vehicle decides its own position and
calibrates the measurement with the data sent from the central control. The door operation
command is conducted by the onboard vehicle control system once the vehicle is in the station,
and doors are automatically locked after the vehicle leafs the station. The pod has two doors on
both sides.
Differing from the door system on the test vehicle which uses sliding door mechanism,
32
the onboard door system of the commercial one applies sliding plug door mechanism and
permanent magnet linear motors powered. This design could reduce the numbers of moving
parts and enhance the reliability. It reported to achieve 1.5 million cycles before faults occur
(Pemberton, 2013, p.10). Door leafs are built with carbon fiber and steel reinforcement.
Another design purpose for the application of sliding plug door mechanism is to minimize the
gap between the platform edge and the edge of the vehicle floor while maintaining a large door
opening for easy access. Thanks to sliding plug door mechanism, the door opening of the new
vehicle is 900mm wide by 1950mm high (Pemberton, 2012, p.31). The original test vehicle
has a capacity of 4 seats. The commercial version vehicle has a seat capacity of 6-8 passengers
and potential space for 6 standing. The interior door control panel is only functional when
authorized and the door opens synchronously with the platform screen door. Platform screen
doors have crush protection and motion detection sensors installed. The door system has built-
in emergency mechanism to allow emergency evacuation on both sides.
Morgantown PRT
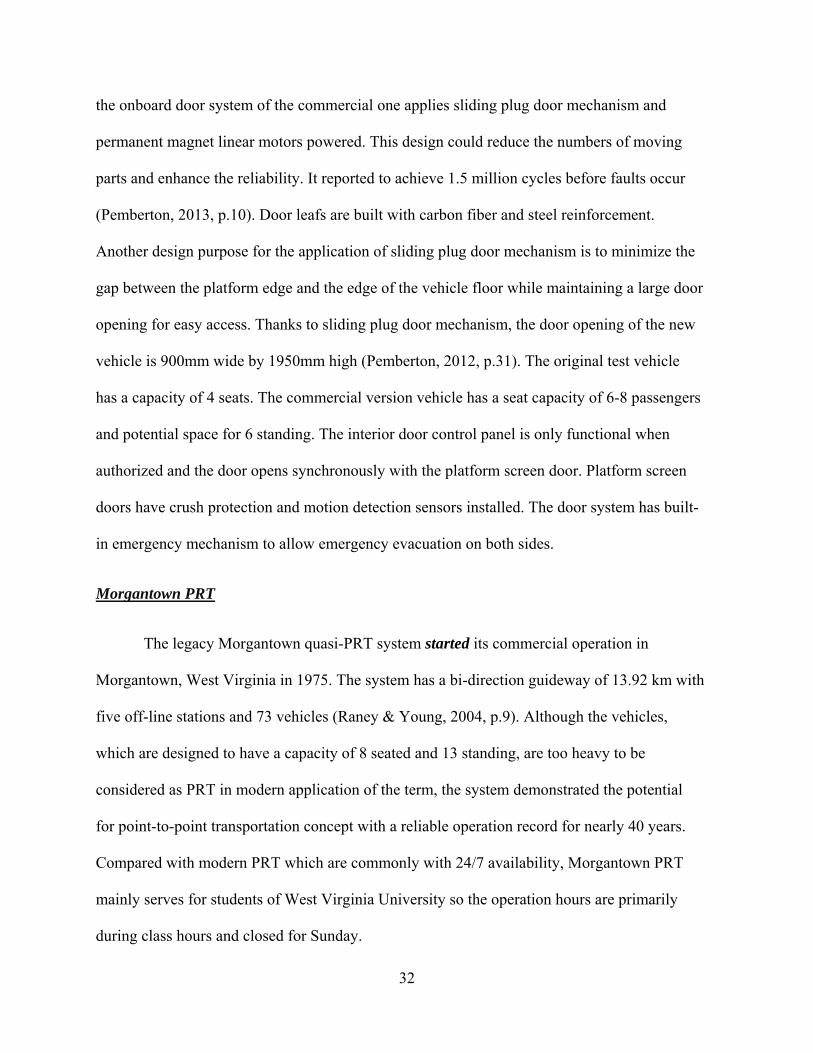
The legacy Morgantown quasi-PRT system started its commercial operation in
Morgantown, West Virginia in 1975. The system has a bi-direction guideway of 13.92 km with
five off-line stations and 73 vehicles (Raney & Young, 2004, p.9). Although the vehicles,
which are designed to have a capacity of 8 seated and 13 standing, are too heavy to be
considered as PRT in modern application of the term, the system demonstrated the potential
for point-to-point transportation concept with a reliable operation record for nearly 40 years.
Compared with modern PRT which are commonly with 24/7 availability, Morgantown PRT
mainly serves for students of West Virginia University so the operation hours are primarily
during class hours and closed for Sunday.
33
Note that when the vehicle carries many people, instead of running a point-to-point
fashion, it operates like an automated people mover from one end of the line to the other. The
vehicles are electric powered with a 52 kW DC motor, and electric pickups on the two sides of
the vehicle are mounted to electrified rails on one side or both sides of the guideway. The
vehicle is four-wheeling steering to perform small radius turn. The cabin and doors are
constructed with welded steel frame. Automatic sliding doors on each side of the vehicle are
DC motor powered and respond to the control channel to determine which door is activated
when the vehicle is in the station. The door system is not reported to have any crush protection
mechanism, and the legacy door control did not cooperate with any sensors for motion
detection. Though no platform screen doors are installed to separate the waiting area away
from the guideway as the project with built in the 1970s, an alternative solution is applied to
guide vehicles with protective safety guide rails to stop at the exact position when door
opening matches the gap in the guardrail. The tolerance of positioning error is reported to be
+/- 6 inches (Raney & Young, 2004, p.8). The vehicle uses automatic pneumatic leveling to
make the vehicle floor be on the same level of the platform. The door closing signal is sent by
the station control unit and is transformed to the actuator command by the vehicle control unit.
The additional embedded loops on the guideway send not only the driving command from the
central control, but also the door command once the vehicle is parked at the proper position
(Raney & Young, 2004, p.10). There is no interior door control panel for passengers and no
manual override is allowed. But the danger of passengers falling to the guideway still exists as
the waiting area is not fully separated, and the guardrails have no effect to prevent suicide
attempts.
34
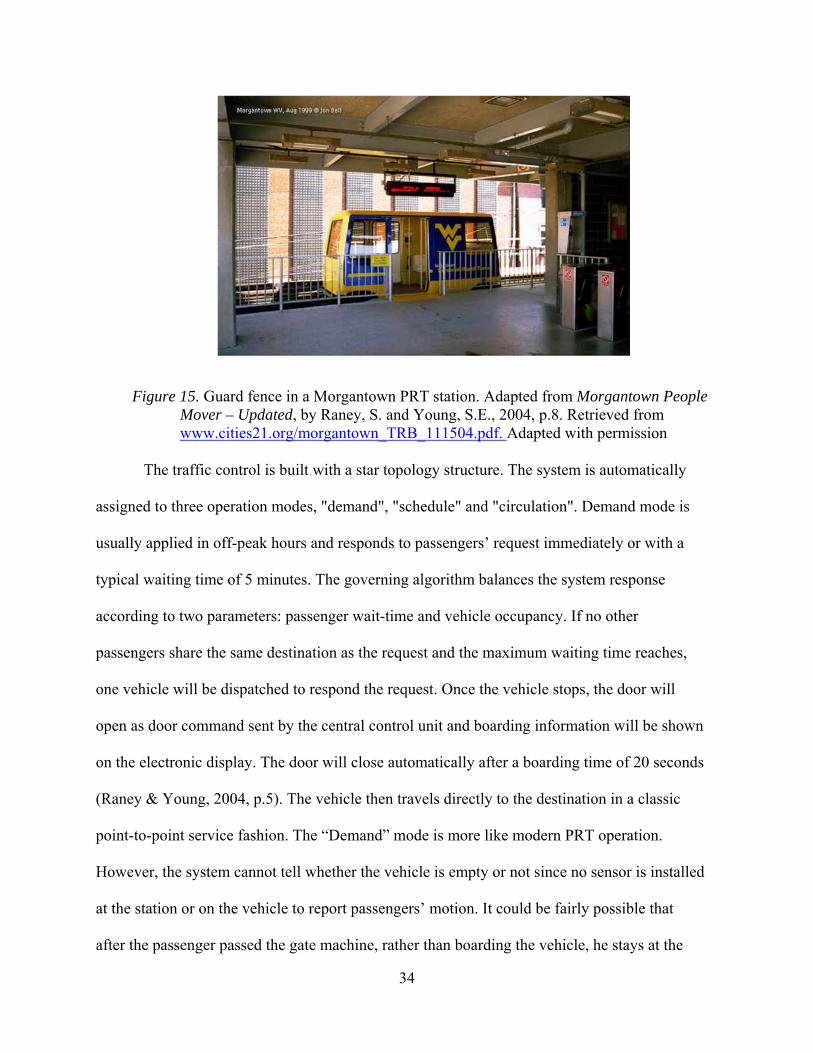
Figure 15. Guard fence in a Morgantown PRT station. Adapted from Morgantown People Mover – Updated, by Raney, S. and Young, S.E., 2004, p.8. Retrieved from www.cities21.org/morgantown_TRB_111504.pdf. Adapted with permission
The traffic control is built with a star topology structure. The system is automatically
assigned to three operation modes, "demand", "schedule" and "circulation". Demand mode is
usually applied in off-peak hours and responds to passengers’ request immediately or with a
typical waiting time of 5 minutes. The governing algorithm balances the system response
according to two parameters: passenger wait-time and vehicle occupancy. If no other
passengers share the same destination as the request and the maximum waiting time reaches,
one vehicle will be dispatched to respond the request. Once the vehicle stops, the door will
open as door command sent by the central control unit and boarding information will be shown
on the electronic display. The door will close automatically after a boarding time of 20 seconds
(Raney & Young, 2004, p.5). The vehicle then travels directly to the destination in a classic
point-to-point service fashion. The “Demand” mode is more like modern PRT operation.
However, the system cannot tell whether the vehicle is empty or not since no sensor is installed
at the station or on the vehicle to report passengers’ motion. It could be fairly possible that
after the passenger passed the gate machine, rather than boarding the vehicle, he stays at the
35
waiting area on the platform. The system still considers this situation as a traveling task and
drives the vehicle to the proposed station. This is a waste on transportation capacity.
The PRT service of “Demand” mode will be off when peak hours come and all vehicles
will be commanded to run predetermined routes via point-to-point fashion to lower waiting
time. The routes are designed with pre-knowledge of passengers’ traveling patterns which are
collected from historical records (Raney & Young, 2004, p.6). Circulation mode is activated in
a low-demand period as the vehicles stop at every station like traditional bus service. However,
the boarding time will not be changed in these two modes.
1.2.6 Conclusion and Implication of Literature Study
For vehicles will in the SMSSV project, a full electrical approach will be preferred,
since the main power source of the system comes from the electricity generated by solar panels.
Therefore, the prime mover for the door system is ideally suited to be a DC motor rather than a
pneumatic actuator as discussed earlier. A sliding door or sliding plug door is recommended
for the door mechanics. The choice between sliding or sliding plug will be based on the gap
between the edge of the vehicle floor and the platform edge. A large gap can allow some space
for door leafs to slide out. It should be noticed that the allowable gap is resulted from the
vehicle’s stability performance when berthing. For a vehicles that are suspended from the
guideway, sliding door mechanics will minimize the gap as the vehicle berth can be designed
closer to the platform edge, since no space is required for door leafs to slide out.
Platform screen doors are highly recommended for suspended and rail track approaches.

36
If the budget allows for stations with platform screen doors, the designer should consider this
option no matter which door approach the project may go with. Wide FOV sensors are optimal
for passenger present detection, and the safety edge is a must for each door leaf. The design for
door control module needs cooperation with traffic control team, and this issue will be
discussed later in related chapters.

37
Chapter 2 – Methodology
The design processes of this automatic door system can be divided into two parts:
structure design and control design. Before going into the design work in each section, a rough
scope of the prototyping project was investigated including the design objectives and methods
available. This prior study was conducted through literature review and regular meetings with
members of Spartan Superway project team. Engineering decisions were made during the
process of prototyping with involvement of external requirements coming from the team.
The structure design process in this master project followed these steps:
1. Concept
2. Design criteria and design specifications
3. Numerical Solution
4. Finite Element Analysis Simulation
5. Scale-down engineering prototyping
6. Prototype Test
The design requirements from operation safety and accessibility control are directly
reflected in the choice for dimensions and parameter sets for the system. The design criteria
section provides additional explanation on the system’s functionality. The validation of
structure design is conducted not only using analytical and numerical techniques (FEA) and
physical testing after assembly, but also in the operation test after the integration with the door
control system, so that it can be verified that the system operates successfully or not.
Design for the door control system is a systemic engineering problem and requires
contributions from the design for vehicle control system and the integrated transportation

38
control system. The door control system is directly connected to the vehicle control system and
acquires its control signal from the vehicle control to determine the authorization for door
operation. The communication protocol must be achieved among the actuators and the control
system’s equipment both on software and hardware level.
The design for the door control system went through these steps:
1. Motor selection (based on mchanics design)
2. Signal standard & control logic
3. Hardware & Software selection
4. Integration
5. Testing
The initial starting point of door control system design is the selection for the motor
which drives the mechanics. Motors in different types and models may require variable input
signal which is commonly voltage in AC/DC. Based on this information, means for
communication between the actuator and the door control system can be set. Moreover, extra
work is asked to establish the communication within the vehicle control system and the door
control system. Correct door operation can be defined as the door remains locked while the
vehicle is in motion and conduct door movement according to designed operation regulation
(opening, closing and waiting with designed timing). This issue is highly related with the
vehicle operation on the guideway under the command of integrated control which gives
orders to all vehicles operating in the transit network. Establishing of a system-wide
communication protocol is a higher level engineering problem with a higher priority.

39
Chapter 3 – Results and Discussion
3.1 Design Criteria of This Automatic Door System
From the prior study in literature review, the setting of design criteria is discussed in
this section. Design criteria directly reflect the user requirements summarized from literature
review. The door opening is set to be 1.5 m wide and 2 m high according to the finding from
the Metro System Design Manual (Valley Metro Transit System, 2007, p.7-6) to secure
accessibility for regular walking passengers and passengers in wheelchairs. In this project a
prototype with only a single door panel was built to simplify the design and fabrication effort.
A load and a single door leaf model is adequate for demonstration purposes.
The gap between the door edge and the platform edge in horizontal and vertical
direction will be a design input for the vehicle design task to guarantee a safe door way for
wheelchair users as required by ADA guidelines (The U.S. Access Board, 1992, p.16). The
design for gaps between the door leafs and the frame to prevent head or body trapping is not
considered, since the prototype is mounted on a free standing frame rather than installed in a
cabin design prototype.
Since the model has only one door panel, there is no dimension design to prevent hand
crush protection. However, the function of hand crush protection is achieved by detecting the
pressure change sent by the safety edge mounted on the edge of the door panel in which way a
similar functionality is able to be demonstrated on this prototype.
The door mechanics is selected to be mounted on the ceiling of the cabin. The reason to
choose this location for mounting comes from the plan for the guideway layout. The guideway
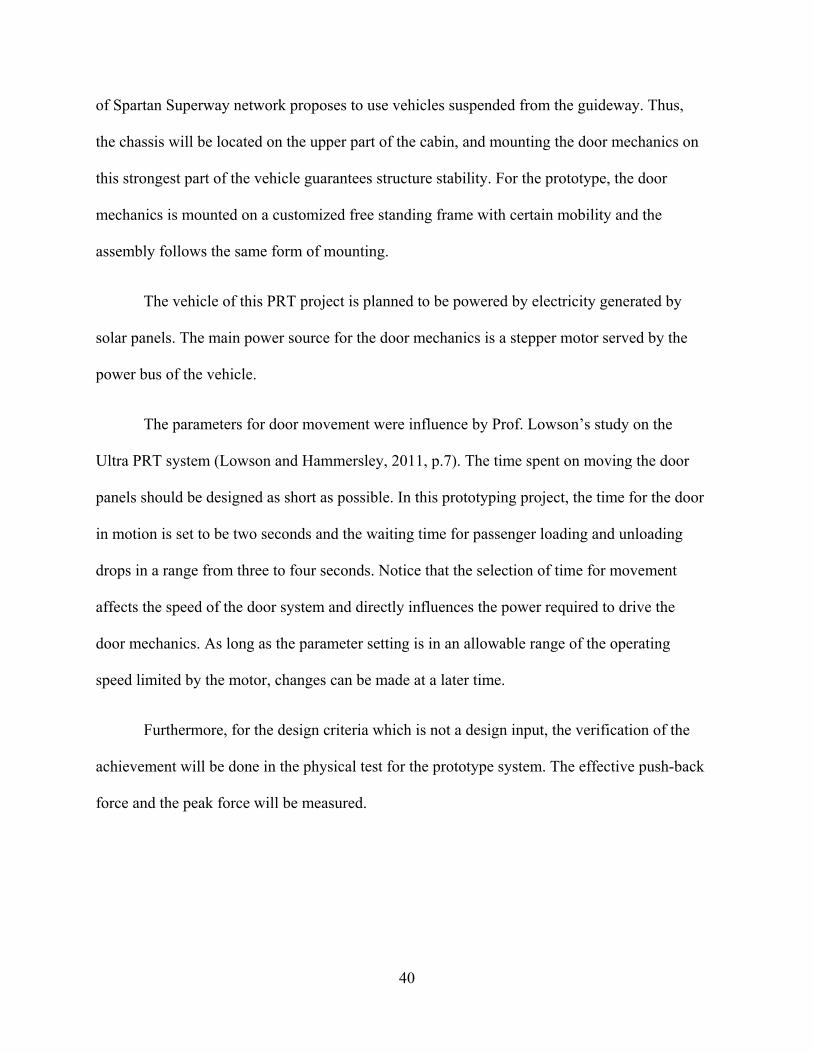
40
of Spartan Superway network proposes to use vehicles suspended from the guideway. Thus,
the chassis will be located on the upper part of the cabin, and mounting the door mechanics on
this strongest part of the vehicle guarantees structure stability. For the prototype, the door
mechanics is mounted on a customized free standing frame with certain mobility and the
assembly follows the same form of mounting.
The vehicle of this PRT project is planned to be powered by electricity generated by
solar panels. The main power source for the door mechanics is a stepper motor served by the
power bus of the vehicle.
The parameters for door movement were influence by Prof. Lowson’s study on the
Ultra PRT system (Lowson and Hammersley, 2011, p.7). The time spent on moving the door
panels should be designed as short as possible. In this prototyping project, the time for the door
in motion is set to be two seconds and the waiting time for passenger loading and unloading
drops in a range from three to four seconds. Notice that the selection of time for movement
affects the speed of the door system and directly influences the power required to drive the
door mechanics. As long as the parameter setting is in an allowable range of the operating
speed limited by the motor, changes can be made at a later time.
Furthermore, for the design criteria which is not a design input, the verification of the
achievement will be done in the physical test for the prototype system. The effective push-back
force and the peak force will be measured.

41
Table 2
Summary of Design Criteria
Doorway Width 1.5 m
Doorway Height 2 m
Type of Actuator Hybrid Stepper Motor
Location of Actuator Above the door frame
Power Supply Vehicle Power Bus/Auxiliary battery
Opening/Closing Time 4 sec
Loading/Unloading Time 20-30 sec
Sensors Safety Edge/Light Curtain
System MTBF Based on Actual Design
3.2 The Full Scale Door System’s Mechanism Design
Designing the mechanism of door is the core of this design project. The layout of
mechanism assembly is shown in Figure 17. The door panel is connected to a panel supporting
part with bolts. The trajectory of this part is constrained by the door roller running on the
guideway. The curvature portion of the guideway contributes the sliding out movement. The
end near the curvature portion is the stop position for door closed as the door panel withdraw
back into the cabin. The other end is the position where the door mechanism extracts the door
panel to its open position.
The roller is selected according to the load vertically applied upon it and the load is
numerically calculated with the actual weight of the door panel. The arm system connects
the door panel to the main shaft as the shaft constrains possible rotation in the axis which is
perpendicular to the front surface of the door panel. Also, a sleeve mechanism shown in
Figure 19 is installed at the bottom of the door panel to constrain the rotation about the axis
of the main shaft.
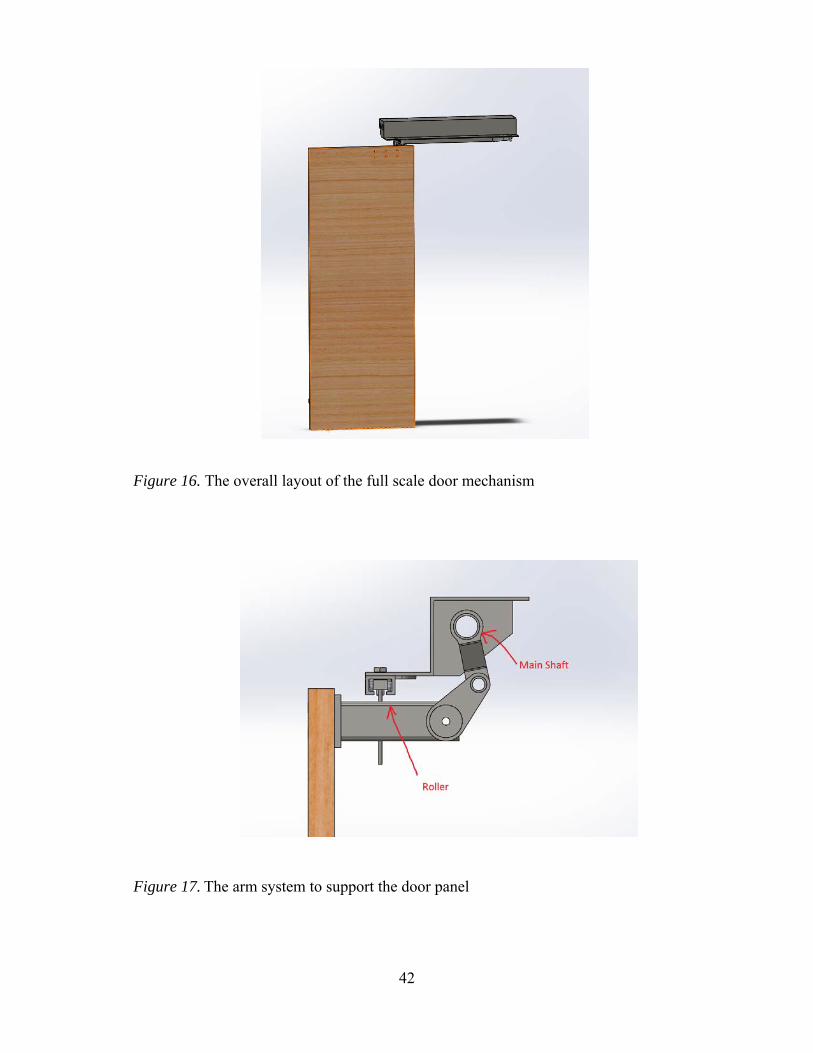
42
Figure 16. The overall layout of the full scale door mechanism
Figure 17. The arm system to support the door panel
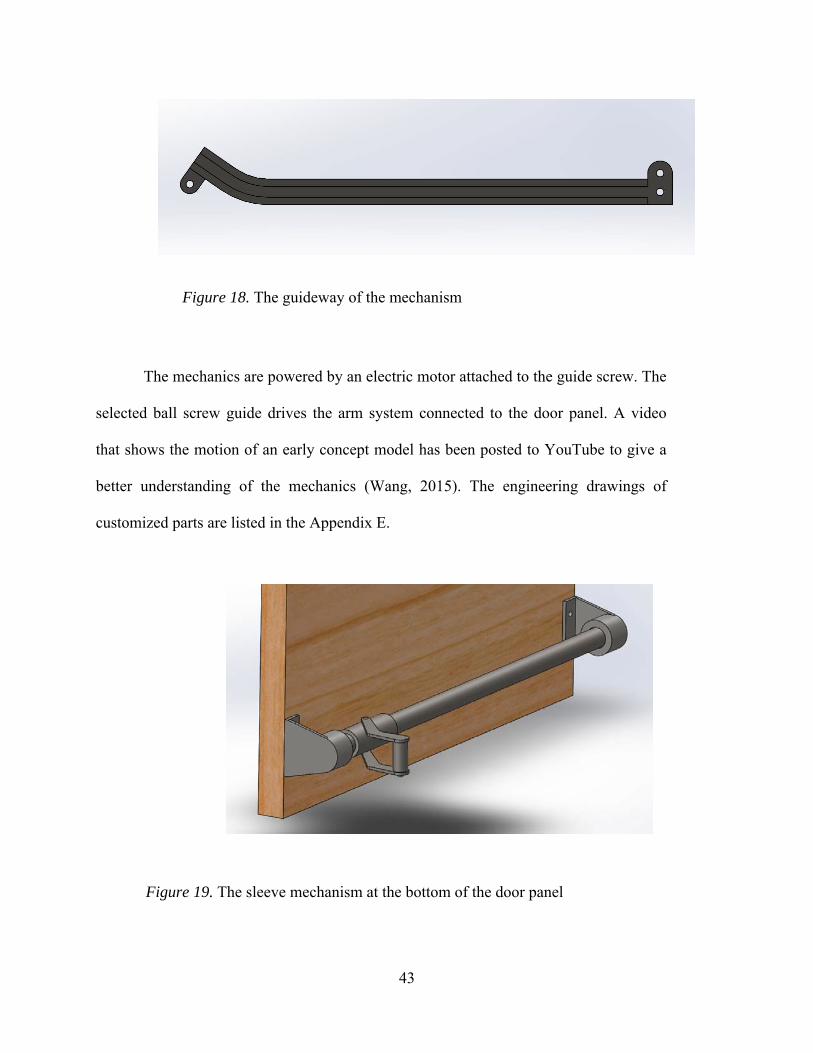
43
Figure 18. The guideway of the mechanism
The mechanics are powered by an electric motor attached to the guide screw. The
selected ball screw guide drives the arm system connected to the door panel. A video
that shows the motion of an early concept model has been posted to YouTube to give a
better understanding of the mechanics (Wang, 2015). The engineering drawings of
customized parts are listed in the Appendix E.
Figure 19. The sleeve mechanism at the bottom of the door panel
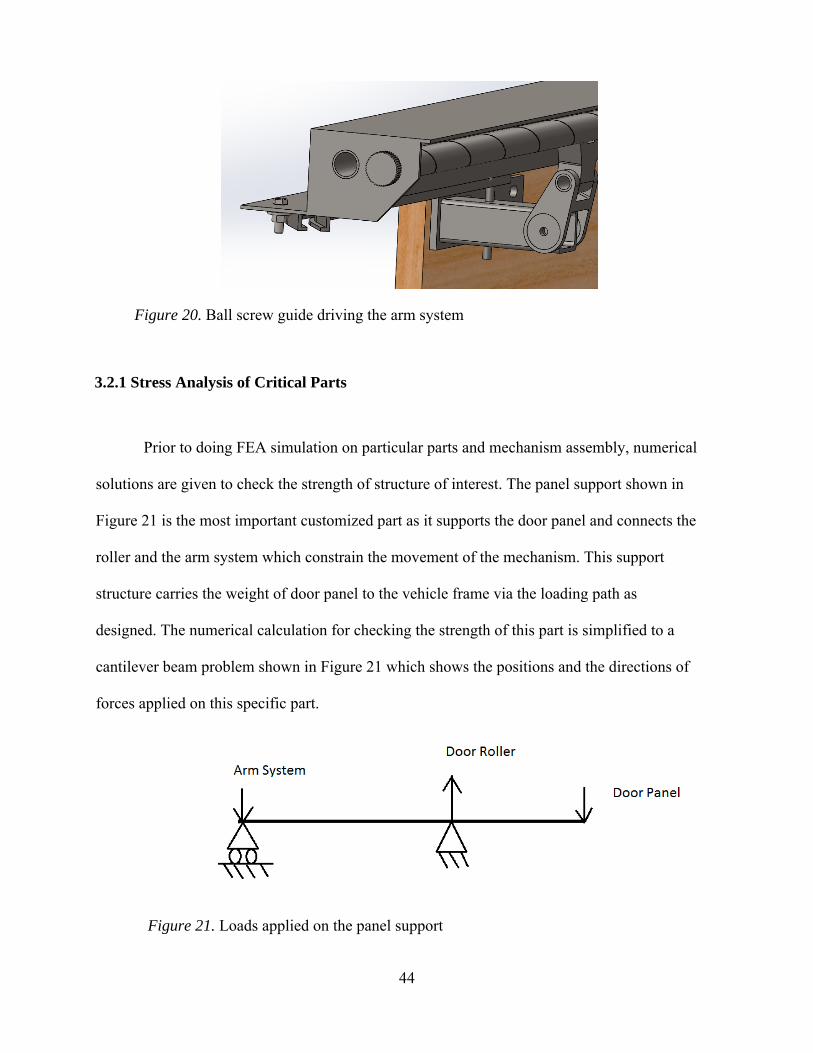
44
Figure 20. Ball screw guide driving the arm system
3.2.1 Stress Analysis of Critical Parts
Prior to doing FEA simulation on particular parts and mechanism assembly, numerical
solutions are given to check the strength of structure of interest. The panel support shown in
Figure 21 is the most important customized part as it supports the door panel and connects the
roller and the arm system which constrain the movement of the mechanism. This support
structure carries the weight of door panel to the vehicle frame via the loading path as
designed. The numerical calculation for checking the strength of this part is simplified to a
cantilever beam problem shown in Figure 21 which shows the positions and the directions of
forces applied on this specific part.
Figure 21. Loads applied on the panel support
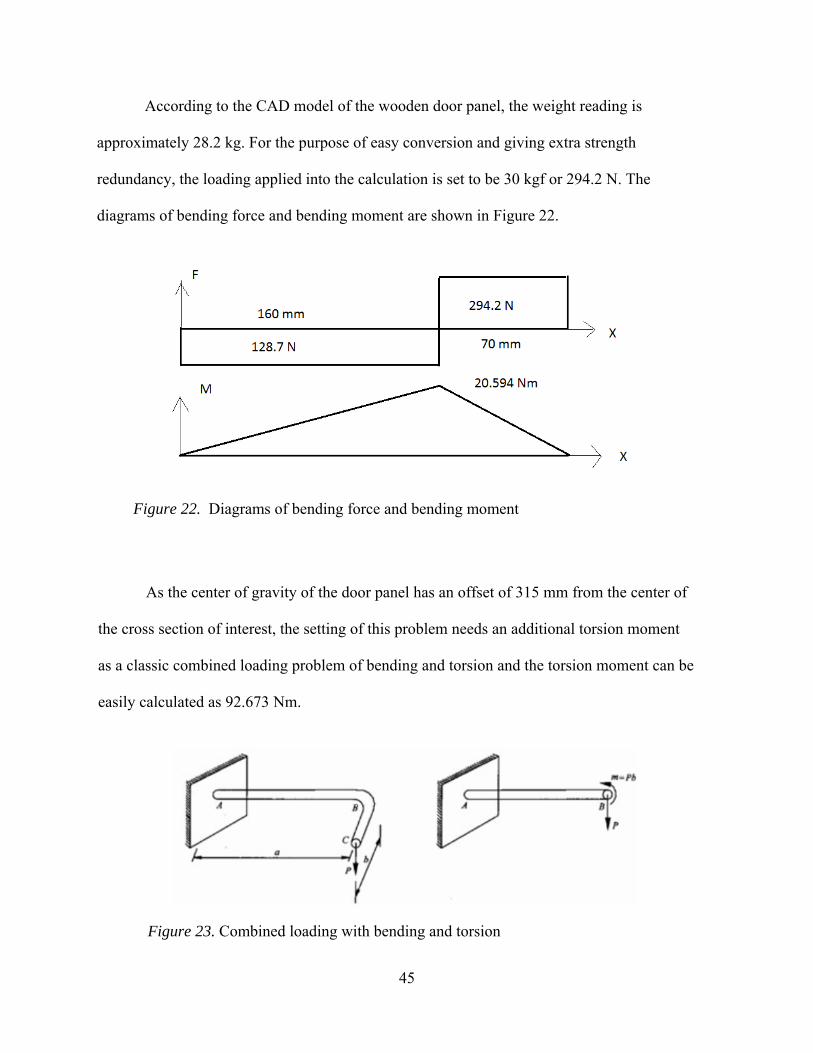
45
According to the CAD model of the wooden door panel, the weight reading is
approximately 28.2 kg. For the purpose of easy conversion and giving extra strength
redundancy, the loading applied into the calculation is set to be 30 kgf or 294.2 N. The
diagrams of bending force and bending moment are shown in Figure 22.
Figure 22. Diagrams of bending force and bending moment
As the center of gravity of the door panel has an offset of 315 mm from the center of
the cross section of interest, the setting of this problem needs an additional torsion moment
as a classic combined loading problem of bending and torsion and the torsion moment can be
easily calculated as 92.673 Nm.
Figure 23. Combined loading with bending and torsion

46
Tresca’s Criterion (Huang and Gao, 2004, p.628) is applied to do the check as:
(3)
in which, bending stress is calculated as:
(4)
where the section modulus of bending is defined according to the square section of the
part:
6(5)
Figure 24. The cross section view of the panel support
And the shear stress due to torsion is computed via the following equation (Budynas, 1998,
p.446):

47
τM
2δ a δ(6)
where the thickness of the cross section is labelled as .
The calculation of the maximum shear stress also takes the effect of round fillet into
consideration and written as:
(7)
where is the factor of stress concentration which can be calculated as:
1.74
(8)
The bending stress and the shear stress are 0.969 MPa and 4.608 MPa correspondingly.
Thus, the yield stress in this particular case is computed to be 9.267 MPa. Recalling the yield
strength, 370 MPa, of 1018 steel which is selected to fabricate the part, the material is strong
enough to carry the designed load.
As shown in Figure 22, the force applied to the bolt attached to the door roller due to
bending is 422.912 N or 43.125 kgf. The suppliers in the market provide their products with
the maximum loading capacity as one of the vital specifications. A door roller able to handle
100 kgf can meet the design requirement.
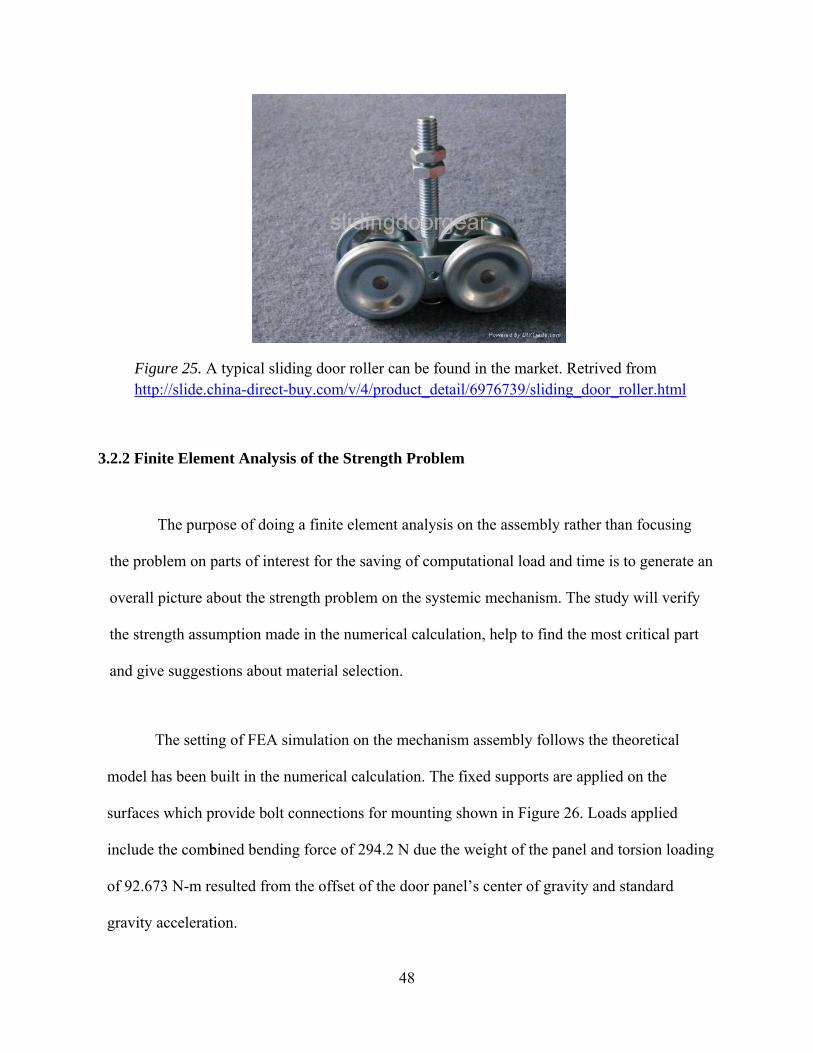
48
Figure 25. A typical sliding door roller can be found in the market. Retrived from http://slide.china-direct-buy.com/v/4/product_detail/6976739/sliding_door_roller.html
3.2.2 Finite Element Analysis of the Strength Problem
The purpose of doing a finite element analysis on the assembly rather than focusing
the problem on parts of interest for the saving of computational load and time is to generate an
overall picture about the strength problem on the systemic mechanism. The study will verify
the strength assumption made in the numerical calculation, help to find the most critical part
and give suggestions about material selection.
The setting of FEA simulation on the mechanism assembly follows the theoretical
model has been built in the numerical calculation. The fixed supports are applied on the
surfaces which provide bolt connections for mounting shown in Figure 26. Loads applied
include the combbined bending force of 294.2 N due the weight of the panel and torsion loading
of 92.673 N-m resulted from the offset of the door panel’s center of gravity and standard
gravity acceleration.
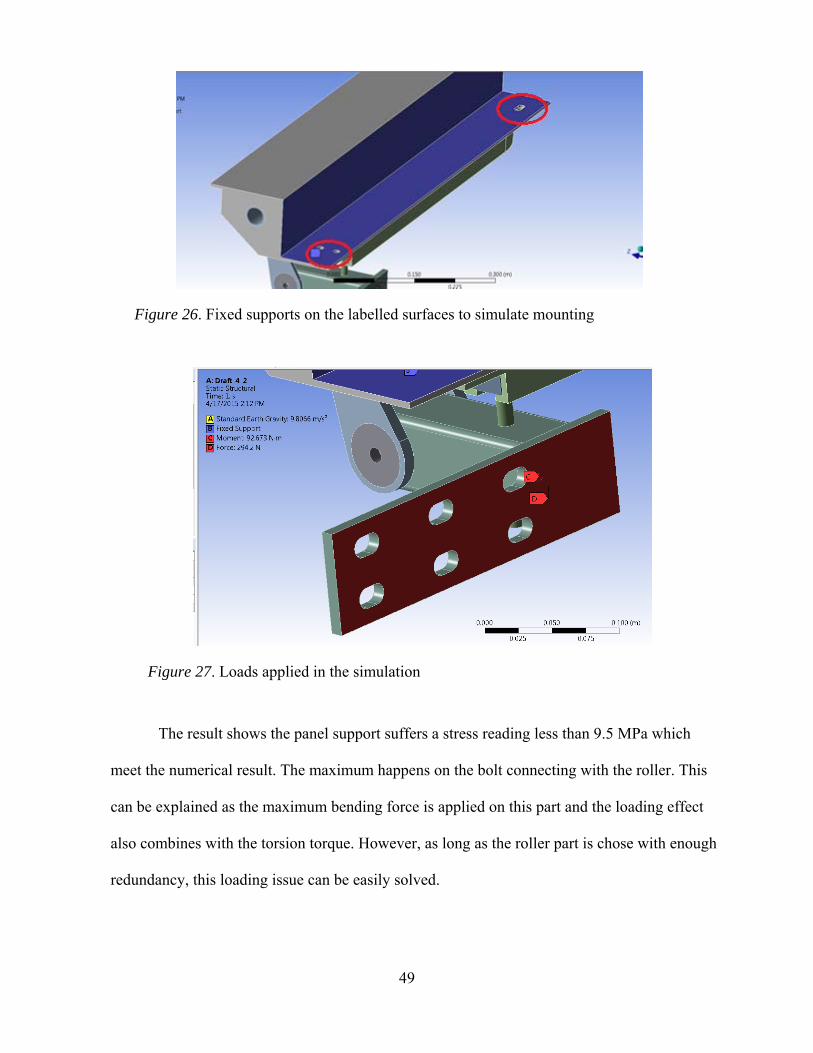
49
Figure 26. Fixed supports on the labelled surfaces to simulate mounting
Figure 27. Loads applied in the simulation
The result shows the panel support suffers a stress reading less than 9.5 MPa which
meet the numerical result. The maximum happens on the bolt connecting with the roller. This
can be explained as the maximum bending force is applied on this part and the loading effect
also combines with the torsion torque. However, as long as the roller part is chose with enough
redundancy, this loading issue can be easily solved.
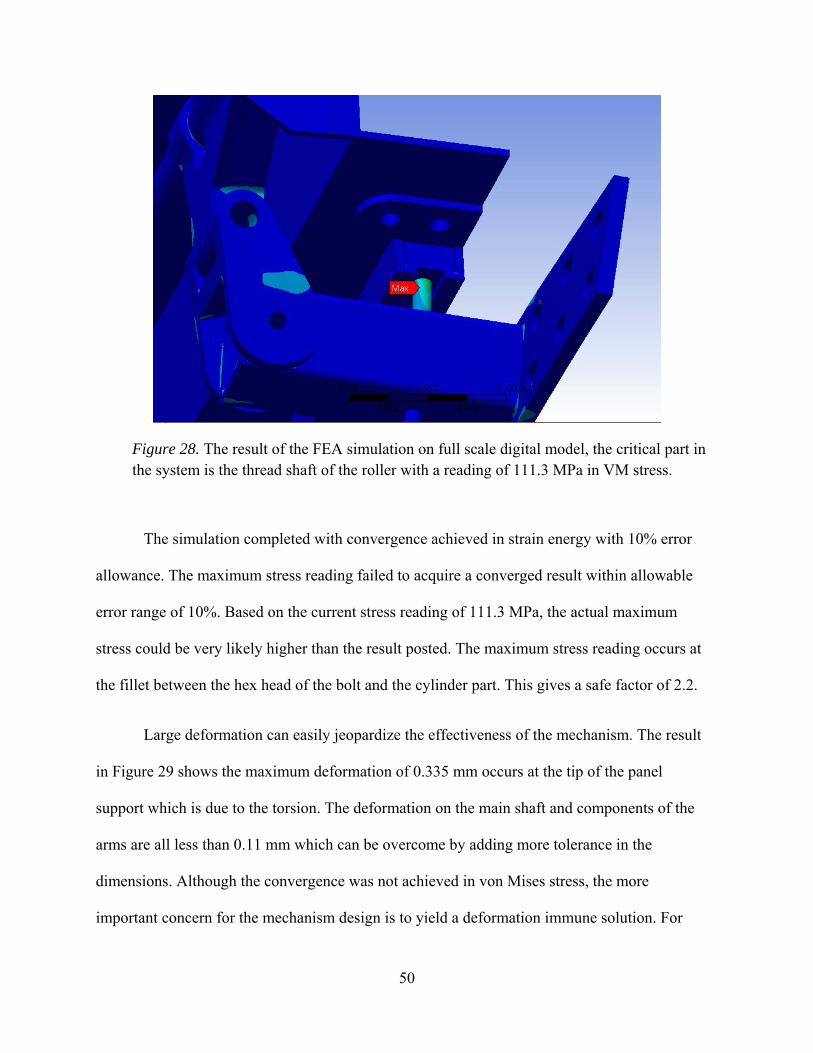
50
Figure 28. The result of the FEA simulation on full scale digital model, the critical part in the system is the thread shaft of the roller with a reading of 111.3 MPa in VM stress.
The simulation completed with convergence achieved in strain energy with 10% error
allowance. The maximum stress reading failed to acquire a converged result within allowable
error range of 10%. Based on the current stress reading of 111.3 MPa, the actual maximum
stress could be very likely higher than the result posted. The maximum stress reading occurs at
the fillet between the hex head of the bolt and the cylinder part. This gives a safe factor of 2.2.
Large deformation can easily jeopardize the effectiveness of the mechanism. The result
in Figure 29 shows the maximum deformation of 0.335 mm occurs at the tip of the panel
support which is due to the torsion. The deformation on the main shaft and components of the
arms are all less than 0.11 mm which can be overcome by adding more tolerance in the
dimensions. Although the convergence was not achieved in von Mises stress, the more
important concern for the mechanism design is to yield a deformation immune solution. For
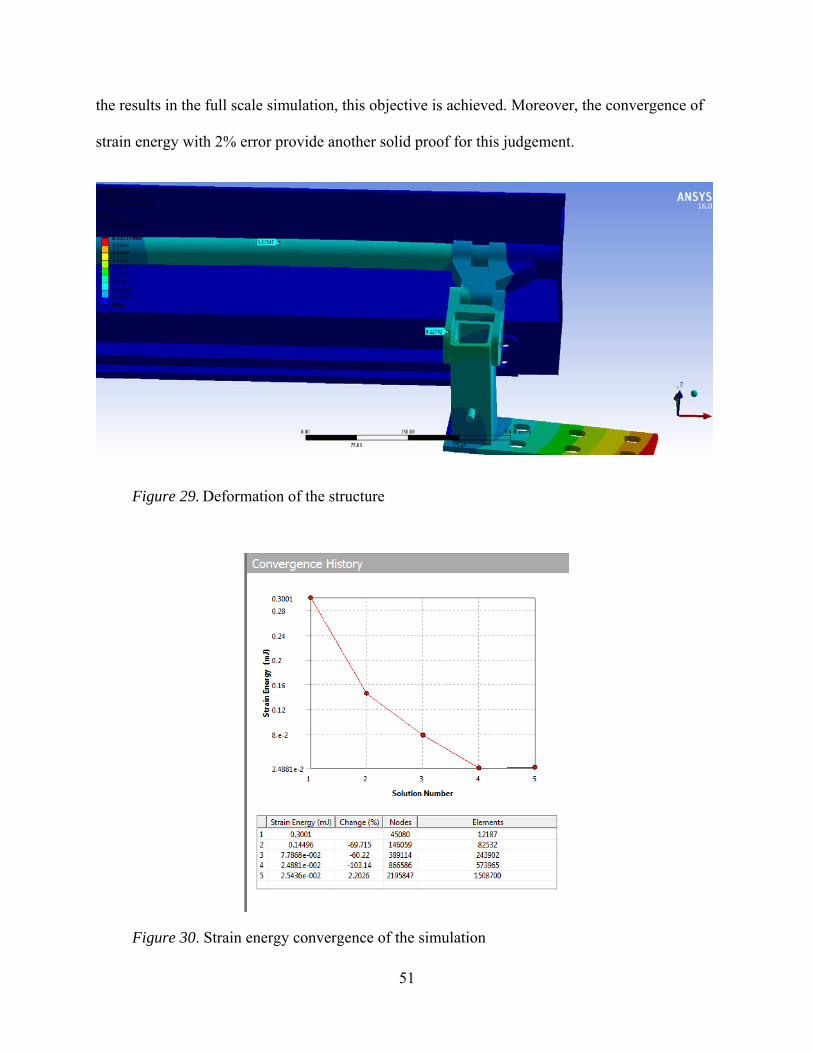
51
the results in the full scale simulation, this objective is achieved. Moreover, the convergence of
strain energy with 2% error provide another solid proof for this judgement.
Figure 29. Deformation of the structure
Figure 30. Strain energy convergence of the simulation
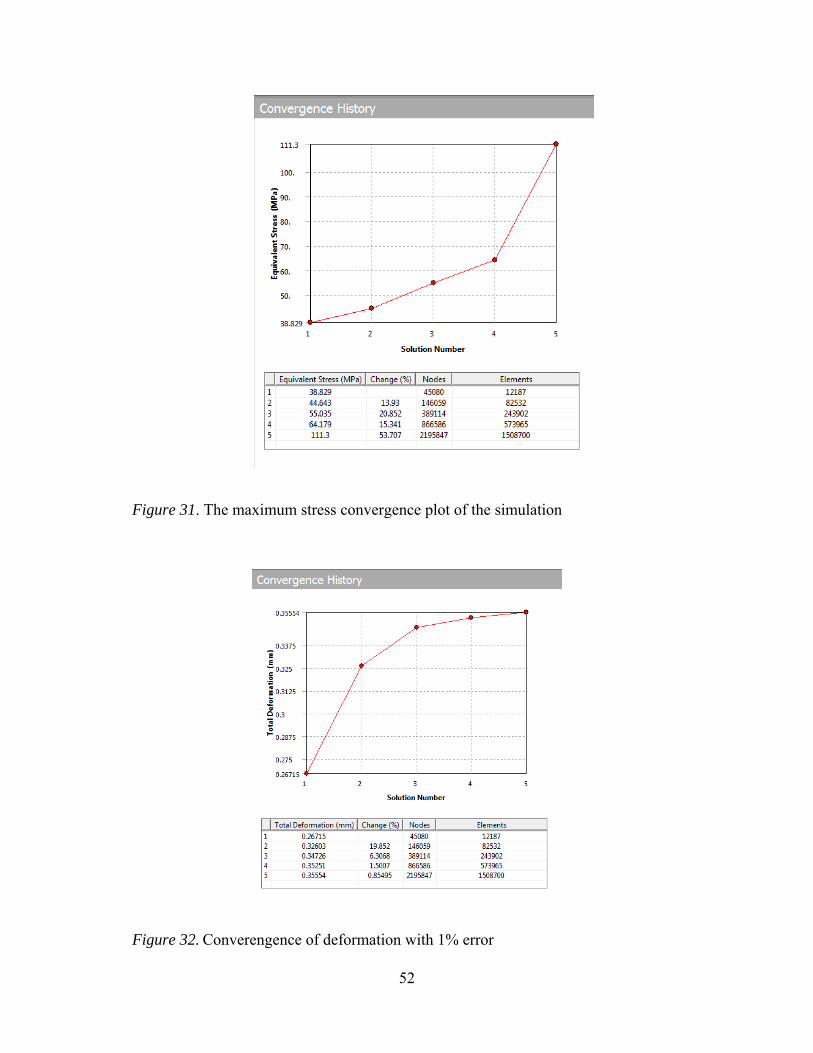
52
Figure 31. The maximum stress convergence plot of the simulation
Figure 32. Converengence of deformation with 1% error
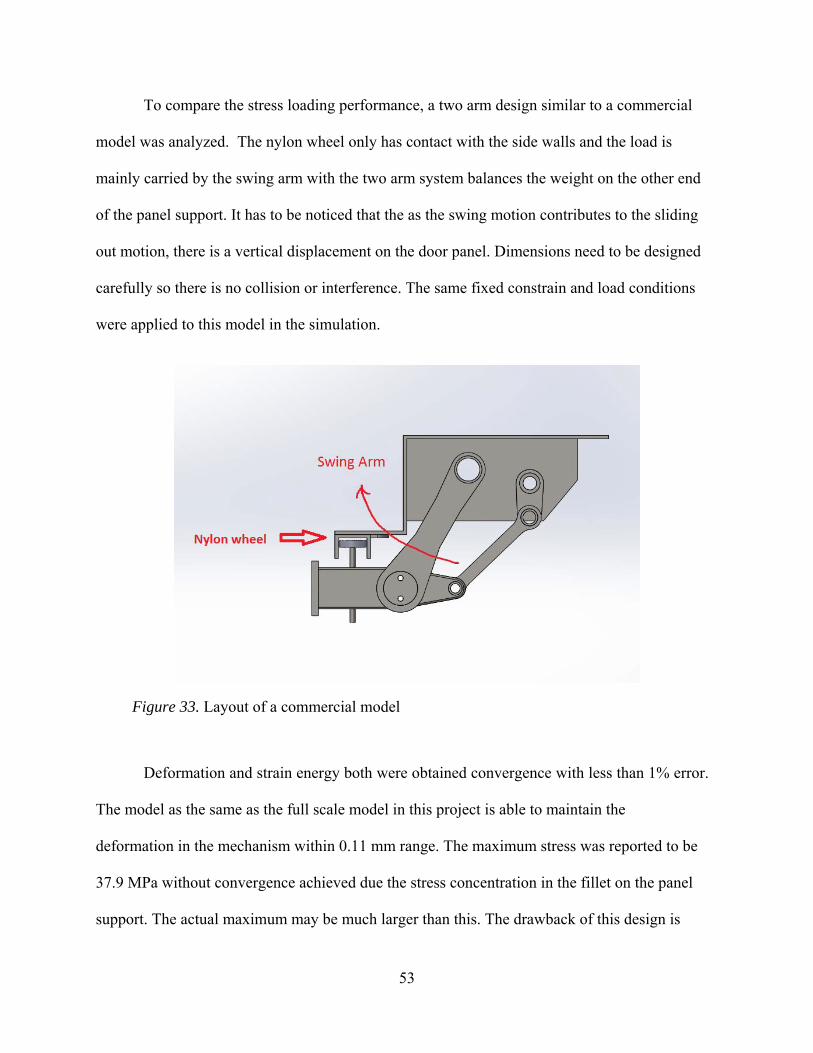
53
To compare the stress loading performance, a two arm design similar to a commercial
model was analyzed. The nylon wheel only has contact with the side walls and the load is
mainly carried by the swing arm with the two arm system balances the weight on the other end
of the panel support. It has to be noticed that the as the swing motion contributes to the sliding
out motion, there is a vertical displacement on the door panel. Dimensions need to be designed
carefully so there is no collision or interference. The same fixed constrain and load conditions
were applied to this model in the simulation.
Figure 33. Layout of a commercial model
Deformation and strain energy both were obtained convergence with less than 1% error.
The model as the same as the full scale model in this project is able to maintain the
deformation in the mechanism within 0.11 mm range. The maximum stress was reported to be
37.9 MPa without convergence achieved due the stress concentration in the fillet on the panel
support. The actual maximum may be much larger than this. The drawback of this design is
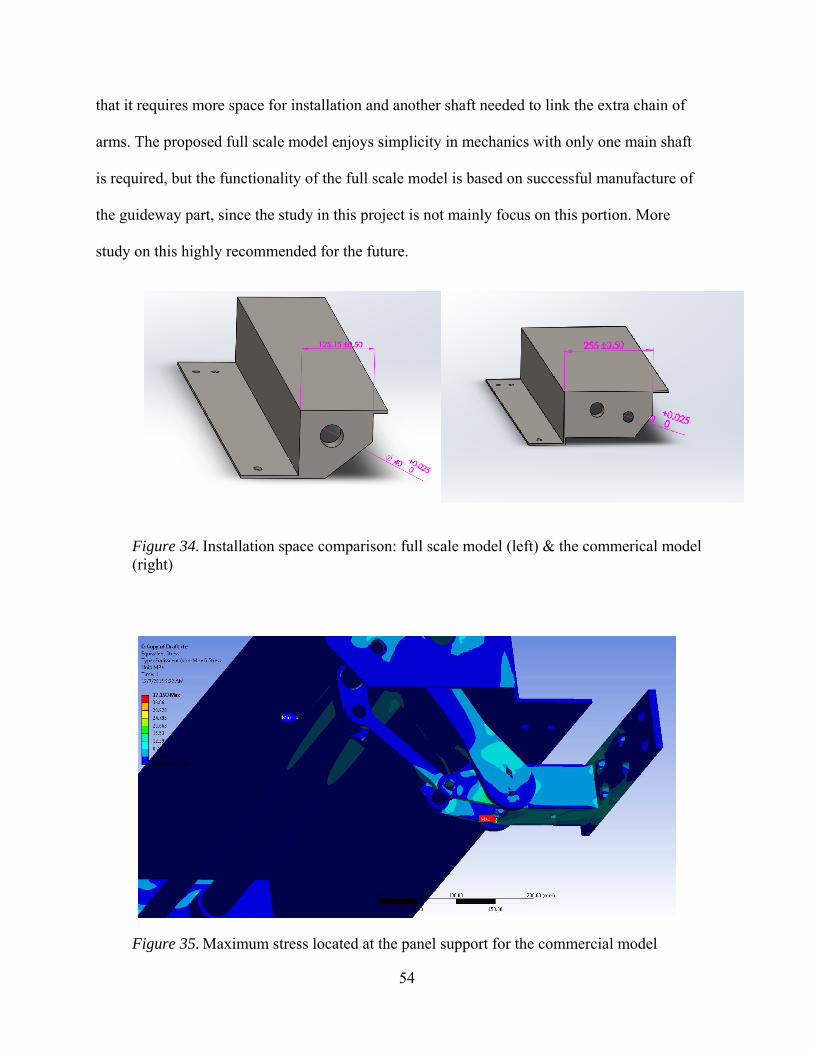
54
that it requires more space for installation and another shaft needed to link the extra chain of
arms. The proposed full scale model enjoys simplicity in mechanics with only one main shaft
is required, but the functionality of the full scale model is based on successful manufacture of
the guideway part, since the study in this project is not mainly focus on this portion. More
study on this highly recommended for the future.
Figure 34. Installation space comparison: full scale model (left) & the commerical model (right)
Figure 35. Maximum stress located at the panel support for the commercial model
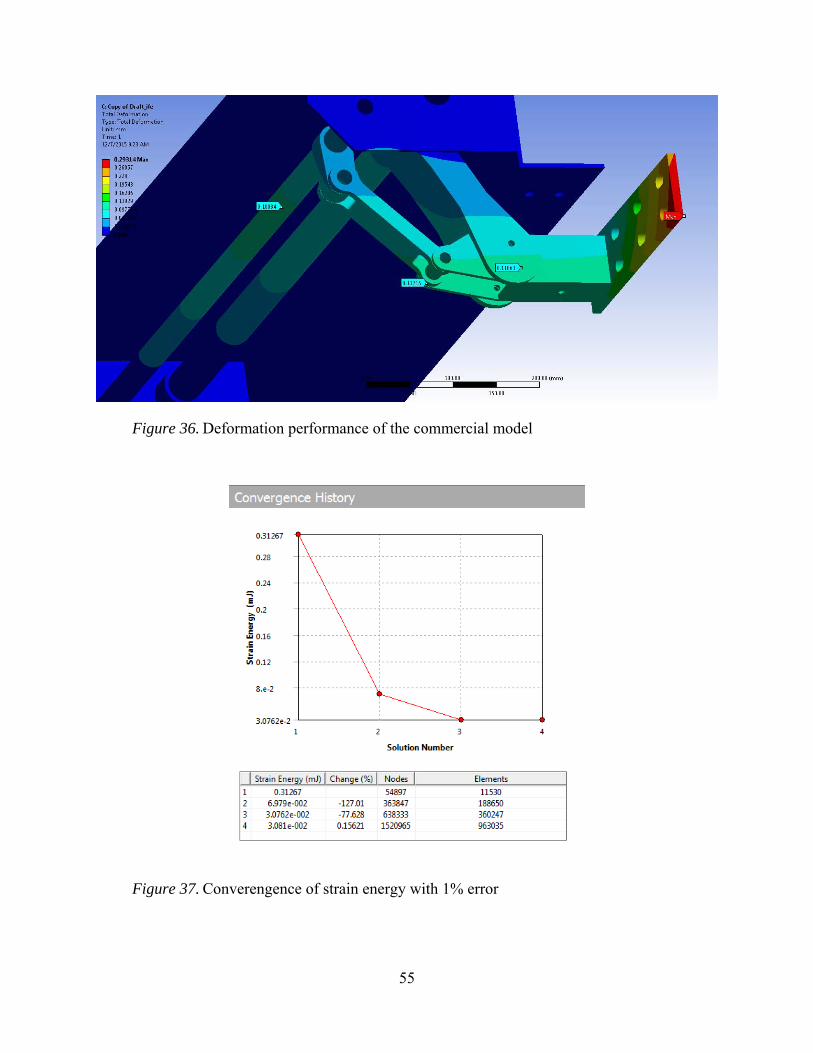
55
Figure 36. Deformation performance of the commercial model
Figure 37. Converengence of strain energy with 1% error
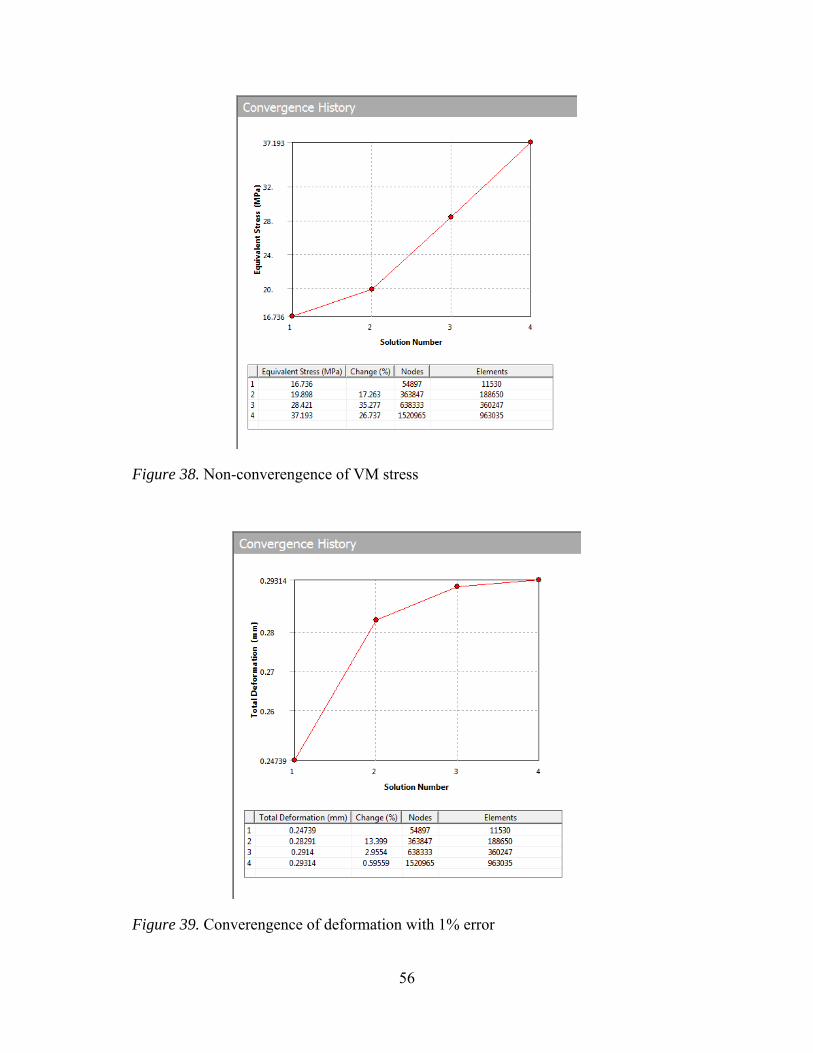
56
Figure 38. Non-converengence of VM stress
Figure 39. Converengence of deformation with 1% error

57
3.3 1:3 Scale Prototype Model
Instead of building a full scale model, which is an expensive approach for concept
proving, a 1:3 scale prototype was designed and built to validate the design concept. As the
door opening for the full scale model is 810 mm, the required traveling distance for the 1:3
scale prototype should be 270 mm. The traveling time is the same as 4 seconds for each
opening or closing motion. The structural components were 3D printed with polylactic acid
(PLA) rather than machined from metal, so the mechanics do not carry the load of an actual
fiber glass door panel. The system may carry a foam core panel about hundred grams as
external load.
Additional benefits come from 3D-printing and digital laser cutting, for example,
broken parts can be replaced within few hours. Light material guarantees a lighter gross weight
of the system. This makes the prototype portable and easy to be reassembled onsite at any
conference meetings or exhibitions for demonstration.
The power source was selected to be a stepper motor. Though the stepper motor is not
able to apply closed-loop speed control, the precise counting of the distance traveled is
favorable for the door mechanics as the displacement control is more critical to determine the
timing to deceleration.
3.3.1 Mechanism Design of The Scale Down Model
As mentioned previously, the scale model prototype shares the same mechanics as the
full-scale concept. However, the guideway was transformed into a slot cut on a base panel with
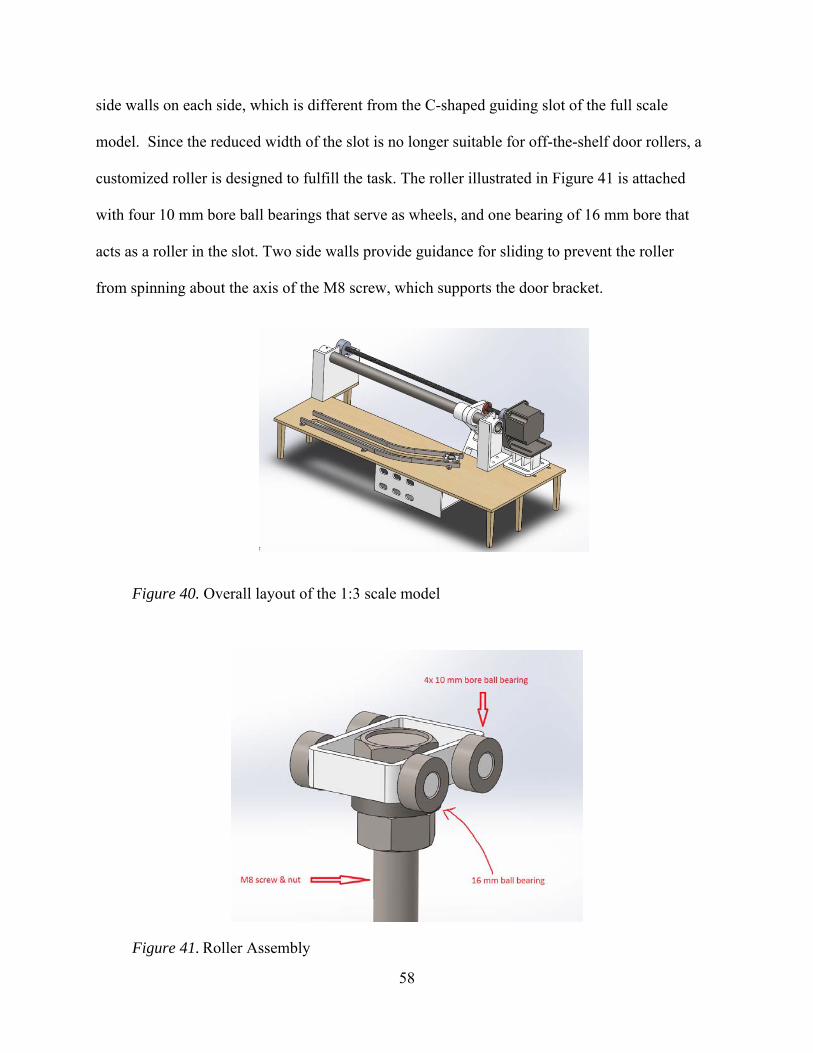
58
side walls on each side, which is different from the C-shaped guiding slot of the full scale
model. Since the reduced width of the slot is no longer suitable for off-the-shelf door rollers, a
customized roller is designed to fulfill the task. The roller illustrated in Figure 41 is attached
with four 10 mm bore ball bearings that serve as wheels, and one bearing of 16 mm bore that
acts as a roller in the slot. Two side walls provide guidance for sliding to prevent the roller
from spinning about the axis of the M8 screw, which supports the door bracket.
Figure 40. Overall layout of the 1:3 scale model
Figure 41. Roller Assembly

59
The door mechanics was designed to travel 270 mm within four seconds. This denotes
an average linear speed of 67.5 mm per second. This meets the requirement for transmission
design. The pitch of the lead screw should be as large as possible. A large lead requires a slow
rotation speed, which is an advantage for motor control. For this project, the door is required to
stop as quickly as possible when sensors detect hand crush hazard. The motor will spends less
time to bring down the rotation speed to zero when operating at a lower speed. The lead screw
used in this project is a two-start lead screw with right hand thread of 8 mm lead, which is the
largest model affordable. Thus, the simple calculation gives a threshold for rotation speed
which is 506.25 rpm. The equations (Budynas and Nisbett, 2011, p.415) show when the angle
of friction is greater than the lead angle ( ), back-drive may happen.
2 2
(9)
2 2
(10)
where
T = torque
F = load on the screw
= mean diameter
= coefficient of friction
l = lead
= angle of friction
= lead angle
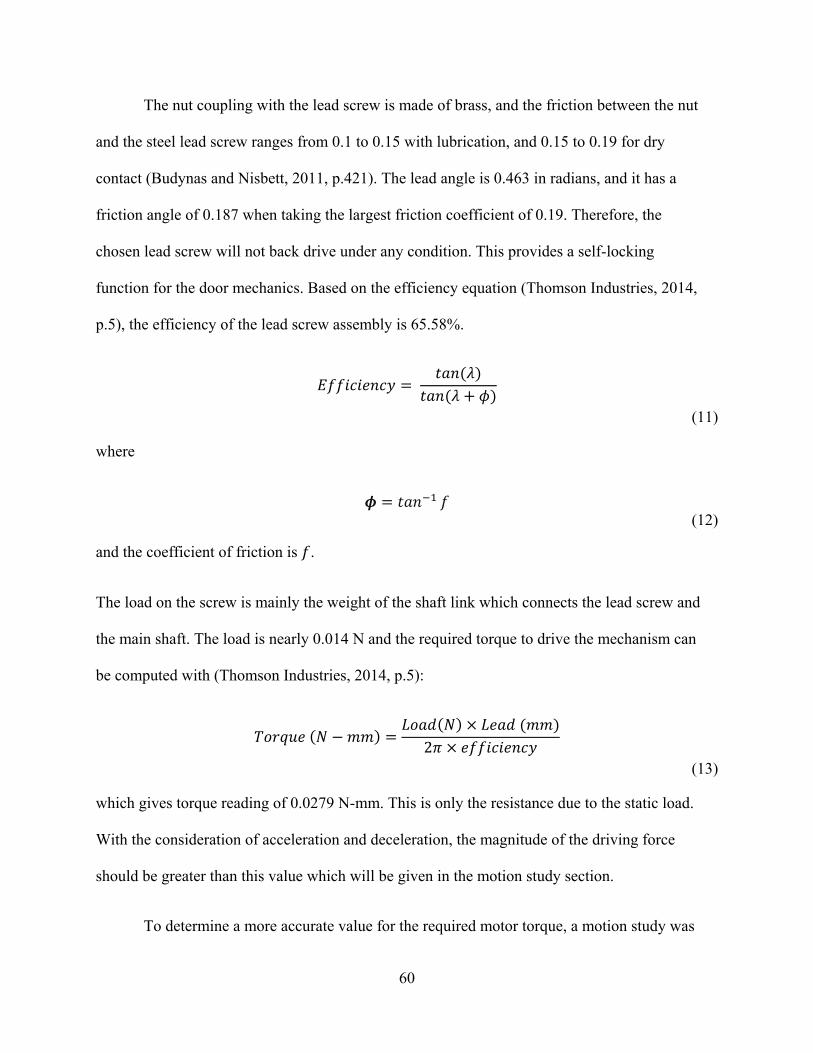
60
The nut coupling with the lead screw is made of brass, and the friction between the nut
and the steel lead screw ranges from 0.1 to 0.15 with lubrication, and 0.15 to 0.19 for dry
contact (Budynas and Nisbett, 2011, p.421). The lead angle is 0.463 in radians, and it has a
friction angle of 0.187 when taking the largest friction coefficient of 0.19. Therefore, the
chosen lead screw will not back drive under any condition. This provides a self-locking
function for the door mechanics. Based on the efficiency equation (Thomson Industries, 2014,
p.5), the efficiency of the lead screw assembly is 65.58%.
(11)
where
(12)
and the coefficient of friction is .
The load on the screw is mainly the weight of the shaft link which connects the lead screw and
the main shaft. The load is nearly 0.014 N and the required torque to drive the mechanism can
be computed with (Thomson Industries, 2014, p.5):
2(13)
which gives torque reading of 0.0279 N-mm. This is only the resistance due to the static load.
With the consideration of acceleration and deceleration, the magnitude of the driving force
should be greater than this value which will be given in the motion study section.
To determine a more accurate value for the required motor torque, a motion study was
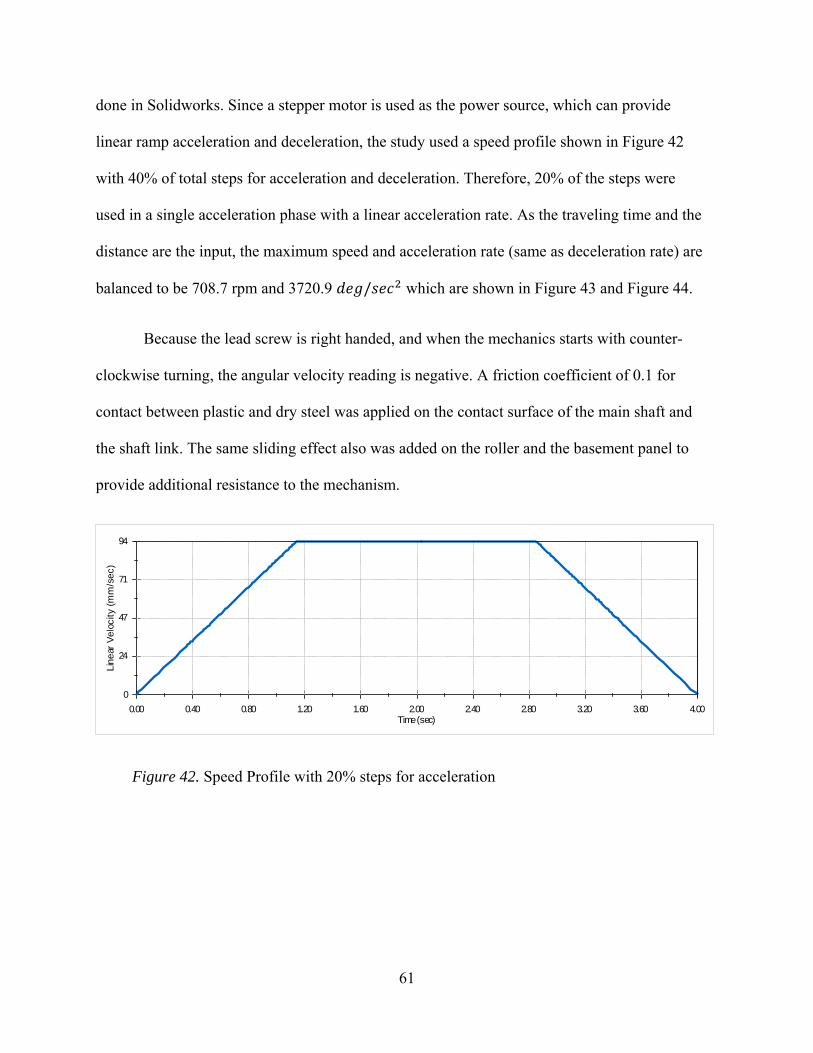
61
done in Solidworks. Since a stepper motor is used as the power source, which can provide
linear ramp acceleration and deceleration, the study used a speed profile shown in Figure 42
with 40% of total steps for acceleration and deceleration. Therefore, 20% of the steps were
used in a single acceleration phase with a linear acceleration rate. As the traveling time and the
distance are the input, the maximum speed and acceleration rate (same as deceleration rate) are
balanced to be 708.7 rpm and 3720.9 / which are shown in Figure 43 and Figure 44.
Because the lead screw is right handed, and when the mechanics starts with counter-
clockwise turning, the angular velocity reading is negative. A friction coefficient of 0.1 for
contact between plastic and dry steel was applied on the contact surface of the main shaft and
the shaft link. The same sliding effect also was added on the roller and the basement panel to
provide additional resistance to the mechanism.
Figure 42. Speed Profile with 20% steps for acceleration
0.00 0.40 0.80 1.20 1.60 2.00 2.40 2.80 3.20 3.60 4.00Time (sec)
0
24
47
71
94
Lin
ear
Ve
loc
ity
(mm
/se
c)
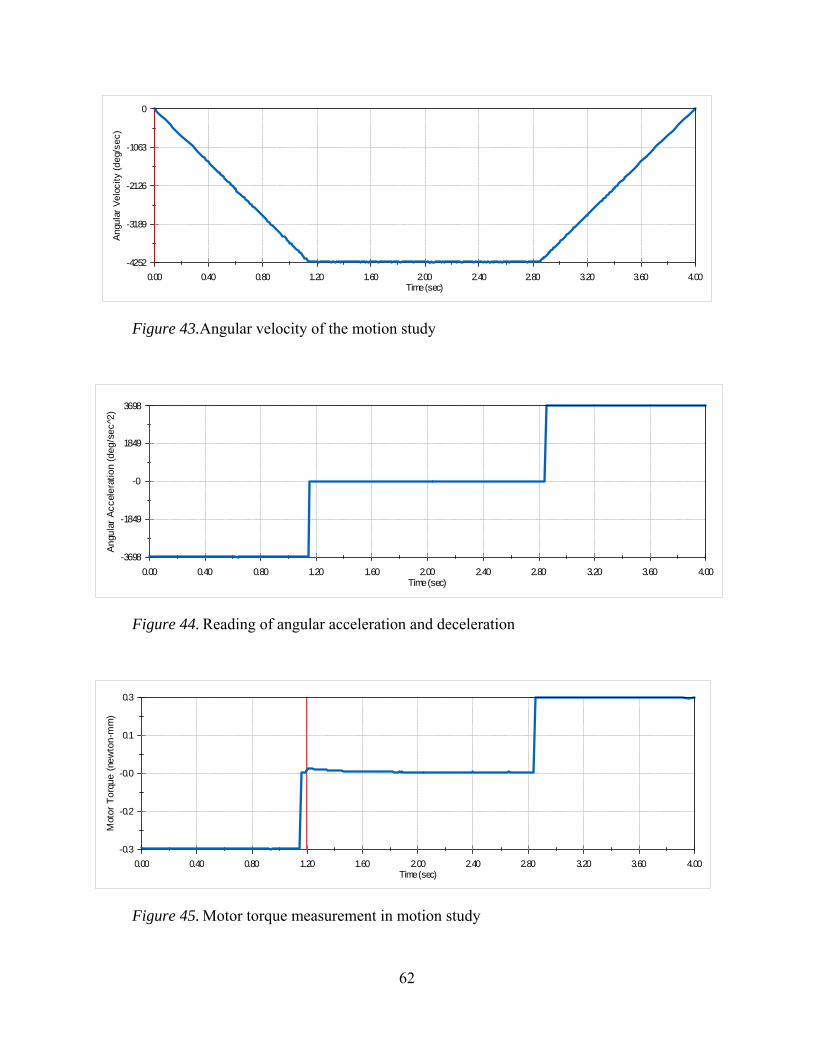
62
Figure 43.Angular velocity of the motion study
Figure 44. Reading of angular acceleration and deceleration
Figure 45. Motor torque measurement in motion study
0.00 0.40 0.80 1.20 1.60 2.00 2.40 2.80 3.20 3.60 4.00Time (sec)
-4252
-3189
-2126
-1063
0A
ngul
ar V
elo
city
(de
g/se
c)
0.00 0.40 0.80 1.20 1.60 2.00 2.40 2.80 3.20 3.60 4.00Time (sec)
-3698
-1849
-0
1849
3698
An
gula
r A
cc
ele
rati
on
(de
g/s
ec
^2)
0.00 0.40 0.80 1.20 1.60 2.00 2.40 2.80 3.20 3.60 4.00Time (sec)
-0.3
-0.2
-0.0
0.1
0.3
Mot
or
To
rqu
e (
new
ton
-mm
)
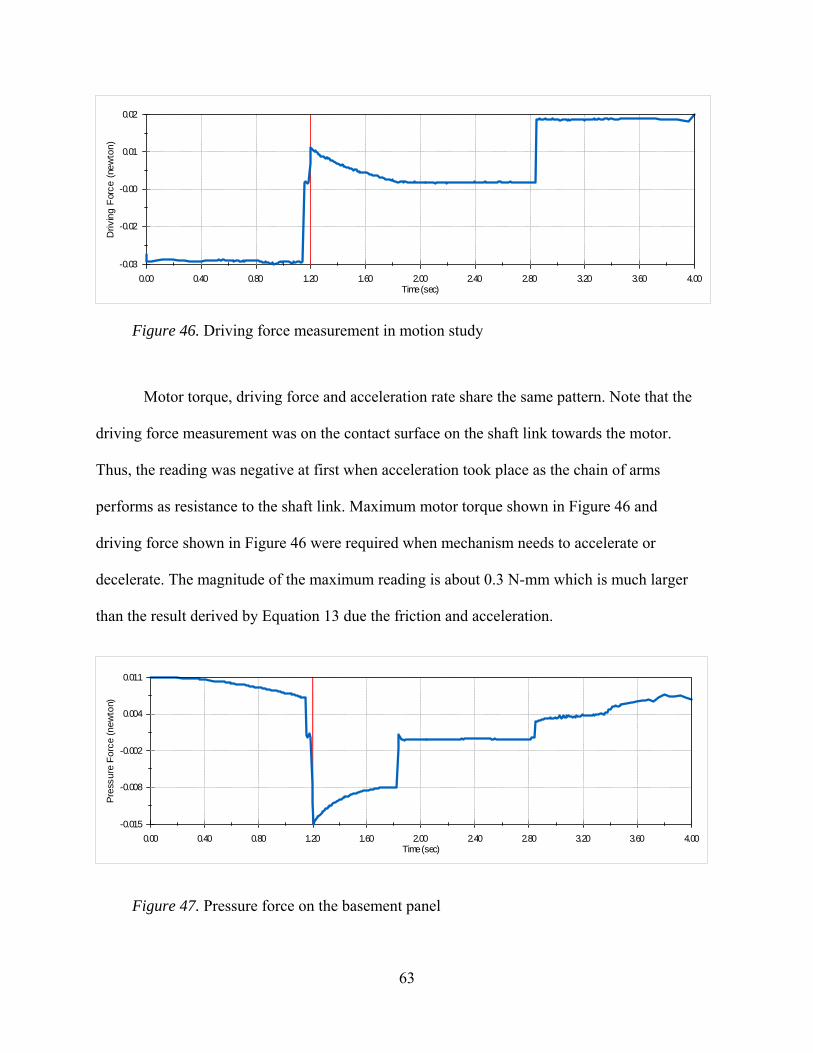
63
Figure 46. Driving force measurement in motion study
Motor torque, driving force and acceleration rate share the same pattern. Note that the
driving force measurement was on the contact surface on the shaft link towards the motor.
Thus, the reading was negative at first when acceleration took place as the chain of arms
performs as resistance to the shaft link. Maximum motor torque shown in Figure 46 and
driving force shown in Figure 46 were required when mechanism needs to accelerate or
decelerate. The magnitude of the maximum reading is about 0.3 N-mm which is much larger
than the result derived by Equation 13 due the friction and acceleration.
Figure 47. Pressure force on the basement panel
0.00 0.40 0.80 1.20 1.60 2.00 2.40 2.80 3.20 3.60 4.00Time (sec)
-0.03
-0.02
-0.00
0.01
0.02D
rivi
ng
For
ce
(ne
wto
n)
0.00 0.40 0.80 1.20 1.60 2.00 2.40 2.80 3.20 3.60 4.00Time (sec)
-0.015
-0.008
-0.002
0.004
0.011
Pre
ssur
e F
orce
(n
ewto
n)
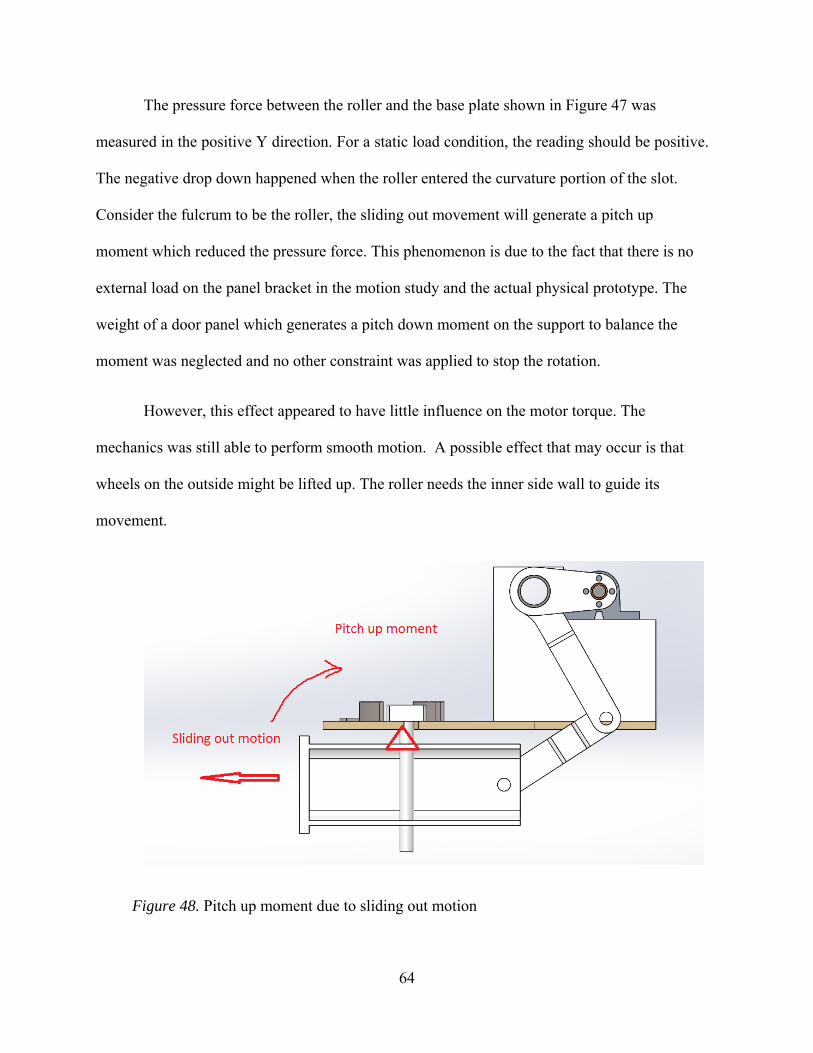
64
The pressure force between the roller and the base plate shown in Figure 47 was
measured in the positive Y direction. For a static load condition, the reading should be positive.
The negative drop down happened when the roller entered the curvature portion of the slot.
Consider the fulcrum to be the roller, the sliding out movement will generate a pitch up
moment which reduced the pressure force. This phenomenon is due to the fact that there is no
external load on the panel bracket in the motion study and the actual physical prototype. The
weight of a door panel which generates a pitch down moment on the support to balance the
moment was neglected and no other constraint was applied to stop the rotation.
However, this effect appeared to have little influence on the motor torque. The
mechanics was still able to perform smooth motion. A possible effect that may occur is that
wheels on the outside might be lifted up. The roller needs the inner side wall to guide its
movement.
Figure 48. Pitch up moment due to sliding out motion
65
3.3.2 Controller and Hardware Used in the Prototype
The Arduino Mega 2560 was selected to be the main microcontroller for the system.
Sensors include one ultrasonic sensor and three limit switches. All the sensors are connected to
the Mega controller. All the current status, measurements and timing counting can be
monitored real time in the serial monitor on the computer.
The full scale model is designed to be tested with the condition push back the door
leafs manually when the motor is still powered. For open loop stepper motor control, this kind
of action can cause miss counting steps if the pulse signal is not cut off immediately. Although
the scale down demo prototype will not be tested in such scenario, a corresponding solution is
still needed to be included in logic control design. To solve the possible drift of position
prediction in this kind of situation, two of the limit switches are installed on each end of the
main shaft. For the case, the microcontroller miscounts the steps, the two limit switches will
give the reference for calibration of traveling limitation.
One yellow LED flashes when the motor coils is on to indicate the mechanism is in
motion and the red LED will flash when the system start waiting for the human operator in
manual override mode. Since controlling the blinking yellow LED requires one more thread,
another Arduino UNO board is used for additional LED control function while meantime the
Mega board can be focus on sending out motor control signal without any other interrupts. Call
for interrupts in Arduino’s integrated development environment (IDE) is very expensive in
computation as it stops timing counting and blocks the external serial communication which
usually causes a loss of serial data. In the case of this project, calling interrupts is not a
favorable coding fashion rather than running two parallel threads as the serial monitor in the
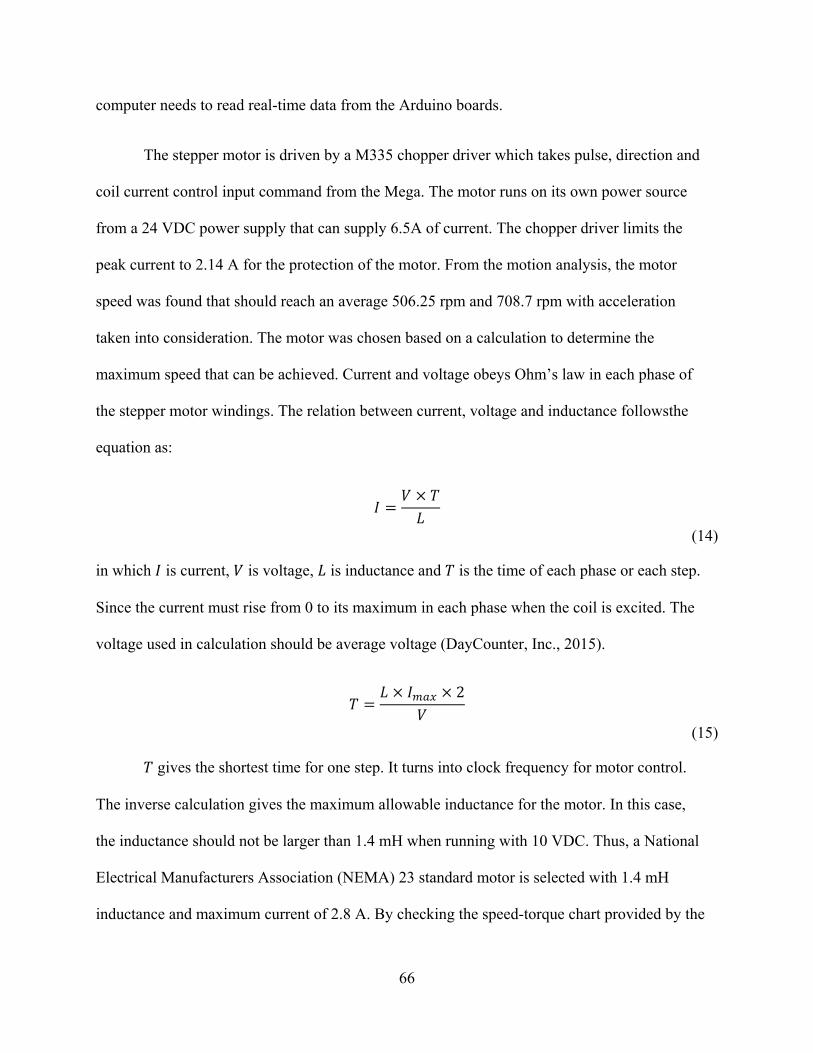
66
computer needs to read real-time data from the Arduino boards.
The stepper motor is driven by a M335 chopper driver which takes pulse, direction and
coil current control input command from the Mega. The motor runs on its own power source
from a 24 VDC power supply that can supply 6.5A of current. The chopper driver limits the
peak current to 2.14 A for the protection of the motor. From the motion analysis, the motor
speed was found that should reach an average 506.25 rpm and 708.7 rpm with acceleration
taken into consideration. The motor was chosen based on a calculation to determine the
maximum speed that can be achieved. Current and voltage obeys Ohm’s law in each phase of
the stepper motor windings. The relation between current, voltage and inductance followsthe
equation as:
(14)
in which is current, is voltage, is inductance and is the time of each phase or each step.
Since the current must rise from 0 to its maximum in each phase when the coil is excited. The
voltage used in calculation should be average voltage (DayCounter, Inc., 2015).
2
(15)
gives the shortest time for one step. It turns into clock frequency for motor control.
The inverse calculation gives the maximum allowable inductance for the motor. In this case,
the inductance should not be larger than 1.4 mH when running with 10 VDC. Thus, a National
Electrical Manufacturers Association (NEMA) 23 standard motor is selected with 1.4 mH
inductance and maximum current of 2.8 A. By checking the speed-torque chart provided by the
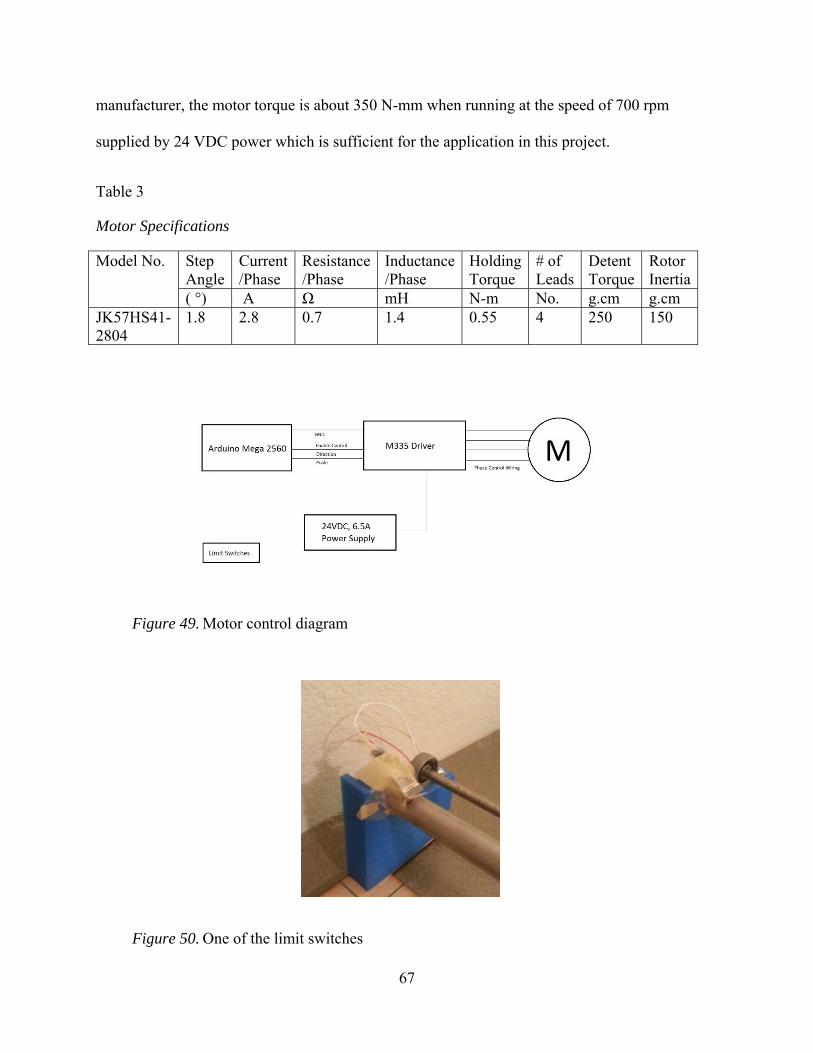
67
manufacturer, the motor torque is about 350 N-mm when running at the speed of 700 rpm
supplied by 24 VDC power which is sufficient for the application in this project.
Table 3
Motor Specifications
Model No. Step Angle
Current /Phase
Resistance/Phase
Inductance/Phase
Holding Torque
# of Leads
Detent Torque
Rotor Inertia
( °) A Ω mH N-m No. g.cm g.cmJK57HS41-2804
1.8 2.8 0.7 1.4 0.55 4 250 150
Figure 49. Motor control diagram
Figure 50. One of the limit switches
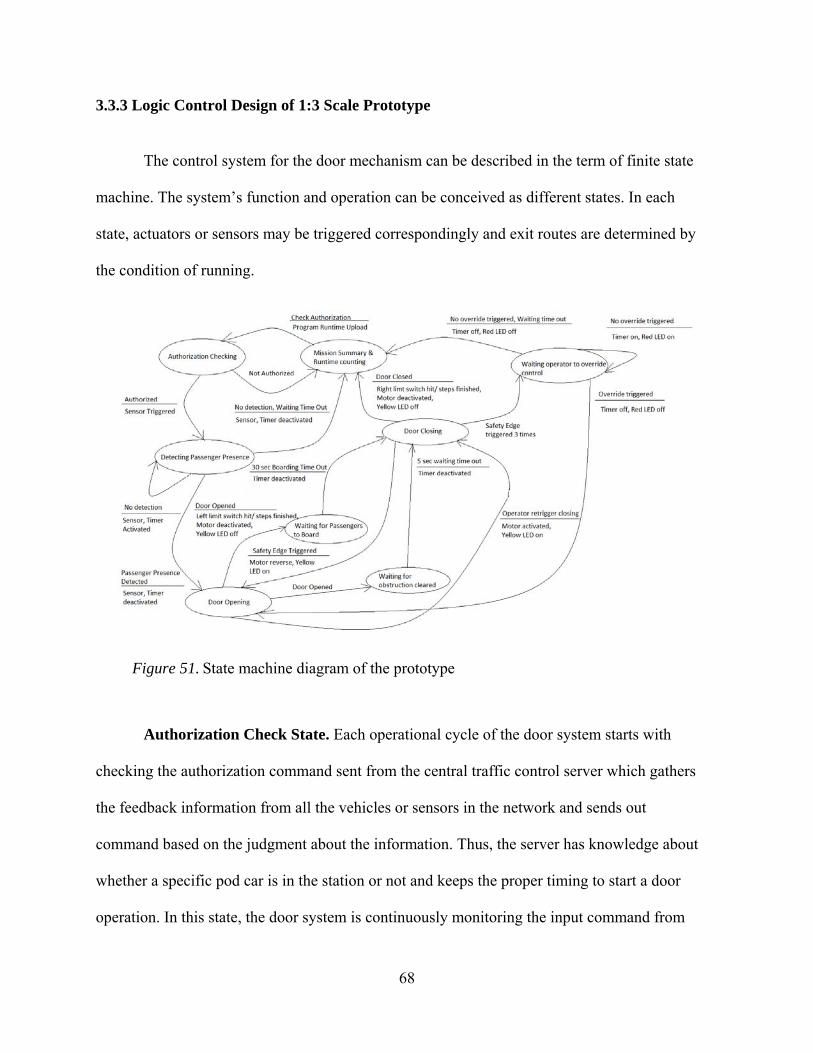
68
3.3.3 Logic Control Design of 1:3 Scale Prototype
The control system for the door mechanism can be described in the term of finite state
machine. The system’s function and operation can be conceived as different states. In each
state, actuators or sensors may be triggered correspondingly and exit routes are determined by
the condition of running.
Figure 51. State machine diagram of the prototype
Authorization Check State. Each operational cycle of the door system starts with
checking the authorization command sent from the central traffic control server which gathers
the feedback information from all the vehicles or sensors in the network and sends out
command based on the judgment about the information. Thus, the server has knowledge about
whether a specific pod car is in the station or not and keeps the proper timing to start a door
operation. In this state, the door system is continuously monitoring the input command from
69
the server. For example, the door system should be in lockdown status when the vehicle is
moving along the guideway, the door system will only start the door operation when the
vehicle stops at the right berth of the station at an allowable time.
In the prototype model, the authorization command is given by manually through a
serial communication from the computer linked with the Arduino Mega controller, because the
real traffic control server is not available yet for the Spartan Superway Project.
Distance Sensing State. Once the controller has received authorization to start the door
operation, the ultrasonic sensor is triggered to sense whether there is any passenger in the
waiting area. The output acoustic signal has a pulse repetition frequency (PRF) of 2
milliseconds with a pulse width of 15 microseconds. As the actual frequency output is 4 times
less than the input, this give a maximum detection range about 3 meters.
MaxRangec
2PRF
(16)
where c is the speed of sound and is assumed to be 340.29 m/s.
If the presence of passengers is not detected at first, the system will keep sensing while
counting the waiting time. Once five minutes has elapsed, and no passenger presence triggers
the door operation, the system will feedback the information to the server, and the vehicle will
be dispatched to another transit request. In the prototyping phase, this information is sent to the
computer which monitors the program processing via serial port. This approach is for
maximum efficiency of the network, and design logic can be changed in the future for better
user experience.
70
Door Opening State. This state is the start point of the door operation if the door
operation is triggered by ultrasonic sensor. The door opening state has three entry routes. Each
time a new door operation starts, the door mechanism moves from the close position to the
open position. The limit switch at the open position will be triggered to help stop the door
when the open position is reached. The yellow LED will start flashing to indicate that the
motor is in operation. This blinking function will be triggered anytime when the motor is
excited when the door is opening or closing. The exit route for the normal operation is the next
state which the door system is ordered to wait a period of time to load and unload passengers
and then the door will close.
There are two other conditions for which the door will re-open. The first is in case the
safety edge is triggered. Normally, the door system will operating automatically if the safety
edge has not been triggered more than three times, or else it will enter an auxiliary state after
the door is opened again. For the scenario where the door is reopened for three times or more,
the manual mode will be activated to let the human operator to judge whether the blockage is
intended or accidental. The following state after the transition is door closing state and the
human operator will control the timing to re-close the door.
Boarding State & Auxiliary State. The boarding state will only be triggered once
after the system finishes opening the door. Then, the system will wait for 30 seconds for
passengers to get off and onboard the vehicle during this period of time.
The system will enter an auxiliary state after the safety edge is triggered, and the door
is re-opened. Once the safety edge detects the hand crush hazard, the door mechanism will
move back to the open position and wait for five seconds to let the obstruction be cleared
71
before the door can be re-closed. During these two states, all limit switches are inactivated to
prevent mis-triggering the door. All coils of the stepper motor will be switched off for safety
reasons.
Door Closing State. Two limit switches will be triggered in this state, the safety edge
and the limit switch at the closed position. Corresponding to the three door operation modes,
the door closing state has three different exit routes. In the normal operation mode, the door
will be closed without any interruption from the safety edge and the operation will transit into
mission summary state. Once the safety edge is triggered, the microcontroller will stop the
motor immediately and start reversing the mechanism to open position. An auxiliary state
variable will be marked and the system will operate into auxiliary mode once this mark is
recognized. As mentioned earlier, the system will reopen the door, take a 5 second waiting and
re-close the door if there is no obstruction blocking the door way. While in auxiliary mode, the
system also keep counting the total times the safety edge has been triggered. For the case the
safety edge has been triggered three times which is very rare, the system will enter the manual
override state after the safety edge triggered for the third time.
Manual Override State and Mission Summary State. These two states are simple
states in which the system determines the operation status and sends out necessary global level
information to the server (in the prototype scope, the computer). The manual override state has
two exit routes. When the system enters this state for the first time, the system will send out a
signal to the server to indicate that the manual override mode is activated and will wait for five
minutes for the human operator to come and press the button to stop the wait counter. During
this period of time, the red LED will blink as an indication that it is in this state. If the waiting
time expires, and no human operator shows onsite, the system will exit the door operation with
72
the door in the open positon. The signal will be sent out to the server to remind it of the status.
Then, the system will summarize parameters like the system running time, door operation time
in the mission summary state and feedback these information to the server.
For the case that a human operator arrives and successfully turn off the timer for
waiting him to be onsite by pressing the “manual override” button, the system will give the
door closing control to the operator. The operator will need to press another button to re-trigger
the closing motion after he or she makes sure there is no obstruction in the doorway. The
reason that two buttons are needed to retrigger reclosing is to prevent the operator miss triggers
the closing without carefully checking whether the doorway is clear or not. Thus, the door
system will enter the mission summary state if the door is closed successfully.
3.3.4 Motor Test and Input Guidance
The stepper motor is one of the core components of the prototype. The test run of the
motor before full integration of mechanism, electronics and software is critical motor control
design. The test contributes a guideline for input setting against actual motion performance.
The stepper motor is controlled by step counting. Pulse-width modulation (PWM) is a
common modulation technique used for generating the step signal. By changing the duty cycle,
the pulse width is modulated to a proper value and the average voltage is tuned to the value
calculated by Equation
(15. Recall the case running a speed profile to finish one opening or closing motion within 4
seconds, the maximum speed in this profile requires a signal of 2362.5 steps per second which

73
is 2362.5 Hz for the term of pulse signal. The average voltage needed is 10.54 V which gives
44.1% duty cycle when supplied by a 24 VDC power supply.
Figure 52. Diagram of duty cycle concept
However, constant pulse width is only useful in sending pulse for constant speed
running. For acceleration application, the timer interval needs dynamically changing as long
pulse is usually needed for the first step to start the motor from 0 speed and timer delay keeps
shortening while the speed at the current time is increasing. Deceleration is the same story as
acceleration as the process is inversed (Quinones, 2012, p.25). The timer interval is generated
as
SPS_timer_registertimer_oscillator
SPS(17)
where SPS is steps per second or the speed of the motor, the register is a 16-bit integer given to
the timer to generate pulses with corresponding timer interval. For example, 4000 steps per
second or 4000 Hz pulse signal gives the motor 1200 rpm. The oscillator on Atmega 2560
processor has a clock speed of 16 MHz. Thus, the register should be 4000 or one pulse will be
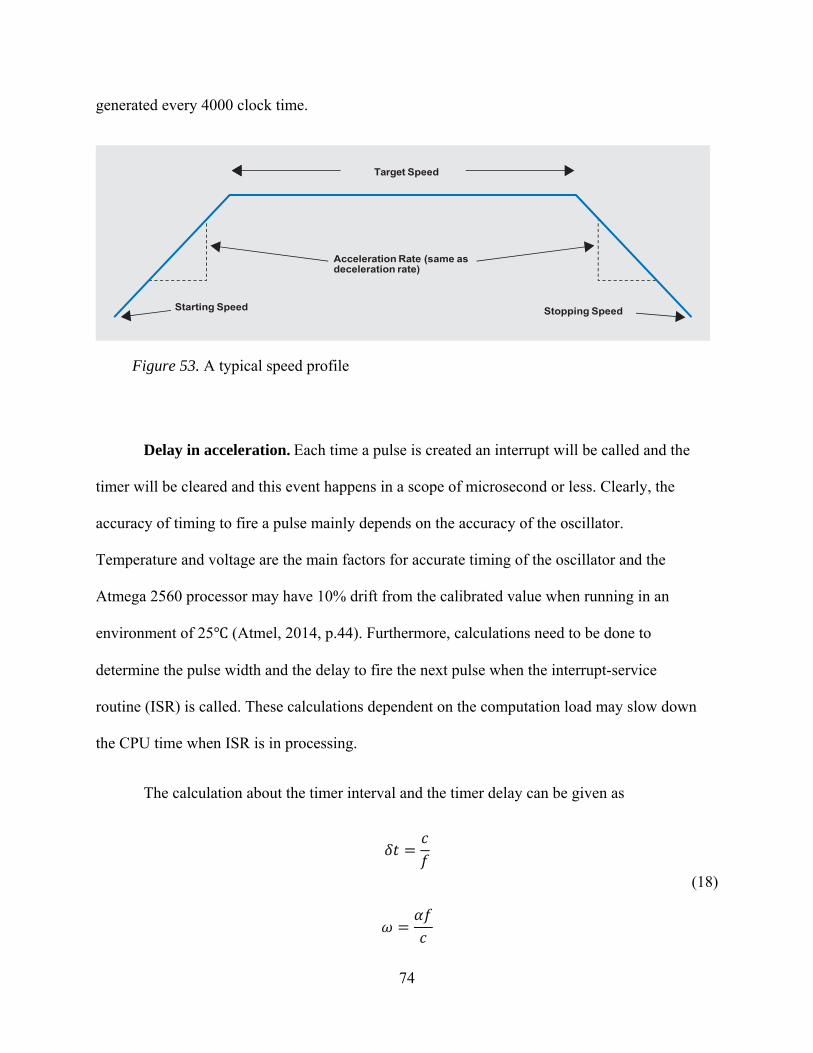
74
generated every 4000 clock time.
Figure 53. A typical speed profile
Delay in acceleration.Each time a pulse is created an interrupt will be called and the
timer will be cleared and this event happens in a scope of microsecond or less. Clearly, the
accuracy of timing to fire a pulse mainly depends on the accuracy of the oscillator.
Temperature and voltage are the main factors for accurate timing of the oscillator and the
Atmega 2560 processor may have 10% drift from the calibrated value when running in an
environment of 25 (Atmel, 2014, p.44). Furthermore, calculations need to be done to
determine the pulse width and the delay to fire the next pulse when the interrupt-service
routine (ISR) is called. These calculations dependent on the computation load may slow down
the CPU time when ISR is in processing.
The calculation about the timer interval and the timer delay can be given as
(18)

75
(19)
where is the timer count, is the timer frequency and gives the delay to fire next step.
The angular velocity and step angle are in radian (Austin, 2004, p.1). The acceleration between
two adjacent timers can be written as
2
(20)
while the linear ramp acceleration against time can be described as integration as follow,
2
(21)
Thus, the time to fire step should be:
t2
(22)
And the delay can be written as
(23)
Since the intial the initial count is given as
2
(24)
the count at any specific step is calculated as
c √ 1 √ (25)
To summarize, the successive ratio for timer count is:
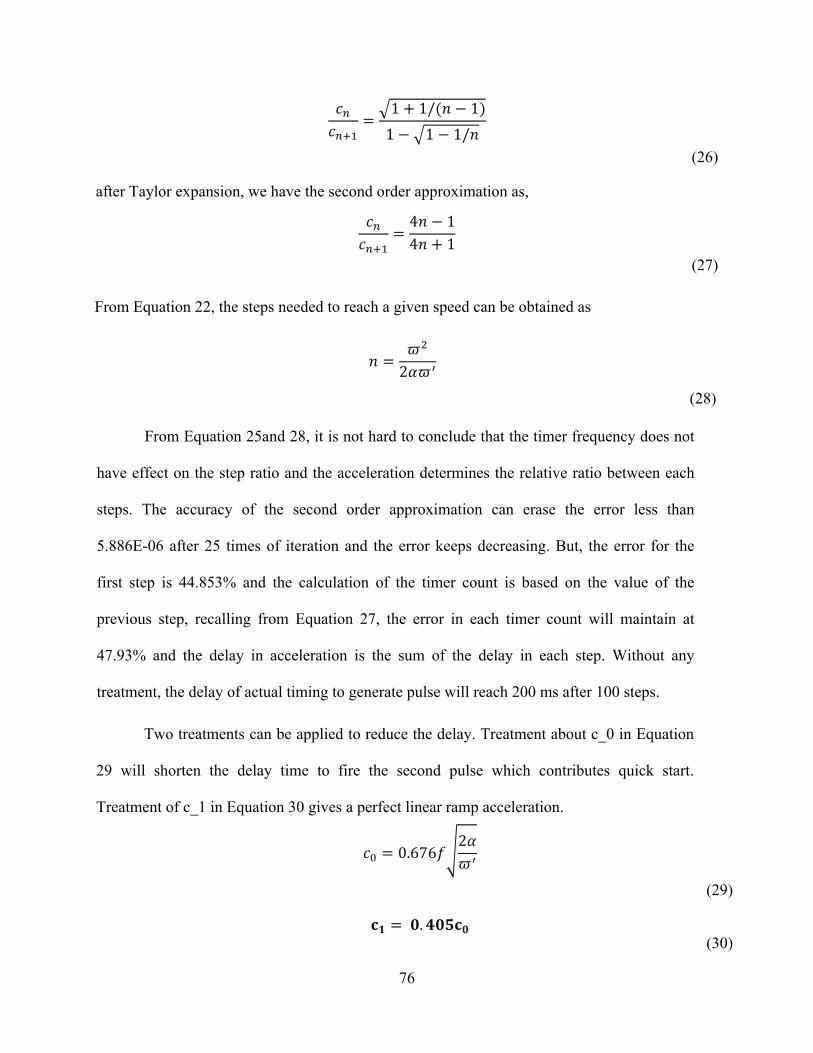
76
1 1/ 1
1 1 1/(26)
after Taylor expansion, we have the second order approximation as,
4 14 1
(27)
From Equation 22, the steps needed to reach a given speed can be obtained as
2
(28)
From Equation 25and 28, it is not hard to conclude that the timer frequency does not
have effect on the step ratio and the acceleration determines the relative ratio between each
steps. The accuracy of the second order approximation can erase the error less than
5.886E-06 after 25 times of iteration and the error keeps decreasing. But, the error for the
first step is 44.853% and the calculation of the timer count is based on the value of the
previous step, recalling from Equation 27, the error in each timer count will maintain at
47.93% and the delay in acceleration is the sum of the delay in each step. Without any
treatment, the delay of actual timing to generate pulse will reach 200 ms after 100 steps.
Two treatments can be applied to reduce the delay. Treatment about c_0 in Equation
29 will shorten the delay time to fire the second pulse which contributes quick start.
Treatment of c_1 in Equation 30 gives a perfect linear ramp acceleration.
0.6762
(29)
. (30)
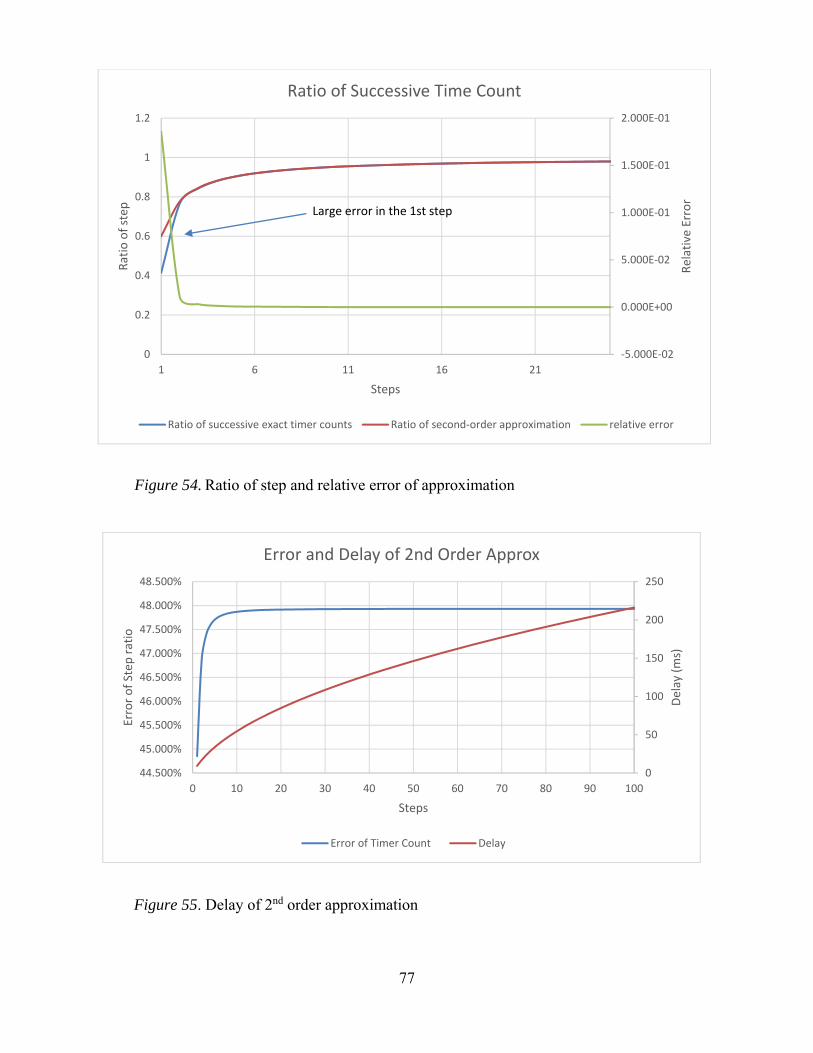
77
Figure 54. Ratio of step and relative error of approximation
‐5.000E‐02
0.000E+00
5.000E‐02
1.000E‐01
1.500E‐01
2.000E‐01
0
0.2
0.4
0.6
0.8
1
1.2
1 6 11 16 21
Relative Error
Ratio of step
Steps
Ratio of Successive Time Count
Ratio of successive exact timer counts Ratio of second‐order approximation relative error
Large error in the 1st step
Figure 55. Delay of 2nd order approximation
0
50
100
150
200
250
44.500%
45.000%
45.500%
46.000%
46.500%
47.000%
47.500%
48.000%
48.500%
0 01 20 03 04 50 60 07 08 90 100
Delay (ms)
Error of Step
ratio
Error and Delay of 2nd Order Approx
Steps
Error of Timer Count Delay
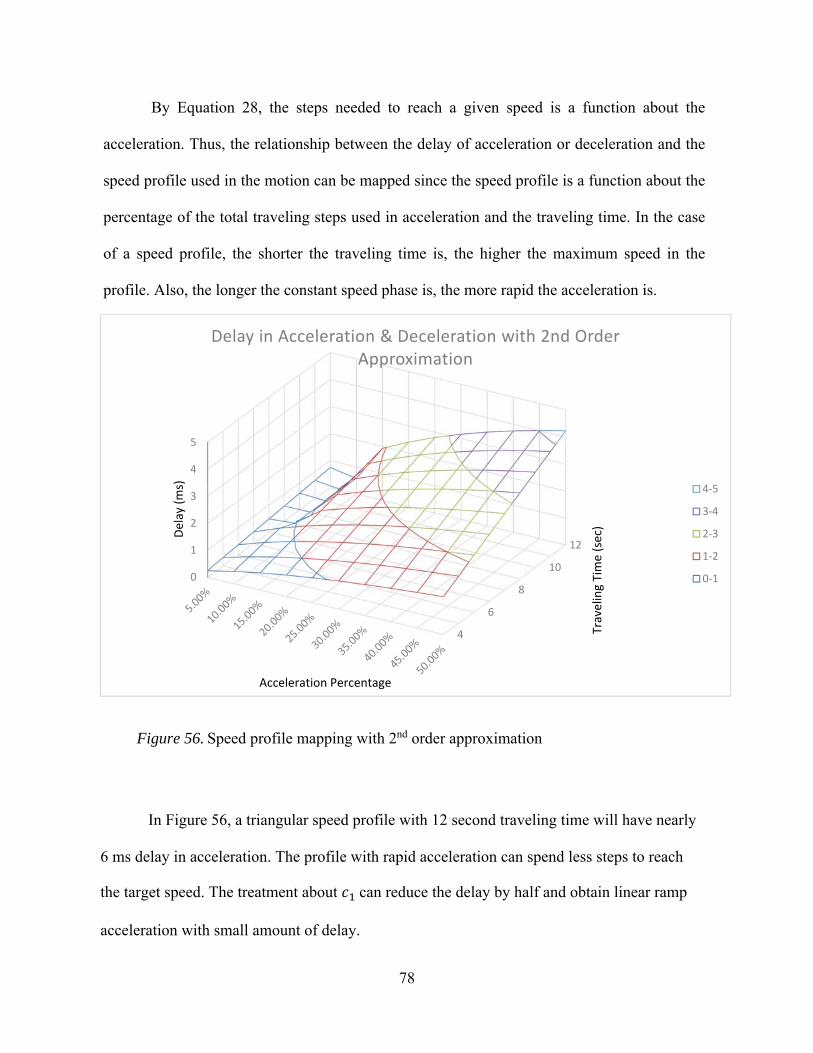
78
Figure 56. Speed profile mapping with 2nd order approximation
In Figure 56, a triangular speed profile with 12 second traveling time will have nearly
6 ms delay in acceleration. The profile with rapid acceleration can spend less steps to reach
the target speed. The treatment about can reduce the delay by half and obtain linear ramp
acceleration with small amount of delay.
4
6
8
10
12
0
1
2
3
4
5
Traveling Time (sec)
Delay (ms)
Acceleration Percentage
Delay in Acceleration & Deceleration with 2nd Order Approximation
4‐5
3‐4
2‐3
1‐2
0‐1
By Equation 28, the steps needed to reach a given speed is a function about the
acceleration. Thus, the relationship between the delay of acceleration or deceleration and the
speed profile used in the motion can be mapped since the speed profile is a function about the
percentage of the total traveling steps used in acceleration and the traveling time. In the case
of a speed profile, the shorter the traveling time is, the higher the maximum speed in the
profile. Also, the longer the constant speed phase is, the more rapid the acceleration is.
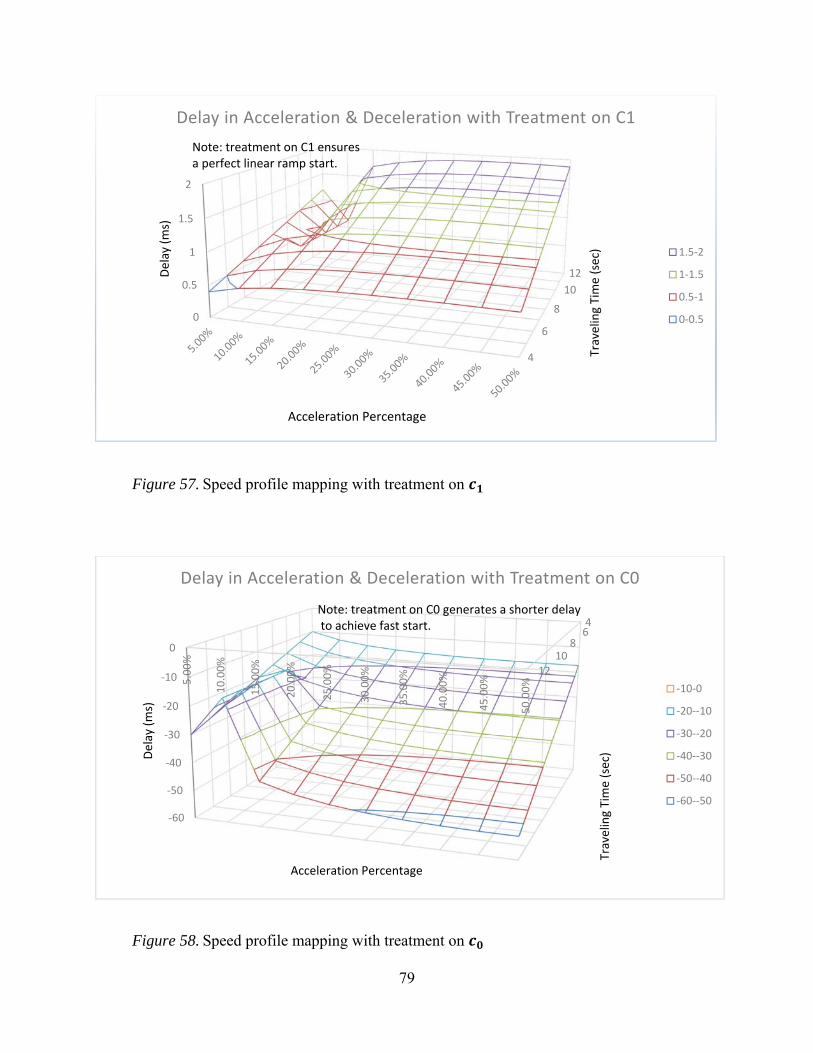
79
Figure 57. Speed profile mapping with treatment on
Figure 58. Speed profile mapping with treatment on
4
6
8
10
12
0
0.5
1
1.5
2
Traveling Time (sec)
Delay (ms)
Acceleration Percentage
Delay in Acceleration & Deceleration with Treatment on C1
1.5‐2
1‐1.5
0.5‐1
0‐0.5
Note: treatment on C1 ensures a perfect linear ramp start.
46
810
12
‐60
‐50
‐40
‐30
‐20
‐10
0
5.00%
10.00%
15.00%
20.00%
25.00%
30.00%
35.00%
40.00%
45.00%
50.00%
Traveling Time (sec)Delay (ms)
Acceleration Percentage
Delay in Acceleration & Deceleration with Treatment on C0
‐10‐0
‐20‐‐10
‐30‐‐20
‐40‐‐30
‐50‐‐40
‐60‐‐50
Note: treatment on C0 generates a shorter delayto achieve fast start.
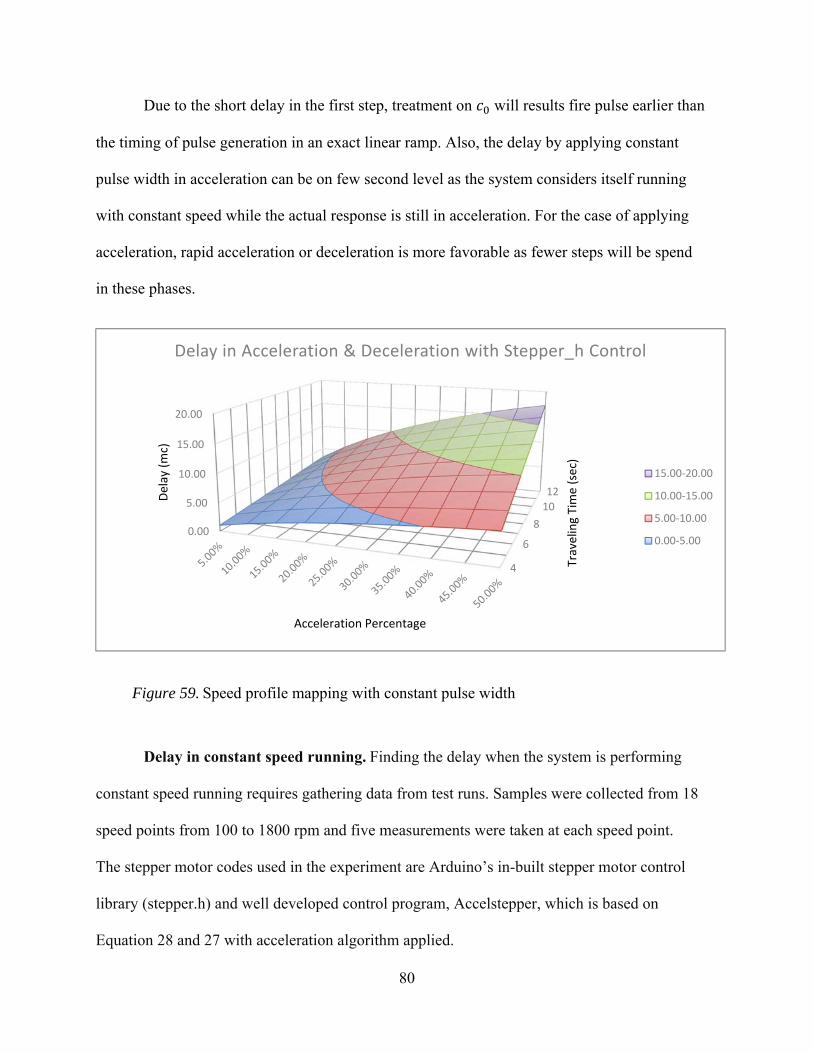
80
Due to the short delay in the first step, treatment on will results fire pulse earlier than
the timing of pulse generation in an exact linear ramp. Also, the delay by applying constant
pulse width in acceleration can be on few second level as the system considers itself running
with constant speed while the actual response is still in acceleration. For the case of applying
acceleration, rapid acceleration or deceleration is more favorable as fewer steps will be spend
in these phases.
Figure 59. Speed profile mapping with constant pulse width
Delay in constant speed running. Finding the delay when the system is performing
constant speed running requires gathering data from test runs. Samples were collected from 18
speed points from 100 to 1800 rpm and five measurements were taken at each speed point.
The stepper motor codes used in the experiment are Arduino’s in-built stepper motor control
library (stepper.h) and well developed control program, Accelstepper, which is based on
Equation 28 and 27 with acceleration algorithm applied.
4
6
8
10
12
0.00
5.00
10.00
15.00
20.00
Traveling Time (sec)
Delay (mc)
Acceleration Percentage
Delay in Acceleration & Deceleration with Stepper_h Control
15.00‐20.00
10.00‐15.00
5.00‐10.00
0.00‐5.00
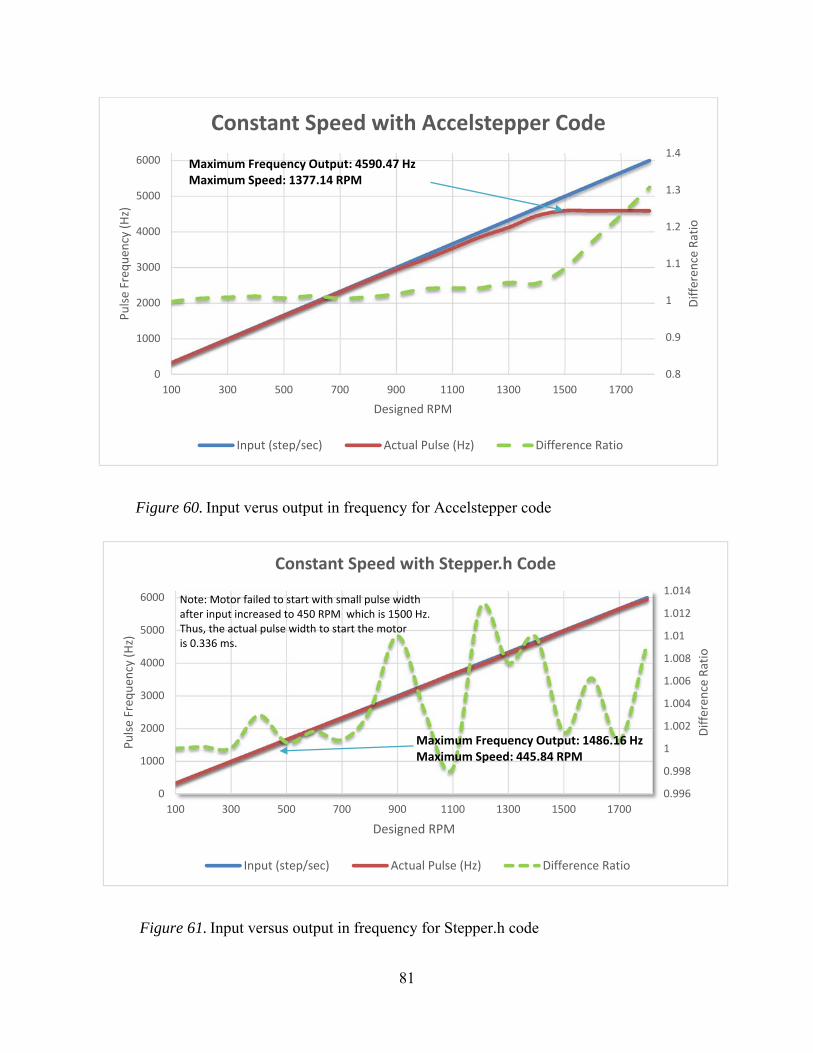
81
Figure 60. Input verus output in frequency for Accelstepper code
0.8
0.9
1
1.1
1.2
1.3
1.4
0
1000
2000
3000
4000
5000
6000
100 300 500 700 900 1100 1300 1500 1700
Difference Ratio
Pulse Freq
uen
cy (Hz)
Designed RPM
Constant Speed with Accelstepper Code
Input (step/sec) Actual Pulse (Hz) Difference Ratio
Maximum Frequency Output: 4590.47 HzMaximum Speed: 1377.14 RPM
Figure 61. Input versus output in frequency for Stepper.h code
0.996
0.998
1
1.002
1.004
1.006
1.008
1.01
1.012
1.014
0
1000
2000
3000
4000
5000
6000
100 300 500 700 900 1100 1300 1500 1700
Difference Ratio
Pulse Freq
uen
cy (Hz)
Designed RPM
Constant Speed with Stepper.h Code
Input (step/sec) Actual Pulse (Hz) Difference Ratio
Note: Motor failed to start with small pulse widthafter input increased to 450 RPM which is 1500 Hz. Thus, the actual pulse width to start the motor is 0.336 ms.
Maximum Frequency Output: 1486.16 HzMaximum Speed: 445.84 RPM

82
Both of the two codes cannot follow on the pace of the exact input. Accelstepper failed
to keep increasing the speed when input frequency went higher than 4600 Hz. This gives the
maximum output of 1148.67 Hz for the pulse signal which reflects an angular velocity of 344.6
rpm. The Arduino’s default control code followed the same pattern, but the maximum speed
could reach 445.8 rpm which is 1486.16 Hz for step signal. This difference can be explained
by the algorithm used by Accelstepper code keeps computing the steps to go and step ratio to
maintain when firing each step via using Equation 28 and 27. Recall Equation 17, when the
speed is reaching a certain high value, δt may not be enough to let the processor to do the
computation. A higher grade processor can solve this problem. As the speed as dynamically
changing in small amount when the motor was controlled by Accelstepper code, the deviation
of speed samples were fairly large. Unlike Accelstepper code, the in-built control code has a
better performance in maintaining the speed as the standard deviation of samples shown in
Figure 58.
Figure 62. Comparison of sample deviation
0
0.5
1
1.5
2
2.5
3
100 300 500 700 900 1100 1300 1500 1700
Stan
dard Deviation
Standard Deviation of Samples
Designed RPM
Accelstepper stepper.h
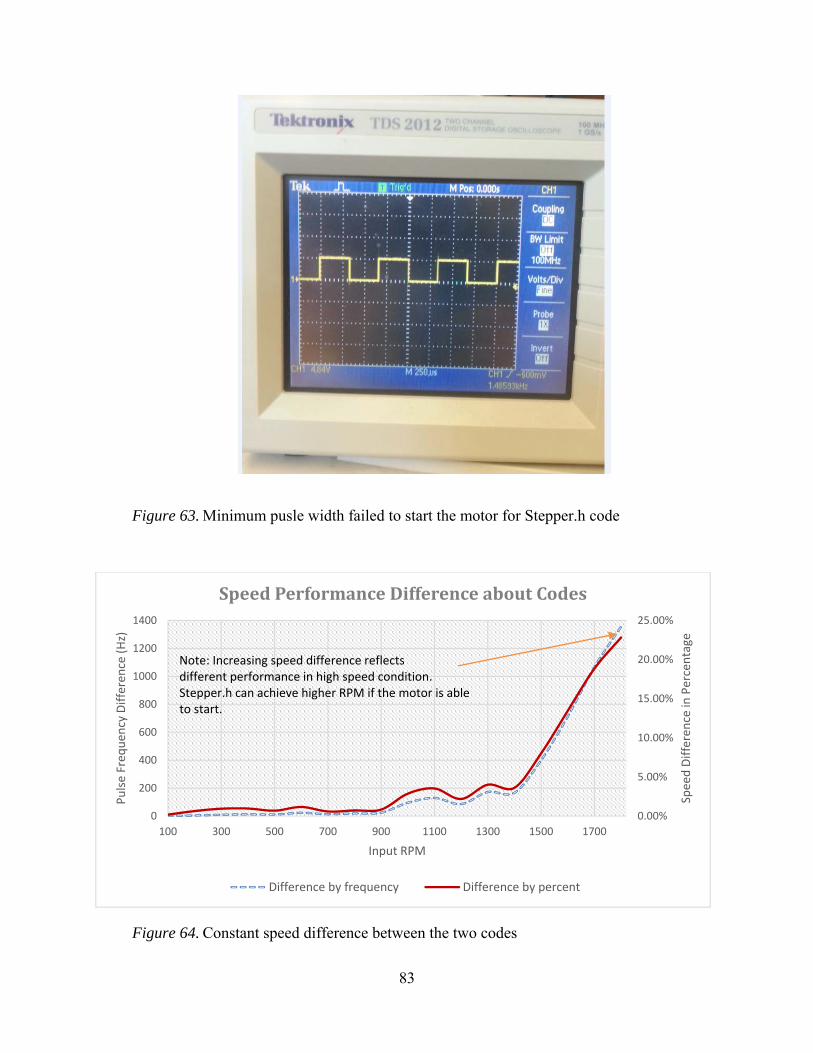
83
Figure 63. Minimum pusle width failed to start the motor for Stepper.h code
Figure 64. Constant speed difference between the two codes
0.00%
5.00%
10.00%
15.00%
20.00%
25.00%
0
200
400
600
800
1000
1200
1400
100 300 500 700 900 1100 1300 1500 1700
Speed Difference in Percentage
Pulse Freq
uen
cy Difference (Hz)
Input RPM
SpeedPerformanceDifferenceaboutCodes
Difference by frequency Difference by percent
Note: Increasing speed difference reflects different performance in high speed condition.Stepper.h can achieve higher RPM if the motor is ableto start.
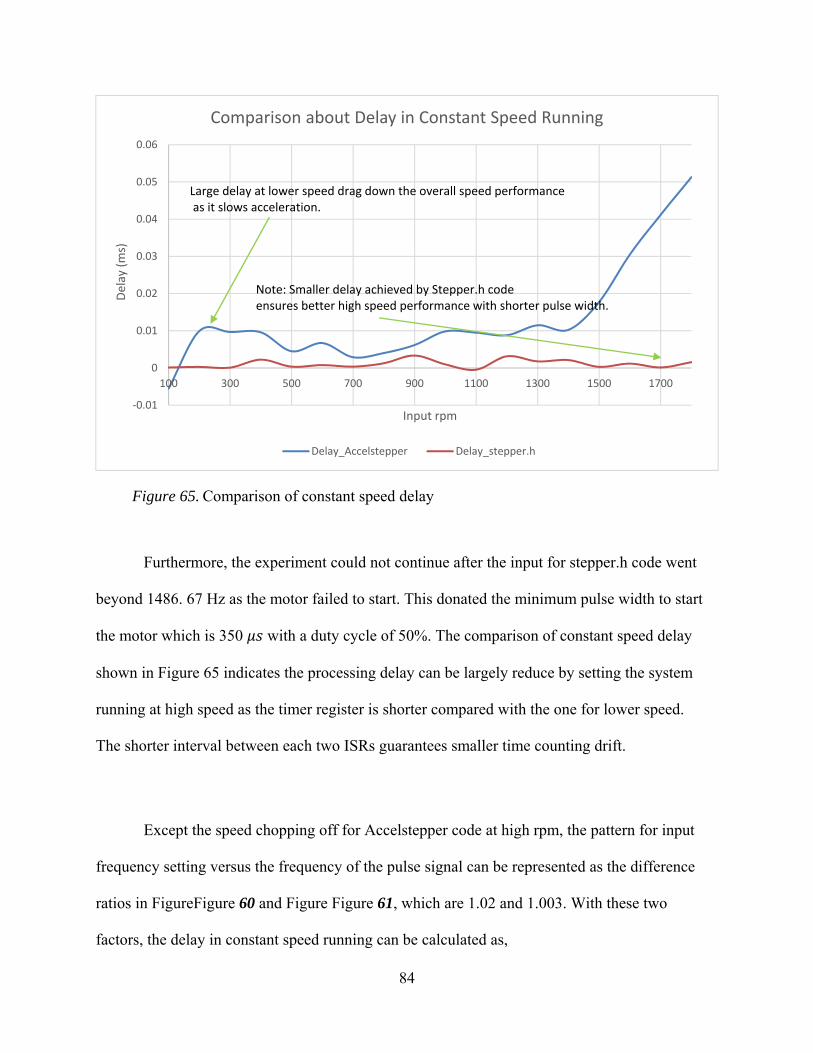
84
Figure 65. Comparison of constant speed delay
Furthermore, the experiment could not continue after the input for stepper.h code went
beyond 1486. 67 Hz as the motor failed to start. This donated the minimum pulse width to start
the motor which is 350 with a duty cycle of 50%. The comparison of constant speed delay
shown in Figure 65 indicates the processing delay can be largely reduce by setting the system
running at high speed as the timer register is shorter compared with the one for lower speed.
The shorter interval between each two ISRs guarantees smaller time counting drift.
Except the speed chopping off for Accelstepper code at high rpm, the pattern for input
frequency setting versus the frequency of the pulse signal can be represented as the difference
ratios in FigureFigure 60 and Figure Figure 61, which are 1.02 and 1.003. With these two
factors, the delay in constant speed running can be calculated as,
‐0.01
0
0.01
0.02
0.03
0.04
0.05
0.06
100 300 500 700 900 1100 1300 1500 1700
Delay (ms)
Input rpm
Comparison about Delay in Constant Speed Running
Delay_Accelstepper Delay_stepper.h
Note: Smaller delay achieved by Stepper.h code ensures better high speed performance with shorter pulse width.
Large delay at lower speed drag down the overall speed performanceas it slows acceleration.
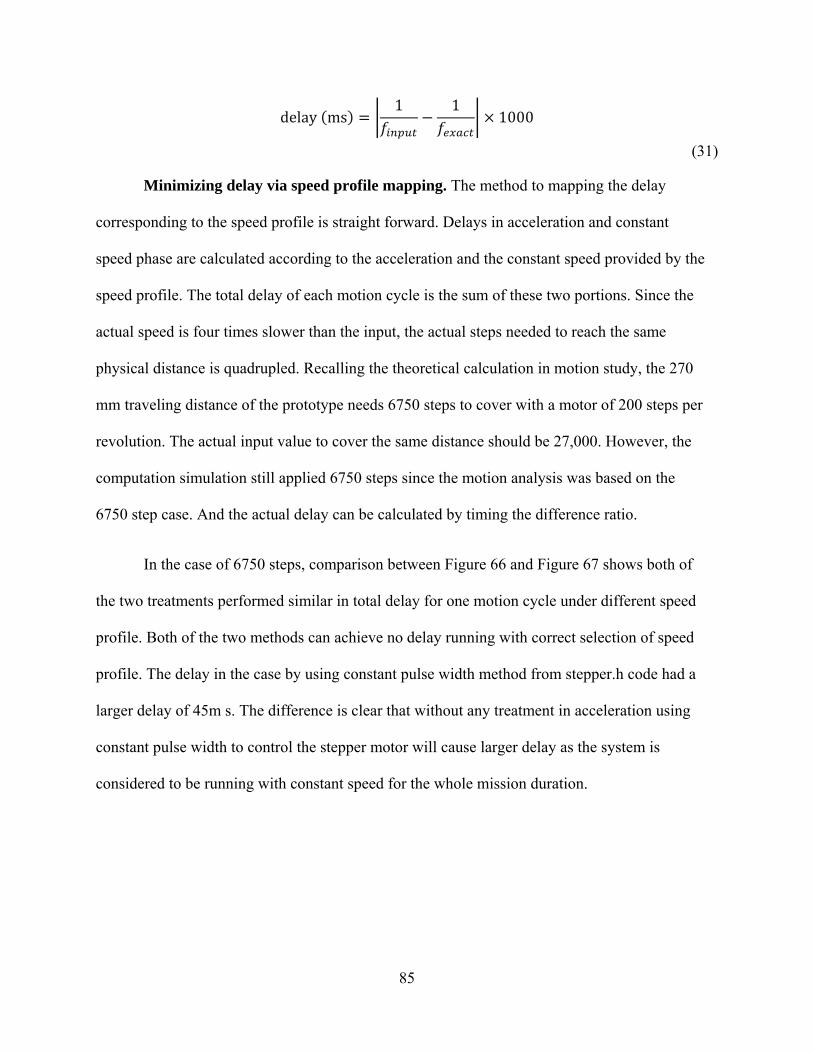
85
delay ms1 1
1000
(31)
Minimizing delay via speed profile mapping. The method to mapping the delay
corresponding to the speed profile is straight forward. Delays in acceleration and constant
speed phase are calculated according to the acceleration and the constant speed provided by the
speed profile. The total delay of each motion cycle is the sum of these two portions. Since the
actual speed is four times slower than the input, the actual steps needed to reach the same
physical distance is quadrupled. Recalling the theoretical calculation in motion study, the 270
mm traveling distance of the prototype needs 6750 steps to cover with a motor of 200 steps per
revolution. The actual input value to cover the same distance should be 27,000. However, the
computation simulation still applied 6750 steps since the motion analysis was based on the
6750 step case. And the actual delay can be calculated by timing the difference ratio.
In the case of 6750 steps, comparison between Figure 66 and Figure 67 shows both of
the two treatments performed similar in total delay for one motion cycle under different speed
profile. Both of the two methods can achieve no delay running with correct selection of speed
profile. The delay in the case by using constant pulse width method from stepper.h code had a
larger delay of 45m s. The difference is clear that without any treatment in acceleration using
constant pulse width to control the stepper motor will cause larger delay as the system is
considered to be running with constant speed for the whole mission duration.
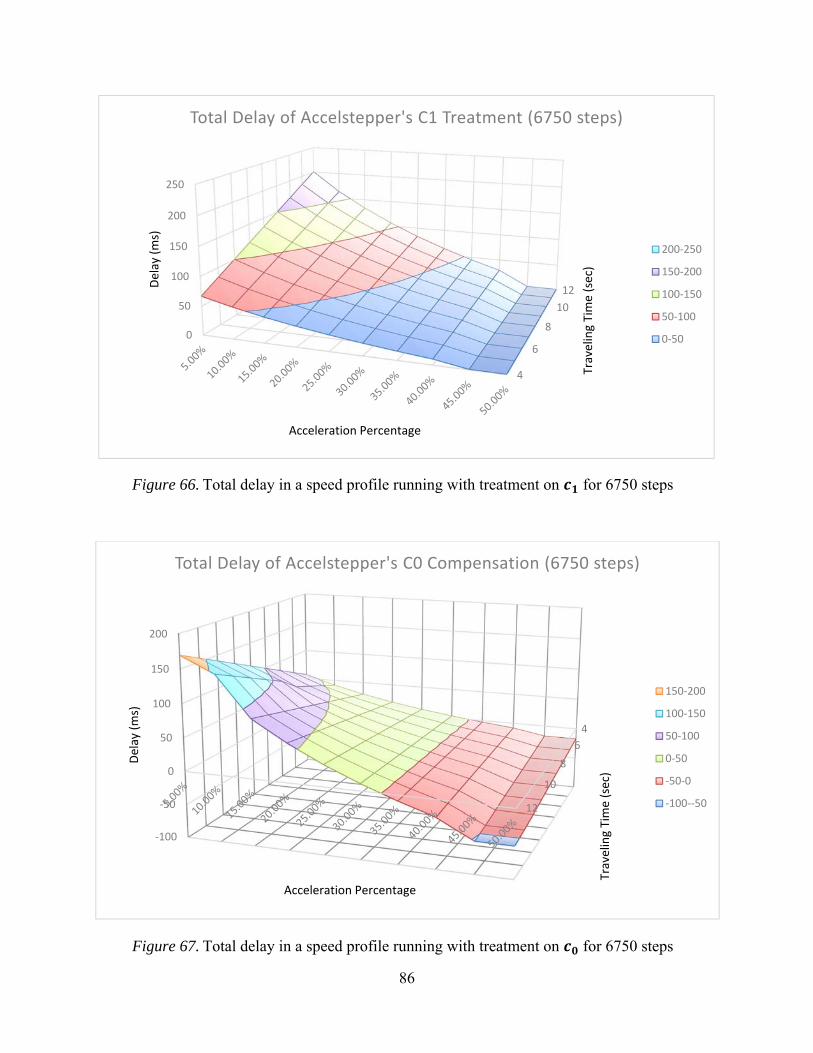
86
Figure 66. Total delay in a speed profile running with treatment on for 6750 steps
Figure 67. Total delay in a speed profile running with treatment on for 6750 steps
4
6
8
10
12
0
50
100
150
200
250
Traveling Time (sec)
Delay (ms)
Acceleration Percentage
Total Delay of Accelstepper's C1 Treatment (6750 steps)
200‐250
150‐200
100‐150
50‐100
0‐50
4
6
8
10
12
‐100
‐50
0
50
100
150
200
Traveling Time (sec)
Delay (ms)
Acceleration Percentage
Total Delay of Accelstepper's C0 Compensation (6750 steps)
150‐200
100‐150
50‐100
0‐50
‐50‐0
‐100‐‐50
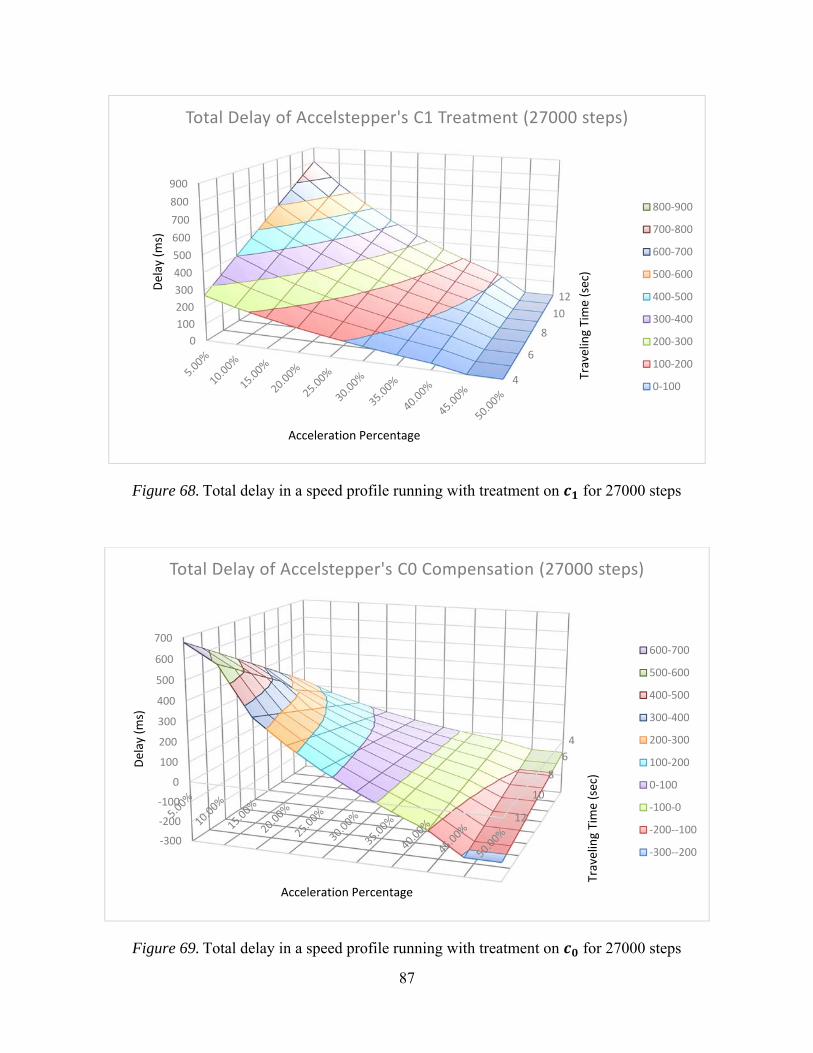
87
Figure 68. Total delay in a speed profile running with treatment on for 27000 steps
Figure 69. Total delay in a speed profile running with treatment on for 27000 steps
4
6
8
10
12
0
100
200
300
400
500
600
700
800
900
Traveling Time (sec)
Delay (ms)
Acceleration Percentage
Total Delay of Accelstepper's C1 Treatment (27000 steps)
800‐900
700‐800
600‐700
500‐600
400‐500
300‐400
200‐300
100‐200
0‐100
4
6
8
10
12
‐300
‐200
‐100
0
100
200
300
400
500
600
700
Traveling Time (sec)
Delay (ms)
Acceleration Percentage
Total Delay of Accelstepper's C0 Compensation (27000 steps)
600‐700
500‐600
400‐500
300‐400
200‐300
100‐200
0‐100
‐100‐0
‐200‐‐100
‐300‐‐200
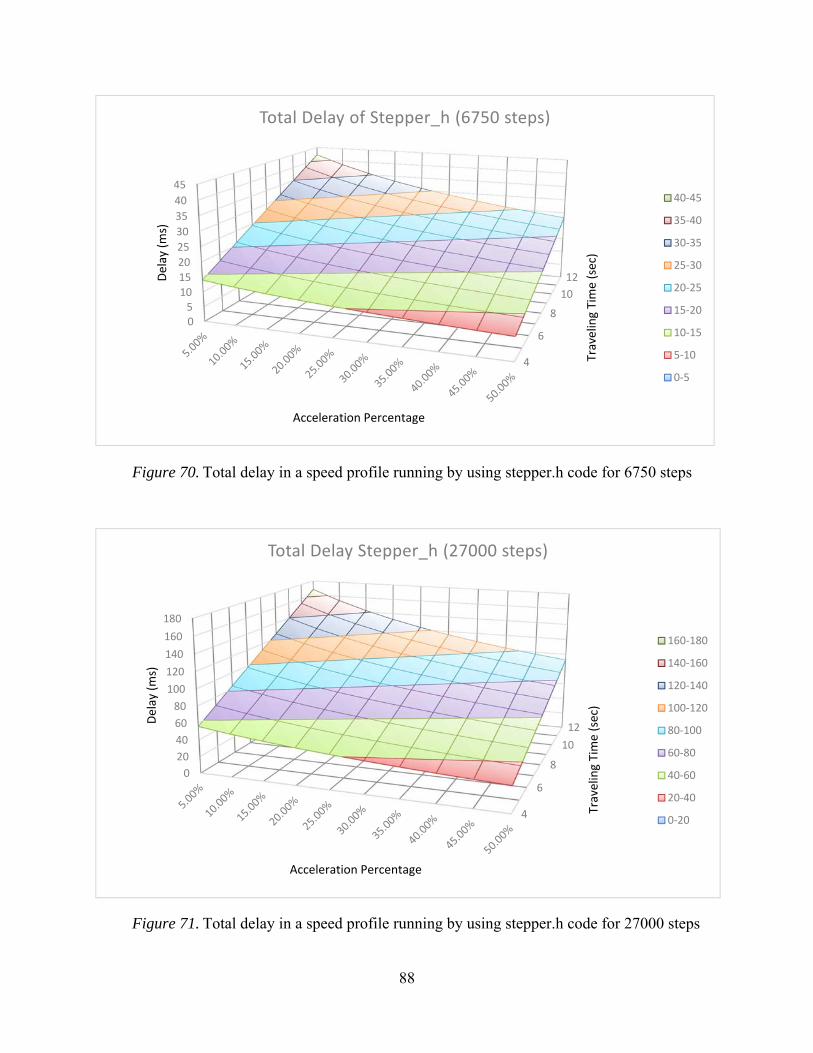
88
Figure 70. Total delay in a speed profile running by using stepper.h code for 6750 steps
Figure 71. Total delay in a speed profile running by using stepper.h code for 27000 steps
4
6
8
10
12
05
1015
20
25
30
35
40
45
Traveling Time (sec)
Delay (ms)
Acceleration Percentage
Total Delay of Stepper_h (6750 steps)
40‐45
35‐40
30‐35
25‐30
20‐25
15‐20
10‐15
5‐10
0‐5
4
6
8
10
12
0
20
40
60
80
100
120
140
160
180
Traveling Time (sec)
Delay (ms)
Acceleration Percentage
Total Delay Stepper_h (27000 steps)
160‐180
140‐160
120‐140
100‐120
80‐100
60‐80
40‐60
20‐40
0‐20
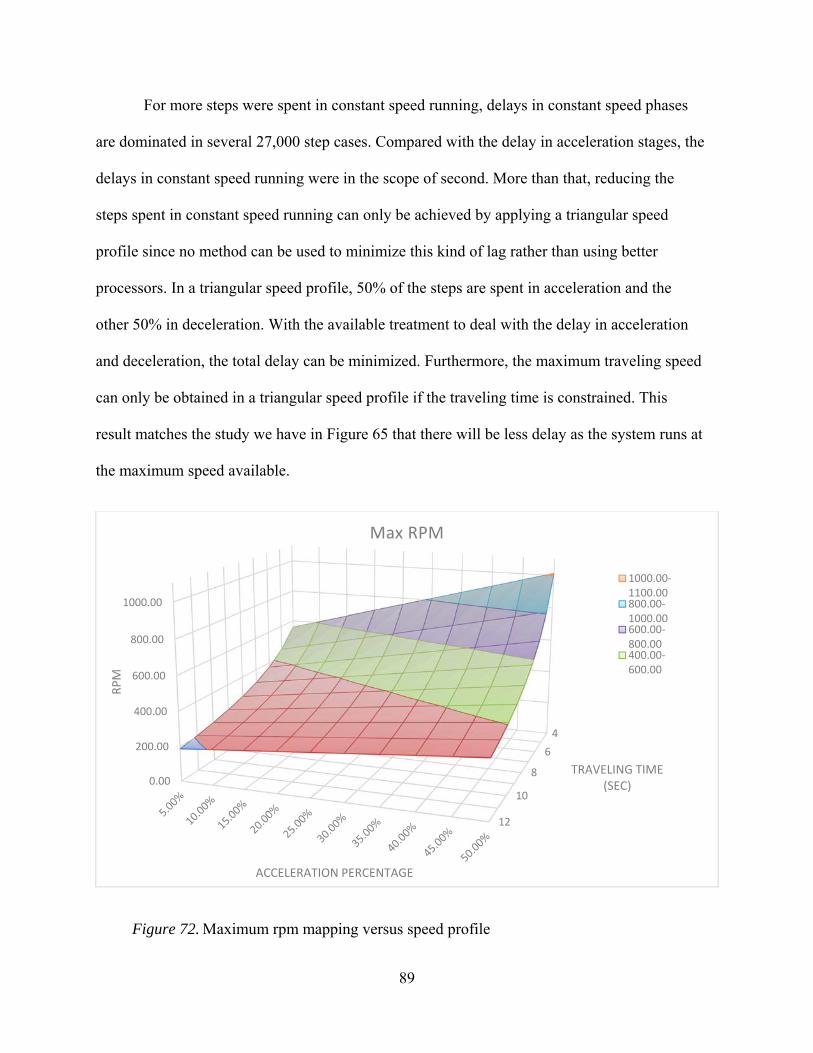
89
For more steps were spent in constant speed running, delays in constant speed phases
are dominated in several 27,000 step cases. Compared with the delay in acceleration stages, the
delays in constant speed running were in the scope of second. More than that, reducing the
steps spent in constant speed running can only be achieved by applying a triangular speed
profile since no method can be used to minimize this kind of lag rather than using better
processors. In a triangular speed profile, 50% of the steps are spent in acceleration and the
other 50% in deceleration. With the available treatment to deal with the delay in acceleration
and deceleration, the total delay can be minimized. Furthermore, the maximum traveling speed
can only be obtained in a triangular speed profile if the traveling time is constrained. This
result matches the study we have in Figure 65 that there will be less delay as the system runs at
the maximum speed available.
Figure 72. Maximum rpm mapping versus speed profile
4
6
8
10
12
0.00
200.00
400.00
600.00
800.00
1000.00
TRAVELING TIME (SEC)
RPM
ACCELERATION PERCENTAGE
Max RPM
1000.00‐1100.00800.00‐1000.00600.00‐800.00400.00‐600.00
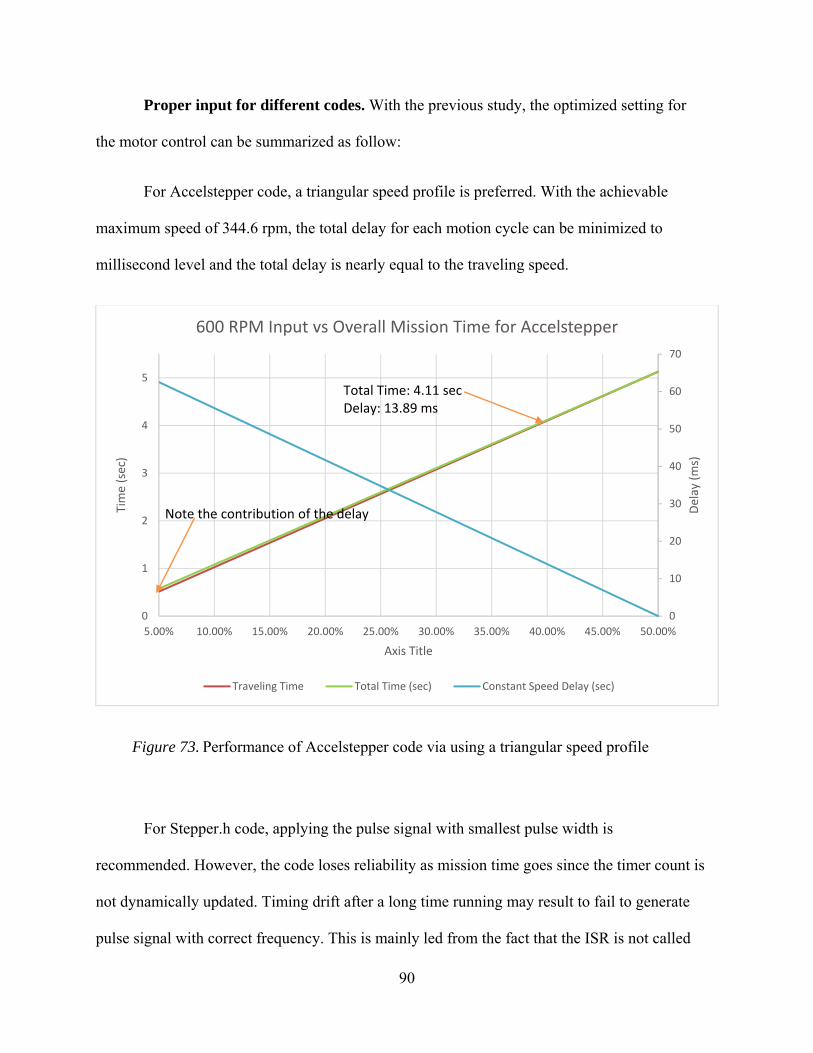
90
Proper input for different codes. With the previous study, the optimized setting for
the motor control can be summarized as follow:
For Accelstepper code, a triangular speed profile is preferred. With the achievable
maximum speed of 344.6 rpm, the total delay for each motion cycle can be minimized to
millisecond level and the total delay is nearly equal to the traveling speed.
Figure 73. Performance of Accelstepper code via using a triangular speed profile
For Stepper.h code, applying the pulse signal with smallest pulse width is
recommended. However, the code loses reliability as mission time goes since the timer count is
not dynamically updated. Timing drift after a long time running may result to fail to generate
pulse signal with correct frequency. This is mainly led from the fact that the ISR is not called
0
10
20
30
40
50
60
70
0
1
2
3
4
5
5.00% 10.00% 15.00% 20.00% 25.00% 30.00% 35.00% 40.00% 45.00% 50.00%
Delay (ms)
Time (sec)
Axis Title
600 RPM Input vs Overall Mission Time for Accelstepper
Traveling Time Total Time (sec) Constant Speed Delay (sec)
Total Time: 4.11 secDelay: 13.89 ms
Note the contribution of the delay
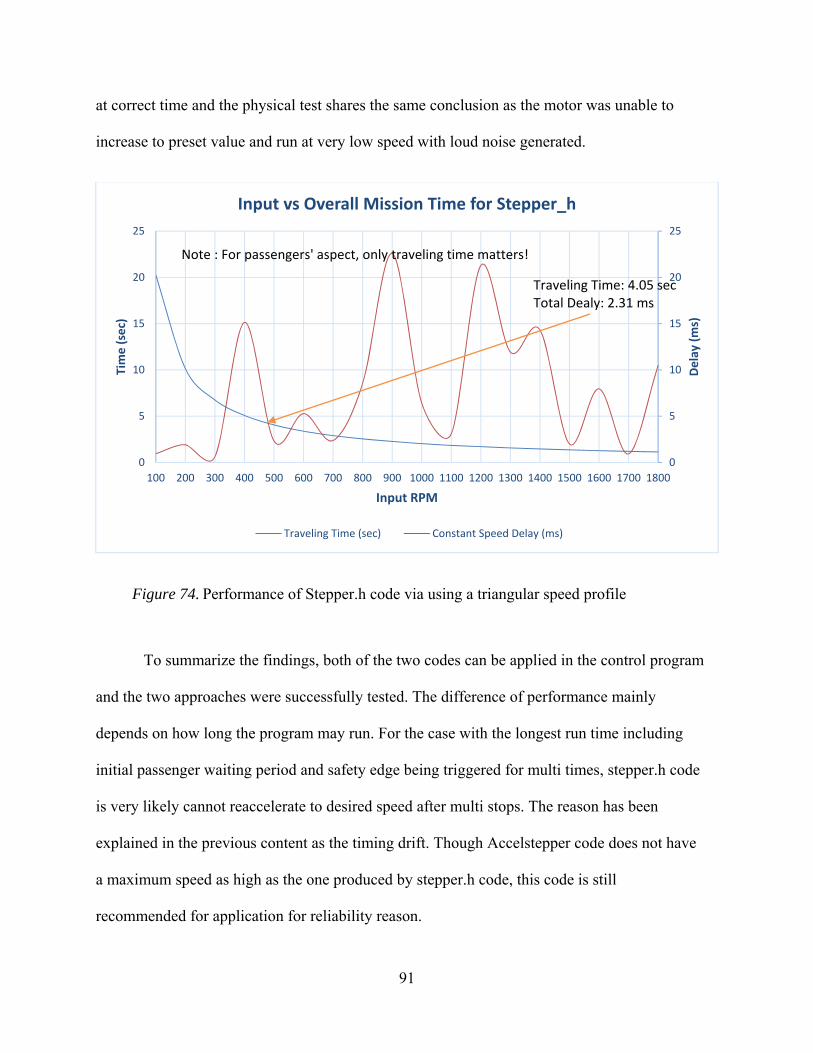
91
at correct time and the physical test shares the same conclusion as the motor was unable to
increase to preset value and run at very low speed with loud noise generated.
Figure 74. Performance of Stepper.h code via using a triangular speed profile
To summarize the findings, both of the two codes can be applied in the control program
and the two approaches were successfully tested. The difference of performance mainly
depends on how long the program may run. For the case with the longest run time including
initial passenger waiting period and safety edge being triggered for multi times, stepper.h code
is very likely cannot reaccelerate to desired speed after multi stops. The reason has been
explained in the previous content as the timing drift. Though Accelstepper code does not have
a maximum speed as high as the one produced by stepper.h code, this code is still
recommended for application for reliability reason.
0
5
10
15
20
25
0
5
10
15
20
25
100 200 300 400 500 600 700 800 900 1000 1100 1200 1300 1400 1500 1600 1700 1800
Delay (m
s)
Time (sec)
Input RPM
Input vs Overall Mission Time for Stepper_h
Traveling Time (sec) Constant Speed Delay (ms)
Traveling Time: 4.05 secTotal Dealy: 2.31 ms
Note : For passengers' aspect, only traveling time matters!
92
Chapter 4 – Conclusion and Recommendations
This prototyping project delivered a mature approach for automatic door system design
with a functional prototype. The strength of the full scale door mechanism’ structure is
validated with simulations. Current FEA results show maximum von Mises stress of 111.3
MPa. The deformation is within the dimension tolerance. It is expected that the full scale can
maintain its mechanism effectiveness under designed loading condition. The convergence of
the stress reading can be validated with physical tests about strength on the prototype product.
The FEA simulation shows the commercial model similar to IFE design may be more
superior in carrying heavy load. But the CAD modeling shows the dimension design has more
constrains as the equilibrium point of the panel support should be placed at a much backward
location. This will make the panel support harder to be balanced and complicates the
transmission mechanism. Building a small scale model with a mechanism of such kind can
help to understand the operation before further investment is put into this design direction.
Moreover, the manufacturability of the components for the full scale was not studied in
detail, since this was not the main aim of the project. Future work can contribute in this area,
so that the feasibility of building a full scale model will be thoroughly vetted.
The transmission system right now is just a simple shaft coupling between the lead
screw and the motor shaft. This is not a problem for light load application. For a full scale
model carrying a 20 kg door panel, some impact absorbing measures are highly recommended.
Applying a transmission belt to replace the rigid coupling should be considered for full scale
prototyping.
93
The 1:3 scale prototype is fully functional with designed logic control achieved. The
door motion was managed to finish within 4 seconds with properly selected speed profile.
Retesting the integrated system with a fast controller is highly recommended. The control
board like Arduino Due with an AT91SAM3X8E processor is an affordable option. The rule of
thumb for the timer is the higher clock frequency the better. With a fast processor, the delay in
constant speed running can be largely reduced.
Another way to ease the motor control problem is to use the lead screw with a larger
lead. The larger the lead, the slower the rotation speed is. Most common large leads can be
found in the market are 25mm, 50mm and 78 mm. However, lead screws with large pitch are
usually expensive, but they are necessary for a full scale model. To close a door with a 810
mm door way within 4 seconds, a rotation speed of 1518.25 rpm is required when using a lead
screw with 8 mm lead. And the full scale model will have a heavy door panel, the torque
requirement increases as well.
Current control system uses a fixed waiting time for boarding. A more intelligent
approach can be developed with an application of a laser or infrared beam sensor. The sensor
can be mounted at the side wall of the cabin near the door step. Each time, one passenger
walks through the doorway, the sensor can detect the blockage of the beam and count for one
person onboard. By comparing the number of passengers in the transit request from the
ticketing service, the intelligent sensing technique can tell how many more passengers has to
wait. This kind of control design will efficiently reduce the boarding time and help the ATN
system to achieve a higher level management intelligence. Such kind of logic control design
can be easily prototyped with laser beam sensors and photo resistors compatible with Arduino
control circuit.

94
Additional network integration can be arranged for a near term project to integrate the
existing door system into the small scale traffic system. The communication can be fulfilled by
Wifi communication via an XBee shield. Also the inaccurate timing issue may have a solution
like timing calibration on a network level. Changing the existing C++ language to a real-time
coding language like Java virtual machine is a long term goal for the project team that will
benefits the skills in system and network design in the future.
Overall with the achievement so far, more future work will keep contributing to the
development of the Spartan Superway ATN project.

95
REFERENCE
ADIS Automatic Doors. (2010). Design Guide for Automatic Sliding Door. Retrieved from
http://www.autodoors.com.au/design-guide.html
American Public Transportation Association. (2011), Standard for Powered Exterior Side Door
System Design for New Passenger Cars. Retrieved from
http://www.apta.com/resources/standards/Documents/APTA-PR-M-S-018-10.pdf
Atmel. (2014). ATmega640/V-1280/V-1281/V-2560/V-2561/V Datasheet. Retrieved from
http://www.atmel.com/images/atmel-2549-8-bit-avr-microcontroller-atmega640-1280-
1281-2560-2561_datasheet.pdf
Austin, D. (2004). Generate stepper-motor speed profiles in real time. Retrieved from
http://www.embedded.com/design/mcus-processors-and-socs/4006438/Generate-stepper-
motor-speed-profiles-in-real-time
Bombini, L., Broggi, A., Buzzoni, M. and Medici, P. (2011). Intelligent Overhead Sensor for
Sliding Doors: A Stereo Based Method for Augmented Efficiency, Paper presented at Image
Analysis and Processing – ICIAP 2011, Retrieved from
http://www.ce.unipr.it/people/bombini/Papers/Intelligent_Door-VisLab.pdf
Bircher Reglomat AG. (2014). EU legislation and requirements for doors and gates: Safety
guide to power operation and Bircher Reglomat sensors. Retrieved from
http://reglomat.bircher.com/uploads/media/Safety-guide_doors_gates_01.pdf
Budynas, R. (1998). Advanced Strength and Applied Stress Analysis (2nd ed.). New York, NY:
McGraw-Hill Press.
Budynas, R. and Nisbett, J. (2011). Shigley’s Mechanical Engineering Design (9th ed.). New
York, NY: McGraw-Hill Press.

96
Cheng, X., Xing, Z., Qin, Y., Zhang, Y., Pang, S. and Xia, J. (2013). Reliability Analysis of
Metro Door System Based on FMECA, Journal of Intelligent Learning Systems and
Applications, 33 (5), 216-220, Retrieved from
http://www.scirp.org/journal/PaperInformation.aspx?PaperID=39442
DASMA Corporation. (2002), Technical Data Sheet No. 368. Retrieved from
http://www.dasma.com/PDF/Publications/TechDataSheets/OperatorElectronics/TDS368.pd
f
DayCounter, Inc. (2015). Stepper Motor Maximum Speed and Power Calculator. Retrieved from
http://www.daycounter.com/Calculators/Stepper-Motor-Calculator.phtml
Federal Railroad Administration. (2014). Passenger Train Exterior Side Door Safety. Federal
Register, 79(58), pp. 16978-17007. Retrieved from
http://www.fra.dot.gov/eLib/Details/L04979
Furman, B., Fabian, L., Ellis, S., Muller, P. and Swenson, R. (2014). Automated Transit
Networks (ATN): A Review of the State of the Industry and Prospects for the Future.
Retrieved from http://transweb.sjsu.edu/PDFs/research/1227-automated-transit-
networks.pdf
Greenville County Economic Development Corporation. (2014). Personal Rapid Transit
Evaluation: An Addendum to The 2010 Multimodal Transit Corridor Alternatives
Feasibility Study. Retrieved from http://www.advancedtransit.org/wp-
content/uploads/2013/05/GCEDC-PRT-Evaluation-Final-Report.pdf
Gustafsson, J. (2009). Vectus – Intelligent. IEEE, 97(11), pp. 1856-1863. Retrieved from
www.vectusprt.com/uploads/518288B214A85.pdf
97
Huang, W. and Gao, X. (2004). Tresca and von Mises yield criteria: a view from strain space.
Philosophical Magazine Letters, 84(10), 625-629, Retrieved from
http://www.tandfonline.com/doi/abs/10.1080/09500830512331325091?journalCode=tphl
20
Krueger, A. L. (2014). Design of a Simplified Test Track for Automated Transit Network
Development. Master's Theses. Paper 4426. Retrieved from
http://scholarworks.sjsu.edu/etd_theses/4426
Lowson, M. V. (2002). Engineering the ULTra System. Ingenia, September 2002, 6 - 12.
Retrieved from http://faculty.washington.edu/jbs/itrans/IngeniaULTra.pdf
Lowson, M.V. (2005). PRT for Airport Applications. Paper presented at TRB 84th Annual
Meeting, Washington, D.C. Retrieved from
http://www.jpods.com/downloads/JPodsDetails/Ultra_trb05_airports.pdf.
Lowson, M. V. (2011). Sustainable Personal Transportation, Forum on Integrated and
Sustainable Transportation Systems (pp. 261-267). Vienna, Austria: IEEE, Retrieved
from http://www.advancedtransit.org/wp-content/uploads/2011/08/Sustainable-personal-
transport-M.-Lowson.pdf
Lowson, M. V. and Hammersley, J. (2011). High Capacity PRT Station Design. Retrieved from
https://www.princeton.edu/~alaink/Orf467F10/PRT@LHR10_Conf/PRT_StationDesign
Hammersley_paper.pdf.
Midtown Raleigh Alliance and Ultra Global PRT. (2011). PRT 4 Midtown. Retrieved from
http://www.ultraprt.net/cms/RaleighMidtownPRT_study_12-19-11.pdf
National Research Council (U.S.)., Transportation Research Board., Transit Cooperative
Research Program., Telephonics Corporation. & United States. Federal Transit
Administration. (1995). Aids for rail car side-door observation. Washington, D.C.:

98
National Academy Press, Retrieved from
http://onlinepubs.trb.org/Onlinepubs/tcrp/tcrp_rpt_04-a.pdf
Pemberton, M. (2012). Suncheon Project Update [PowerPoint slides]. Retrieved from
www.vectusprt.com/uploads/512B8FA72D3CE.pdf
Pemberton, M. (2013). The Track to Suncheon: Making APMs Intelligent. Automated People
Movers and Transit Systems 2013, pp. 263-275. Retrieved from
http://faculty.washington.edu/jbs/itrans/Vectus%20APM%20presentation.pdf.
Pepperl+Fuchs AG. (2013). Invisible Protection- Sensors for the Protection and Movement of
Poeple and Vehicles. Retrieved from http://files.pepperl-
fuchs.com/selector_files/navi/productInfo/doct/tdoct0632b_eng.pdf
Quinones, J. (2012). Applying acceleration and deceleration profiles to bipolar stepper motors.
Analog Applications Journal, 2012(3Q), pp. 24-28. Retrieved from
http://www.ti.com/general/docs/lit/getliterature.tsp?baseLiteratureNumber=slyt482&fileTy
pe=pdf
Railway Association of Canada. (2001). Railway Passenger Car Inspection & Safety Rules.
Retrieved from https://www.tc.gc.ca/eng/railsafety/rules-tco26-356.htm
Raney, S. and Young, S.E. (2004), Morgantown People Mover – Updated. TRB 2005 Reviewing
Committee: Circulation and Driverless Transit (AP040). Retrieved from
www.cities21.org/morgantown_TRB_111504.pdf
Taxi 2000 Corporation. (2010), Skyweb Express transportation for the 21st Century. Retrieved
from http://faculty.washington.edu/jbs/itrans/SWE%20marketing%20intro.pdf
The Ohio-Kentucky-Indiana Regional Council of Governments. (2001). Central Area Loop
Study. Retrieved from http://www.oki.org/pdf/loop_study/loop4.pdf
99
The U.S. Access Board. (1992), Light Rail Vehicles and Systems Technical Assistance Manual.
Retrieved from http://www.access-board.gov/attachments/article/693/Lightrail.pdf
Thomson Industries, Inc. (2014), Lead Screws. Retrieved from
http://www.thomsonlinear.com/downloads/screws/Leadscrews_Ballscrews_Splines_cten.
Ultra Global PRT. (2009). Advanced Transport Systems ULTra PRT. Retrieved from
http://www.ultraprt.net/cms/ULTraDescriptionOct09.pdf
Van der Gucht, W., Vanwalleghem, D., Bonne, H., Eeckhout, W., De Waele, W. and De Baets, P.
(2011). Reliability Analysis of Semi-Automatic Train Door Systems in Service on Today’s
Rolling Stock of The SNCB, Sustainable Construction and Design, vol. 2012, Retrieved
from http://www.scad.ugent.be/journal/2011/SCAD_2011_2_3_465.pdf
Valley Metro Transit System. (2007), Metro Light Rail Design Criteria Manual. Retrieved from
http://www.valleymetro.org/images/uploads/lightrail_publications/Design_Criteria_Manu
al_FINAL_030207.pdf
Wang, H. (2015). Door System: Normal Operation with Safety Edge Interrupt for One Time.
Retrieved from https://www.youtube.com/watch?v=2ZxgMZ7USnE

100
Appendix A: User Guides for 1:3 Scale Demonstration Prototype
1) General:
This early prototype is a 1:3 scale down model for a full scale design. The prototype
model is developed for demonstration, control system validation and systematic integration
with other components in the transit network of Spartan Superway.
a. Carefully read this user guide before implement any test, demonstration
activity, disassembly and modification.
b. Do not apply heavy load over 1 kgf to any 3D printed and wooden
components.
c. Do not put any high heat source close to any 3D printed, wooden and electronic
components. The melting point of 3D printed PLA parts is 150 .
d. Broken PLA parts can be reconnected by applying plastic glue or epoxy.
e. Broken parts are not allowed to be used in any test, demonstration activity,
disassembly and modification.
f. Check specifications of all electronic components before any operation.
g. Contact Spartan Superway team if having any problem.
2) Transportation:
a. Dissemble the roller assembly, panel support and mid-link before
transportation. Dissembled components can be carried in a standard 12 inch
toolbox case.
b. Properly store tiny pieces like 10mm ball bearing, 16mm ball bearing or shaft
coupling (include headless hex screw) while transportation to prevent parts
missing.

101
c. Check if any mechanical part is broken before transportation. Broken piece
should be repaired before any transportation. Cracks can be repaired by
applying epoxy to prevent further growing.
d. Motor assembly, lead screw assembly, basement and side walls can be
transported with the main assembly. Place the main assembly on horizontal
surface with maximum contact surface while transportation.
3) Assembly:
a. Check if there is any missing piece before assembly.
b. Repair any broken parts before assembly. Leave repaired parts at least 2 hours
to let epoxy dry.
c. Powered tools are not allowed to use to tighten M8 thread connection on mid-
link, upper-link and panel support. Tighten gently with caution to prevent
cracking
4) Disassembly:
a. Check if there is any missing piece immediately after disassembly.
b. Repair any broken parts immediately after disassembly.
c. Store tiny pieces properly.
d. Unload M8 thread connection on mid-link, upper-link and panel support gently
to prevent cracking.
5) For Demonstration:
a. Check if there is any miss-connected pins or wiring before apply power to any
electronic components and circuits. Inverting the DC power supply wiring on
the M335 driver is not allowed. Miss connection may cause under-power on
the sensors and the Arduino boards which is a common source of
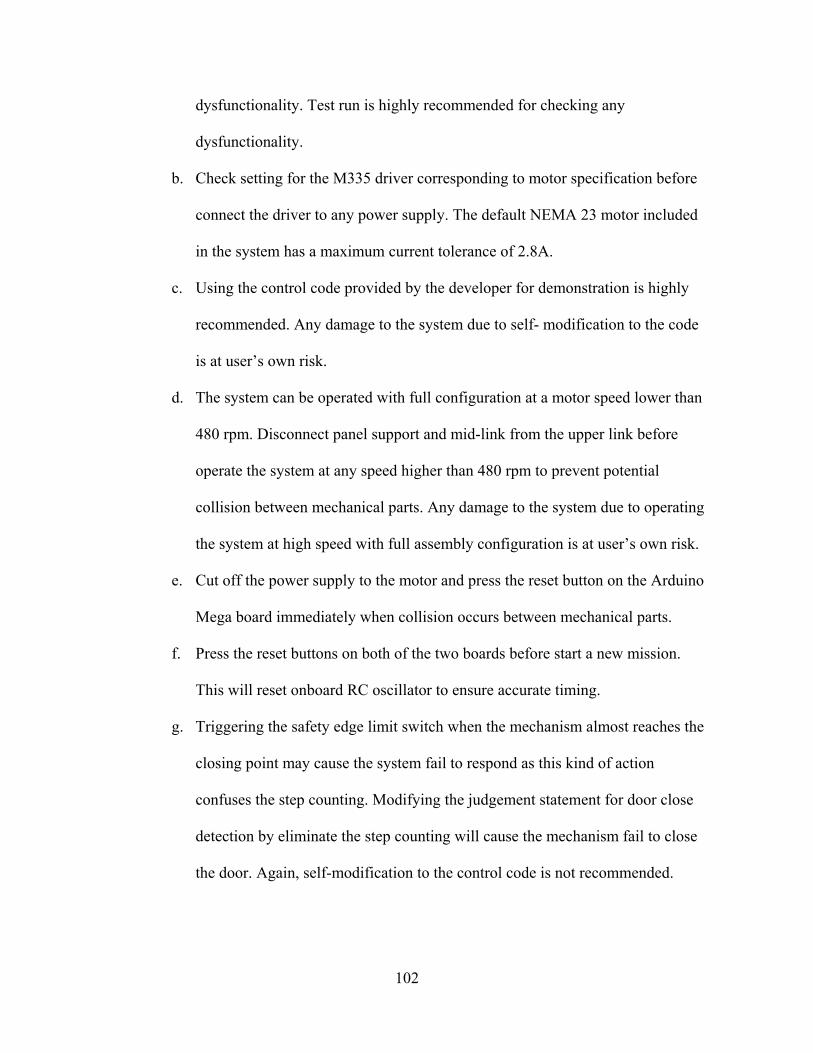
102
dysfunctionality. Test run is highly recommended for checking any
dysfunctionality.
b. Check setting for the M335 driver corresponding to motor specification before
connect the driver to any power supply. The default NEMA 23 motor included
in the system has a maximum current tolerance of 2.8A.
c. Using the control code provided by the developer for demonstration is highly
recommended. Any damage to the system due to self- modification to the code
is at user’s own risk.
d. The system can be operated with full configuration at a motor speed lower than
480 rpm. Disconnect panel support and mid-link from the upper link before
operate the system at any speed higher than 480 rpm to prevent potential
collision between mechanical parts. Any damage to the system due to operating
the system at high speed with full assembly configuration is at user’s own risk.
e. Cut off the power supply to the motor and press the reset button on the Arduino
Mega board immediately when collision occurs between mechanical parts.
f. Press the reset buttons on both of the two boards before start a new mission.
This will reset onboard RC oscillator to ensure accurate timing.
g. Triggering the safety edge limit switch when the mechanism almost reaches the
closing point may cause the system fail to respond as this kind of action
confuses the step counting. Modifying the judgement statement for door close
detection by eliminate the step counting will cause the mechanism fail to close
the door. Again, self-modification to the control code is not recommended.

103
Appendix B: Door System Design Guide for A Full Scale Model
1. General
Developing a full scale prototype model is a further step from basic concept validation
of 1:3 scale model the main purpose of which is to provide a testbed for logic control design
and a demonstration example. Unlike the scale down model, the major objectives of full scale
model development is to test functionality and reliability of the door system model mature
enough to a commercial model. The main features needed to be validated in Research &
Development (R&D) of a full scale door system model should be:
a. Standard & regulations based design method.
b. Mechanism’s durability and functionality in all designed conditions.
c. Mechatronics integration with reliability study on industrial standard level.
d. Compatible control software design and test.
e. Selection of vendors’ for major components.
2. Mechanism
a. A full scale carbon fiber door may weight 20-30 kg. The strength design should
follow this load threshold to determine the design start point. Additionally,
some unexpected condition should also be considered like passengers might
lean against the door panel causing extra load to the mechanism.
b. Design a lead screw with lead over 25mm is highly recommended. To cover a
rough 800mm traveling distance within 4 seconds, a linear velocity higher than
200mm. By using a lead screw with large lead can reduce the rotation down to
480 rpm. The motor will have better sudden stop performance.
c. For a two panel application, two one-direction lead screws with different
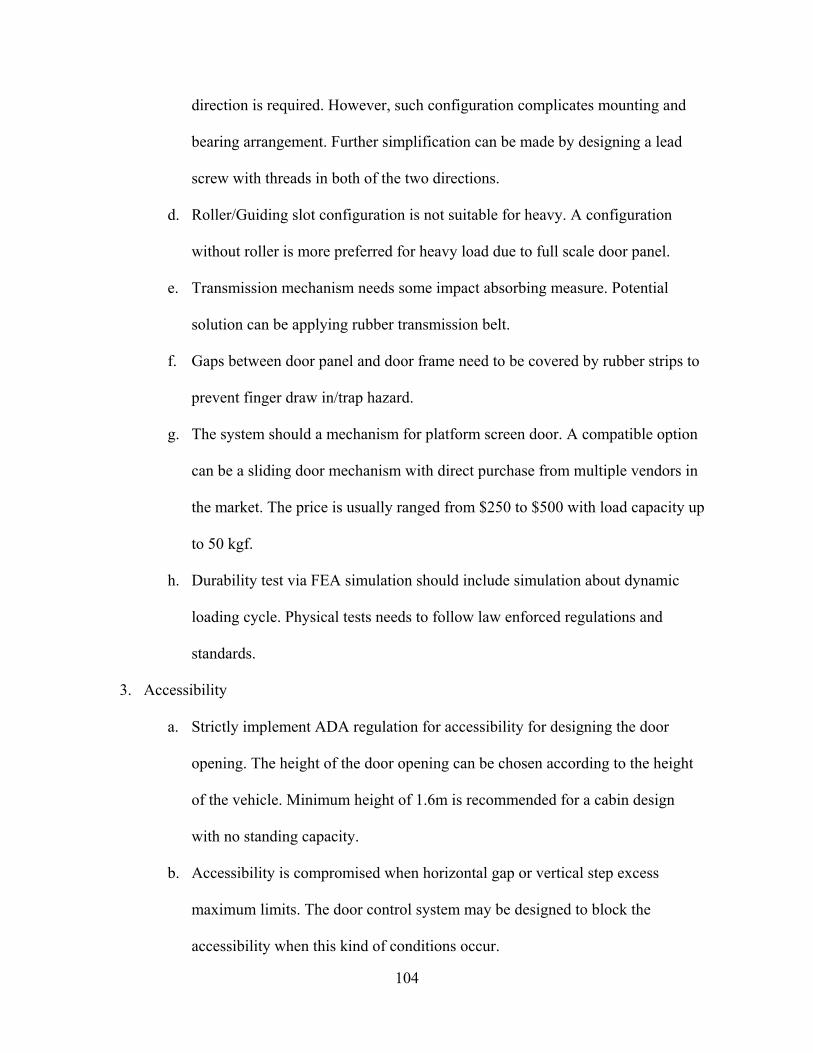
104
direction is required. However, such configuration complicates mounting and
bearing arrangement. Further simplification can be made by designing a lead
screw with threads in both of the two directions.
d. Roller/Guiding slot configuration is not suitable for heavy. A configuration
without roller is more preferred for heavy load due to full scale door panel.
e. Transmission mechanism needs some impact absorbing measure. Potential
solution can be applying rubber transmission belt.
f. Gaps between door panel and door frame need to be covered by rubber strips to
prevent finger draw in/trap hazard.
g. The system should a mechanism for platform screen door. A compatible option
can be a sliding door mechanism with direct purchase from multiple vendors in
the market. The price is usually ranged from $250 to $500 with load capacity up
to 50 kgf.
h. Durability test via FEA simulation should include simulation about dynamic
loading cycle. Physical tests needs to follow law enforced regulations and
standards.
3. Accessibility
a. Strictly implement ADA regulation for accessibility for designing the door
opening. The height of the door opening can be chosen according to the height
of the vehicle. Minimum height of 1.6m is recommended for a cabin design
with no standing capacity.
b. Accessibility is compromised when horizontal gap or vertical step excess
maximum limits. The door control system may be designed to block the
accessibility when this kind of conditions occur.

105
c. Accessibility should be not compromised by shrunk internal spacing after
passengers onboard. This design problem needs to be solved with cooperation
of cabin design.
4. Sensing & Indication
a. All sensors applied in the full scale system should be commercial products with
certificated reliability validation.
b. Flashing LED with embedded blinking function can be used for visual
indication without control requirement from the micro-controller.
c. Audio indication needs to be integrated.
5. Embedded Electronics
a. A faster processor is required when more sensors and output devices added into
the door system.
b. An oscillator with higher operating frequency and lower timing drift can fix
existing timing problems.
6. Logic Control
a. An integrated door control system will control the onboard door mechanism and
the platform screen door mechanism. Machine to machine communication
comes through wireless communication. To obtain simultaneous operation, the
master-slave logic control problem is expected to be solved.
b. Implementation of no motion circuit.
c. Global communication in the network for local machine will be expected to
achieve remote control and override.
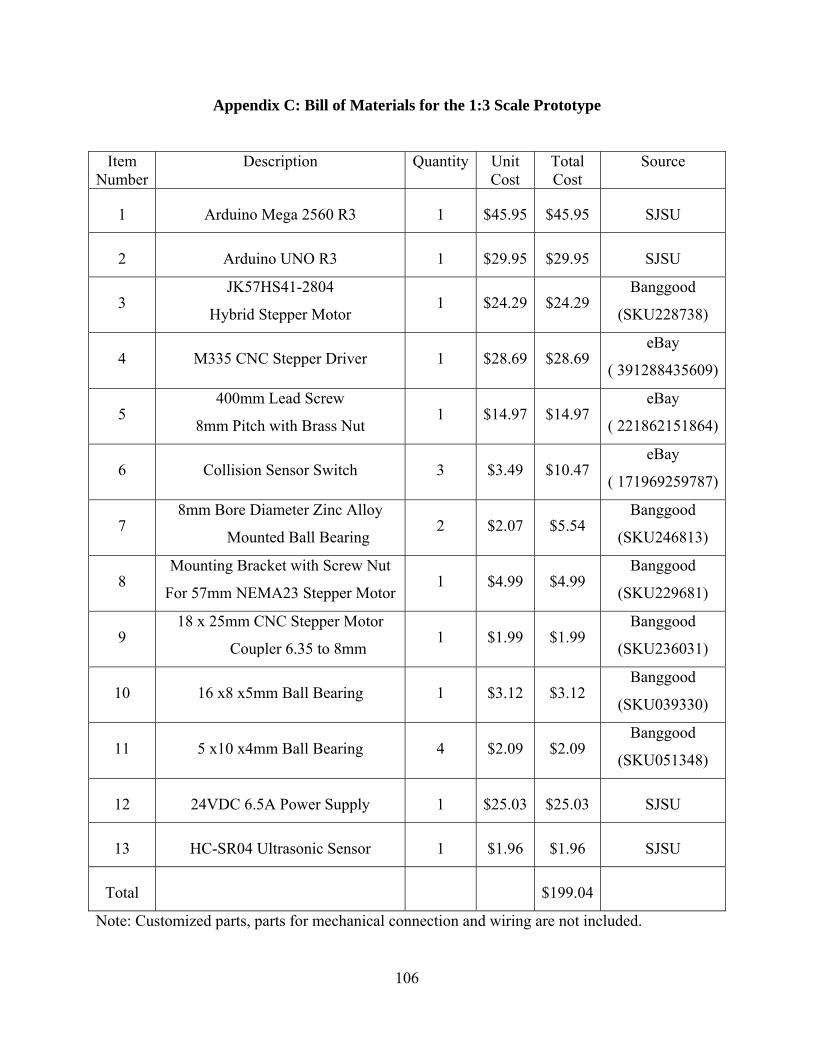
106
Appendix C: Bill of Materials for the 1:3 Scale Prototype
Item Number
Description Quantity Unit Cost
Total Cost
Source
1 Arduino Mega 2560 R3 1 $45.95 $45.95 SJSU
2 Arduino UNO R3 1 $29.95 $29.95 SJSU
3 JK57HS41-2804
Hybrid Stepper Motor 1 $24.29 $24.29
Banggood
(SKU228738)
4 M335 CNC Stepper Driver 1 $28.69 $28.69 eBay
( 391288435609)
5 400mm Lead Screw
8mm Pitch with Brass Nut 1 $14.97 $14.97
eBay
( 221862151864)
6 Collision Sensor Switch 3 $3.49 $10.47 eBay
( 171969259787)
7 8mm Bore Diameter Zinc Alloy
Mounted Ball Bearing 2 $2.07 $5.54
Banggood
(SKU246813)
8 Mounting Bracket with Screw Nut
For 57mm NEMA23 Stepper Motor 1 $4.99 $4.99
Banggood
(SKU229681)
9 18 x 25mm CNC Stepper Motor
Coupler 6.35 to 8mm 1 $1.99 $1.99
Banggood
(SKU236031)
10 16 x8 x5mm Ball Bearing 1 $3.12 $3.12 Banggood
(SKU039330)
11 5 x10 x4mm Ball Bearing 4 $2.09 $2.09 Banggood
(SKU051348)
12 24VDC 6.5A Power Supply 1 $25.03 $25.03 SJSU
13 HC-SR04 Ultrasonic Sensor 1 $1.96 $1.96 SJSU
Total $199.04
Note: Customized parts, parts for mechanical connection and wiring are not included.
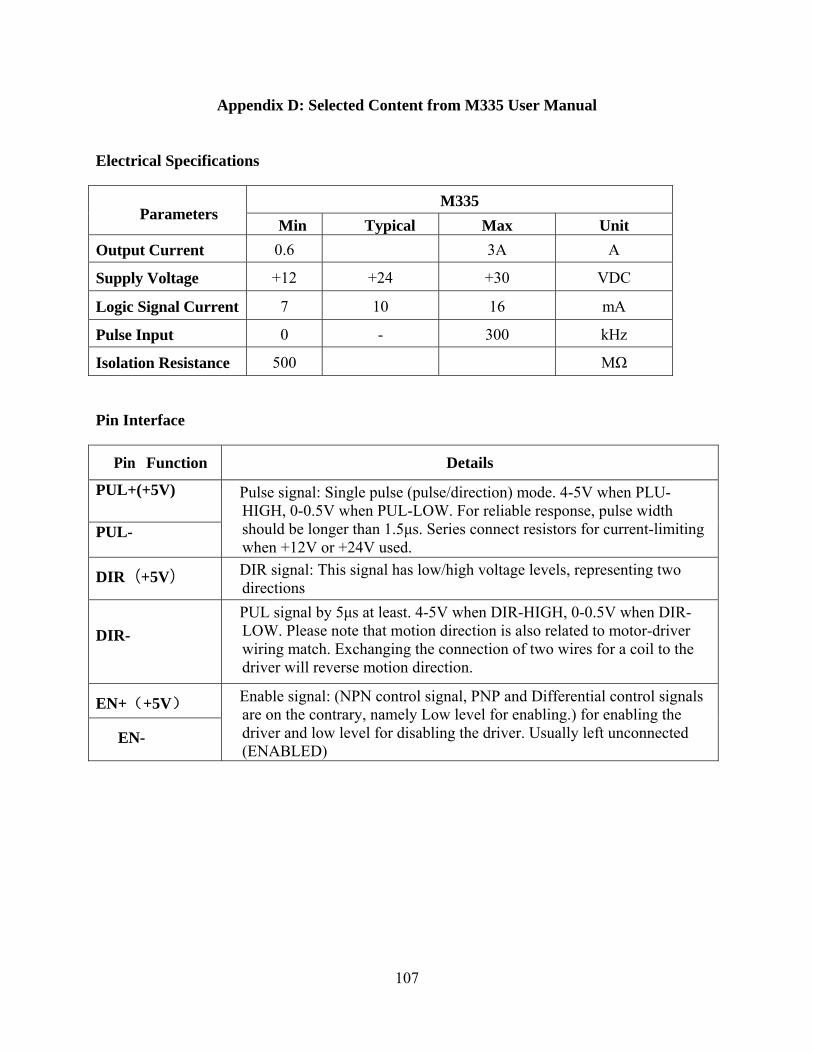
107
Appendix D: Selected Content from M335 User Manual
Electrical Specifications
Parameters M335
Min Typical Max Unit
Output Current 0.6 3A A
Supply Voltage +12 +24 +30 VDC
Logic Signal Current 7 10 16 mA
Pulse Input 0 - 300 kHz
Isolation Resistance 500 MΩ
Pin Interface
Pin Function Details
PUL+(+5V) Pulse signal: Single pulse (pulse/direction) mode. 4-5V when PLU-HIGH, 0-0.5V when PUL-LOW. For reliable response, pulse width should be longer than 1.5μs. Series connect resistors for current-limiting when +12V or +24V used.
PUL-
DIR(+5V) DIR signal: This signal has low/high voltage levels, representing two directions
DIR-
PUL signal by 5μs at least. 4-5V when DIR-HIGH, 0-0.5V when DIR-LOW. Please note that motion direction is also related to motor-driver wiring match. Exchanging the connection of two wires for a coil to the driver will reverse motion direction.
EN+(+5V) Enable signal: (NPN control signal, PNP and Differential control signals are on the contrary, namely Low level for enabling.) for enabling the driver and low level for disabling the driver. Usually left unconnected (ENABLED)
EN-
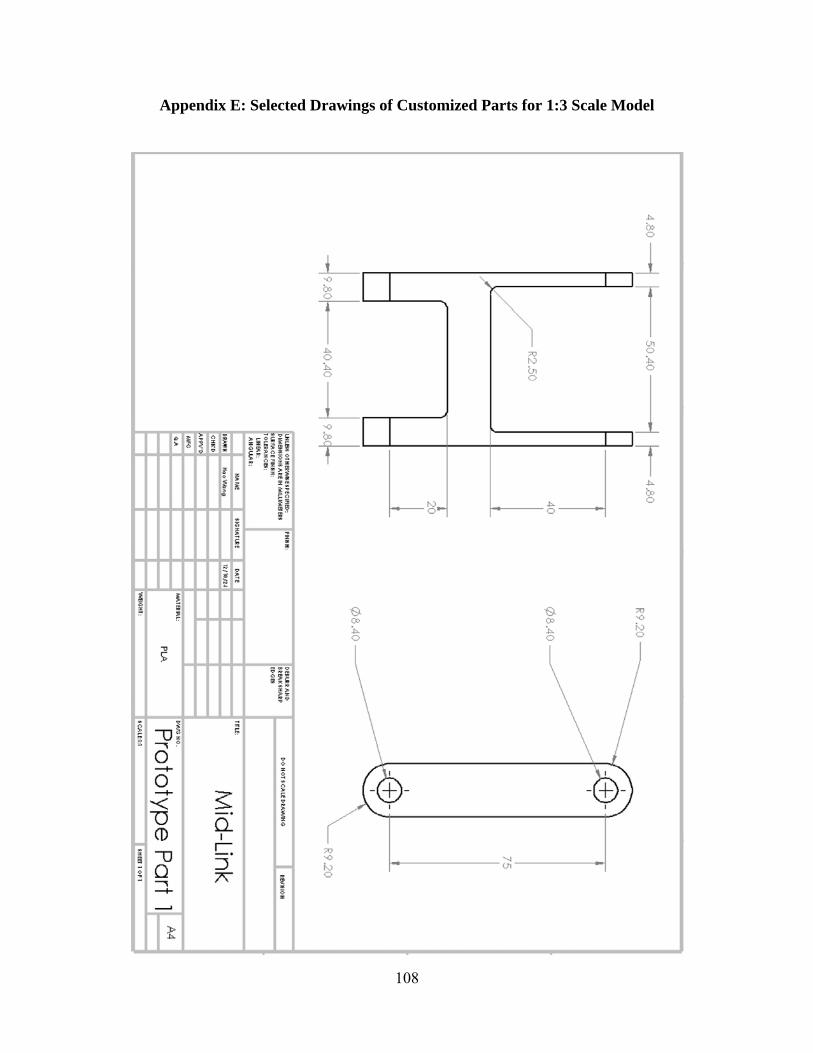
108
Appendix E: Selected Drawings of Customized Parts for 1:3 Scale Model
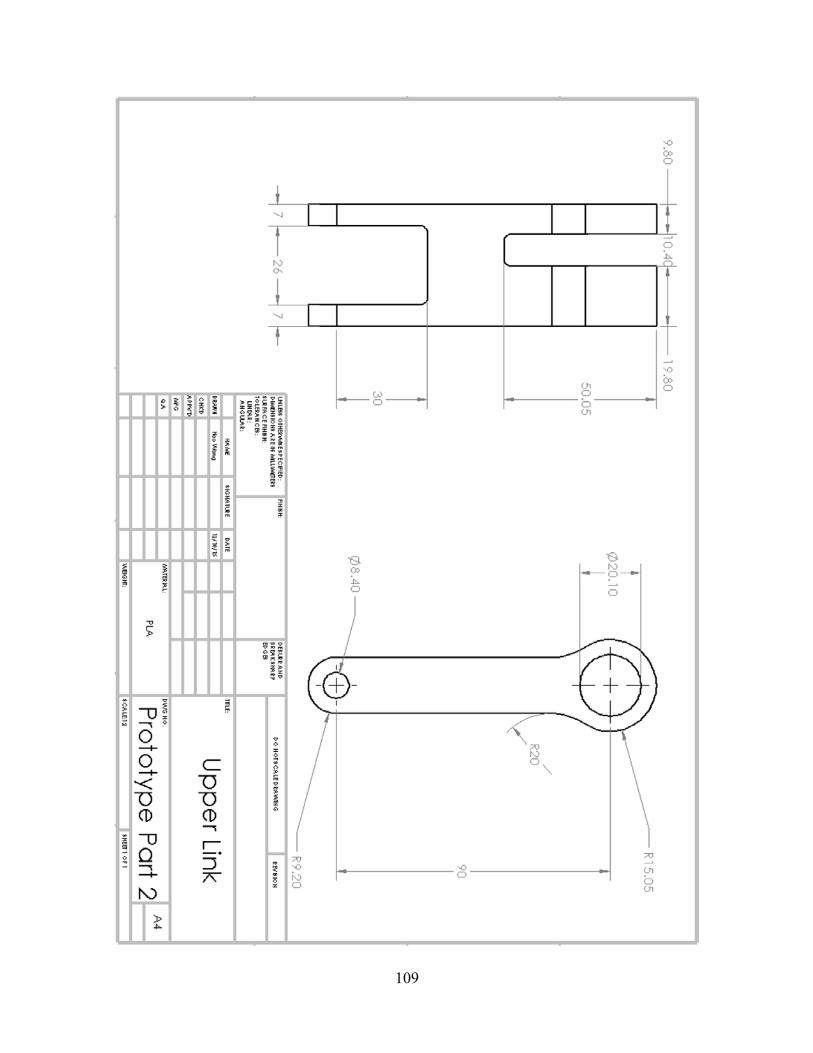
109
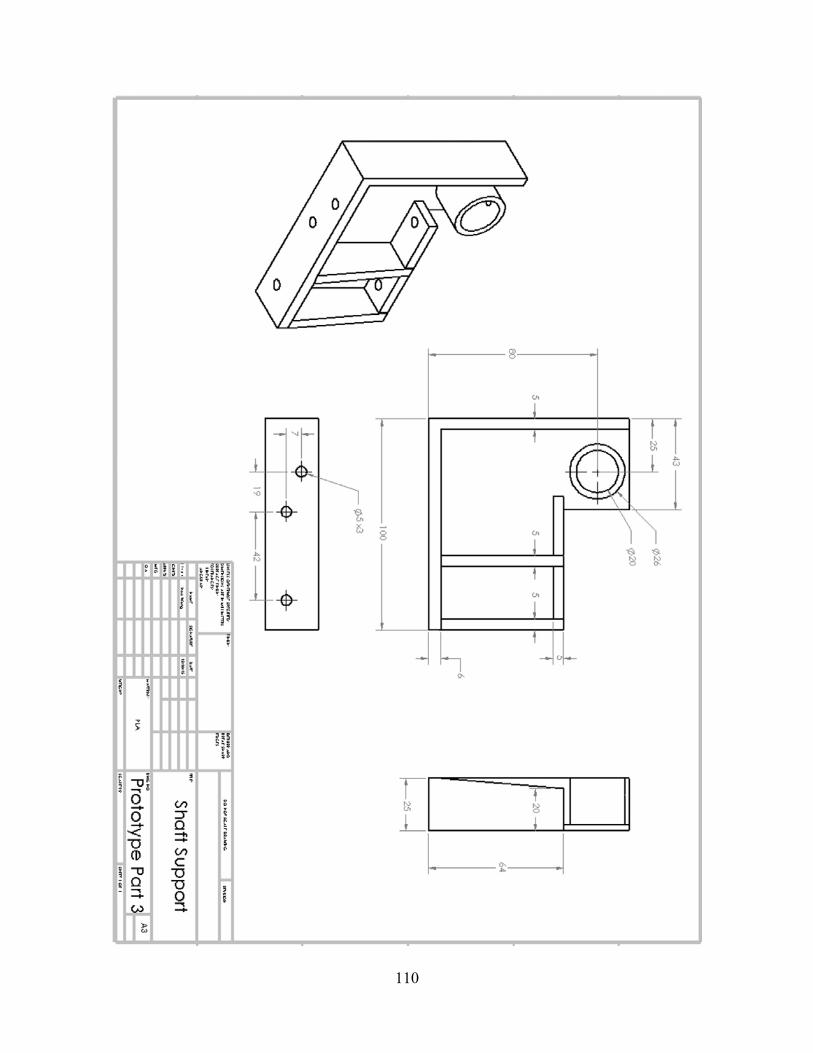
110
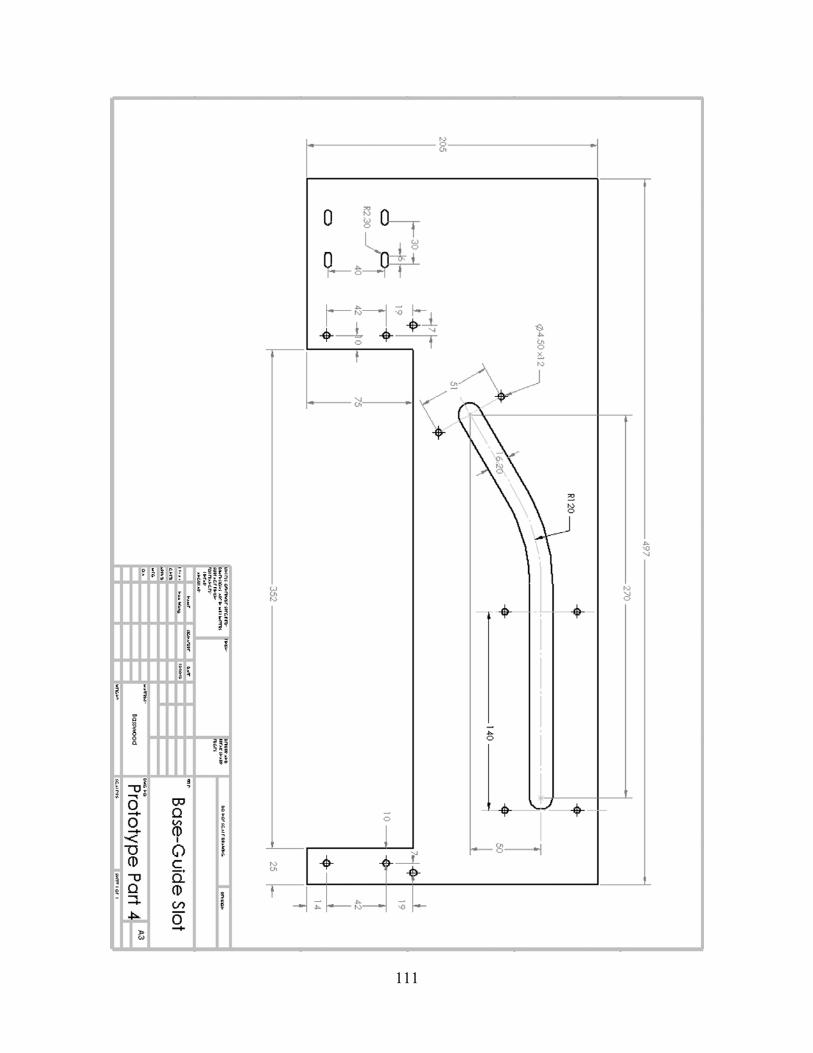
111
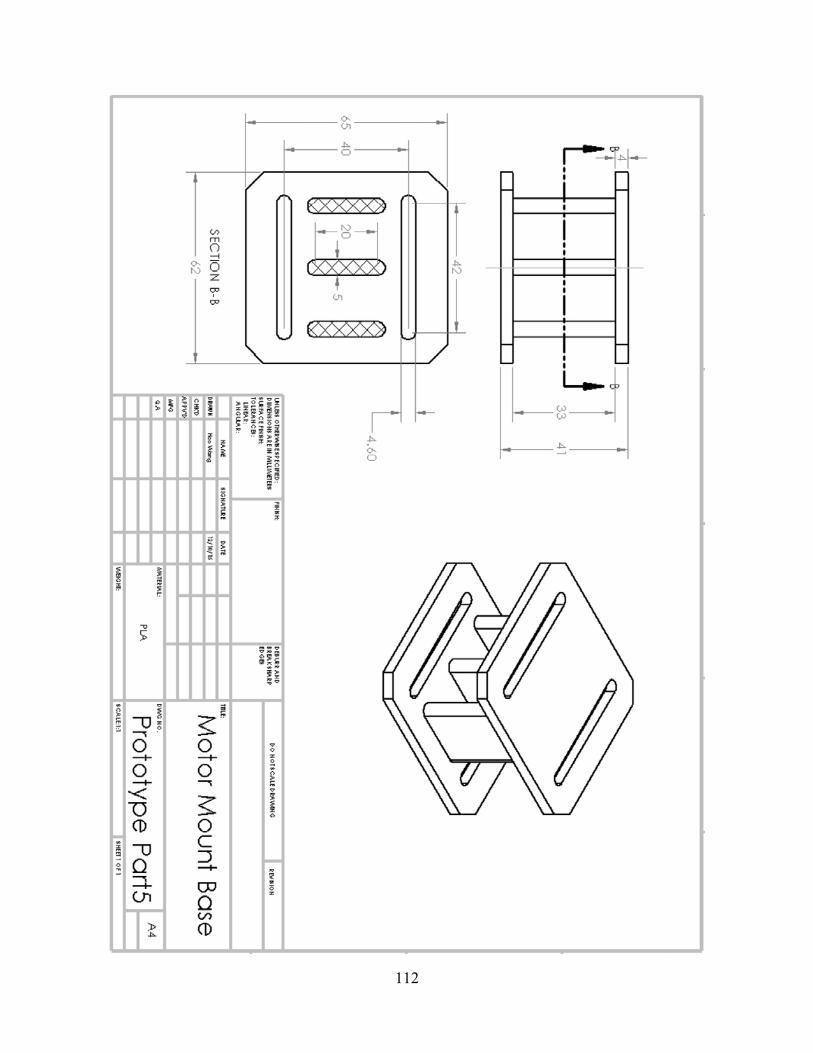
112
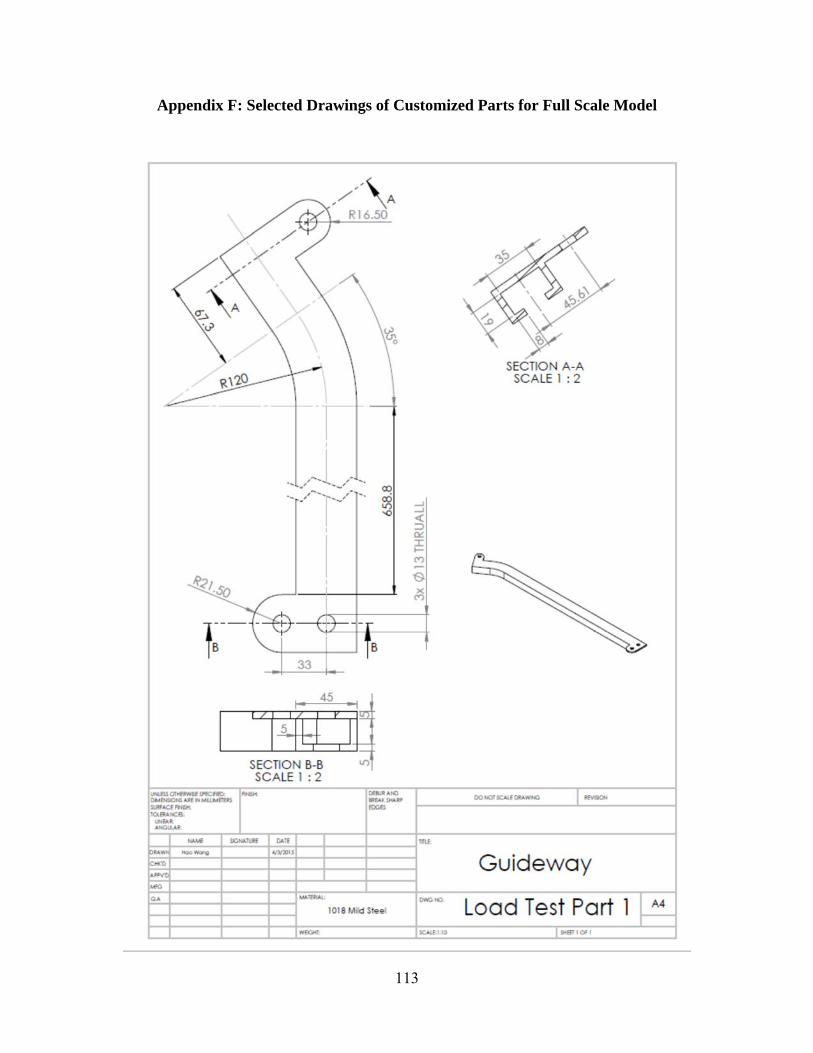
113
Appendix F: Selected Drawings of Customized Parts for Full Scale Model
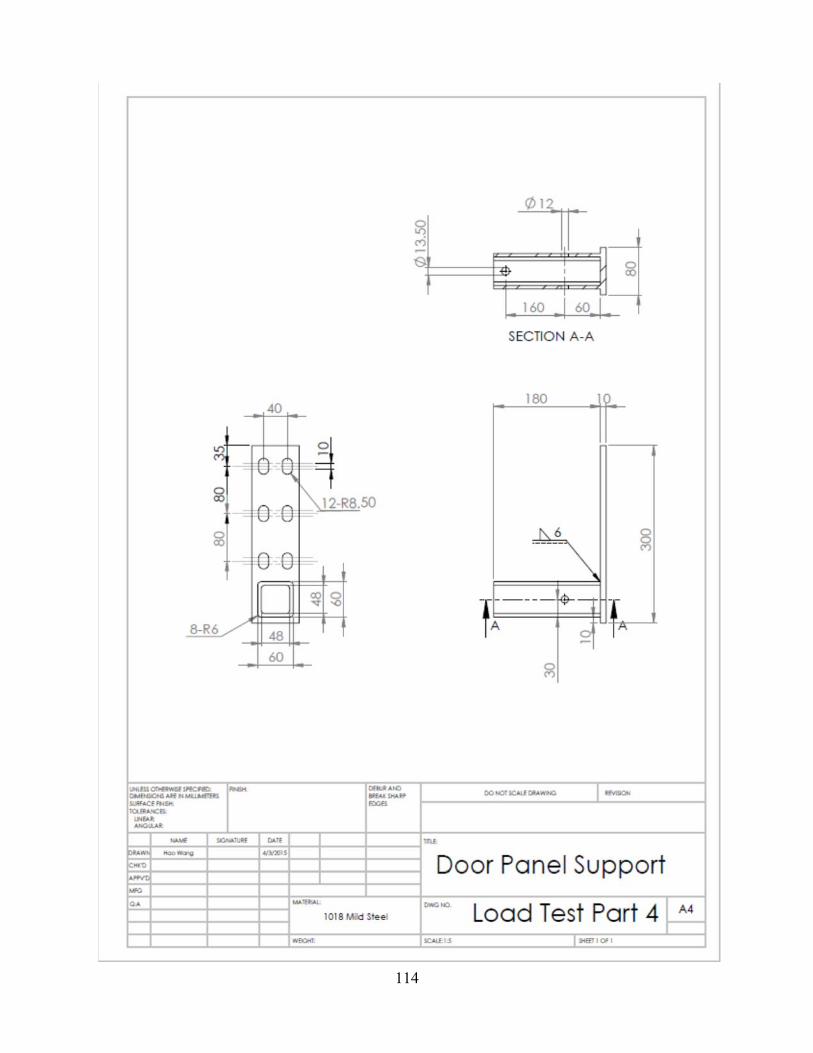
114
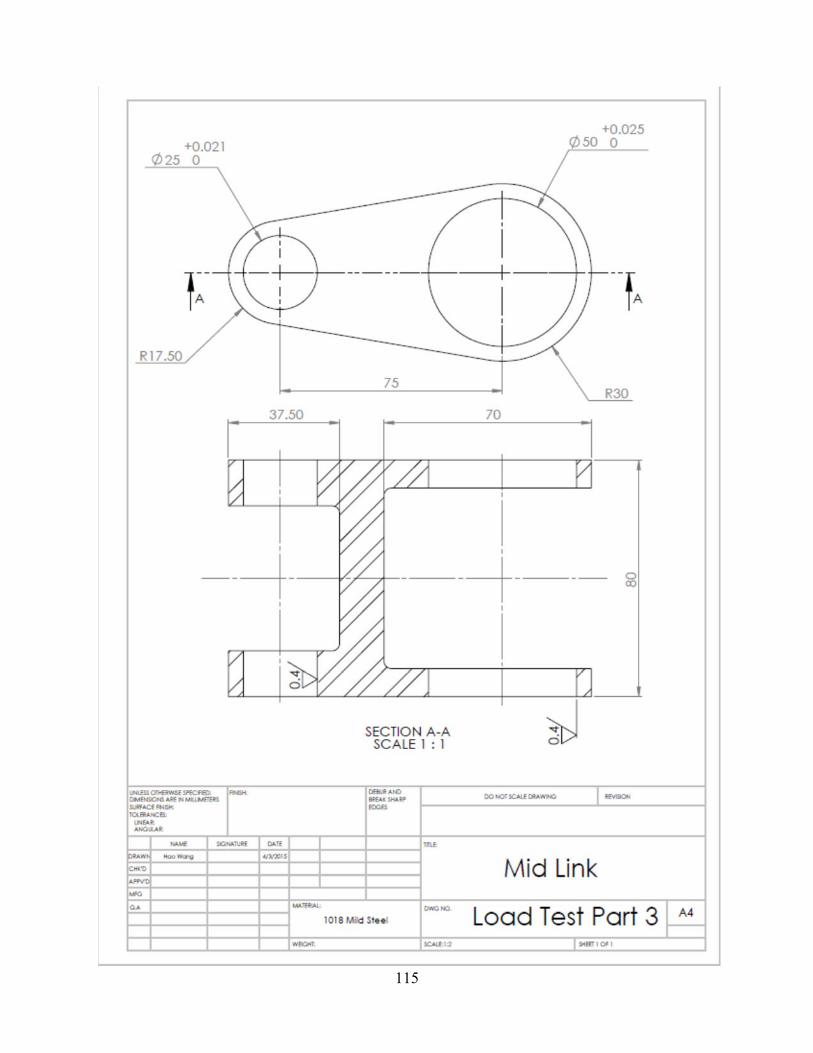
115
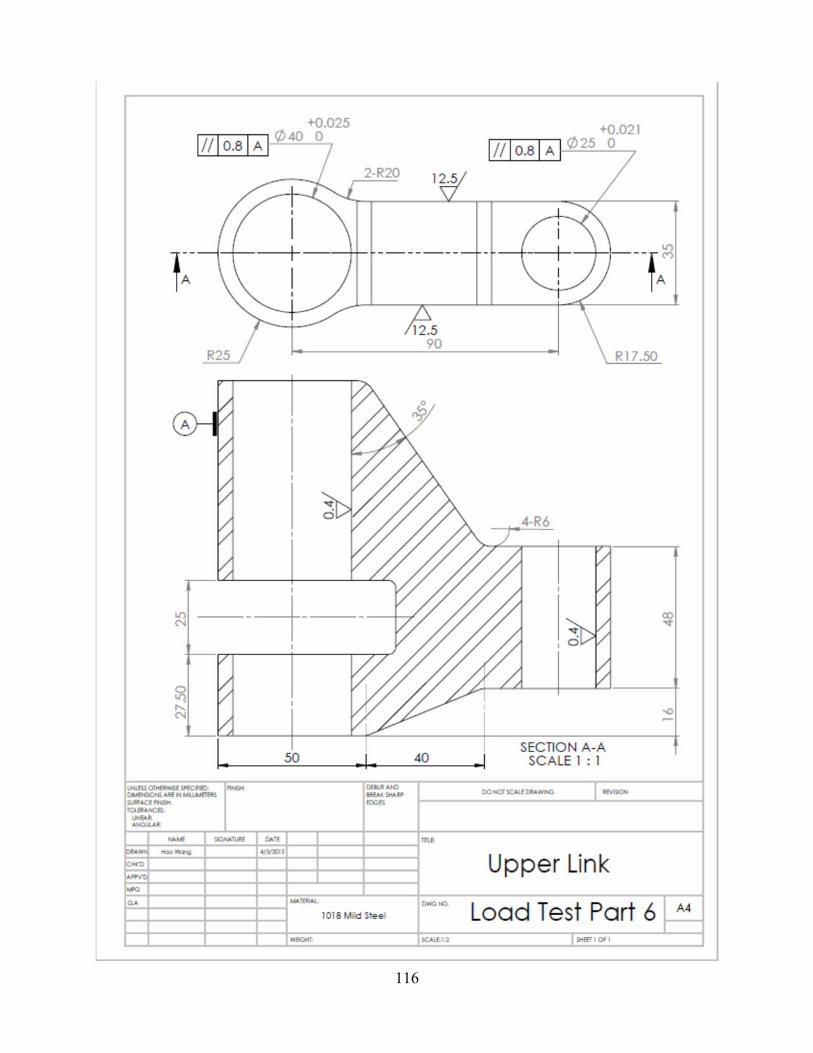
116
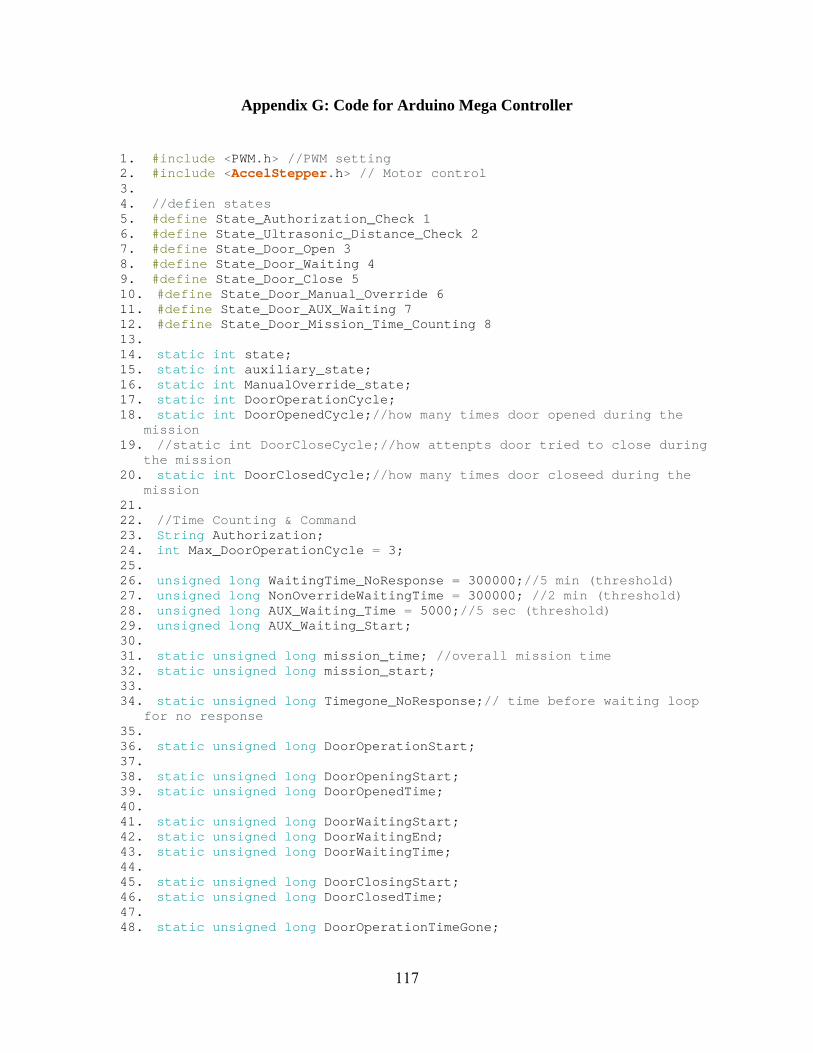
117
Appendix G: Code for Arduino Mega Controller
1. #include <PWM.h> //PWM setting2. #include <AccelStepper.h> // Motor control3. 4. //defien states5. #define State_Authorization_Check 16. #define State_Ultrasonic_Distance_Check 27. #define State_Door_Open 38. #define State_Door_Waiting 49. #define State_Door_Close 510. #define State_Door_Manual_Override 611. #define State_Door_AUX_Waiting 712. #define State_Door_Mission_Time_Counting 813. 14. static int state;15. static int auxiliary_state;16. static int ManualOverride_state;17. static int DoorOperationCycle;18. static int DoorOpenedCycle;//how many times door opened during the
mission 19. //static int DoorCloseCycle;//how attenpts door tried to close during
the mission 20. static int DoorClosedCycle;//how many times door closeed during the
mission 21. 22. //Time Counting & Command23. String Authorization;24. int Max_DoorOperationCycle = 3;25. 26. unsigned long WaitingTime_NoResponse = 300000;//5 min (threshold)27. unsigned long NonOverrideWaitingTime = 300000; //2 min (threshold)28. unsigned long AUX_Waiting_Time = 5000;//5 sec (threshold)29. unsigned long AUX_Waiting_Start;30. 31. static unsigned long mission_time; //overall mission time32. static unsigned long mission_start;33. 34. static unsigned long Timegone_NoResponse;// time before waiting loop
for no response 35. 36. static unsigned long DoorOperationStart;37. 38. static unsigned long DoorOpeningStart;39. static unsigned long DoorOpenedTime;40. 41. static unsigned long DoorWaitingStart;42. static unsigned long DoorWaitingEnd;43. static unsigned long DoorWaitingTime;44. 45. static unsigned long DoorClosingStart;46. static unsigned long DoorClosedTime;47. 48. static unsigned long DoorOperationTimeGone;
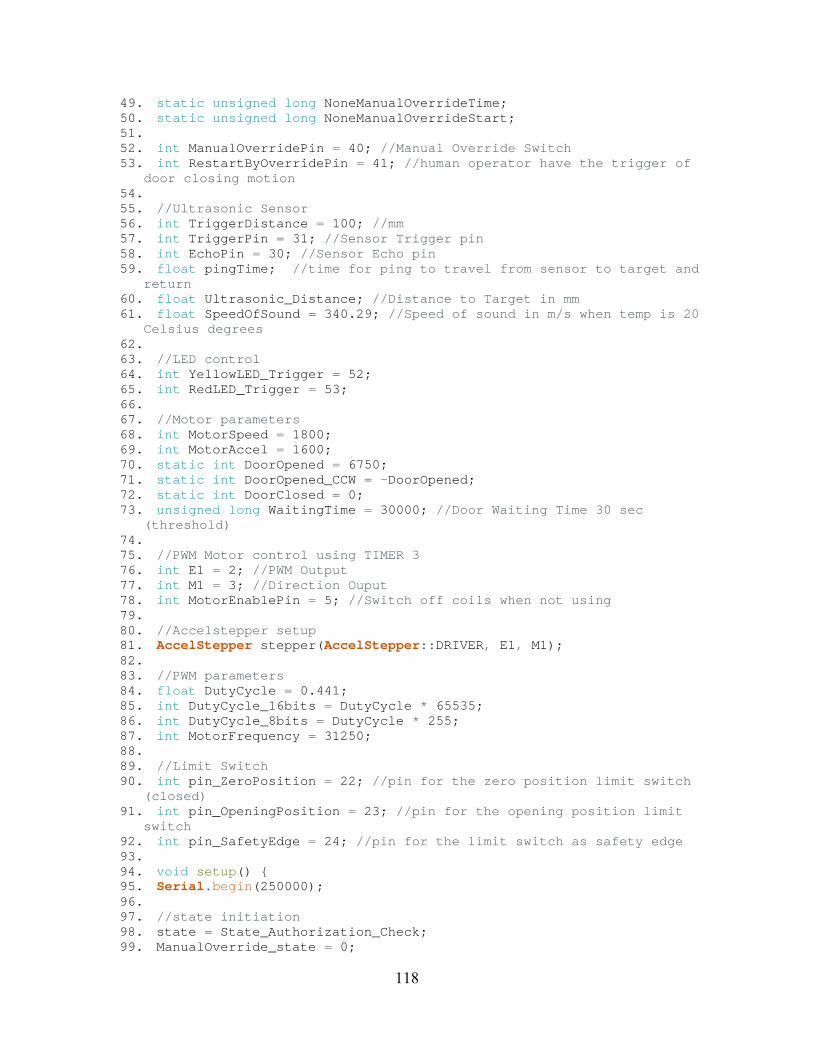
118
49. static unsigned long NoneManualOverrideTime;50. static unsigned long NoneManualOverrideStart;51. 52. int ManualOverridePin = 40; //Manual Override Switch53. int RestartByOverridePin = 41; //human operator have the trigger of
door closing motion 54. 55. //Ultrasonic Sensor56. int TriggerDistance = 100; //mm57. int TriggerPin = 31; //Sensor Trigger pin58. int EchoPin = 30; //Sensor Echo pin59. float pingTime; //time for ping to travel from sensor to target and
return 60. float Ultrasonic_Distance; //Distance to Target in mm61. float SpeedOfSound = 340.29; //Speed of sound in m/s when temp is 20
Celsius degrees 62. 63. //LED control64. int YellowLED_Trigger = 52;65. int RedLED_Trigger = 53;66. 67. //Motor parameters68. int MotorSpeed = 1800;69. int MotorAccel = 1600;70. static int DoorOpened = 6750;71. static int DoorOpened_CCW = -DoorOpened;72. static int DoorClosed = 0;73. unsigned long WaitingTime = 30000; //Door Waiting Time 30 sec
(threshold) 74. 75. //PWM Motor control using TIMER 376. int E1 = 2; //PWM Output77. int M1 = 3; //Direction Ouput78. int MotorEnablePin = 5; //Switch off coils when not using79. 80. //Accelstepper setup81. AccelStepper stepper(AccelStepper::DRIVER, E1, M1);82. 83. //PWM parameters84. float DutyCycle = 0.441;85. int DutyCycle_16bits = DutyCycle * 65535;86. int DutyCycle_8bits = DutyCycle * 255;87. int MotorFrequency = 31250;88. 89. //Limit Switch90. int pin_ZeroPosition = 22; //pin for the zero position limit switch
(closed) 91. int pin_OpeningPosition = 23; //pin for the opening position limit
switch 92. int pin_SafetyEdge = 24; //pin for the limit switch as safety edge93. 94. void setup() 95. Serial.begin(250000);96. 97. //state initiation98. state = State_Authorization_Check;99. ManualOverride_state = 0;
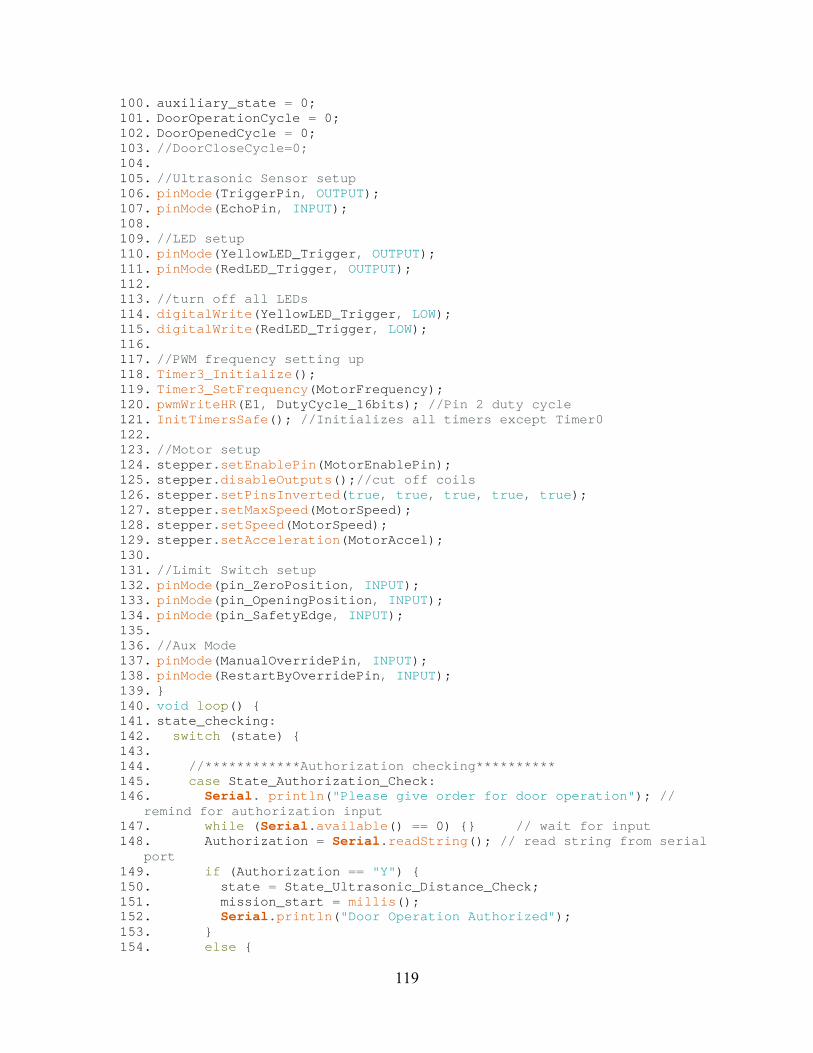
119
100. auxiliary_state = 0; 101. DoorOperationCycle = 0; 102. DoorOpenedCycle = 0; 103. //DoorCloseCycle=0; 104. 105. //Ultrasonic Sensor setup 106. pinMode(TriggerPin, OUTPUT); 107. pinMode(EchoPin, INPUT); 108. 109. //LED setup 110. pinMode(YellowLED_Trigger, OUTPUT); 111. pinMode(RedLED_Trigger, OUTPUT); 112. 113. //turn off all LEDs 114. digitalWrite(YellowLED_Trigger, LOW); 115. digitalWrite(RedLED_Trigger, LOW); 116. 117. //PWM frequency setting up 118. Timer3_Initialize(); 119. Timer3_SetFrequency(MotorFrequency); 120. pwmWriteHR(E1, DutyCycle_16bits); //Pin 2 duty cycle 121. InitTimersSafe(); //Initializes all timers except Timer0 122. 123. //Motor setup 124. stepper.setEnablePin(MotorEnablePin); 125. stepper.disableOutputs();//cut off coils 126. stepper.setPinsInverted(true, true, true, true, true); 127. stepper.setMaxSpeed(MotorSpeed); 128. stepper.setSpeed(MotorSpeed); 129. stepper.setAcceleration(MotorAccel); 130. 131. //Limit Switch setup 132. pinMode(pin_ZeroPosition, INPUT); 133. pinMode(pin_OpeningPosition, INPUT); 134. pinMode(pin_SafetyEdge, INPUT); 135. 136. //Aux Mode 137. pinMode(ManualOverridePin, INPUT); 138. pinMode(RestartByOverridePin, INPUT); 139. 140. void loop() 141. state_checking: 142. switch (state) 143. 144. //************Authorization checking********** 145. case State_Authorization_Check: 146. Serial. println("Please give order for door operation"); //
remind for authorization input 147. while (Serial.available() == 0) // wait for input 148. Authorization = Serial.readString(); // read string from serial
port 149. if (Authorization == "Y") 150. state = State_Ultrasonic_Distance_Check; 151. mission_start = millis(); 152. Serial.println("Door Operation Authorized"); 153. 154. else
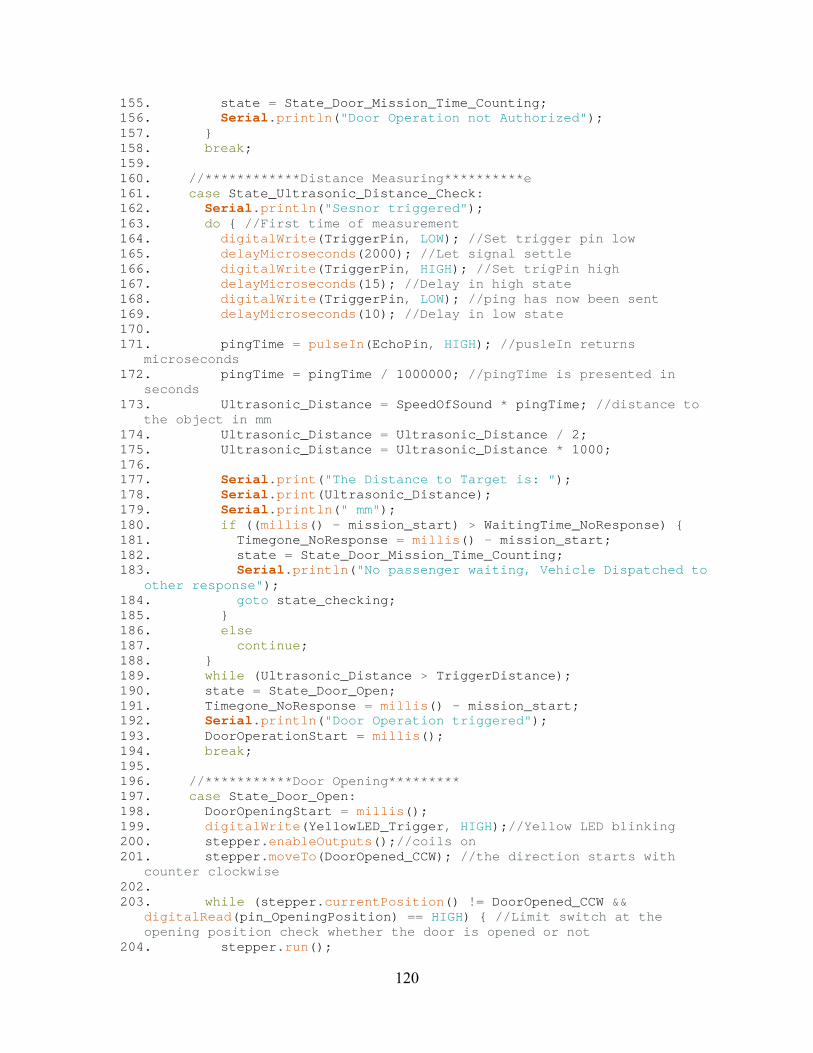
120
155. state = State_Door_Mission_Time_Counting; 156. Serial.println("Door Operation not Authorized"); 157. 158. break; 159. 160. //************Distance Measuring**********e 161. case State_Ultrasonic_Distance_Check: 162. Serial.println("Sesnor triggered"); 163. do //First time of measurement 164. digitalWrite(TriggerPin, LOW); //Set trigger pin low 165. delayMicroseconds(2000); //Let signal settle 166. digitalWrite(TriggerPin, HIGH); //Set trigPin high 167. delayMicroseconds(15); //Delay in high state 168. digitalWrite(TriggerPin, LOW); //ping has now been sent 169. delayMicroseconds(10); //Delay in low state 170. 171. pingTime = pulseIn(EchoPin, HIGH); //pusleIn returns
microseconds 172. pingTime = pingTime / 1000000; //pingTime is presented in
seconds 173. Ultrasonic_Distance = SpeedOfSound * pingTime; //distance to
the object in mm 174. Ultrasonic_Distance = Ultrasonic_Distance / 2; 175. Ultrasonic_Distance = Ultrasonic_Distance * 1000; 176. 177. Serial.print("The Distance to Target is: "); 178. Serial.print(Ultrasonic_Distance); 179. Serial.println(" mm"); 180. if ((millis() - mission_start) > WaitingTime_NoResponse) 181. Timegone_NoResponse = millis() - mission_start; 182. state = State_Door_Mission_Time_Counting; 183. Serial.println("No passenger waiting, Vehicle Dispatched to
other response"); 184. goto state_checking; 185. 186. else 187. continue; 188. 189. while (Ultrasonic_Distance > TriggerDistance); 190. state = State_Door_Open; 191. Timegone_NoResponse = millis() - mission_start; 192. Serial.println("Door Operation triggered"); 193. DoorOperationStart = millis(); 194. break; 195. 196. //***********Door Opening********* 197. case State_Door_Open: 198. DoorOpeningStart = millis(); 199. digitalWrite(YellowLED_Trigger, HIGH);//Yellow LED blinking 200. stepper.enableOutputs();//coils on 201. stepper.moveTo(DoorOpened_CCW); //the direction starts with
counter clockwise 202. 203. while (stepper.currentPosition() != DoorOpened_CCW &&
digitalRead(pin_OpeningPosition) == HIGH) //Limit switch at the opening position check whether the door is opened or not
204. stepper.run();
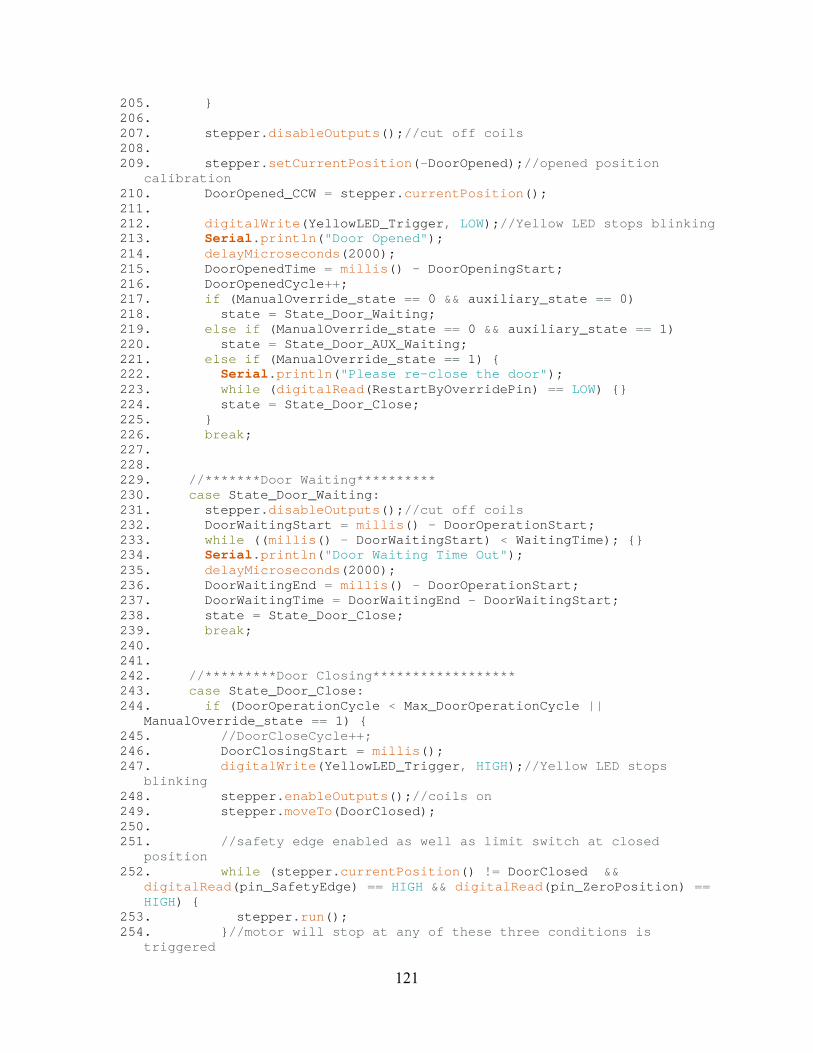
121
205. 206. 207. stepper.disableOutputs();//cut off coils 208. 209. stepper.setCurrentPosition(-DoorOpened);//opened position
calibration 210. DoorOpened_CCW = stepper.currentPosition(); 211. 212. digitalWrite(YellowLED_Trigger, LOW);//Yellow LED stops blinking 213. Serial.println("Door Opened"); 214. delayMicroseconds(2000); 215. DoorOpenedTime = millis() - DoorOpeningStart; 216. DoorOpenedCycle++; 217. if (ManualOverride_state == 0 && auxiliary_state == 0) 218. state = State_Door_Waiting; 219. else if (ManualOverride_state == 0 && auxiliary_state == 1) 220. state = State_Door_AUX_Waiting; 221. else if (ManualOverride_state == 1) 222. Serial.println("Please re-close the door"); 223. while (digitalRead(RestartByOverridePin) == LOW) 224. state = State_Door_Close; 225. 226. break; 227. 228. 229. //*******Door Waiting********** 230. case State_Door_Waiting: 231. stepper.disableOutputs();//cut off coils 232. DoorWaitingStart = millis() - DoorOperationStart; 233. while ((millis() - DoorWaitingStart) < WaitingTime); 234. Serial.println("Door Waiting Time Out"); 235. delayMicroseconds(2000); 236. DoorWaitingEnd = millis() - DoorOperationStart; 237. DoorWaitingTime = DoorWaitingEnd - DoorWaitingStart; 238. state = State_Door_Close; 239. break; 240. 241. 242. //*********Door Closing****************** 243. case State_Door_Close: 244. if (DoorOperationCycle < Max_DoorOperationCycle ||
ManualOverride_state == 1) 245. //DoorCloseCycle++; 246. DoorClosingStart = millis(); 247. digitalWrite(YellowLED_Trigger, HIGH);//Yellow LED stops
blinking 248. stepper.enableOutputs();//coils on 249. stepper.moveTo(DoorClosed); 250. 251. //safety edge enabled as well as limit switch at closed
position 252. while (stepper.currentPosition() != DoorClosed &&
digitalRead(pin_SafetyEdge) == HIGH && digitalRead(pin_ZeroPosition) == HIGH)
253. stepper.run(); 254. //motor will stop at any of these three conditions is
triggered
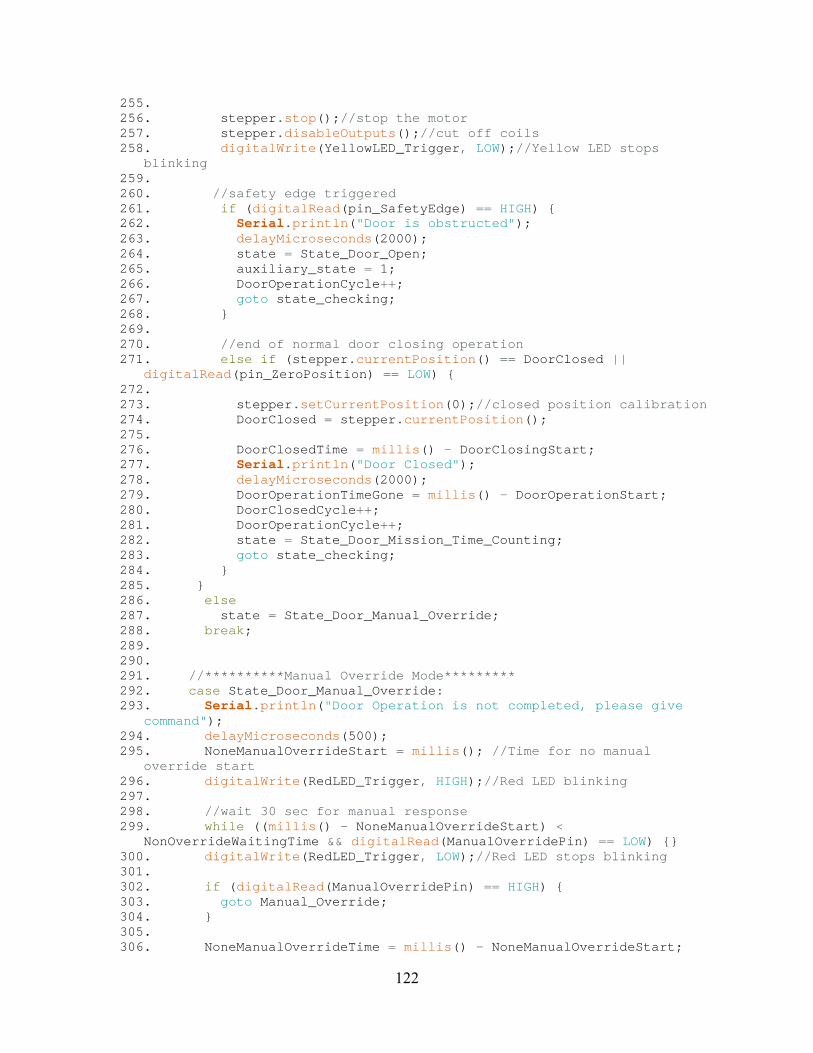
122
255. 256. stepper.stop();//stop the motor 257. stepper.disableOutputs();//cut off coils 258. digitalWrite(YellowLED_Trigger, LOW);//Yellow LED stops
blinking 259. 260. //safety edge triggered 261. if (digitalRead(pin_SafetyEdge) == HIGH) 262. Serial.println("Door is obstructed"); 263. delayMicroseconds(2000); 264. state = State_Door_Open; 265. auxiliary_state = 1; 266. DoorOperationCycle++; 267. goto state_checking; 268. 269. 270. //end of normal door closing operation 271. else if (stepper.currentPosition() == DoorClosed ||
digitalRead(pin_ZeroPosition) == LOW) 272. 273. stepper.setCurrentPosition(0);//closed position calibration 274. DoorClosed = stepper.currentPosition(); 275. 276. DoorClosedTime = millis() - DoorClosingStart; 277. Serial.println("Door Closed"); 278. delayMicroseconds(2000); 279. DoorOperationTimeGone = millis() - DoorOperationStart; 280. DoorClosedCycle++; 281. DoorOperationCycle++; 282. state = State_Door_Mission_Time_Counting; 283. goto state_checking; 284. 285. 286. else 287. state = State_Door_Manual_Override; 288. break; 289. 290. 291. //**********Manual Override Mode********* 292. case State_Door_Manual_Override: 293. Serial.println("Door Operation is not completed, please give
command"); 294. delayMicroseconds(500); 295. NoneManualOverrideStart = millis(); //Time for no manual
override start 296. digitalWrite(RedLED_Trigger, HIGH);//Red LED blinking 297. 298. //wait 30 sec for manual response 299. while ((millis() - NoneManualOverrideStart) <
NonOverrideWaitingTime && digitalRead(ManualOverridePin) == LOW) 300. digitalWrite(RedLED_Trigger, LOW);//Red LED stops blinking 301. 302. if (digitalRead(ManualOverridePin) == HIGH) 303. goto Manual_Override; 304. 305. 306. NoneManualOverrideTime = millis() - NoneManualOverrideStart;
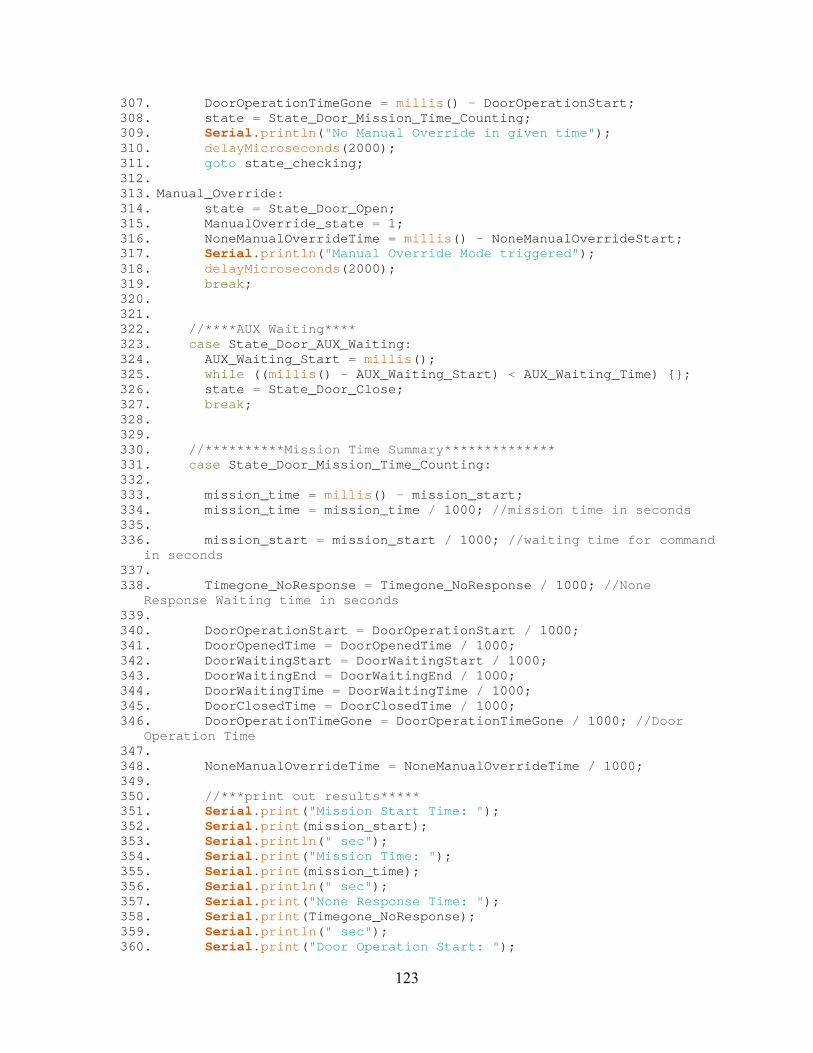
123
307. DoorOperationTimeGone = millis() - DoorOperationStart; 308. state = State_Door_Mission_Time_Counting; 309. Serial.println("No Manual Override in given time"); 310. delayMicroseconds(2000); 311. goto state_checking; 312. 313. Manual_Override: 314. state = State_Door_Open; 315. ManualOverride_state = 1; 316. NoneManualOverrideTime = millis() - NoneManualOverrideStart; 317. Serial.println("Manual Override Mode triggered"); 318. delayMicroseconds(2000); 319. break; 320. 321. 322. //****AUX Waiting**** 323. case State_Door_AUX_Waiting: 324. AUX_Waiting_Start = millis(); 325. while ((millis() - AUX_Waiting_Start) < AUX_Waiting_Time) ; 326. state = State_Door_Close; 327. break; 328. 329. 330. //**********Mission Time Summary************** 331. case State_Door_Mission_Time_Counting: 332. 333. mission_time = millis() - mission_start; 334. mission_time = mission_time / 1000; //mission time in seconds 335. 336. mission_start = mission_start / 1000; //waiting time for command
in seconds 337. 338. Timegone_NoResponse = Timegone_NoResponse / 1000; //None
Response Waiting time in seconds 339. 340. DoorOperationStart = DoorOperationStart / 1000; 341. DoorOpenedTime = DoorOpenedTime / 1000; 342. DoorWaitingStart = DoorWaitingStart / 1000; 343. DoorWaitingEnd = DoorWaitingEnd / 1000; 344. DoorWaitingTime = DoorWaitingTime / 1000; 345. DoorClosedTime = DoorClosedTime / 1000; 346. DoorOperationTimeGone = DoorOperationTimeGone / 1000; //Door
Operation Time 347. 348. NoneManualOverrideTime = NoneManualOverrideTime / 1000; 349. 350. //***print out results***** 351. Serial.print("Mission Start Time: "); 352. Serial.print(mission_start); 353. Serial.println(" sec"); 354. Serial.print("Mission Time: "); 355. Serial.print(mission_time); 356. Serial.println(" sec"); 357. Serial.print("None Response Time: "); 358. Serial.print(Timegone_NoResponse); 359. Serial.println(" sec"); 360. Serial.print("Door Operation Start: ");
124
361. Serial.print(DoorOperationStart); 362. Serial.println(" sec"); 363. Serial.print("Door Opened Time: "); 364. Serial.print(DoorOpenedTime); 365. Serial.println(" sec"); 366. Serial.print("Door Waiting Start: "); 367. Serial.print(DoorWaitingStart); 368. Serial.println(" sec"); 369. Serial.print("Door Waiting End: "); 370. Serial.print(DoorWaitingEnd); 371. Serial.println(" sec"); 372. Serial.print("Door Waiting Time: "); 373. Serial.print(DoorWaitingTime); 374. Serial.println(" sec"); 375. Serial.print("Door Closed Time: "); 376. Serial.print(DoorClosedTime); 377. Serial.println(" sec"); 378. Serial.print("Door Operation Time: "); 379. Serial.print(DoorOperationTimeGone); 380. Serial.println(" sec"); 381. Serial.print("Time to Override: "); 382. Serial.print(NoneManualOverrideTime); 383. Serial.println(" sec"); 384. Serial.print("Times Door Opened: "); 385. Serial.println(DoorOpenedCycle); 386. //Serial.print("Attempts Door Closing: "); 387. //Serial.println(DoorCloseCycle); 388. Serial.print("Times Door Closed: "); 389. Serial.println(DoorClosedCycle); 390. Serial.print("Times Door Operation: "); 391. Serial.println(DoorOperationCycle); 392. Serial.println(" "); 393. state = State_Authorization_Check; 394. break; 395. 396.