Embed Size (px)
Citation preview

DESIGN OF CONTROLLED LOW STRENGTH MATERIAL FOR BEDDING AND
BACKFILLING USING HIGH PLASTICITY CLAY
by
ANIL KUMAR RAAVI
Presented to the Faculty of the Graduate School of
The University of Texas at Arlington in Partial Fulfillment
of the Requirements
for the Degree of
MASTER OF SCIENCE IN CIVIL ENGINEERING
THE UNIVERSITY OF TEXAS AT ARLINGTON
AUGUST 2012

Copyright © by Anil Kumar Raavi, 2012
All Rights Reserved
iii
1ACKNOWLEDGEMENTS
I extend my sincere thanks and exceptional gratitude to my advisor, Prof.
Anand J. Puppala for his immense support and constant motivation throughout
the research. He had always been pinnacle of motivation and hard work. I am
indebted to him and grateful forever for the kind of help extended to me during
my master’s program at UTA. I owe my sincere thanks to Dr. Laureano Hoyos,
Associate Professor of Civil Engineering and Dr. Xinbao Yu, Assistant
Professor of Civil Engineering for gracefully accepting to be on my examination
committee. I would like to thank them for their esteemed guidance in preparing
an effective end product. I would like to thank TRWD for giving me an
opportunity to work on present research project.
I am extremely grateful and obliged to Dr. Bhaskar Chittoori, Faculty
Associate of Civil Engineering, for his excellent guidance and support
throughout the course of this research. My special thanks are due to my
colleagues Raja veerendra Yenigalla, Naga sreenivasu Talluri, Aravind Pederla,
Dr. Thornchaya (Pomme) Weijrunsikul, Ahmed Gaily, Rajini kanth reddy
Karduri, Tejo Vikash Bheemasetti, Minh Le, Pinit (Tom) Ruttanaporamakul,
Ranjan Rout, Ujwal Patil, Justin Thomey, and Priya Lad.
I am indebted to Mom, Dad, Sirisha and Sasi for their faith in me and for
their unending encouragement and excellent support. Furthermore, I would like

iv
to thank my friends Ashok Raavi, Kishore Kommineni, Sandeep Suryadevara,
Dinesh Kanagala and Venu madhav Nadella who helped me by sharing my
responsibilities whenever needed at home country during my course of study.
July 18, 2012

v
2ABSTRACT
DESIGN OF CONTROLLED LOW STRENGTH MATERIAL FOR BEDDING
AND BACKFILLING USING HIGH PLASTICITY CLAY
Anil Kumar Raavi, M.S.
The University of Texas at Arlington, 2012
Supervising Professor: Anand J. Puppala
Flowable fill or Controlled Low Strength Material (CLSM) is a self-
compacted cementitious material used in the field in the place of compacted fill.
It is also known as unshrinkable fill, controlled density fill, flowable mortar,
plastic-soil cement, soil-cement slurry, and others. The advantages of this
material include lesser soil settlements, elimination of compaction, and lower
costs when compared to chemically treated and compacted subsoils. CLSMs
have a wide range of applications such as using them as a backfill, bedding
material, trench filling material, void filling material, bridge abutment and
embankment materials and also in pavement bases.

vi
Current research is aimed at the design of CLSMs using native soils that
can be used as bedding and backfilling materials to support a large pipeline
project. Native soils were selected as fine material mainly due to excavation in
the site will lead to large amounts of excavated fills and hence any reuse of this
material will enhance sustainability components of the projects. This will also
result in significant cost savings to the construction project. Several mix designs
using native high plasticity clays were attempted to establish the optimum
quantities of binders and water. Set accelerator was also used to lower the
setting time of some of the mix designs. All these mix designs were evaluated
for their flowability, density, compressive strength and setting time properties as
per the available ASTM standards.
Finally, six mix designs were formulated with setting time as limitation
based on the property specifications for their use as a pipeline fill material at
different zones. Test results and analysis indicates that high plasticity clay can
be successfully used as aggregate in CLSM mixes. Further recommendations
were made to study the durability of strengths achieved.

vii
3TABLE OF CONTENTS
ACKNOWLEDGEMENTS .................................................................................. iii
ABSTRACT ........................................................................................................ v
LIST OF ILLUSTRATIONS ............................................................................... xi
LIST OF TABLES............................................................................................ xiv
1. INTRODUCTION ............................................................................................ 1
1.1 General ...................................................................................... 1
1.2 Project Details and Research Objectives ................................... 2
1.3 Thesis organization and Summary ............................................. 4
2. LITERATURE REVIEW .................................................................................. 6
2.1 Introduction ................................................................................ 6
2.2 Historical Background ................................................................ 6
2.3 Advantages and Limitations of CLSM ........................................ 7
2.4 Applications of CLSM ................................................................. 9
2.4.1 Bridge Approach Repairs ......................................... 11
2.4.2 Pipeline Applications ................................................ 14
2.4.3 Void Filling ............................................................... 18
2.5 CLSM-Components .................................................................. 19
2.5.1 Binders .................................................................... 19
2.5.1.1 Cement ...................................................... 19

viii
2.5.1.2 Cement Kiln Dust (CKD) ............................ 20
2.5.1.3 Lime ........................................................... 21
2.5.1.4 Fly Ash ....................................................... 22
2.5.1.5 Dry Scrubber Ash ....................................... 24
2.5.1.6 Wood Ash .................................................. 25
2.5.2 Phosphogypsum (PG) ............................................. 25
2.5.3 Water ....................................................................... 26
2.5.4 Coarse Aggregates .................................................. 26
2.5.5 Conventional Fine Aggregates................................. 27
2.5.5.1 Concrete Sand ........................................... 28
2.5.5.2 Foundry Sand ............................................ 28
2.5.6 Alternative Fine Aggregates..................................... 31
2.5.6.1 Scrap Tire Rubber ...................................... 31
2.5.6.2 Recycled Glass .......................................... 32
2.5.6.3 Native Soil .................................................. 33
2.5.7 Chemical Admixtures ............................................... 34
2.6 CLSM - Properties .................................................................... 35
2.6.1 Flowability ................................................................ 36
2.6.2 Setting time .............................................................. 36
2.6.3 Unconfined Compressive Strength .......................... 37
2.6.4 Density and Excavatability ....................................... 38
2.7 Summary .................................................................................. 38

ix
3. LABORATORY TESTING PROGRAM ......................................................... 40
3.1 Introduction .............................................................................. 40
3.2 Selection of soils ...................................................................... 40
3.3 Research variables................................................................... 46
3.4 CLSM Mix Design .................................................................... 47
3.5 Sample preparation .................................................................. 48
3.6 Tests Conducted on Native Soil ............................................... 51
3.6.1 Sieve Analysis ......................................................... 51
3.6.2 Hydrometer Analysis ................................................ 51
3.6.3 Atterberg Limits ........................................................ 52
3.7 Tests Conducted on CLSM Mixes ............................................ 53
3.7.1 Density Test ............................................................. 53
3.7.2 Flow Test ................................................................. 55
3.7.3 Setting Time............................................................. 56
3.7.4 Unconfined Compressive Strength Test .................. 58
3.8 Summary .................................................................................. 60
4. RESULTS AND DISCUSSION OF LABORATORY CLSM MIX DESIGN ..... 62
4.1 Introduction .............................................................................. 62
4.2 Sample Notation and Mix Proportions ...................................... 62
4.3 Basic Soil Properties Test Results ........................................... 65
4.4 CLSM Test Results and Analysis ............................................. 66
4.4.1 Flow Test Results .................................................... 66

x
4.4.1.1 Effect of binder dosage on flowability ......... 70
4.4.1.2 Effect of binder types on flowability ............ 73
4.4.1.3 Effect of set accelerator on flowability ........ 74
4.4.2 Density Test Results ................................................ 75
4.4.3 Compressive strength test results ............................ 78
4.4.3.1 Effect of binder dosages ............................ 85
4.4.3.2 Effect of Binder types used ........................ 89
4.4.3.3 Effect of set accelerator ............................. 90
4.4.4 Elastic Moduli of CLSM Mixes and Results.............. 92
4.4.5 Setting time .............................................................. 97
4.4.6 Excavatability ......................................................... 100
4.5 Recommended CLSMs and Summary ................................... 105
5. SUMMARY, CONCLUSIONS AND RECOMMENDATIONS ....................... 106
5.1 Introduction ............................................................................ 106
5.2 Summary and Conclusions .................................................... 106
5.3 Recommendations for Future Research................................. 109
7. REFERENCES…………………………………………………………………..110
6. BIOGRAPHICAL INFORMATION ............................................................... 118

xi
LIST OF ILLUSTRATIONS
Figure Page Figure 2.1 Applications of CLSM by state in 1998 (Folliard et al. 2008)............ 10
Figure 2.2Placing rapid-setting CLSM for bridge approach (Du et al. 2006) ..... 12
Figure 2.3Excavation of backfill area at CLSM approach embankment (Snethen et al. 1998) ........................................................................................................ 13 Figure 2.4: Types of fills (a) Gap fill (b) Trench fill (Finney et al. 2008) ............. 15
Figure 2.5 End view of pipeline with CLSM (Howard and Bowles, 2008).......... 16
Figure 2.6 Placing of CLSM at test section (Finney et al. 2008) ....................... 17
Figure 3.1 Selected boring locations ................................................................. 43
Figure 3.2 B14 Bore log .................................................................................... 44
Figure 3.3 B15 Bore log .................................................................................... 45
Figure 3.4 Flow chart of Laboratory mix design procedure for native soil based CLSM ................................................................................................................ 48
Figure 3.5 Soil-binder mixer ............................................................................. 50
Figure 3.6: Basic soil tests (a) Sieve analysis and (b) Hydrometer analysis ..... 52
Figure 3.7. Steel measure for density measurement ........................................ 54
Figure 3.8 Acrylic plate with the flow cylinder ................................................... 56
Figure 3.9 Vicat's apparatus ............................................................................. 58
Figure 3.10 UCS test setup with Data Acquisition System ................................ 59
Figure 3.11 Typical 28 day UCS sample before testing .................................... 60
Figure 4.1 Flow test performed for 15% cement with 72 % Water content: ...... 67

xii
Figure 4.2 Variation of flowability with water content for A_C6 ......................... 68
Figure 4.3 Variation of flowability with water content for B_C6 ......................... 69
Figure 4.4 Variation of flowability with binder dosage with cement alone ......... 72
Figure 4.5 Variation of flowability with binder dosage with cement and lime..... 72
Figure 4.6 Variation of flowability with binder types .......................................... 73
Figure 4.7 Variation of flowability with set accelerator for soil A ....................... 74
Figure 4.8 Variation of flowability with set accelerator for soil B ....................... 75
Figure 4.9 Density values for soil A compared to TRWD specifications............ 77
Figure 4.10 Density values for soil B compared to TRWD specifications.......... 78
Figure 4.11 Stress-Strain plots of soil A with 15% cement ................................ 80
Figure 4.12 Stress-Strain plots of soil B with 15% cement ................................ 80
Figure 4.13 Stress-Strain plots of soil B with 5% cement and 20% fly ash ...... 81
Figure 4.14 Stress-Strain plots of soil B with 5% cement and 20% lime ........... 81
Figure 4.15 Stress-Strain plot of soil A without set accelerator ......................... 82
Figure 4.16 Stress-Stain plot of soil A with set accelerator ............................... 82
Figure 4.17 Variation of compressive strength with respect to binder dosage for soil A ................................................................................................................. 87
Figure 4.18 Variation of compressive strength with respect to binder dosage for
soil B ................................................................................................................. 87
Figure 4.19 Variation of compressive strength with binder dosage for cement-lime mixes for soil A .......................................................................................... 88
Figure 4.20 Variation of compressive strength with binder dosage for cement-lime mixes for soil B .......................................................................................... 88
Figure 4.21 Variation of compressive strengths with binder types for soil A ..... 89

xiii
Figure 4.22 Variation of compressive strength with binder types for soil B ....... 90
Figure 4.23 Variation of compressive strength with respect to set accelerator for soil A ................................................................................................................. 91
Figure 4.24 Variation of compressive strength with respect to set accelerator for soil B ................................................................................................................. 92 Figure 4.25 Variation of E/UCS with cement percentage for soil A ................... 95
Figure 4.26 Variation of E/UCS with cement percentage for soil B ................... 96
Figure 4.27 Variation of E/UCS with lime percentage for soil A ........................ 96
Figure 4.28 Variation of E/UCS with lime percentage for soil B ........................ 97
xiv
4
5LIST OF TABLES
Table Page Table 2.1 Applications of CLSM by various DOTs (Riggs and Keck, 1998 ) ..... 11
Table 2.2 Cost comparison of five approach embankments (Snethen et al. 1998)................................................................................................................. 14 Table 3.1 Research variables considered in this study ..................................... 46
Table 4.1 List of materials and symbols used ................................................... 63
Table 4.3 Sample notations and quantities of set accelerator used (8% of binder)............................................................................................................... 65
Table 4.4 Sample notations and quantities of set accelerator used (8% of dry soil) ................................................................................................................... 65 Table 4.5 Physical properties of selected soiils ................................................ 66
Table 4.6 Flow test results for soil A ................................................................. 71
Table 4.7 Flow test results for soil B ................................................................. 71
Table 4.8 Density values for soil A .................................................................... 76
Table 4.9 Density values for soil B .................................................................... 76
Table 4.10 Compressive test results of CLSM mixes for soil A ......................... 84
Table 4.12 Moduli results for soil A ................................................................... 93
Table 4.13 Moduli results for soil B ................................................................... 94
Table 4.14 Setting time test results for all mix proportions without set accelerator ........................................................................................................ 98
Table 4.15 Setting time results with 8% set accelerator (weight of binder) ....... 99
Table 4.16 Setting time results with 8 % set accelerator (weight of soil)......... 100

xv
Table 4.17 Excavatability of CLSM mixes ....................................................... 102
Table 4.18 Recommended CLSM mix designs without set accelerator .......... 103
Table 4.19 Recommended CLSM mix designs with set accelerator………104

1
CHAPTER 1
1INTRODUCTION
1.1 General
Disposal of excavated trench material from a pipeline project is
becoming a major concern in terms of sustainability and overall cost. The
material excavated has to be transported several miles before it could be
dumped into landfills and new material which satisfies the requirements as
backfill material has to be borrowed to fill the pipeline trenches; all these make
a big impact on environment by means of traffic pollution and are also major
contribution factors for increasing the overall cost of the construction project
(Karduri, 2011). Though part of the excavated material can be used as a
backfill, the remaining material is typically dumped in landfills and landfilling is
not always cost effective or an ecofriendly option. Effective reuse of the
excavated material can address both the aforementioned concerns.
Haunch material in pipeline construction has its own significance in
distributing the loads from the pipelines. It should be strong enough and should
stay intact with the pipe structure and should be able to absorb the stresses
with the bedding materials. Failure in the aforementioned properties of haunch
material results in induction of large stresses at the contact points between pipe
and bedding zone which eventually results in the development of tension cracks
2
in the pipe’s inner section. Compaction of haunch material is also not an easy
task as it may result in the damage of pipe.
CLSM is an effective option to satisfy the aforementioned needs for
haunch material. Therefore, Controlled Low Strength Material (CLSM) is often
used as a bedding material and is also used as a backfilling material for pipeline
construction as this material can be used to easily fill the voids without
compaction and meets the strength requirements to bear the pipe load or to
transfer the load to surrounding soil. CLSM is generally made of binders such
as cement, cement kiln dust, fly ash, dry scrubber ash, wood ash,
phosphogypsum and aggregates that may include both not limited to concrete
sand, foundry sand, recycled glass, scrap tire rubber and others. Sometimes
chemical additives are also found as components which are often used to
enhance some target CLSM properties.
This research attempts to replace the conventional aggregates with the
native high plasticity soil and to formulate a CLSM mix design that meets the
specified properties for an effective backfilling material. This in turn can reduce
the overall costs of the project; can reduce the environmental impacts that are
caused by dumping of excavated trench material in landfills and also can
enhance the reuse of excavated material.
1.2 Project Details and Research Objectives
The Integrated Pipeline (IPL) project involves the design and installation
of a 147 mile pipeline that will bring additional water supplies to Dallas/Fort

3
worth metroplex. Water is collected from lakes such as Richland Chambers,
Cedar creek and Lake Palestine and is transferred to metroplex through this
pipeline. Large amounts of trench material have to be excavated and to be
dumped as landfill (Karduri, 2011).
Using native soil in the place of conventional aggregate will greatly
reduce the overall project costs and will enhance the sustainability of the project
as it eliminates dumping of excavated material. But the CLSM made of native
soil should possess the major target properties such as flowability, compressive
strength, density and setting time.
The main objective of this thesis research is to formulate the mix design
of CLSM that meets the four target properties by using locally available high
plasticity soil from Eagle Ford geological formation. High plasticity soil from
Eagle Ford formation is selected as an initial step in using the native soil in
CLSM, because if CLSM made of this soil satisfies the CLSM usage
requirements, then it can lead to use of these mixing in most construction
projects that are built on clayey soils. Various tasks involved in addressing the
above mentioned research objective are listed below:
1. Establish the water content required for flowability for all the mix designs
that are to be evaluated for other CLSM properties.
2. Evaluate densities of each mix design proposed which can affect the
excavatability of the CLSM for future repairs of the pipeline.

4
3. Evaluate the compressive strengths of all the proposed mixes and screen
out the mixes whose compressive strengths are within the specified
range.
4. Perform setting time tests in order to evaluate the hardening time required
for each mix and also lowering the setting time by using set accelerator.
5. Evaluate the performance of proposed CLSM mix designs along with set
accelerator and screen the final mixes that satisfy all the property
requirements.
1.3 Thesis organization and Summary
Chapter 2 presents the available literature on history and development of
CLSMs from the past four decades. Advantages of CLSMs over other
conventional methods of backfilling, bedding, and bridge approach repairs are
listed. Application areas of CLSMs are briefly discussed. Moreover, these
application areas are supported by case studies made by numerous
researchers. Components of CLSMs such as cement, cement kiln dust, fly ash,
lime, concrete sand, foundry sand; chemical additives are presented in detail.
Typical properties of CLSMs are also discussed.
Chapter 3 explains the criteria followed here for the selection of soils and
research variables. It also illustrates the mix design procedures followed along
with soil specimen preparation. Various test procedures involved in testing the
native soil and also in determining the properties of CLSM are explained.

5
Chapter 4 includes the test results obtained on native soil and on CLSM
mix designs. Water contents required for various mix designs are determined.
Compressive strengths of formulated mixes are analyzed followed by density
measurements and setting time measurements for all the mixes. Variations in
properties with respect to set accelerator are also analyzed.
Chapter 5 presents the summary and conclusions of the observations
and findings obtained from the research study. Also, recommendations are
provided for future study.

6
CHAPTER 2
2LITERATURE REVIEW
2.1 Introduction
This chapter provides comprehensive literature review of Controlled Low
Strength Material (CLSM) including its historical development, material
composition, proportions, various application areas and advantages over other
conventional materials. Background and literature review presented in this
chapter is based on the reports from American Concrete Institute (ACI),
National Cooperative Highway Research Program (NCHRP) as well as by
conventional library and materials journals, ASTM special publication and
Transportation Research Record (TRB).
2.2 Historical Background
In the early 1970’s, during the initial construction of the Enrico Fermi II
Nuclear station in Monroe, Michigan, engineers from the Detroit Edison
Company and Kuhlman corporation in Toledo, Ohio, tried to incorporate large
amount of fly ash possible in concrete in order to reduce their stock piling in
each concrete mix which lead to the discovery of low strength materials
(Brewer, 1994). The University of Toledo in collaboration with these two
companies performed a series of laboratory tests to confirm that appropriate

7
and economical low-strength materials could be produced with fly ash as
additive (Folliard et al. 2002).
CLSM was in use for the past four decades identified with various terms
including flowable fill, unshrinkable fill, controlled density fill, flowable mortar,
plastic-soil cement, soil-cement slurry, and K-Krete® (Folliard et al. 2008). The
term “controlled low strength material or CLSM” is approved by the ACI
Committee 229 in 1984 and this term is often used in the literature. Standard
components of CLSMs are Portland cement, Fly ash, fine aggregates, and
water. These typically develop compressive strengths around 0.7 MPa (100 psi)
after 28 days of curing. Most of the current CLSM applications such as back
fills, conduit bedding, erosion control, void filling require unconfined
compressive strengths of 300 psi or less (ACI 229R-99). This lower strength
requirement is necessary to allow for future excavations such as repairing a
pipeline backfilled with CLSM (ACI 229R-99). Some the applications of the
CLSM materials are discussed in the following section.
2.3 Advantages and Limitations of CLSM
CLSM is a self-compacted, cementitious material, used primarily as a
backfill in lieu of compacted fill (ACI 229R-99). The advantages of using
controlled low strength material in the place of concrete material as per ACI
229R-99 are presented in the following:

8
1. Using locally available materials, ready mixed concrete suppliers can
produce CLSMs to meet most project specifications which make it readily
available.
2. Depending on type and location of void to be filled, CLSM can be placed
by chute, conveyor, pump or bucket, because CLSM is self-leveling, it
needs little or no spreading or compacting. This speeds the construction
and reduces the labor requirements.
3. CLSM mixtures can be adjusted to meet specific fill requirements. Mixes
can be adjusted to improve flowability property. More cement or fly ash
can be added to increase strength. Admixtures can be added to adjust
setting times and other performance characteristics. Adding foaming
agents to CLSM produces lightweight, insulating fill which shows the
versatile nature of CLSM.
4. Load-carrying capacities of CLSM are typically higher than those of
compacted soil or granular fill. CLSM is also less permeable, thus more
resistant to erosion.
5. CLSM sets quickly and supports the traffic within several hours;
downtime for pavement repairs is minimal.
6. This material exhibits low settlement properties.
7. CLSM reduces the excavation costs by allowing narrow trenches and in
turn eliminates the compaction equipment required in conventional
backfilling methods.

9
8. Use of CLSM improves workers safety as the workers do not have to get
in to the trenches to place the material.
9. CLSM having the compressive strengths of 0.3 to 0.7 MPa (50 to 100
psi) is easily excavated using conventional digging equipment, yet is
strong enough for most backfilling needs.
10. CLSM containing fly ash benefits environment by making use of this
industrial by-product generated by power plans that burn coal to
generate electricity.
Few limitations of this material are presented in the following (Collins et
al. 1991):
1. The CLSMs need anchorage to hold the light-weight pipes to avoid
floating during construction.
2. CLSMs need confinement before setting.
3. Mixtures having high strength are difficult to excavate.
4. They exert lateral pressure on structures while in fluid condition.
2.4 Applications of CLSM
CLSM has wide range of applications in construction works that include
road cut backfill, utility embedment, pipe bedding, bridge abutment and
embankment, void filling, seawall backfill, erosion control and pavement bases.
Regarding the application areas, a survey was conducted by Folliard et al. in
1998 to all the states in which forty-four states specified their application areas

10
and six were not responded. Figure 2.1 shows the application areas by each
state in 1998 (Folliard et al. 2008). It can be observed that major applications
were backfill and bedding material.
Figure 2.1 Applications of CLSM by state in 1998 (Folliard et al. 2008)
Another survey was carried out by Riggs and Keck (1998) by contacting
Departments of Transportation (DOTs) to assess application areas of CLSM in
southeastern states. The results of this survey are summarized in Table 2.1. It
can be observed from this table that most states in the southeast USA are using
CLSM primarily as a backfill or bedding alternatives to conventional backfill.

11
Table 2.1 Applications of CLSM by various state DOTs (Riggs and Keck, 1998 )
State Applications
Alabama Backfill for drainage structures and cuts
Florida Beddings; encasements; closures for tanks, pipes; trench
backfill
Georgia Beddings; encasements; closures for tanks, pipes; trench and
abutment backfill
N. Carolina Filling underground storage pipes and pipe culverts; backfilling
culverts, bridges
S. Carolina Backfilling under foundations, abandoned pipelines, culverts,
tanks, utility trenches
Virginia In lieu of compacted soil or aggregate backfill
The following sections present information on various applications of
CLSMs in a variety of civil engineering projects with case studies as applicable.
2.4.1 Bridge Approach Repairs
Approach slab of a bridge is often subjected to settlements leading to the
bump at the end of the bridge causing riding discomforts to travelers. Approach
slab issues are mainly due to settlements in the compacted fill. Due to its low
settlement potential and ease of handling, CLSM can serve as a desirable
alternative for conventional compacted fills (Folliard et al. 1999).
In a case study reported by Du et al. (2006), Texas Department of
Transportation (TxDOT) with the collaboration of NCHRP Project 24-12(1)
research team, developed a suitable mixture to repair severe settlement of two
bridge approaches, located at the Branch Sala Trillo on Loop 1604 between I-
10 and I-35 in San Antonio (Du et al. 2006) Locally available concrete sand was

12
used as aggregate whereas Class C fly ash was used as binder. The
uniqueness of this mix used by the researchers was that they did not use any
Portland cement as fly ash alone met the hardening and early strength
requirement because of its high calcium oxide (CaO) content. Three mix
proportions with sand-fly ash ratios of 5,6, and 7 by mass were formulated and
two mixtures with sand:flyash:water mass ratios of 5:1:0.75 and 6:1:0.91 having
1 hour and 3 hour set times were selected for field implementation based on
optimum values of flowability, strength and resilient modulus. Earlier mix was
only used when there was insufficient time for the 3-hour set mixture to harden
adequately for subsequent hot-mixing asphalt paving in order to open the traffic.
Figure 2.2 shows the backfilling of bridge approach at San Antonio.
Figure 2.2 Placing rapid-setting CLSM for bridge approach (Du et al. 2006)
In another case study reported by Snethen et al. (1998), Oklahoma
Department of transportation (ODOT) adopted five different construction
methods to mitigate bump at five different approaches of bridges which was

13
caused by the consolidation of soil underneath the approach slab. These
methods include control soil, geotextile reinforced wall, controlled low strength
material, dynamically compacted granular backfill, and vibrated granular
backfill. Out of which CLSM was found to be a simple and reasonably cost
effective material to reduce the potential for developing bump at the end of the
bridge. The lateral earth pressures and settlements of an approach slab of a
bridge system were less than the other options studied. Table 2.2 compares the
equipment, construction time, and cost of the five approach embankments
involved in these research. Figure 2.3 shows the excavation of backfill area for
placing CLSM.
Figure 2.3 Excavation of backfill area at CLSM approach embankment (Snethen et al. 1998)

14
Table 2.2 Cost comparison of five approach embankments (Snethen et al. 1998)
Approach
Embankment Quantities
Estimated
Cost ($)
Construction
Days
Equipment
Required
Unclassified
Borrow
(Control)
229 m3 1500 4 Loader, pad vibrator
Geotextile
Reinforced
Wall
287 m3 25000 5
Loader, pad
vibrator, concrete
spreaders, water
truck
CLSM 159 m3 14560 2 Concrete trucks,
concrete vibrator
Dynamically
Compacted
Granular Fill
234 m3 15000 5
Crane, concrete
block, pad vibrator,
water truck
Flooded and
Vibrated
Granular Fill
234 m3 16000 2 Water truck,
concrete vibrator
2.4.2 Pipeline Applications
With pipeline applications, CLSM can function in two ways: Gap fill or
Trench fill (Howard, 1996). Gap fill applications use a U-shaped trench with
narrow gap (<12 inches) between the pipeline and trench wall as shown in
Figure 2.3a. In this case, pipe loads pass through CLSM zone in to the native
soil. This can be attributed to the low thickness of the CLSM zone in Gap fill
applications (Howard, 1996).
15
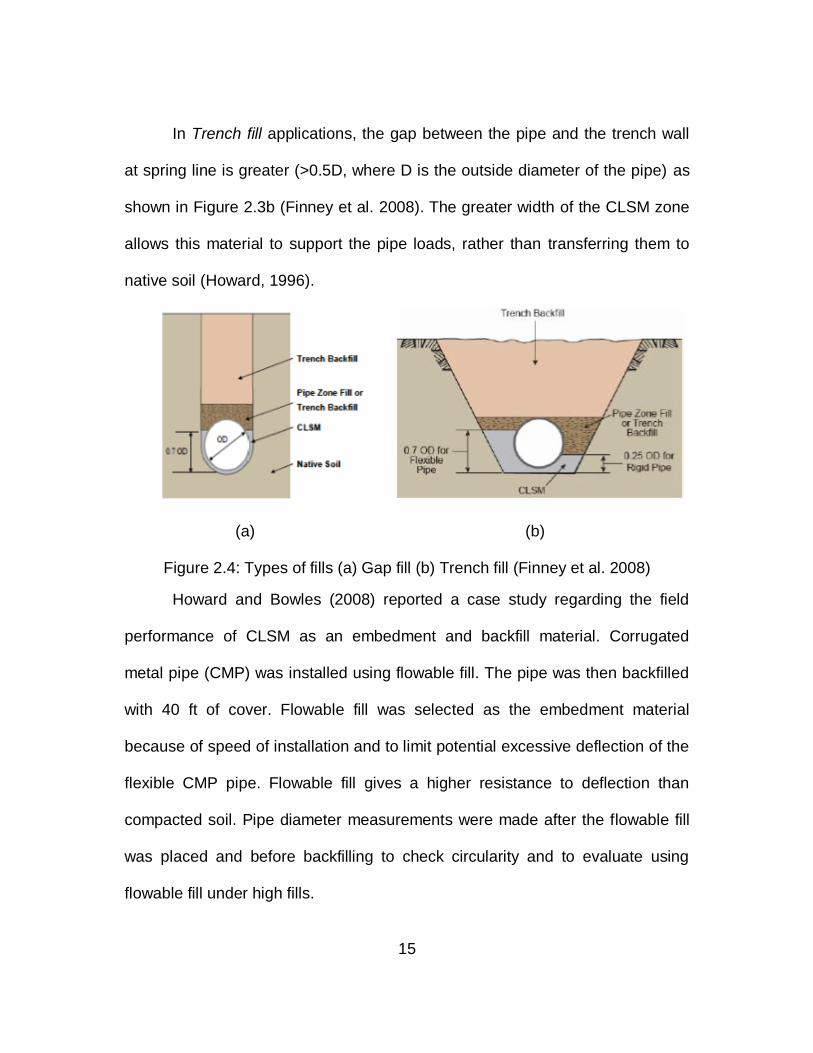
In Trench fill applications, the gap between the pipe and the trench wall
at spring line is greater (>0.5D, where D is the outside diameter of the pipe) as
shown in Figure 2.3b (Finney et al. 2008). The greater width of the CLSM zone
allows this material to support the pipe loads, rather than transferring them to
native soil (Howard, 1996).
(a) (b)
Figure 2.4: Types of fills (a) Gap fill (b) Trench fill (Finney et al. 2008)
Howard and Bowles (2008) reported a case study regarding the field
performance of CLSM as an embedment and backfill material. Corrugated
metal pipe (CMP) was installed using flowable fill. The pipe was then backfilled
with 40 ft of cover. Flowable fill was selected as the embedment material
because of speed of installation and to limit potential excessive deflection of the
flexible CMP pipe. Flowable fill gives a higher resistance to deflection than
compacted soil. Pipe diameter measurements were made after the flowable fill
was placed and before backfilling to check circularity and to evaluate using
flowable fill under high fills.

16
In 2007, 4.5 years after installation, the pipe diameters were again
measured to verify the circularity and to see how the flowable fill had performed.
The 2007 measurements showed that very little deflection or change in pipe
shape had occurred in the CMP pipe. The installation was part of the Ridges
Basin Inlet Conduit of the Animas-La Plata Project, a pumped storage system
being built by the U. S. Bureau of Reclamation (Howard and Bowles, 2008).
Figure 2.5 shows the hardened CLSM after removing casings.
Figure 2.5 End view of pipeline with CLSM (Howard and Bowles, 2008)
In a case study reported by Finney et al. (2008), the City of West
Sacramento, California used CLSM as a bedding material and also as backfill to
a point above the pipe crown for the construction of 6.4 km (4 mi.) pipeline. In
this case, CLSM was used as trench fill application all along the pipeline. Two
types of CLSM mixes were used in this application, the CLSM made with
conventional aggregates is used up to the springline of pipeline and the portion

17
above it is filled with CLSM made with the native soil which consisted of clay
and sandy silt. They observed that the cost of construction was greatly reduced
when compared to similar projects without CLSM applications. A picture
showing the placement of CLSM at test section is shown in Figure 2.6
Figure 2.6 Placing of CLSM at test section (Finney et al. 2008)
In another case study reported by Gardner (1998), two types of quick
setting CLSM mixtures were used by Seattle Public Utilities, Washington to
replace an old 914-mm water main that was located under numerous train
tracks in downtown Seattle. Since the time allotted to complete the project was
very short, CLSM was chosen as fill material due to its quick setting nature. The
strength of CLSM mixtures varied from 0.34 to 0.83 MPa. The work beneath
each track was completed in short time of half a day, with the use of quick
setting CLSM, this clearly shows the potential of CLSM in reducing the project
time and advancing construction (Finney et al. 2008).

18
2.4.3 Void Filling
Voids are formed due to the continuous erosion of fill material mainly due
to run off water in case of approach slabs or due to tidal currents in case of
seawalls. Conventional granular backfill material is almost impossible to install
and compact in these kinds of situations. CLSM was found to be viable option
as it needs no compaction and easy to operate in voids when compared to
other conventional methods.
According to the case study referred by Mason (1998), The United
States Navy at Rough & Ready Island, Stockton, CA, installed a number of
wharfs along the San Joaquin River side. During the installation works, it was
noticed that there was a large void under the slab, running its entire length (183
m). The US Navy used controlled density fill (CDF) material to fill the void. A
visual inspection showed that there was no settlement of the material. The total
costs were reduced by more than 80% of the amount estimated for placing and
compacting conventional granular backfill.
The U.S. Army Corps of Engineer Waterways Experiment Station (WES)
used CLSM in a microtunneling application on a trial basis (Green et al. 1998).
The CLSM mixture consists of Class C fly ash and water. A fly ash based
CLSM without aggregate is easier to pump on the microtunneling machine.
During the microtunneling field material, CLSM was used to stabilize a tunnel
excavation while retracting the microtunneling machine through unstable,
flooded, running sand (Green et al. 1998). The void left by the retracted tunnel

19
machine was filled with the CLSM to provide continuous support to the
excavation and avoid settlement of the ground surface. Reentry of the
microtunneling machine was easy due to low strength development of CLSM.
2.5 CLSM-Components
The components of controlled low strength material differ depending on
the availability of component materials as wells as on requirements and
application area of CLSM. The main components of CLSM are aggregates (fine
and coarse), cement, fly ash, lime and water. Admixtures are also used to
enhance or retard some of the desirable properties such as setting time and
density depending on the requirement. All these components are discussed
individually in the following sections.
2.5.1 Binders
2.5.1.1 Cement
Although any type of Portland cement can be used in CLSM. ASTM
C150 Type I is the most commonly used (Folliard et al. 2008). Portland cement
predominantly consists of calcium silicate, which reacts with water to form hard
material. Cement is generally used in small proportions of less than 4% of the
total weight of CLSM mixture (ACI 1999). Cement is a hydraulic material that
sets and hardens after reacting with water, through hydration reactions. The
end product will be a solidified mass with enhanced strength. Cement is often
the binding material used in flowable fills to achieve sufficient cohesion and
strength to the mix material (ACI 229R-99).

20
Water-cement ratio plays an important part in controlling strength and
flowability (Pierce et al. 2002). A higher water-cement ratio improves the flow
properties but reduces the strength. As the water content of the mix increases,
the strength of the material decreases with constant proportion of cement and
vice-versa (Folliard et al. 2002). Curing temperature is another factor which
affects the strength development of Portland cement-based CLSM materials.
Generally, higher curing temperatures tend to increase the early strength due to
hydration property of the cementitious material, but tend to affect long term
strength adversely (Folliard et al. 2003). Sufficient amount of cement reduces
segregation of CLSM materials, due to its binding property.
2.5.1.2 Cement Kiln Dust (CKD)
Cement kiln dust (CKD) is a by-product from cement manufacturing.
CKD is a fine powdery material and appears like Portland cement. It is collected
at electrostatic precipitators during the production of cement klinker (Siddique,
2009). The chemical composition of CKD depends on the raw material used to
produce the clinker (Siddique, 2009).
Large amounts of CKD are being produced every year which is either
stockpiled or landfilled (Pierce et al. 2003). Land filling is disadvantageous in
many aspects since accumulation of heavy metals can leach out, which in turn
causes environmental problems. Stock piling is associated with problems like
transport, storage and disposal and also erosion due to wind and water (Pierce
et al. 2003). Since CKD reacts with atmospheric moisture, it forms a hard crust
21
on the surface, which can be an expensive problem to handle while disposal
(Pierce et al. 2003).
Some of the known applications of CKD include: used as a stabilizing
agent to treat soft or wet soils (Davis and Hoods, 1974) and loose sands
(Baghdadi et al. 1995), and as filler in pavements (Zhu et al. 1999). The use of
CKD in CLSM may be considered one such application. Since the CKD imparts
low strength when compared to Portland cement, the CKD provides suitable
substitute for Portland cement in producing a CLSM which can be easily
excavated in the future. Another advantage is that the reduction of overall
material cost since it can replace certain percentage of fly ash additive (Pierce
et al. 2003). The only concern is Katz et al. (2004) found that use of finer CKD
particles results in higher water demand and also the durability aspects of using
CKD in CLSM have not been studied in detail and further work may be needed.
2.5.1.3 Lime
The use of lime stabilization of clay in construction is 5000 years old
(Khattab et al. 2006). The pyramids of shersi in Tibet were built using a
compacted mixture of clay and lime (Greaves, 1996). Lime used for soil
treatment can be in the form of quick lime (calcium oxide, CaO), hydrated lime
(calcium hydroxide, Ca [OH]2 or lime slurry (Lime manual, 2004). Quicklime is
manufactured by chemically transforming calcium carbonate (lime stone,
CaCO3) into calcium oxide.

22
Lime reacts with clay minerals and complex chemical reactions or
pozzolanic reactions take place forming cementitious products in the form of a
water insoluble gel of calcium silicate hydrates. With time, the gel gradually
crystallizes into cementing agents such as calcium silicate hydrates (CSH)
(tobermorite and hillebrandite) and calcium aluminate hydrates (CAH) (Galvao
et al. 2004; Lime manual 2004). CSH and CAH are cementitious products
similar to those formed in Portland cement. The reaction occurs only when the
water is present and it carries calcium and hydroxyl ions to the clay surface
(Galvao et al. 2004). This process results in soil stabilization improving strength
of soil significantly besides altering various other properties of soil like swelling,
shrinkage, permeability etc.
2.5.1.4 Fly Ash
Fly ash is a by-product of coal combustion and has found uses in wide
range of construction applications, including flowable fill. Though fly ash has
established itself as an important construction material, approximately 70-75%
of the fly ash generated annually, is land filled (FHWA, 1998). ASTM C 618
defines fly ash as “the finely divided residue that results from the combustion of
ground or powdered coal and is transported by the flue gases”. This does not
include the residue from burning of municipal refuse.
As per ASTM fly ash is a pozzolanic material. A pozzolan is defined as “a
siliceous or siliceous and aluminous material which itself possesses little or no
cementitious value but which, in finely divided or powdered form, and in the
23
presence of moisture, chemically reacts with calcium hydroxide at ordinary
temperatures to form compounds that possess cementitious properties”.
Formation of cementitious material by the reaction of free lime (CaO)
with pozzolans (AIO3, SiO2, Fe2O3) in the presence of water is known as
hydration reaction. The major reaction that takes place is between the reactive
silica of the pozzolan and calcium hydroxide producing calcium silicate hydrate
(CSH). The alumina in the pozzolan may also react with the calcium hydroxide
and other components in the mixture to form other cementing products (CAH).
The hydrated calcium silicate gel (C2S) or calcium aluminate gel (C3A) binds
inert material together which lead to increase the strength of treated material.
Fly ash plays a major role in flowable mixes to improve workability and strength
(ACI 229R-94). It also minimizes bleeding, shrinkage and permeability of the
flowable fill mix. When used in large proportions in flowable mixes, fly ash helps
in producing low densities as compared to mixes with high aggregate contents
(Krell, 1989). The following section describes different types of fly ashes used in
CLSM applications.
Class C and Class F fly ashes are the two commonly used fly ash types in
flowable fill mixes (ACI 229R-94, Collins et al. 1993, Krell, 1989). Class F fly
ash is produced by burning anthracite or bituminous coal (Collins et al. 1993,
ASTM C 618). Class F ash contains silica, aluminum and iron in combinations
greater than 70%. Class F fly ash possess moderate pozzolanic properties due
to low amounts of calcium ions present in these materials. Class C fly ash is

24
produced from the burning of ignite or subbituminous coal. Class C fly ash
generally contains more calcium and less iron with its lime (CaO) content in the
range of 15% to 30% (Collins et al. 1993, ASTM C 618). This makes the Class
C fly ash more cementitious and pozzolanic. Hence, Class C fly ash use in
CLSMs imparts high strength to the material when compared to Class F fly ash
in the same material (Trejo et al. 2003).
2.5.1.5 Dry Scrubber Ash
Dry scrubber ash is the ash collected from a combustion system that
burns sub-bituminous coal and injects a lime absorbent in the form of crushed
limestone to remove SO2 emissions (Dockter et al. 1998). The physical and
chemical properties of both this chemicals make it acceptable for their use in
Portland cement concrete (Dockter et al. 1998). However, when compared with
Class C fly ash, the mixtures prepared with dry scrubber ash showed more
cementitious and less pozzolanic properties than Class C fly ash mixtures
(Dockter et al. 1998). Hence, the use of this ash eliminates the use of cement in
the CLSM mixtures. The mixtures with dry scrubber ash also showed early high
strengths i.e., faster setting time (Dockter et al. 1998). This property allows the
CLSM material to be subjected to overburden loads soon after their placement.
The major advantage of using dry scrubber ash is that, though it fails to meet
the specifications for the use in concrete, it can be used in CLSM mixtures.

25
2.5.1.6 Wood Ash
Wood ash is the residue generated due to combustion of wood and wood
products (chips, saw dust, bark, etc.) (Naik et al. 2003) This by-product is
largely produced in the US mainly to generate electricity and/or steam and is
landfilled or applied on land as a soil supplement. Naik et al. (2003) reported
the use of wood ash and other ashes generated form the fore mentioned
supplemental fuels in CLSM. Their experimental results showed that the use of
CFA reduced the density of CLSM material. The strength results were
compatible to other CLSM mixtures with Class C or Class F fly ash. Another
significant finding was that the permeability values of CLSM mixtures with CFA
were lower than those observed for compacted clays due to the improvement of
microstructure of these CLSM mixtures.
2.5.2 Phosphogypsum (PG)
Phosphogypsum is another by-product from the production of phosphoric
acid, which is used in fertilizer industry. Previous literature mentioned that for
every ton of phosphoric acid produced, about 5 tons of PG is produced as by-
product (Borris and Boody, 1980). These high amounts of production of PG as
a by-product have led to studies involving potential uses of this material.
The chemical composition of PG is CaSO4.2H2O, calcium sulfate
dihydrite. There is an inherent presence of Radium-226 in PG and hence, the
use of it is prohibited in applications involving ground water and agricultural
purposes (Gandham et al. 1996). This CLSM material is used in applications

26
like void filling and backfilling, where the contact of new member with the
mixture is minimum at best. This PG is acceptable to be used as a substitute to
cement provided it meets local environmental regulations. Gandham et al.
(1996) provided results of CLSM with the use of PG as a substitute to cement.
Their findings showed that the PG content did not significantly affect flowability
properties of mix. However, some of the mixtures produced high strength (2 to 4
MPa), which would prove difficult to be excavated in the future. This property
may be attributed to the rapid hydration of the readily available free lime present
in Class C fly ash.
2.5.3 Water
There are no special requirements for water to be used in CLSM. As a
general rule, any water that is suitable for concrete will work well for CLSM,
including recycled wash water for ready-mix concrete trucks.
2.5.4 Coarse Aggregates
Aggregates make up major portion (72%) of a typical CLSM mixture.
Most CLSMs contain fine aggregate alone, only a small percentage of CLSMs
used in practice contain coarse aggregate.
Gravel is common coarse aggregate used and is expensive when
compared to fine aggregates such as sand. Performance of gravel based
mixtures is similar to those with sand (Fox, 1989). It was noted by Fox (1989)
that the use of coarse aggregates reduces the water content of the CLSM mix.
Typical gravel sizes of 3/8 in. 1 in. are considered in flowable fill works. Gravels

27
with specific gravity of 2.68 were used in CLSM to obtain 28 day strength of 150
psi (Fox, 1989).
2.5.5 Conventional Fine Aggregates
Fine aggregates should comply with the ASTM C 33 standard. Sand is
the most commonly used fine aggregate in the CLSM mixtures. The ACI 229R-
99 has mentioned that well graded sand has proven to be very effective as a
fine aggregate and also it improves the workability of the CLSM material.
Rounded sand aggregates enhance flowable properties when compared to
angular sand aggregates (Folliard et al. 2002). The use of non-standard
material such as readily available native material is acceptable for the CLSM
mixes, as long as the quality of such material is ensured (Tikalsky et al. 2000;
Crouch et al. 1998). However, such CLSM materials should be tested prior to
using them in the projects (ACI 229R-99).
By products and recycled materials such as concrete sand, foundry
sand, bottom ash, high fines limestone screenings, recycled glass and scrap
tire rubber, gravel and crushed stone can also be used as fine aggregates in
the CLSM. These materials and their use in CLSM applications are briefly
described in the following sections.
Fine aggregates like cement foundry sand or foundry sand, concrete
sand are the most commonly used aggregates for CLSM and they are
standardized components of CLSM as per ASTM C 33. Rounded sand
aggregates enhance flowable properties when compared to angular sand

28
aggregates. It is also reported that use of native soils with clayey fines as fine
aggregates exhibit problems such as excess water demand, stickiness of the
mix, incomplete mixing (Folliard et al. 2002). So, sand is preferred as fine
aggregate in CLSM mix. A brief discussion on different types of conventional
fine aggregates was done in the following sections.
2.5.5.1 Concrete Sand
A wide range of fine aggregates may be used successfully in CLSM, but
conventional concrete sand (ASTM C 33) is the most common, especially for
CLSM produced at ready-mixed concrete plants. Sand that does not meet
ASTM C 33 requirements (e.g., gradation) can be often times used in CLSM
production, provided that the specified flowability and constructability
requirements are satisfied.
2.5.5.2 Foundry Sand
Foundry sand, a by-product of metal casting industry is becoming more
viable candidate for use in CLSM because of its lower cost, increasing
availability and satisfactory performance (Bhat and Lovell, 1996; Tikalsky et al.
1998). Production of these by-products in large amounts leads to disposal and
environmental problems (Naik and Tarun, 1997). It is estimated that for every
one ton of metal castings produced and shipped that a typical foundry
generates approximately one ton of waste sand. The U.S. Environmental
Protection Agency has also recognized foundry sand, along with fly ash, as

29
suitable materials for CLSM (EPA, 1998). The effective use of these by-
products in construction works involving large volumes of materials will reduce
disposal costs, replace expensive virgin materials, and saves valuable landfill
space.
Foundry sand consists primarily of clean, uniformly sized, high-quality
silica sand or lake sand that is bonded to form molds for ferrous (iron and steel)
and nonferrous (copper, aluminum, brass) metal castings (Collins et al. 1994).
These sands, though clean before use, can be contaminated with metals from
the casting process, which are known as spent foundry sands (Collins et al.
1994). Therefore, ferrous foundry sands are more commonly used in CLSMs
because of the concerns over the potential leaching of phenols and heavy
metals such as cadmium, lead, copper, nickel, and zinc (EPA, 1998) in
nonferrous foundry sands.
Two general types of binder systems used in metal castings are clay-
bonded systems (green sand) and chemically-bonded systems (Tikalsky, 2000;
Tikalsky, 1998). Both types of sands are suitable for use in CLSMs. However,
they have different physical and environmental characteristics (Tikalsky, 1998).
Most of sand cast molds used in ferrous castings are of the green sand type,
which consists of high-quality silica sand, 4 to 10 percent of bentonite clay as
binder, 2 to 5 percent of water about 5 percent of carbonaceous additive to
improve the casting surface finish (Tikalsky, 2000). Chemically bonded sand

30
cast systems involve 97 percent of foundry sand along with organic binders and
catalysts (Tikalsky, 2000).
Clean and used foundry sands can be used effectively as a replacement
to fly ash additive in the manufacture of flowable slurry mixtures (Naik and
Singh, 1997). Bleeding of water was noticed to increase with an increase in the
foundry sand content. Voids created due to presence of coarser particles in the
foundry sand are attributed to this bleeding (Naik and Singh, 1997). The results
showed that excavatable flowable slurry with a 28-day strength range between
40 and 90 psi (0.28 and 0.62 MPa) and such materials can be manufactured
with the replacement of fly ash by 85% of foundry sand (Naik and Singh, 1997).
Experiments performed by Duritsch (1993) involved the use of CLSM
mixtures containing three different types of sands including virgin sand, spent
clay-bonded sand and chemically bonded foundry sands. Results showed that
the clay-bonded sand mixture required additional water to achieve the required
flowablity. These materials produced low density mixtures due to low specific
gravity of aggregates and increased moisture content. Foundry sand mixtures in
CLSMs produce lower compressive strengths facilitating excavatability of the
material and also a faster setting time than the virgin sand mixtures (Bhatt and
Lovell, 1996).
Tikalsky et al. (1998) conducted research on both clay-bonded and
chemically-bonded spent casting sands to be used as CLSM aggregates. Their
analysis suggested that spent clay-bonded casting sands have to be blended
31
with rounded siliceous sands to acquire better fluidity that those blended with
coarse crushed limestone.
2.5.6 Alternative Fine Aggregates
Use of conventional aggregates is may not be always the viable option
as it becomes costly for large projects. This necessitated the need of alternative
options that can reduce the project cost and can replace the conventional
aggregates effectively. Recycled materials such as scrap tire rubber, recycled
glass were found to be cost effective and can survive the purpose effectively.
Following are some of the alternatives for conventional aggregates that are
found in literature.
2.5.6.1 Scrap Tire Rubber
The United States produces nearly 266 million of scrap tires per year, of
which 24% are landfilled or dumped as stockpiles (EPA, 1999). Only 4% are
beneficially used in civil engineering projects (Pierce et al. 2002). This calls for
innovative methods of recycling waste tire rubber. In the field of civil
engineering, the applications of recycled tire rubber provide benefits including
the development of a low density and high ductility material (Pierce et al. 2002).
Typical density of flowable fills with sand as fine aggregate range between 115
and 145 pcf (ACI 229R-99). However, in many construction applications, the
use of a light weight material is preferred which will reduce the applied stress in
both horizontal and vertical directions and thereby controls the settlement of
underlying soils.

32
Scrap tire can be finely ground to produce crumb rubber, which exhibits
a granular texture and ranges in size from very fine powder to sand sized
particles. Due to its low specific gravity, crumb rubber can be considered as a
light weight aggregate in flowable fills resulting in density range of 73 to 98 pcf
(1.2 to 1.6 g/cm3) (Pierce et al. 2002). The crumb rubber produces a fill material
with a density of 80 pcf (1.3 g/cm3), as compared to a typical CLSM with an
average density of 130 pcf (2.1 g/cm3) (Pierce et al. 2002). The strength
properties of crumb rubber tire based CLSM are similar to those of standard
flowable fill mixtures.
2.5.6.2 Recycled Glass
The colored glass material that cannot be used by local bottle
manufacturers is crushed in to 1/2 in. material and is used in various
construction projects (Ohlheiser, 1998). Ohlheiser (1998) used this recycled
glass material in the place of virgin aggregates of CLSM. Field tests conducted
on this CLSM proved that the glass composed CLSM performed better than or
equal to the standard flowable fill material in terms of strength properties. This
recycled glass is considered to be a better option in Colorado for both due to
economic benefits and for recycling efforts (Ohlheiser 1998; Hook and Clem,
1998).

33
2.5.6.3 Native Soil
CLSM has mostly evolved using only conventional materials as
aggregates. However, use of native soils in place of conventional aggregates is
the cheapest viable alternative for large projects as it greatly reduces the
dumping of excavated material which eventually saves land space and
transportation cost. However, the CLSM mixed with the soil has to pass the
workability and constructability properties. CLSM should possess the following
properties.
1. When first mixed, it should be flowable (>10” slump)
2. When cured, it should have a minimum strength greater than the soil it is
replacing (>100 kPa [15 psi] for most soils)
3. Its final strength should be low enough to allow it to be excavated
(<2,000 kPa [300 psi][ACI, 2005])
These specifications changes with the requirement and area of
application of CLSM. Reasonable strength range for CLSM is 28 day strength
minimum of 350 kPa (50 psi) and maximum of 1,000 kPa (150 psi) to allow for
some variation in actual reported test results(Finney et al. 2008). The lower-
bound unconfined strength of 350 kPa (50 psi) is similar to the undrained shear
strength of very stiff clay. The typical upper limit of 1,000 kPa (150 psi) is
similar to the unconfined strength of hard clay (Crouch et al.1998).
When CLSM is manufactured from the native soil, one concern is the
consistent strength of the mixture. Native soil will have more varied grain size

34
distribution than processed sand which necessitates the need of varying mix
design with variation in soil type. Duritsch (1993) conducted experiments using
clay-bonded sand which resulted in higher water content to achieve required
fluidity. However, greater water content may cause aggregate segregation,
bleeding increase, and strength reduction (Wu et al. 2005). Therefore, the
selection of a suitable water content making the material exhibit the best
engineering performance is the first priority for the mix design. Use of native
soil has been successfully implemented for the West Sacramento Force Main
(WSFM) project, part of Lower North West Interceptor program, included
construction of 6.4 km (4 mi.) through urban portions of the City of West
Sacramento, California. Mostly, the advantages of using trench-side soil
outweigh the disadvantages as long as the variability of native soil materials is
understood and strict attention to the quality control is maintained (Finney et al.
2008)
2.5.7 Chemical Admixtures
Chemical admixtures are the materials that are added either before or
during mixing to enhance or retard its properties, such as flowability, setting
time, strength, water content, density of the mix (ACI 229R-99). Air-entraining
agents (AEAs) are the most commonly used chemical admixture in CLSM.
Some of the other admixtures used are water-reducing admixtures, set
retarders or accelerators, and super plasticizers (Pons et al. 1998; ACI 229R-
35
94). However, when used in high quantities, these admixtures may cause
segregation problems (ACI 229R-99).
AEAs have been used to improve flowability. It also enhances insulating
characteristics. Air-modified CLSMs typically contains 15 to 35% air by volume.
Higher air contents impart greater workability of the mixture. This condition
leads to reduction in water contents, which in turn minimizes segregation and
bleeding problems (Hoopes, 1998). Air volumes help in lowering the cost of
CLSM by 10 to 30% (Riggs and Keck, 1998). ACI 229R-99 mentions that the air
contents in excess of 6% may increase segregation in the mixtures. Water-
reducing admixtures can be used in CLSM mixtures with low fines content,
which increase the overall compressive strength, accelerate hardening and
decrease subsidence or settlement properties (ACI 229R-99).
2.6 CLSM - Properties
This section provides information on the properties of CLSM that most
affect its performance in key applications. According to Folliard et al. (2008),
fresh properties of CLSM are flowability, segregation, bleeding, hardening time
and subsidence while hardened CLSM properties include compressive strength,
excavatability, permeability, shear strength, resilient modulus, consolidation,
shrinkage and thermal conductivity. In case of pipeline applications properties
such as flowability, setting time, compressive strength and density are of major
importance. Hence, this literature search mainly focused on gathering

36
information on these four fundamental properties of CLSM and how these
properties are determined and are described briefly in the following sections.
2.6.1 Flowability
One of the most important properties of CLSM is its ability to flow easily
into confined areas, without the need for conventional placing and compacting
equipment. Its self-leveling property greatly reduces the labor and also
increases the speed of construction. ASTM D 6103, “Flow Consistency of
Controlled Low Strength Material” is the most commonly accepted test
procedure. A plastic cylinder with dimensions 150 mm (6 in.) and 76 mm (3 in.)
inside diameter is lifted, allowing the CLSM to slump and increase in diameter.
The final diameter is typically used to differentiate between various degrees of
flowability. A final diameter of 203 mm (8 in.) or higher is the typical value of a
flowable mixture.
2.6.2 Setting time
Setting time is the approximate period of time required for CLSM to gain
sufficient strength to support the weight of a person (ACI 229R-99). The setting
time of CLSM material is affected by several parameters, including mixture
proportions, climatic conditions and drainage conditions. ASTM C 403, “Time of
Setting of Concrete Mixtures by penetration Resistance”) is the commonly used
test in procedure in the Laboratory. Other techniques such as dynamic cone
penetrometer and Kelly ball are also used for CLSM.

37
2.6.3 Unconfined Compressive Strength
Unconfined compressive strength is the significant property measured
and is most commonly found in state DOT specifications. CLSM compressive
strength values are often used as an index for excavatability or digibility, when
future excavation may be required. Materials and mixture proportions must be
selected to ensure that these strength values are not exceeded in the long term.
The development of CSLM compressive strength is different from
conventional concrete in that it is thought to have two components of strength:
particulate and nonparticulate (Bhat and Lovell, 1996). The non-particulate
component of strength results from the cementitious reaction of cement and fly
ash with water, whereas the particulate component of strength is similar in the
nature to that of granular soil. Water-cement ratio plays an important role in the
development of unconfined compressive strength (Bhat and Lovell, 1996).
ASTM D 4832, “Preparation and Testing of Controlled Low-Strength
Material (CLSM) Test Cylinders” is the most common method used by state
DOTs for evaluating CLSM strength. The characteristic low strength of CLSM
creates problems in testing cylinders because the many load frames used by
researchers are in the range of 1,300 to 2,200 KN (Folliard et al. 1999). But, for
these cylinders with compressive strength of 1.0 MPa, the maximum load at
failure is only about 18 KN, approximately 1 percent of the load frame capacity
which makes the precision of the load frame doubtful (Folliard et al. 2008). This
38
problem can be eliminated when smaller diameter of cylinders is used (Folliard
et al. 2008).
2.6.4 Density and Excavatability
Density of the CLSM mix mostly depends on the type of aggregate used.
High density CLSMs are hard to excavate at the time of repair of pipes when
used as backfill. Low density CLSMs are preferred to facilitate ease of
excavation. Typical density of flowable fills reported in the literature ranged
between 115 and 145 pcf (Pierce et al. 2002). Hamilton County developed an
empirical approach to predict the long term strength or excavatability of CLSMs
(Hamilton County, 1996; Du et al. 2002) which is both the function of 28-day
uncompressive strength and density of CLSM in the field. If the calculated
value of removability modulus is less than 1.0, the specific CLSM is considered
to be removable.
2.7 Summary
This chapter explains a brief history and development of CLSM materials.
The ingredients of CLSM and their proportions along with their advantages and
disadvantages are described. Numerous applications of CLSMs along with their
case studies are discussed briefly. It was shown that CLSMs were used with
reasonable success in the past and can be used in future applications. Some of
the application areas of CLSM discussed here include pipelines, bridge
approaches, void filling.

39
Different types of materials that could be used in CLSM mixes are also
discussed in detail. Several conventional as well as alternative fine aggregates
that were used in successful CLSM applications were discussed. Successive
use of native soil as an alternative for conventional aggregates is synthesized
from this literature review. Non-standard materials including native and/or
recycled materials and their significance in CLSMs are discussed. Fresh and
hardened properties and their significance are studied in detail.

40
CHAPTER 3
3LABORATORY TESTING PROGRAM
3.1 Introduction
The key objectives of this research study were to develop the CLSM mix
design using native soils selected from Eagle ford geological formation such
that the mix developed satisfies the four target properties including flowability,
unconfined compressive strength, density and setting time and also to
understand the impact of material and mixture proportions on CLSM
characteristics. In order to achieve this, various CLSM mix proportions have to
be designed and evaluated for their properties in the laboratory.
This chapter describes details of tests performed on native soil and
CLSM. The test equipment used and procedures followed in soil-binder mixing
and sample preparation are discussed. The research variables and mix
proportions that are studied are also discussed in detail. Also, all the
engineering tests performed here are in compliance with the American Society
of Testing and Materials (ASTM) standards.
3.2 Selection of soils
The pipeline project under review involves design and installation of a
147 mile pipeline which has varying geology and includes several geological
formations.

41
The first phase of this project was conducted by Karduri (2011) and
focused on the selection and sampling of soils from multiple locations along the
pipeline alignment to assess the reusability potential of these materials as
bedding and backfill materials for the pipeline. Basic and advanced soil tests
were performed on soil samples from each boring location to address their
reusability as bedding zone or backfill materials (Karduri. 2011).
Based on the studies conducted by Karduri (2011) along the pipeline
alignment, two different locations (B14 and B15) were selected for use as fine
aggregate in CLSM mixes for this research. B14 soil consisted of low plastic
clay material from Grayson Marl geological formation while B15 soil consisted
of high plastic clay material from Eagle Ford geological formation. The main
focus of this study is to use the high plastic clayey soil from Eagle Ford
formation in CLSM mixes. Later, the Grayson Marl soil which is predominantly
low plasticity clay was also used in combination with Eagle Ford clayey soil to
improve the CLSM mix workability. The reason behind selecting Eagle Ford
clay formation for CLSM mixes is that, if the CLSM mix can be designed using
this high plastic clayey soil formation, then it can be designed with all other clay
formations along the pipeline alignment (which exhibit lesser soil plasticity) as
the Eagle Ford clay is a high plastic material with low workability characteristics.
Figure 3.1 shows the selected soil borings along the proposed pipeline
alignment in red boxes. Locations are denoted with the letter B followed by a
number; the B stands for Boring and the number provides a directional key.

42
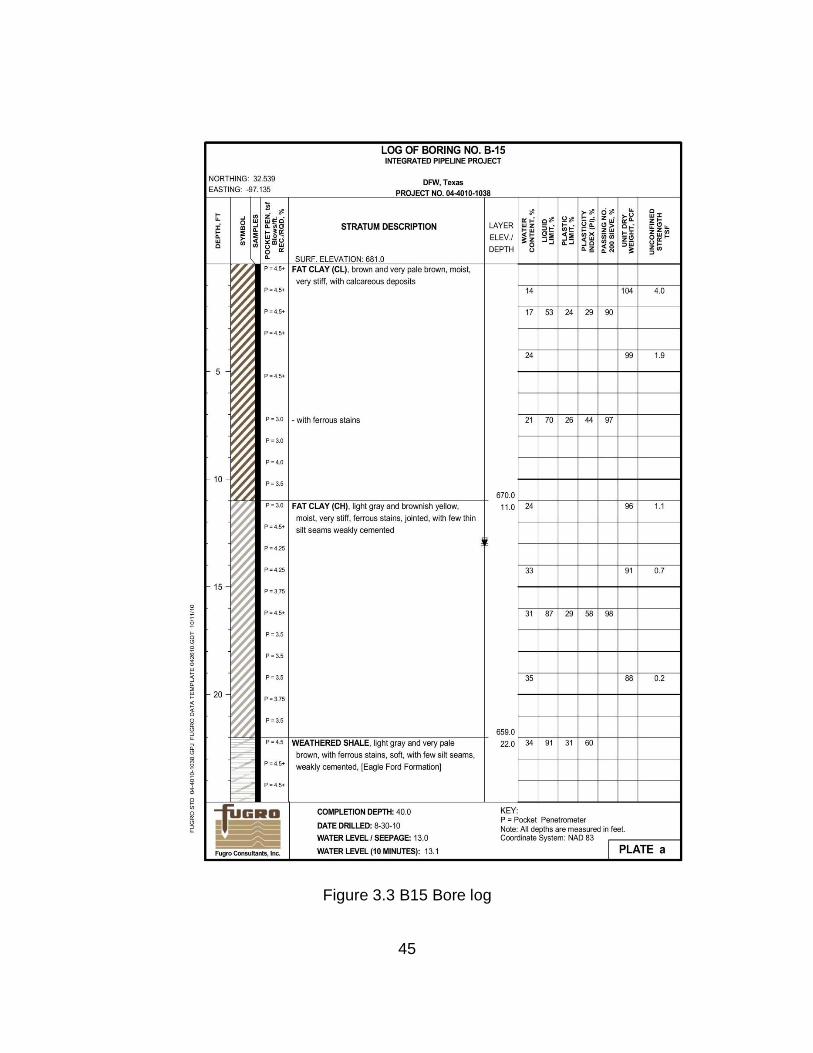
The samples were collected with the help from Tarrant Regional Water District
(TRWD) and Fugro consultants Inc. These samples were obtained from depths
of 10 to 15 ft. Bore logs of B14 and B15 soils are shown in Figures 3.2 and 3.3.

43
Figure 3.1 Selected boring locations

44
Figure 3.2 B14 Bore log
45
Figure 3.3 B15 Bore log

46
3.3 Research variables
The strength, flowability and setting time of CLSM mixtures strongly
depends on various factors that are described in chapter 2. Based on the
literature review performed, variables such as aggregate type, binder type,
binder proportions, curing period, curing conditions and water-binder ratio are
considered as the primary variables affecting the flowability, strength and
setting time properties of the CLSM. Table 3.1 presents the ranges of these
variables studied in current investigation.
Table 3.1 Research variables considered in this study
Variable description Range
Soil mixes based on CH and CL
proportions (CH:CL) 2 [100:0, 50:50]
Binder dosage for each soil
proportion 5 [10%, 15%, 20%,25%, 30%]
Binder proportions for each soil
proportion
C:F
C:L
4[100:0,100:0,20:80,0:100]
4 [33:67, 25:75, 20:80,0:100]
Curing time 2 [7 and 28 days]
Water binder ratio Varied with the mix to reach flowability
Curing conditions 1 [ 1 week counter top, 3weeks: 100%
relative humidity, 20±3 oC]
These properties are self-contradictory such as increase in flowability
results in decrease in strength and also increase in setting time. To achieve

47
optimum performance of all these properties, it is necessary to study various
possible mix proportions though it is hard to compare the results. The final mix
design should be optimized with all these variables to best suit in field
implementation.
3.4 CLSM Mix Design
Before arriving at the above mentioned ranges for binder dosage, the
current research determined the optimum binder values for cement by trial and
error process. Samples were tested for compressive strengths at 3% (50
kg/m3), 6% (100 kg/m3) and 10% (167 kg/m3) cement until the minimum
strength requirement (70 to 150 psi) (as per TRWD specifications) was
achieved. Quantities for lime and fly ash were estimated by doubling their
quantities and these replace the cement quantity. For example, 5% of cement
quantity was replaced by 10% of lime or fly ash.
Water quantity was established based on trial and error procedure until
the required CLSM flowability (8-12 in.) was achieved. The test started from the
liquid limit of the corresponding soil for each mix proportion. Density test was
performed after finalizing the mix design which satisfied the flowability
requirements. Samples for compressive strength tests and for setting time tests
were prepared with the water content established for flow test.
The flow chart in Figure 3.4 depicts the detailed laboratory mix design
carried out in this research.

48
Figure 3.4 Flow chart of Laboratory mix design procedure for native soil based
CLSM
3.5 Sample preparation
As there was no standardized method is established for preparing
the soil samples, test procedure adopted by Folliard et al. (2008) was closely
followed for preparing samples for flowability, density, compressive strength
Cement Lime Fly Ash Cement + Lime Cement + Fly Ash
Estimate Binder and water content for the soil selected
Check for Flowability
(8-12 in.)
Check for UCS
(70-150 psi)
Check for setting time
(< 5 hr.)
Duplicate the Sample
Increase/Decrease Water Content
Increase/Decrease Cement/Fly Ash/Lime
content and redo Flowability test
Increase Cement/Admixture Content and redo
Flowability and UCS tests
Yes
Yes
No
No
No
Recommend the percentage Cement/Fly Ash/Lime
49
and setting time. Most of the preparation procedure discussed below was
extracted from Folliard et al. (2008). This procedure is particularly applicable for
medium stiff to stiff clayey soils. In order to obtain a uniform soil-binder mixture,
the bulk and undisturbed soil samples were first oven dried (at 60oC) and
pulverized to obtain fraction passing through US Sieve 40 (0.425 mm). The
natural water content was added separately to the soil along with the weight of
water from mix proportion at the time of mixing.
Procedure followed for soil-binder mixing and specimen preparation is
explained in following steps. Approximate quantity of representative pulverized
soil required for preparing desired number of soil samples was obtained.
Appropriate amount of binders (cement, lime and fly ash) were determined and
weighed. The total water content which includes the insitu water content and
the amount of water from designed mix proportion was determined.
The quantities of cement and/or fly ash or lime were mixed in dry
conditions separately and then this mix was added and mixed to the soil in dry
state prior to the addition of water in a commercially available dough mixer. The
mixing rate of the outer spindle was at 60 rpm and inner spindle was rotated at
152 rpm. These rates were arrived at by a trial and error process to facilitate
sufficient mixing time without forming soil binder lumps.
Water content established was slowly introduced in to the soil-binder
mix. Flexible spatula was used to avoid the soil from sticking to the sides and
bottom of the mixing bowl to ensure that there were no soil-binder lumps. Trial

50
mixings were made to establish particular mixing time that yields uniform soil-
binder mixture. The total mixing time in this study based on experience is 8 to
10 minutes. Finally, the soil binder mixture was transferred in to the bowl for
flow, strength and setting time tests. Figure 3.5 shows the apparatus used for
preparing CLSM mix.
Figure 3.5 Soil-binder mixer
UCS samples were then casted for 7 day and 28 day strength tests and
both the samples were left countertop for the first week and then only 28 day
samples were moved to 100% relative humidity room and were brought outside
the humidity room at the time of testing while seven (7) day samples were left
countertop until the time of testing. Humidity controlled curing was not
performed on 7 day samples as they were still in wet condition. Hence
countertop curing was considered and this method is similar to the one outlined
in NCHRP report 597 by Folliard et al. in 2007.

51
3.6 Tests Conducted on Native Soil
3.6.1 Sieve Analysis
This test was conducted to obtain the grain-size distribution of soils for
the two samples. The test was conducted according to ASTM D 422 method. A
soil sample representative of the region from which it was collected was passed
through No. 200 sieve using water. The distribution of particle size of the
sample portion retained on No. 200 sieve was determined by sieve analysis,
while the sample portion passed through No. 200 sieve was determined by
hydrometer analysis. Sieve analysis establishes the percentage of the coarse
fraction of the soil (Gravel and Sand) while hydrometer analysis establishes the
percentage of fine fraction in the soil specimens (Silt and Clay).
3.6.2 Hydrometer Analysis
Hydrometer Analysis was carried out to study the micro level distribution
of silt and clay fraction present in the field soil. This test was performed as per
ASTM D 422. The procedure involved taking 50 g of the oven dried portion that
passed No. 200 sieve (explained in previous section) and mixed with a solution
containing a 4% deflocculating agent (Sodium Hexametaphosphate) and
soaking for about 8 to 12 hours. The prepared soil was thoroughly mixed in a
mixer cup and all the soil solids inside the mixing cup were transferred to a
1000 cc graduated cylinder and filled to mark using distilled water.
The hydrometer readings were recorded at cumulative time of 0.25 min.,
0.5 min., 2 min. 4 min., 8 min., 15 min., 20 min., 2 hr., 4 hr., 8 hr., 12 hr., 24 hr.,

52
48 hr., and 72 hr. After taking the readings initially for the first 2 minutes, the
hydrometer was taken out and kept in another cylinder filled with distilled water.
Necessary temperature corrections, zero corrections and meniscus corrections
were made to the hydrometer readings as per procedure. Photographs of sieve
analysis and hydrometer analysis are presented in Figure 3.6.
(a) (b)
Figure 3.6: Basic soil tests (a) Sieve analysis and (b) Hydrometer analysis
3.6.3 Atterberg Limits
If the soil is steadily dried, depending on its moisture content, it will
behave like a plastic, semisolid, or solid material. To determine the water
content boundaries between these states, it is important to perform Atterberg
limits. These boundaries are known as shrinkage limit (SL), plastic limit (PL)
and liquid limit (LL); they divide the soil states in the following order: dry, semi-
solid, plastic, and liquid. Of the three states, LL and PL are the most crucial

53
factors; the mathematical difference in these values is known as plasticity index
(PI). PI characterizes the plasticity of soil numerically. The higher the PI, the
more plastic the soil is.
Cassagrande developed a liquid limit device in which the liquid limit cup
lifts and drops 10mm on a hard rubber plastic base (ASTM D 4318). The
number of blows, the goal is 25 blows, is counted until the groove, made by a
grooving tool, closes a distance of 13mm (1/2in.); this determines the moisture
content within the soil. Typically the test is performed 2 to 3 times, as 25 blows
is hard to achieve the first time. Therefore one point above and below is found
and the moisture content is interpolated at 25 blows. The test to determine the
PL is subjective to the user in that it requires practice for consistent results. It is
defined as the moisture content at which the soil crumbles when rolled into a
thread of 3.18mm (1/8in.) in diameter. ASTM D 4318 provides a detailed
procedure.
3.7 Tests Conducted on CLSM Mixes
3.7.1 Density Test
Density test was performed, when the CLSM was in wet state. Details of
test procedure are presented in the following sections.
The apparatus include a balance, filling apparatus, sampling and mixing
receptacle, measure, strike-off plate and calibration equipment. The balance
used was accurate enough to measure 0.01 lb of weight. A mixing receptacle
and a pail of sufficient capacity were used to facilitate filling of the measure. The

54
container was water-tight and sufficiently rigid to retain its form. The dimension
of the measure was such that the height was approximately equal to the
diameter. ASTM D 6023-94 specifies that the height of the measure shall
neither be less than 80% nor greater than 150% of the diameter of the
measure. Figure 3.7 shows the steel measure used in this research. The
capacity of the measure was calibrated according to ASTM C 29.
Figure 3.7. Steel measure for density measurement
The measure was placed on a level, rigid and horizontal surface free
from vibration and other disturbances. The CLSM material was thoroughly
mixed in the receptacle. The center portion of the material was scooped through
the filling apparatus and then poured in to the measure. After filling, the strike
off plate was used to produce a smooth surface of the material. After removing
the excess material from the exterior of the measure, the mass of the CLSM in

55
the measure was determined close to 0.01 lb. The density was obtained by
taking the weight over calibrated volume for the measure.
3.7.2 Flow Test
Flow test was conducted to determine the workability of the CLSM
material and its ability to flow in to confined areas. This test method is intended
to provide the user with a procedure to determine the fluidity of CLSM mixtures
for use as a backfill or a structural fill. The testing procedure is detailed in the
following section.
The apparatus used for flow test include flow cylinder, sampling and
mixing receptacle, filling apparatus, nonporous surface, straight edge and a
measuring tape. A plastic cylinder with dimensions 150 mm (6 in.) height and
76 mm (3 in.) inside diameter was used as the flow cylinder. The cylinder
interior had a smooth surface and it was open at both ends. A 0.6 m (2 ft)
square, acrylic plate was used to allow the spread of the CLSM from the flow
cylinder.
A mixing receptacle and a pail of sufficient capacity were used to
facilitate filling of the measure. A stiff metal straightedge of a convenient length
was used to level the surface of the material in the flow cylinder. A plastic tape
was used to measure the flow diameter of the CLSM patty. Figure 3.8 shows
the acrylic plate and the flow cylinder used for the flow test.
The acrylic plate was placed on a flat, level surface. The flow cylinder
was damped with water and placed on the acrylic plate and was held firmly

56
while filling the material. The center portion of the CLSM material in the
receptacle was scooped and poured into the flow cylinder until full. The excess
of the material on the surface of the cylinder was removed using the straight
edge. The cylinder was then raised quickly in a vertical direction by 15 cm (6
in.) within 5 seconds of filling and strike off. The entire test of filling through
removal of flow cylinder without interruption was completed within a time of 1
minutes, as mentioned by ASTM standard. Two diameters perpendicular to
each other of the patty were measured. The average of the two was considered
as the flow diameter of the CLSM material.
Figure 3.8 Acrylic plate with the flow cylinder
3.7.3 Setting Time
Setting time of the CLSM mix prepared was conducted to determine the
time required for CLSM to resist 25 mm penetration of Vicat’s needle. Details of
the test procedure involved are discussed in the following section.

57
The apparatus include plastic conical mold, plastic plate, sampling and
mixing receptacle, filling apparatus, plunger, penetration needle, and a pipette.
A plastic conical mould of 70 mm bottom diameter, 60 mm top and 40 mm high
was used as the container. The mold was non-absorptive, rigid and watertight.
A plunger which can apply 1 psi stress along with the needle was used as a
penetration needle.
The conical plate and plastic plate assembly was placed on a flat level
surface and the components were held together firmly while filling the material.
The CLSM material was thoroughly mixed in the receptacle. The center portion
of the material was scooped and then poured in to the conical mold until full and
the excess material was removed by using a straightedge.
Just prior to making the penetration test, bleeded water from the surface
was removed with the help of pipette. Needle assembly was brought just in
contact with the test specimen and was released. Readings were taken until the
depth of penetration retarded to 25 mm from surface of the mold by avoiding
the areas where the CLSM has been disturbed by previous trails, as mentioned
by the ASTM standard. Time required for 25 mm penetration was considered as
the setting time of the CLSM material. Figure 3.9 shows the Vicat’s apparatus
used for this test.

58
Figure 3.9 Vicat's apparatus
3.7.4 Unconfined Compressive Strength Test
After curing the samples for corresponding time periods, Unconfined
Compressive Strength (UCS) tests were conducted as per ASTM D 2166. This
test was conducted on the soil samples under unconfined conditions. The test
was conducted on casted soil specimens of 3.0 inches in diameter and 6 inches
in height. The soil specimen was first placed on a platform and then raised at a
constant strain rate using the controls of the UCS setup until it came in contact
with top plate. Figure 3.10 shows the unconfined compressive strength test
setup and the computer system used for data acquisition.

59
Figure 3.10 UCS test setup with Data Acquisition System
Once the specimen was intact, it was loaded at a constant strain rate
and as the load approached the ultimate load, failure cracks began to appear
on the surface of the specimen. Both deformation and corresponding axial
loads on the specimen were recorded using a Data Acquisition System (DAS).
The data retrieved contained load (Q) and deformation ( ) data and the same
were analyzed to determine the maximum unconfined compressive strength
( ) in psi. The following expressions show the computation of stress ( ) and
strain ( ) corresponding to the load-deformation data recorded during a test.

60
Where, = change in length, = total length of specimen, = corrected
area of cross section of the specimen and = initial area of cross section.
Figure 3.11 shows the 28 days UCS sample casted with 10 % cement.
I f Figure 3.11 Typical 28 day UCS sample before testing
3.8 Summary
This chapter explains the criteria for selection of B14 and B15 soils as
constituents for the mix design and also the locations of these soils along the
pipeline. Various research variables involved in design of mix proportion were
briefly discussed. Procedures adopted for formulation of mix designs and
factors affecting the target properties are discussed. Procedures involved in
determining the Index properties and results obtained for control soils were
tabulated. Engineering tests performed to reach the target properties are also
discussed in detail and the quantities needed to reach the target properties

61
such as water content and binder proportions for various proposed mix designs
are obtained. Sample preparation for flowability, compressive strength, density
and setting time is also discussed in detail.
62
CHAPTER 4
4RESULTS AND DISCUSSION OF LABORATORY CLSM MIX DESIGN
4.1 Introduction
This chapter presents comprehensive analysis of results obtained from
laboratory tests on selected soils and different CLSM mixes prepared using
selected soils as fine aggregate. Sample preparation for CLSM mixes and the
testing procedures of various tests conducted on them are as explained in the
earlier chapter. Various notations followed and the effect of binder proportions,
binder types, set accelerator, soil-binder and water binder ratios, and curing
time period on target properties (flowability, density, strength and setting time)
of CLSM are discussed in the following sections, followed by the results
analysis and summary.
4.2 Sample Notation and Mix Proportions
For easy identification of different CLSM mixes, every mix is assigned a
certain notation for easy following of the mix type and its constituent’s
information. For example, two mixes are presented in the form of A_C5L10_S1
or B_C5F10_S2. In these notations, the first symbol refers to the fine aggregate
mix used, as A stands for B15 (CH) soil alone as a fine aggregate of CLSM and
B stands for a combination of B15 (CH) and B14 (CL) soils, mixed at 1:1 ratio
by their dry weights. The second part of the notation, C5L10 or C5F10

63
represents the proportions of the chemical binders used in the mix, 5% cement
and 10% lime or 5% cement and 10% fly ash, respectively, by their dry weight
of soil including fine aggregate contents. Water content represented here is to
the dry weight of total solids. The third symbol S1 or S2 represents admixture
percentage, as S1 stands for 8% of admixture by dry weight of binder and S2
stands for 8% of admixture by dry weight of soil. Admixture contents, S1 and S2
are used to lower the setting time of the CLSM mixes whose compressive
strengths met the requirement value of 70 to 150 psi. Tests for flowability,
density and compressive strength were repeated to check the variability in
properties when set accelerator was used. Materials and symbols used in this
research are listed in Table 4.1 where as notations followed and quantities for
all the mix proportions that were tried are shown in Table 4.2.
Table 4.1 List of materials and symbols used
Material Designation Description
Soil mix A CH only
B Combination of CH and CL in 1:1 ratio
Binder
C % Cement by dry weight of soil
L % Lime by dry weight of soil
F % Fly Ash by dry weight of soil
Chemical admixture
S1 8% Set accelerator by dry weight of binder
S2 8% Set accelerator by dry weight of soil mix
Note: CH- High plasticity clay from B15, CL - Low plasticity clay from B14

64
Table 4.2 Sample notations and quantities of components used
Mix Notation
C (kg/m3)
FA (kg/m3)
L (kg/m3)
Soil (kg/m3) Percentage water content
(kg/m3) CH CL
A_C6 69 0 0 1056 0 72 (810)
A_C10 105 0 0 1056 0 72 (836)
A_C15 155 0 0 1056 0 72 (872)
A_L20 0 0 210 1056 0 74 (937)
A_C5L10 52 0 105 1056 0 74 (898)
A_C5L15 52 0 157 1056 0 74 (936)
A_C5L20 52 0 210 1056 0 76 (1002)
A_C5F20 52 210 0 1056 0 72 (949)
B_C6 69 0 0 528 528 54 (608)
B_C10 105 0 0 528 528 54 (627)
B_C15 155 0 0 528 528 54 (654)
B_L20 0 0 201 528 528 62 (779)
B_C5L10 52 0 135 528 528 58 (721)
B_C5L15 52 0 189 528 528 59 (765)
B_C5L20 52 0 242 528 528 60 (810)
B_C5F20 52 210 0 528 528 59 (778)
Note: C – Cement; FA – Fly Ash; L - Lime
After performing the tests for flowability, density, compressive strength
and setting time for the above mixes, set accelerator was added to some of the
mixes whose compressive strengths met the required criteria (70 to 150 psi)
and all aforementioned tests were repeated on those mixes to check the effect
of set accelerator on the desired properties using 8% set accelerator by dry
weight of binder and the quantities of set accelerator required are given in
Tables 4.3 and 4.4.

65
Table 4.3 Sample notations and quantities of set accelerator used (8% of binder)
Mix Notation Set accelerator (kg/m3)
A_C10_S1 8
A_C15_S1 13
A_C5L10_S1 17
A_C5L15_S1 18
B_C10_S1 8
B_C15_S1 12
B_C5L10_S1 13
B_C5L15_S1 17
Table 4.4 Sample notations and quantities of set accelerator used (8% of dry
soil)
Mix Notation Set accelerator (kg/m3)
A_C15_S2 84
A_C5L10_S2 84
A_C5L15_S2 84
B_C10_S2 84
B_C15_S2 84
B_C5L10_S2 84
B_C5L15_S2 84
4.3 Basic Soil Properties Test Results
Grain size analysis and Atterberg’s limits tests were conducted on soil
samples collected from depths of 10 to 15 ft. B15 soil exhibit high Plasticity
Index (PI) value of 37 while B14 soil had a PI of 23. B15 and B14 are classified
as high plasticity clay (CH) and low plasticity clay (CL) as per Unified Soil
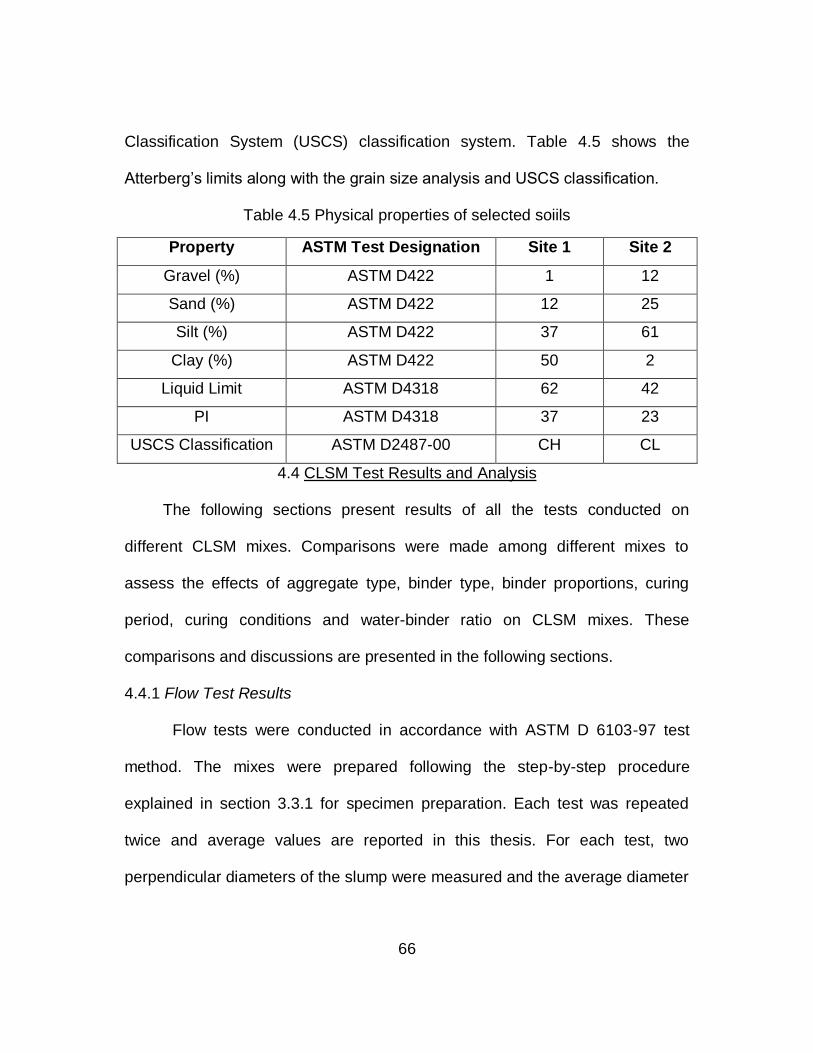
66
Classification System (USCS) classification system. Table 4.5 shows the
Atterberg’s limits along with the grain size analysis and USCS classification.
Table 4.5 Physical properties of selected soiils
Property ASTM Test Designation Site 1 Site 2
Gravel (%) ASTM D422 1 12
Sand (%) ASTM D422 12 25
Silt (%) ASTM D422 37 61
Clay (%) ASTM D422 50 2
Liquid Limit ASTM D4318 62 42
PI ASTM D4318 37 23
USCS Classification ASTM D2487-00 CH CL
4.4 CLSM Test Results and Analysis
The following sections present results of all the tests conducted on
different CLSM mixes. Comparisons were made among different mixes to
assess the effects of aggregate type, binder type, binder proportions, curing
period, curing conditions and water-binder ratio on CLSM mixes. These
comparisons and discussions are presented in the following sections.
4.4.1 Flow Test Results
Flow tests were conducted in accordance with ASTM D 6103-97 test
method. The mixes were prepared following the step-by-step procedure
explained in section 3.3.1 for specimen preparation. Each test was repeated
twice and average values are reported in this thesis. For each test, two
perpendicular diameters of the slump were measured and the average diameter
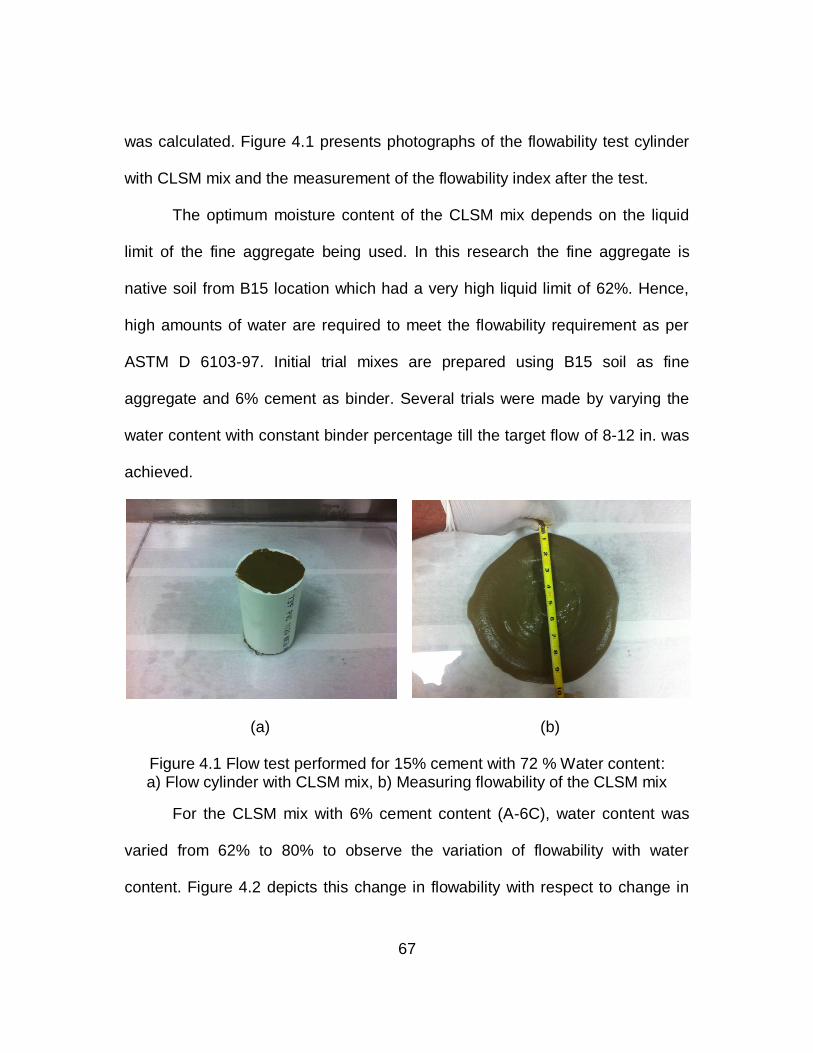
67
was calculated. Figure 4.1 presents photographs of the flowability test cylinder
with CLSM mix and the measurement of the flowability index after the test.
The optimum moisture content of the CLSM mix depends on the liquid
limit of the fine aggregate being used. In this research the fine aggregate is
native soil from B15 location which had a very high liquid limit of 62%. Hence,
high amounts of water are required to meet the flowability requirement as per
ASTM D 6103-97. Initial trial mixes are prepared using B15 soil as fine
aggregate and 6% cement as binder. Several trials were made by varying the
water content with constant binder percentage till the target flow of 8-12 in. was
achieved.
(a) (b)
Figure 4.1 Flow test performed for 15% cement with 72 % Water content: a) Flow cylinder with CLSM mix, b) Measuring flowability of the CLSM mix
For the CLSM mix with 6% cement content (A-6C), water content was
varied from 62% to 80% to observe the variation of flowability with water
content. Figure 4.2 depicts this change in flowability with respect to change in

68
water content at a constant binder content of 6% (cement = 560 kg/m3). It can
be observed from the figure that the mixes with water contents of 72% and
more met the flowability requirement of 8 to 12 in. This water requirement is
considered high and also not common in CLSM mixes which use conventional
fine aggregates such as foundry sand. However, due to the high liquid limit of
the high PI soil being used compared to that of foundry sand at least 72% of
water by dry weight of the soil is required in order for the material to be able to
flow and act as a self-leveling mixture.
Figure 4.2 Variation of flowability with water content for A_C6
Also, trials were made with a combination of high PI soil from B15 and
low PI soil from B14 to address if the water content requirement can be reduced
as B14 has a low liquid limit of 42%. Trails were made with 6% cement as

69
binder and soils were mixed in 1:1 ratio. The results of these tests are
presented in Figure 4.3. It can be observed from the figure that the mixes with
water contents of 50% and higher met the flowability requirement of 8 to 12 in.
Hence, there was a reduction in water content of about 22% when using B14
and B15 soils in 1:1 ratio as a fine aggregate in the CLSM mixes.
Figure 4.3 Variation of flowability with water content for B_C6
Once the optimum water content was established for the two categories
of mixes (one using B15 soil alone and the other using combination of B14 and
B15 soils), it gave an initial estimate of the water content for other mixes in each
category instead of randomly guessing the initial moisture contents for every
CLSM mix attempted in this research.
CLSM mixes with B15 soil alone as fine aggregate will be referred to as
A mixes and those with a combination of B15 soil and B14 soil will now onwards

70
be referred to as B mixes. Flow tests were conducted on both A and B mixes to
first check on the flowability property of each mix. The actual mix ratios are
presented in Table 4.2 and in Table 4.3 above and the flowability test results
are presented in Table 4.6 and Table 4.7.
Table 4.6 presents the results for the A mixes while Table 4.7 presents
the results for B mixes. It can be observed from these tables that some of the
mixes required more than the initial established optimum water contents and
this is expected as each mix has different percentages of binders in them and
these binders have minor effect on the water content requirement. In order to
further understand the effect of the variables such as the binder type, binder
dosage and the amount of set accelerator used in these mixes, several
comparisons were made and are presented in the following sections.
4.4.1.1 Effect of binder dosage on flowability
To compare the effects of binder dosage on the flowability of CLSM
mixes, mixes A_C6, A_C10, A_C15 from A and B_C6, B_C10, B_C15 from B
are compared and these results are presented in Figure 4.4. These mixes have
cement as binder type. It can be observed from this figure that an increase in
binder content results in an increase in flowability, but for some of the mixes
with binder other than cement, an increase in binder content resulted in a
decrease in flowability. Figure 4.5 shows these results.

71
Table 4.6 Flow test results for soil A
Material Water
Content
(%)
Trail 1 (in.) Trail 2 (in.) Average
Diameter (in.)
A_C6 72 8.4 8.2 8.3
A_C10 72 9.40 9.60 9.50
A_C15 72 9.90 9.60 9.75
A_F30 72 9.20 8.90 9.05
A_L20 74 8.80 8.70 8.75
A-C5L10 74 9.00 9.20 9.10
A-C5L15 74 9.10 9.00 9.05
A-C5L20 76 8.90 9.00 8.95
A-C5F20 72 9.00 9.00 9.00
A_C10_S1 72 9.50 9.50 9.50
A_C15_S1 72 9.00 9.10 9.05
A_C5L10_S1 74 8.80 8.60 8.70
A_C5L15_S1 74 8.60 8.90 8.75
Table 4.7 Flow test results for soil B
Material Water
Content
(%)
Trail 1 (in.) Trail 2 (in.) Average
Diameter (in.)
B_C6 54 9.2 9.6 9.4
B_C10 54 9.80 10.00 9.90
B_C15 54 10.40 10.30 10.35
B_F30 56 9.60 9.20 9.40
B_L20 62 8.90 9.20 9.05
B_C5L10 58 9.20 9.20 9.20
B_C5L15 59 8.90 9.20 9.05
B_C5L20 60 8.60 8.70 8.65
B_C5F20 59 9.60 9.20 9.40
B_C10_S1 56 9.70 9.70 9.70
B_C15_S1 56 10.10 9.90 10.00
B_C5L10_S1 58 8.90 9.20 9.05
B_C5L15_S1 59 8.90 8.70 8.80

72
Figure 4.4 Variation of flowability with binder dosage with cement alone
.
Figure 4.5 Variation of flowability with binder dosage with cement and lime

73
4.4.1.2 Effect of binder types on flowability
To study the variation in flow diameter with respect to binder type mixes
A_C5L20, and A_C5F20 form A soil and B_C5L20, and B_C5F20 from soil B
are considered as they have same binder proportion with different binders i.e.
lime and fly ash. Figure 4.6 shows the variation of flowability with respect to
change in binders. This figure illustrates that lime needs more water content to
obtain the same flowability as that of fly ash. Above case also supports the
statement that proportion of lime was the major factor that controlled the flow
diameter and it needs more water to flow when compared to cement or fly ash
with same quantity.
Figure 4.6 Variation of flowability with binder types

74
4.4.1.3 Effect of set accelerator on flowability
Set accelerator is a chemical admixture often used to enhance the
hardening property of any cement soil mixture. It improves the early strength
gain of the mix thereby reduces the setting time. Once the setting times were
established for all the mixes without set accelerator, set accelerator was tried
on some of mixes whose compressive strengths met the requirement (70 to150
psi) and flow tests were repeated on those mixes to study the variability of flow
property with respect to set accelerator. Figures 4.7 and 4.8 show the variation
of flowability with 8% of set accelerator for both the soil mixes, respectively.
Reduction in flowability was observed among these mixes and this reduction
can be attributed to the hardening action of set accelerator on the mix. The
variations were minimal because the time lapse for flow test was very small.
Figure 4.7 Variation of flowability with set accelerator for soil A

75
Figure 4.8 Variation of flowability with set accelerator for soil B
4.4.2 Density Test Results
Once the water content was established for all the mixes, density tests
were conducted under wet state condition. Tests were performed in accordance
with the ASTM D 6023-96 standard method. Specimen’s density property was
also measured at the time of UCS testing to observe its variation with time. Test
results obtained for all the mixes for both soil proportions are summarized in
Tables 4.8 and 4.9. Both Tables depicts that there was a decrease in density for
every mix used from fresh preparation state to the time of testing i.e. at 7 days
and 28 days. This change can be attributed to the loss of water for chemical
reactions. Mixes with soil A have less density when compared to those of soil B
due to an increase of silt content in the place of clay in the B soil mixture used.

76
Table 4.8 Density values for soil A
Material Water Content
(%)
Density (pcf)
Fresh 7 days 28 days
A_C10 72 95 91 89
A_C15 72 98 94 93
A_F30 72 98 96 94
A_L20 74 96 92 93
A_C5L10 74 97 93 94
A_C5L15 74 97 93 94
A_C5L20 76 97 93 93
A_C5F20 72 99 95 95
A_C10_S1 72 95 90 89
A_C15C_S1 72 98 92 90
A_C5L10_S1 74 97 92 92
A_C5L15_S1 74 97 92 92
Table 4.9 Density values for soil B
Material Water
Content (%)
Density (pcf)
Fresh 7 days 28 days
B_C10 54 104 102 100
B_C15 54 104 101 200
B_F30 56 104 101 100
B_L20 62 101 97 97
B_C5L10 58 104 101 101
B_C5L15 59 102 100 100
B_C5L20 60 101 97 99
B_C5F20 59 104 101 101
B_C10_S1 54 104 101 100
B_C15_S1 54 103 100 99
B_C5L10_S1 58 104 101 100
B_C5L15_S1 59 103 102 102
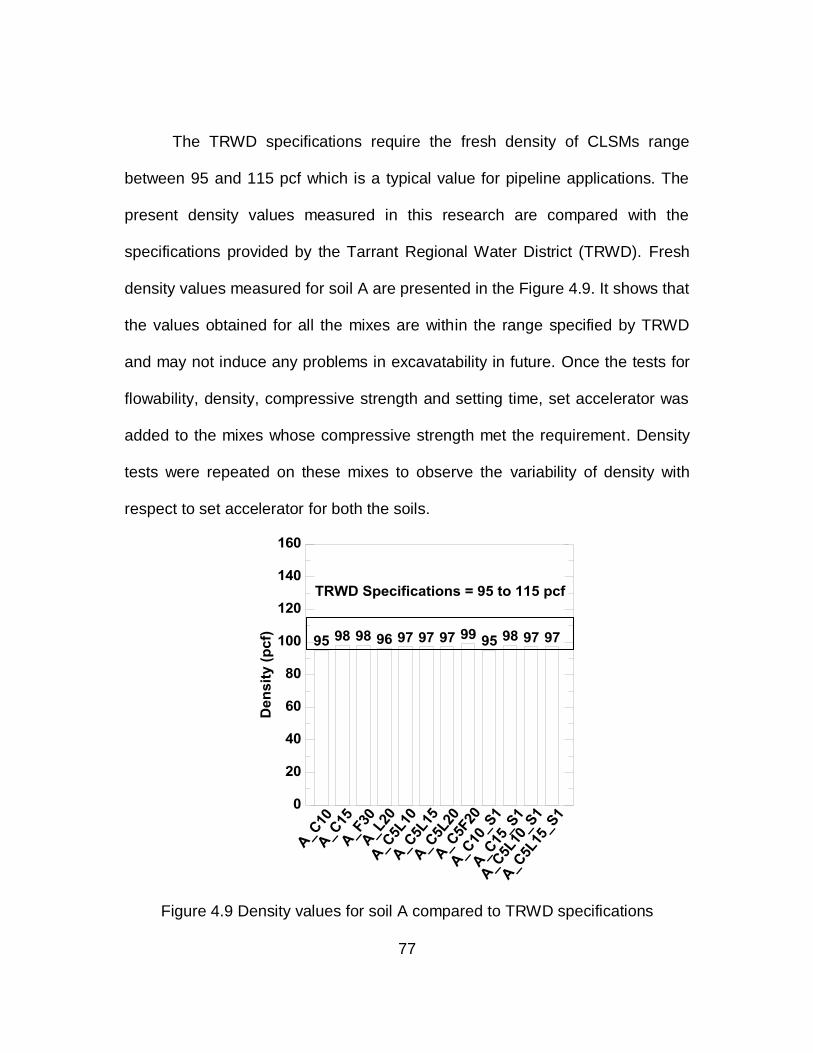
77
The TRWD specifications require the fresh density of CLSMs range
between 95 and 115 pcf which is a typical value for pipeline applications. The
present density values measured in this research are compared with the
specifications provided by the Tarrant Regional Water District (TRWD). Fresh
density values measured for soil A are presented in the Figure 4.9. It shows that
the values obtained for all the mixes are within the range specified by TRWD
and may not induce any problems in excavatability in future. Once the tests for
flowability, density, compressive strength and setting time, set accelerator was
added to the mixes whose compressive strength met the requirement. Density
tests were repeated on these mixes to observe the variability of density with
respect to set accelerator for both the soils.
Figure 4.9 Density values for soil A compared to TRWD specifications

78
Density values obtained for soil B are compared with the TRWD
specifications and the comparison is shown in Figure 4.10.
Figure 4.10 Density values for soil B compared to TRWD specifications
Figure 4.10 illustrates that the density values obtained for ‘B mixtures’
are also within the range as per Tarrant Regional Water District (TRWD)
specifications for CLSMs to be used in the pipeline projects. Hence they may
not induce any problems in excavatability issues due to potential future repairs
of the pipeline projects.
4.4.3 Compressive strength test results
Compressive strength tests were performed on all the test specimens in
accordance with ASTM D 2166 method. The mixes were prepared following the
79
same procedure as that of flowability test samples. For each mix trial, two
samples were prepared and tested. Trails were made to determine the optimum
dosage of binder using the water content obtained from flow test results until
the required minimum strength of 70 psi (as per TRWD specifications) was
achieved Trials were started from 6% cement treated CH soil and specimens
were prepared and tested after 28 days of curing to measure their unconfined
compressive strength properties.
Compressive strength of 49 psi was achieved with 6% cement and it is
less than required (70 psi), so the cement quantity was increased to 10% (167
kg/m3). These results after enhancing the binder dosage have reached
minimum target strength property. Tests were later performed with 15% cement
dosage to check the variability of strength with binder content and the results
also passed the CLSM criterion. After estimating the optimum binder content,
the current research then aimed at different binder combinations in order to
replace and/or reduce the cement content by adding other additives including
recycled waste additives as this may reduce the project costs due to lower
costs of other additives. Same procedure was repeated for B soil to establish
the binder contents for their mixtures. Samples were casted and tested in
duplicates for all aforementioned binder proportions described in Tables 4.2 and
4.3 and the results are summarized in Tables 4.10 and 4.11. Figures 4.11 to
4.16 shows the typical stress-strain curves for two soils, binder types and set
accelerator from UCS tests.

80
Figure 4.11Stress-Strain plots of soil A with 15% cement
Figure 4.12 Stress-Strain plots of soil B with 15% cement
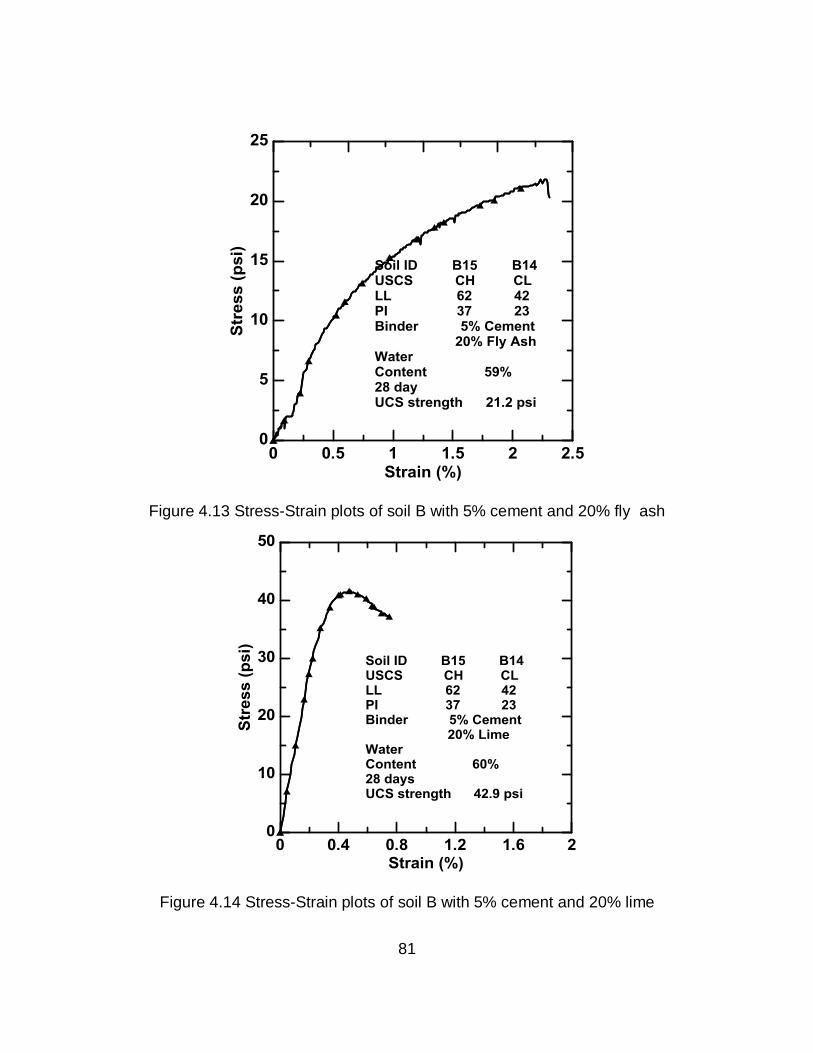
81
Figure 4.13 Stress-Strain plots of soil B with 5% cement and 20% fly ash
Figure 4.14 Stress-Strain plots of soil B with 5% cement and 20% lime
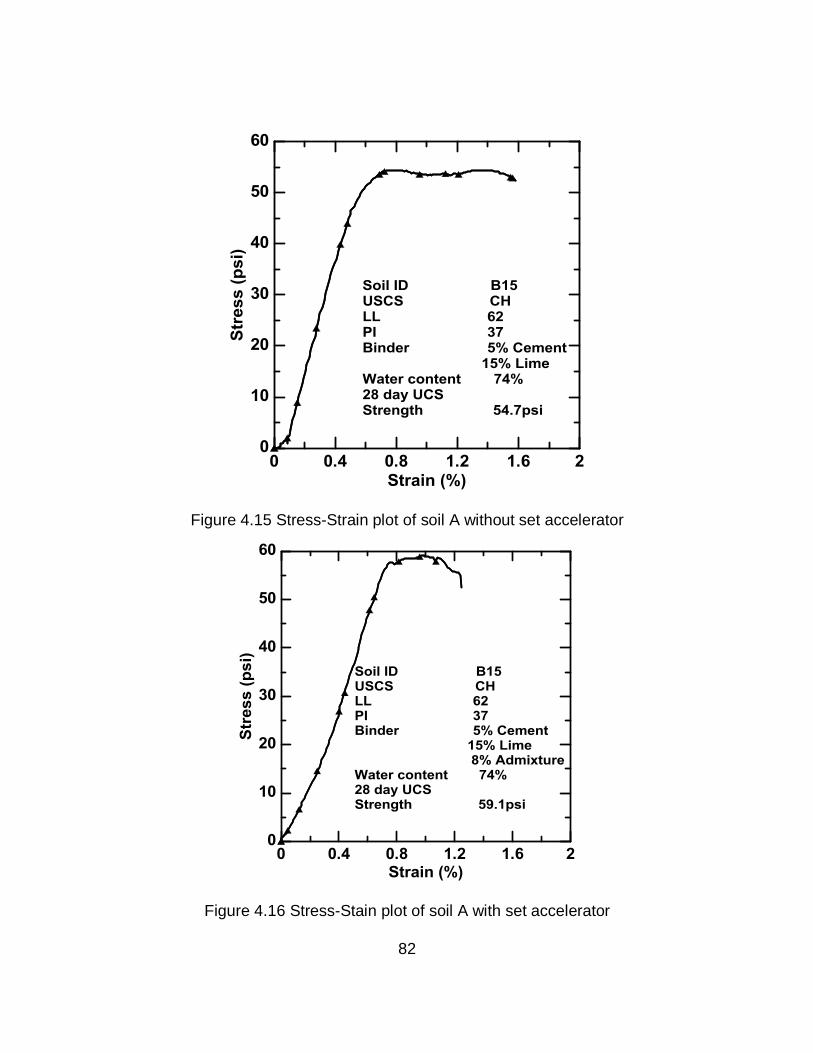
82
Figure 4.15 Stress-Strain plot of soil A without set accelerator
Figure 4.16 Stress-Stain plot of soil A with set accelerator
83
Figures show the stress strain plots of various mixes and these results
indicate that a steep increase in stress with initial strain and also these samples
experienced a failure known as brittle failure to semi brittle failure. Due to the
presence of large number of variables in these mixes, the compressive test
results cannot be compared or analyzed together. Detailed analysis is made in
the following sections on the probable factors that might have contributed to the
variations in test results such as binder dosage, binder proportion, binder types,
and set accelerator. tests for setting time were performed after compressive
strength tests, the results obtained for setting time tests did not met the
requirement (less than 5 hours) so set accelerator was added to some of the
mixes to lower the setting time, tests for compressive strengths with 8% set
accelerator by dry weight of binder were conducted to observe the variability of
compressive strength with respect to set accelerator and the results obtained
are presented here though the tests were performed after the setting time tests.
Compressive strength test results obtained for both the soils are shown on
Tables 4.10 and 4.11.

84
Table 4.10 Compressive test results of CLSM mixes for soil A
Material
Water
content at
the time of
casting (%)
Compressive strength
(psi)
Water content at
the time of
testing (%)
7 day 28 day 7 day 28 day
A_C6 72 28 49 68 64
A_C10 72 39 96 64 56
A_C15 72 76 134 60 52
A_F30 72 - - 62 56
A_L20 74 - 10 68 62
A_C5L10 74 18 68 65 54
A_C5L15 74 17 50 68 66
A_C5L20 76 17 46 65 65
A_C5F20 72 11 22 60 56
A_C10_S1 72 * 156 60 54
A_C15_S1 72 * 207 56 52
A_C5L10_S1 74 * 88 61 55
A_C5L15_S1 74 * 59 63 60
Note:"-" not ready for testing, "*" samples were not casted

85
Table 4.11 Compressive test results of CLSM mixes for soil B
Material
Water
content at
the time of
casting (%)
Compressive Strength
(psi)
Water content at
the time of
testing (%)
7 day 28 day 7 day 28 day
B_C6 54 39 56 46 44
B_C10 54 77 101 43 42
B_C15 54 117 178 45 42
B_F30 56 - - 45 40
B_L20 62 - 20.8 52 51
B_C5L10 58 19 73 48 46
B_C5L15 59 28 63 52 49
B_C5L20 60 17 54 51 50
B_C5F20 59 22 24 46 44
B_C10_S1 54 * 195 41 40
B_C15_S1 54 * 170 44 42
B_C5L10_S1 58 * 85 46 45
B_C5L15_S1 59 * 84 51 50
Note:"-" unfeasible for testing, "*" samples were not casted
4.4.3.1 Effect of binder dosages
Mix proportions from soil A, A_C6, A_C10, A_C15 and from soil B,
B_C6, B_C10, B_C15 are analyzed together to study the variations in
compressive strengths with the same cement binder. Figures 4.17 and 4.18
illustrate that with an increase in binder content, there was an increase in

86
unconfined compressive strengths for both the soils at both curing periods of 7
and 28 days.
However, this trend changed when test results of combined cement and
lime binders are considered for both the soil proportions. When the
compressive strengths of cement-lime and cement-fly ash mixes including
A_C5L10, A_C5L15, A_C5L20 and B_C5L10, B_C5L15, B_C5L20 are
combined and analyzed, the results showed a decrease in unconfined
compression strength values with an increase in chemical binder dosages. This
trend is quite opposite to the one noted in the case of cement treated CLSM
mixes. This variation in trend can be attributed to larger dosages of lime added
probably beyond the required dosages. Bell (1996) recommended that because
lime has neither appreciable friction nor cohesion, an excess amount serves as
lubricant to the soil particles and thereby decreases the unconfined
compression strength. Kumar et al. (2007) attributed strength reduction to the
platy shape of the unreacted lime particles. Dash et al. (2012) stated that lime
produces cementitious gel that has considerable volume of pores after reacting
with soil. Therefore, with increased lime content, the soil structure tends to be in
porous state that affects the strength gaining nature adversely. At very high lime
content, an overall decrease in strength occurs from excessive formation of this
gel material.
Figures 4.19 and 4.20 show the variation of compressive strength with
binder cement and lime together for both the soil proportions.

87
Figure 4.17 Variation of compressive strengths with respect to binder dosage for soil A
Figure 4.18 Variation of compressive strengths with respect to binder dosage for soil B

88
Figure 4.19 Variation of compressive strength with binder dosage for cement-lime mixes for soil A
Figure 4.20 Variation of compressive strength with binder dosage for cement-lime mixes for soil B

89
4.4.3.2 Effect of Binder types used
To study the variations in compressive strengths based on binder types,
effects of lime and fly ash admixtures are analyzed using the mixes A_C5L20,
A_C5F20 from soil A and B_C5L20, B_C5F20 from soil B as these mixtures
have same quantities of cement dosage, but different lime and fly ash additives.
Figures 4.21 and 4.22 show that mixes with lime and cement additives have
exhibited more strength than the mixes with fly ash and cement binders. This
increase in strength of cement-lime mixes can be attributed to active
participation of lime in pozzolanic reactions when compared to that of fly ash
binder.
Figure 4.21 Variation of compressive strengths with binder types for soil A

90
Figure 4.22 Variation of compressive strength with binder types for soil B
4.4.3.3 Effect of set accelerator
Results obtained for setting time tests did not met the requirement (less
than 5 hours), so set accelerator was added to some of the mixes to lower the
setting time. Tests for compressive strengths with 8% set accelerator by dry
weight of binder were conducted to observe the variability of compressive
strength with respect to set accelerator. Figures 4.23 and 4.24 depict the
variations in compressive strength of mixes with and without set accelerator. It
can be clearly noticed that the set accelerator which was used for reducing the
hardening time has enhanced the strength property of the mixes. Mix
proportions A_C10_S1, A_C15_S1, A_C5L10_S1, A_C5L15_S1 and
B_C10_S1, B_C15_S1, B_C5L10_S1, B_C5L15L_S1 can be compared to that

91
of same mix proportions without set accelerator to study the effect of set
accelerator on compressive strength. It is believed that accelerating admixture
increases the reactivity and hydration of C3S and C2S forming CSH (calcium
silica hydrate) gel and thereby increases the rate of reaction
(http://www.aximconcrete.com). This results with increased reaction of
hydrates, especially at early ages.
Figure 4.23 Variation of compressive strength with set accelerator for soil A

92
Figure 4.24 Variation of compressive strength with set accelerator for soil B
4.4.4 Elastic Moduli of CLSM Mixes and Results
Tables 4.12 and 4.13 shows the initial and secant modulus of all the
mixes studied in this research. The initial tangent elastic modulus, E i denotes
the initial slope of the stress-strain curve whereas secant elastic modulus E50
denotes the slope of line between the origin and a point where the stress level
is half of the peak strength on the stress-strain curve.

93
Table 4.12 Moduli results for soil A
Material UCS
(psi)
Initial
modulus (psi)
Secant
modulus (psi) Ei/UCS E50/UCS
A_C6 49 3400.0 6000.0 69.4 122.4
A_C10 96 7000.0 12000.0 72.9 125.0
A_C15 134 14333.3 20000.0 107.0 149.3
A_L20 10 205.9 2000.0 20.6 200.0
A_C5L10 68 3000.0 8871.0 44.1 130.5
A_C5L15 50 2222.2 8538.6 44.4 170.8
A_C5L20 46 1671.6 5789.5 36.3 125.9
A_C5F20 22 555.6 1200.0 25.3 54.5
A_C10_S1 156 1000.0 15000.0 6.4 96.2
A_C15_S1 207 2000.0 24186.0 9.7 116.8
A_C5L10_S1 88 566.7 8800.0 6.4 100.0
A_C5L15_S1 59 5833.3 7142.9 98.9 121.1
The results of this study yielded an E50 value in the range of 54 to 240
time’s compressive strength. In comparison, Kim et al. (2011) reported that the
E50 of rubber-added flowable material ranges between 87 to 172 times
compressive strength whereas Tang et al. (1996) found that the E50 of air-foam
added light weight soil was about 40 to 260 times the compressive strength.
This shows that the results obtained in this study are within the ranges that are
expected of typical CLSMs.

94
Table 4.13 Moduli results for soil B
Material UCS
(psi)
Initial
modulus (psi)
Secant
modulus (psi) Ei/UCS E50/UCS
B_C6 82 4000.0 7666.7 48.8 93.5
B_C10 101 7500.0 15517.2 74.3 153.6
B_C15 178 16000.0 26000.0 89.9 146.1
B_L20 20.8 3913.0 5000.0 188.1 240.4
B_C5L10 73 5000.0 12037.0 68.5 164.9
B_C5L15 63 4500.0 7000.0 71.4 111.1
B_C5L20 54 1500.0 5000.0 27.8 92.6
B_C5F20 24 2923.1 2100.0 121.8 87.5
B_C10_S1 195 10000.0 12857.1 51.3 65.9
B_C15_S1 170 23529.4 26562.5 138.4 156.3
B_C5L10_S1 85 8000.0 13125.0 94.1 154.4
B_C5L15_S1 84 5000.0 16607.1 59.5 197.7
Figures 4.25 and 4.26 show the moduli behaviors of CLSM with different
cement percentage. Elastic modulus over unconfined compressive strength is
taken as on ordinate where as abscissa represents the percentage of binder
used in the CLSMs. It can be noted that high stiffness values are obtained at
higher cement content which is expected with cement alone as the CLSM
binder. Both the soils have shown the same trend irrespective of modulus
considered.

95
Figures 4.27 and 4.28 depict the variation of stiffness behavior with lime
binder. It is observed that an increase in lime percentage resulted in stiffness
softening behavior of specimen. This indicates that lime is not as effective as
cement when it comes to enhancing strength and stiffness properties of
CLSMs. This also means that, for a given CLSM mixture used, binder types
appears to be the most governing factor for the development of stiffness or
moduli properties. Also, the results illustrate that mixes with cement as binder
are stiffer than those with lime due to high strength capacity of cement binders.
Figure 4.25 Variation of E/UCS with cement percentage for soil A

96
Figure 4.26 Variation of E/UCS with cement percentage for soil B
Figure 4.27 Variation of E/UCS with lime percentage for soil A

97
Figure 4.28 Variation of E/UCS with lime percentage for soil B
It can be observed from the figures that the coefficient of determination
values obtained for the trends reported in the figures are within the acceptable
range, though more mixes with different binders would have enhanced these
trends and reliability in these equations. These equations provided can be used
to estimate the stiffness value of the CLSM mixes and they need to be validated
with select laboratory tests on the CLSM samples.
4.4.5 Setting time
Efforts were made in the current research to achieve the setting time of
less than 5 hours as per TRWD specifications using Vicat’s apparatus. ASTM C
403 procedure was followed for testing the setting time for all the mix
proportions. Tests were performed on the initial mix proportions to observe the

98
setting time without adding set accelerator. The results obtained did not meet
the specification (less than 5 hours) and these are expected due to use of water
content for flowability considerations. Thus setting time of less than 5 hours
cannot be achieved without any chemical additives.
Table 4.14 shows the setting times of different mix proportions without
any set accelerator. Mixes with the cement as binder have lower setting times
as expected because of early strength gaining property of cement binder. Lime
and fly ash as well as cement treatments have taken longer time periods to
achieve strength hardening of the present soil mixtures.
Table 4.14 Setting time test results for all mix proportions without set accelerator
Material Water Content (%) Settingtime(hours)
A_C6 72 10
A_C10 72 8
A_C15 72 7
A_L20 74 >24
A_C5L10 74 28
A_C5L15 74 29
A_C5L20 76 25
A_C5F20 72 23
B_C6 54 8
B_C10 54 6
B_C15 54 5
B_L20 62 22
B_C5L10 58 18
B_C5L15 59 21
B_C5L20 60 23
B_C5F20 59 14

99
Set accelerators were added to some of these mix proportions whose 28
days strengths achieved the target strength values (70 to 150 psi). An initial
attempt of 8% set accelerator (amount added is equivalent to the percent of dry
weight of total binder amount) was added as per the recommendations of
manufacturer based on the desired setting time periods. The set period used
here is denoted by S1 in the notation. Test results obtained are presented in
Table 4.15.
Table 4.15 Setting time results with 8% set accelerator (weight of binder)
Material Water Content (%) Setting time (hours)
A_C10_S1 72 8
A_C15_S1 72 7
A_C5L10L_S1 74 28
A_C5L15_S1 74 29
B_C10_S1 54 5
B_C15_S1 54 5
B_C5L10_S1 58 19
B_C5L15_S1 59 21
It can be noticed from the table that the setting times obtained with 8%
set accelerator (S1) to dry weight of binder are not in desired range (less than 5
hours). Hence, a second trial of 8% set accelerator, termed as S2 was used. In
this case, the amount of set accelerator was established based on dry weight of
total soil content used in the mixture. The set accelerator amount was added to
the predetermined soil mixes and the test results obtained on these mix
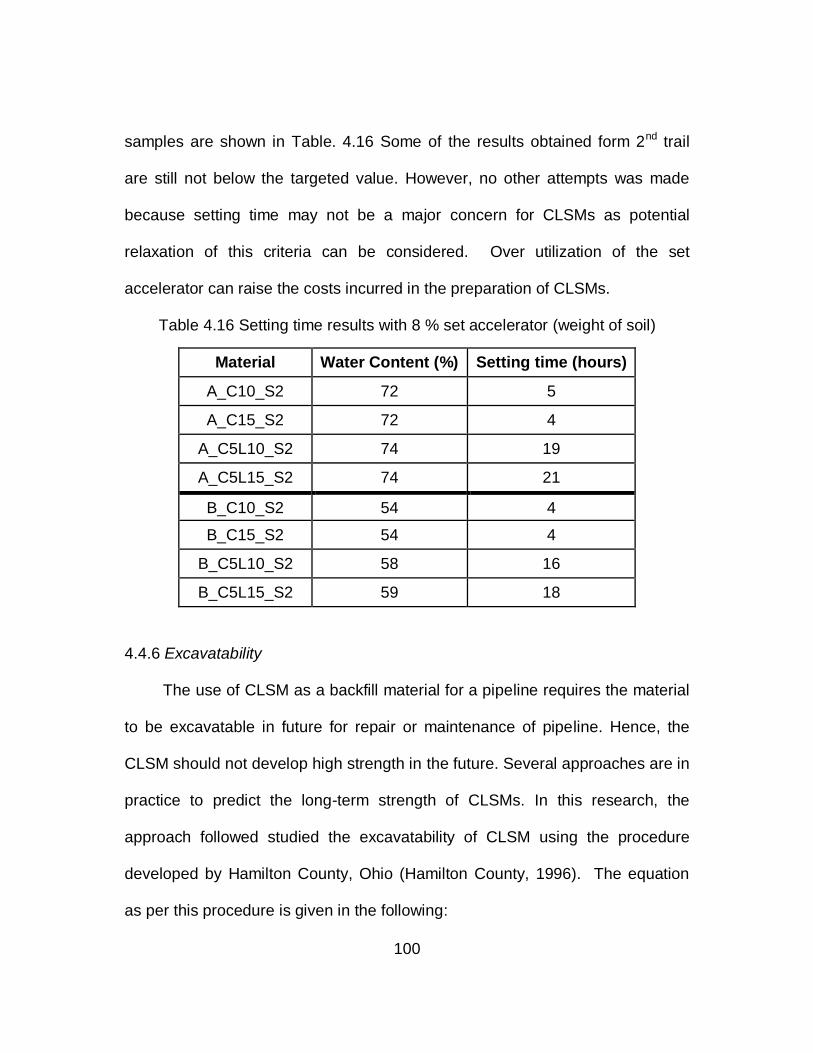
100
samples are shown in Table. 4.16 Some of the results obtained form 2nd trail
are still not below the targeted value. However, no other attempts was made
because setting time may not be a major concern for CLSMs as potential
relaxation of this criteria can be considered. Over utilization of the set
accelerator can raise the costs incurred in the preparation of CLSMs.
Table 4.16 Setting time results with 8 % set accelerator (weight of soil)
Material Water Content (%) Setting time (hours)
A_C10_S2 72 5
A_C15_S2 72 4
A_C5L10_S2 74 19
A_C5L15_S2 74 21
B_C10_S2 54 4
B_C15_S2 54 4
B_C5L10_S2 58 16
B_C5L15_S2 59 18
4.4.6 Excavatability
The use of CLSM as a backfill material for a pipeline requires the material
to be excavatable in future for repair or maintenance of pipeline. Hence, the
CLSM should not develop high strength in the future. Several approaches are in
practice to predict the long-term strength of CLSMs. In this research, the
approach followed studied the excavatability of CLSM using the procedure
developed by Hamilton County, Ohio (Hamilton County, 1996). The equation
as per this procedure is given in the following:
101
(2)
Where, RE = Removability Modulus
w = In-situ unit weight (pcf)
C = 28-day unconfined compressive strength (psi)
Some of the aforementioned mixes whose 28 day compressive strength
nearer or greater than 70 psi are considered for testing the excavatability of
material. Materials having the RE factor less than or equal to 1 are said to be
excavatable. For ‘A ’ soil, mixes with 10% cement, 5% cement+10% lime, and
5% cement with 10% lime and 8% set accelerator are considered excavatable
whereas for soil B, mixes with 5% cement with 10% lime and 5% cement with
15% lime are excavatable with and without set accelerator additive.
Excavatability of the considered mixes is shown in Table 4.17.
Finally, Tables 4.18 and 4.19 shows the mixes that are recommended for
field implementation and the properties obtained from the tests performed for all
the mixes are grouped together. Density values are not included as all the
mixes have their densities within the range specified (95 to 115 pcf).

102
Table 4.17 Excavatability of CLSM mixes
Material 28 day compressive
strength (psi)
Fresh
Density (pcf) RE Excavatable
A_C10 96 95 0.9 Yes
A_C15 134 98 1.2 No
A_C5L10 68 97 0.8 Yes
A_C10_S1 156 95 1.2 No
A_C15_S1 207 98 1.5 No
A_C5L10_S1 88 97 0.9 Yes
B_C10 101 104 1.1 No
B_C15 178 104 1.5 No
B_C5L10 73 104 0.9 Yes
B_C5L15 63 102 0.9 Yes
B_C10_S1 195 104 1.5 No
B_C15_S1 170 103 1.4 No
B_C5L10_S1 85 104 1.0 Yes
B_C5L15_S1 84 103 1.0 Yes

10
3
Table 4.18 Recommended CLSM mix designs without set accelerator
Sample
Flowability (in.) Density (pcf) UCS strength (psi) Setting time (hrs.)
Ex RC RS Result
Within range
Result Within range
Result Within range
Result Within range
A_C6 8.3 95 49 X 10 X Yes No
A_C10 9.50 95 96 8 X Yes Yes Setting
time
A_C15 8.75 98 134 7 X No No
A_L20 9.05 96 10 X >24 X Yes No
A_C5L10 9.10 97 68 X 28 X Yes Yes Setting
time
A_C5L15 9.05 97 50 X 29 X Yes No
A_C5L20 8.95 97 46 X 25 X Yes No
A_C5F20 9.00 99 22 X 23 X Yes No
B_C6 9.2 103 56 X 8 X Yes No
B_C10 9.80 104 101 6 X No Yes AEA’s
B_C15 10.40 104 178 X 5 X No No
B_L20 9.60 101 20.8 X 22 X Yes No
B_C5L10 9.20 104 73 18 X Yes Yes Setting
time
B_C5L15 8.90 102 63 X 21 X Yes No
B_C5L20 8.60 101 54 X 23 X Yes No
B_C5F20 9.60 104 24 X 14 X Yes No

10
3
Table 4.19 Recommended CLSM mix designs with set accelerator
Sample
Flowability (in.) Density (pcf) UCS strength
(psi) Setting time
(hrs.) Ex RC RS
Result Within range
Result Within range
Result Within range
Result Within range
A_C10_S1 9.50 95 156 X 8 X No No
A_C15_S1 9.05 98 207 X 7 X No No
A_C5L10_S1 8.70 97 88 28 X Yes Yes Setting
time
A_C5L15_S1 8.75 97 59 X 29 X Yes No
B_C10_S1 9.70 104 195 X 5 No No
B_C15_S1 10.00 103 170 X 5 No No
B_C5L10_S1 9.05 104 85 19 X Yes Yes Setting
time
B_C5L15_S1 8.80 103 84 21 X Yes No
Note: AEA’s-Decrease the density of mix by using Air Entraining Admixture (AEA’s are chemical admixtures used to decrease density); Ex- Excavatable as per Hamilton County, 1996 empirical relation; RC- Recommended; RS-
Recommended with corresponding Reservation
10
4

105
4.5 Recommended CLSMs and Summary
This section presents a summary of the experimental results of designed
mix proportions that were tested in the laboratory. Water content required for
flowability was first established. Setting times required for all the mixes were
later established. CLSM mix proportions that satisfy all the requirements are
then considered based on the experimental test results. The mix proportions
A_C10, A_C5L10 and A_C5L10_S1 achieved the minimum target compressive
strength of 70 psi can be implemented in the field provided setting time is not a
major concern as these mixes did not meet the set time criteria. Excavatability
will be an issue for the mixes, A_C10_S1, A_C15_S1 if set accelerator is used
as they cannot be excavated in future as per the empirical relation proposed by
Hamilton County, 1996.
When soil B is considered, mix B_C10 is recommended with setting time
as limitation by reducing the density using Air Entraining Admixture as the
removability modulus is closer to 1. Mixes, B_C5L10, B_C5L10_S1 can be
implemented in the field as they achieved the required compressive strength
with setting time as limitation and their excavatability modulus is less than 1.
Field evaluation should be done on all the mixes whose strengths are greater
than the minimum target strength as it is difficult to establish excavatability
issues with the laboratory tests.

106
CHAPTER 5
5SUMMARY, CONCLUSIONS AND RECOMMENDATIONS
5.1 Introduction
Two soils which are predominantly clayey were selected to evaluate their
use as fine aggregates in CLSM. Efforts were made to reduce the usage of
cement to make the mix designs more cost effective by varying binder types
and binder proportions. Finally, six mix designs are selected from different trails
whose properties met most of the specifications made by TRWD. However,
field evaluation has to be done on these mixes to assess the excavatability as it
is hard to predict it based on laboratory testing. Overall this research is
successful in the developing mix design for CLSM using native soil as a fine
aggregate material.
This chapter presents the summary of test results and the conclusions
drawn from the analysis of chapter 4. Recommendations for further research
are also provided in this chapter.
5.2 Summary and Conclusions
The summary of the results and conclusions derived from this research
are summarized as follows.

107
Water quantities required for flowability for all the proposed mixes is
established by the ASTM standard method, D 6103-97 and the results
proven that CLSM starts flowing when the moisture content is around
the liquid limit of the fine aggregate component of the CLSM, indicating
the flowability of the CLSM is dependent on the moisture properties of
the fine material component.
Water content required for flowability was reduced by 22% when B14
soil was added to the mixture as B14 soil which is CL has a lower
liquid limit value than the primary soil which is CH.
The density results of the proposed mixes are within the range
specified by the Tarrant Regional Water District (TRWD) of 95 to 115
pcf.
Set accelerator used for lowering the setting time had some impact on
the flowability of the material. The variations in results were minimal
because of the smaller time lapse for flowability test. Flowability of the
material was affected by binder types as mixes with cement have
higher flow diameters when compared to those of lime based mixtures.
The specification followed in the present experimental design requires a
28 day minimum strength of 70 psi and a maximum strength of 150 psi
for controlled low strength material. The average 28 day compressive
strength results obtained for mix proportions including A_C10, A_C15,

108
A_C5L10_S1, B_C10, B_C5L10, B_C5L10_S1 and B_C5L15_S1 have
met this requirement.
Increase in cement content resulted increase in compressive strength
whereas lime content addition has resulted in a decrease of overall
strength of the material. This can be attributed to excessive dosage of
lime beyond the required for the reactions as excessive lime results in
formation of cementitious gel that has considerable volume of pores
after reacting with soil and also excess amount serves as lubricant to
the soil particles and thereby decreases the strength (Bell, 1996). Best
results are observed when 5% cement with 10% lime are used in
combination.
Increase in cement content enhances the stiffness behavior of the
material prepared while increase in lime content resulted in a decrease
in stiffness of the material. This shows the less hardening behavior of
lime when compared to higher hardening of cement binder.
Set accelerator used to lower the setting time enhanced the strengths
of A_C10_S1, A_C15_S1, B_C10_S1 and B_C15_S1 mixes, thus
making them unexcavatable in future as per Hamilton County, 1996
empirical relation.
Higher amounts of set accelerator are needed to lower the hardening
time because of the presence of high water content in the mix.

109
5.3 Recommendations for Future Research
1. Durability tests and analysis needs to be conducted on the proposed
mixes to determine the loss of strength with time.
2. Field evaluations have to be made to analyze the excavatability of the
material for future repairs as it is hard to estimate the excavatability of
the material based on laboratory testing.
3. Cost analysis has to be made to determine the most economical design
of all the proposed mixes.
4. Chemical additives other than set accelerator such as air entraining
agents which lowers the required water content should to be tried to
meet the target setting time.

110
7
8REFERENCES
1) American Concrete Institute (ACI) Committee 229. (1994). “Controlled Low-
Strength Materials”, Report 229.94, Vol.16, No.7, American Concrete
Institute, Framington Hills, 55-64.
2) Baghdadi, Z.A., Fatani, M.N. and Sabban, N.A., (1995) “Soil Modification by
Cement Kiln Dust,” Journal of Materials in Civil Engineering, ASCE, Vol. 7,
No.4, 218-222.
3) Bell, F. G. (1996). “Lime Stabilization of Clay Minerals and Soils.”
Engineering Geology, Vol.42, No. 4, 223–237.
1) Bhat, S.T. and Lovell, C. W.; et al., (1995) “Flowable Fill Using Waste
Foundry Sand,” Research Report, Purdue University, W. Lafayette, Ind.
2) Borris, D. P., and Boody, P. W., (eds.) 1980. Proceedings of the
International Symposium on Phosphogypsum. Publ. 01-001-017. Florida
Institute of Phosphate Research, Bartow, FL.
3) Brewer, W. E., 1994, “Durability Factors Affecting CLSM”, Controlled Low-
Strength Materials, STP-150, American Concrete Institute, Michigan, 41-43.
4) Collins, R.J., and Tyson, S.S., (October, 1993) “Utilization of Coal Ash in
Flowable Fill Applications“, Proceedings of the Symposium on Recovery
and Effective Reuse of Discarded Materials and By-Products for

111
Construction of Highway Facilities, Federal Highway Administration,
Denver, Colorado.
5) Collins, R.J., and Ciesielski, S.K., (1994) “Recycling and Use of Waste
Materials and By-Products in Highway Construction”, National Cooperative
Highway Research Program Synthesis of Highway Practice 199,
Transportation Research Board, Washington, DC.
6) Crouch, L. K., Gamble, R., Brogdon, J. F., and Tucker, C. J., (1998) “Use of
High-Fines Limestone Screenings as Aggregate for Controlled Low-
Strength Material (CLSM),” The Design and Application of Controlled Low-
Strength Materials (Flowable Fill), ASTM STP 1331, A.K. Howard and J.L.
Hitch, Eds., American Society for Testing and Materials.
7) Dash, S. K., Hussain, M., (2012) “Lime Stabilization of Soils: Reappraisal,”
ASCE Journal of Materials in Civil Engineering, 707-714.
8) Davis, T.A.; and Hoods, D.B., 1974, “Study of the State of the Art of
Disposal and Utilization of Waste Kiln Dust from the Cement Industry,”
Report of the U.S. EPA, Grant No. R-801872, Southern Research Institute,
Birmingham, Ala.
9) Dockter, B.A., (1998) “Comparison of Dry Scrubber and Class C Fly Ash in
Controlled Low-Strength Materials (CLSM) Applications”, The Design and
Application of Controlled Low-Strength Materials (Flowable Fill), ASTM STP
1331, A.K. Howard and J.L Hitch, Eds., American Society for Testing and
Materials.

112
10) Du, L., Folliard, K. J., and Trejo, D., (2002) “Effects of Constituent Materials
and Quantities on Water Demand and Compressive Strength of Controlled
Low-Strength Material”, ASCE Journal of Materials in Civil Engineering, Vol.
14, No.6, 485-495.
11) Du, L., Miqiel, K., Folliard, K. J., Soheil, N., and Trejo, D., (2006) “Rapid-
Setting CLSM for Bridge Approach Repair”, ACI Materials Journal, Vol. 103,
No. 5, 312-318.
12) Duritsch. D. W., (1993) “The Use of Non-Toxic Spent Foundry Sand into
Controlled Low-Strength Materials in Ohio”, The Institute of Advanced
Manufacturing Sciences, Cincinnati, 6 pp.
13) Finney, A. J., Shorey, E. F., Anderson, J., (2008) “Use of Native Soil in
Place of Aggregate in Controlled Low Strength Material (CLSM)”, Pipeline
Congress, ASCE Journal of Materials in Civil Engineering.
14) Folliard, K. J., Trejo, David, and S. A. Sabol (1999) “Controlled Low-
Strength Material for Backfill, Utility Bedding, Void Fill, and Bridge
Approaches”, NCHRP 24-12 Phase I Interim Report, Delaware
Transportation Institute, University of Delaware, Newark.
15) Folliard, K. J., Du, Lianxiang and Trejo, David, (2003) “Effect of Curing
Conditions on Strength Development of Controlled Low-Strength Material”,
ACI Materials Journal, Vol.100, No.1, 79-85.

113
16) Folliard, K. J., Trejo, David, Sabol, S. A., and Leshchinsky, D., (2008)
“Development of a Recommended Practice for Use of Controlled Low-
Strength Material in Highway Construction”, NCHRP 597 Report, 5-39.
17) Galvao, C. T., Elsharief, A., and Simoes, F. G. (2004) “Effects of Lime on
Permeability and Compressibility of Two Tropical Residual Soils”, Journal of
Environmental Engineering, ASCE, August 2004, 881-885.
18) Gandham, S., Seals, R. K. and Foxworthy, P. T., (1996) “Phosphogypsum
as a Component of Flowable Fill”, Transportation Research Record,
Transportation Research Board, Washington, D.C., No.1546, 79-87.
19) Gardner, M. R., (1998) “Developing CLSM to Meet Industry and
Construction Needs”, The Design and Application of Controlled Low-
Strength Materials (Flowable Fill), ASTM STP 1331, A. K. Howard and J. L.
Hitch, Eds., American Society for Testing and Materials.
20) Greaves, H. M. (1996). “An Introduction to Lime Stabilization”, Lime
Stabilization, Proceedings of the Seminar at Loughborough University, Civil
& Building Engineering Department, Tomas Telford Publishing Ltd., London.
5-11.
21) Green, B. H., Staheli, K., Bernett, D., and Walley, D. M., (1998). “Fly-Ash-
Based Controlled Low-Strength Material (CLSM) Used for Microtunneling
Applications”, The Design and Application of Controlled Low-Strength
Materials (Flowable Fill), ASTM STP 1331, A. K. Howard and J. L. Hitch,
Eds., American Society for Testing and Materials.
114
22) Hook, W. and Clem, D. A., (1998) “Innovative Uses of Controlled Low-
Strength Material (CLSM) in Colorado”, The Design and Application of
Controlled Low-Strength Materials (Flowable Fill), ASTM STP 1331, A. K.
Howard and J. L. Hitch, Eds., American Society for Testing and Materials.
23) Hoopes, R.J., (1998) “Engineering Properties of Air-Modified Controlled
Low-Strength Material”, The Design and Application of Controlled Low-
Strength Materials (Flowable Fill), ASTM STP 1331, A. K. Howard and J. L.
Hitch, Eds., American Society for Testing Materials.
24) Howard, A. K., 1996, Pipeline Construction: Relativity Publishing,
Lakewood, CO, Chapter 13, Soil-Cement Slurry, 1-18.
25) Howard, A. K., and Bowles, L., (2011) “Flowable Fill and the Ridges Basin
Inlet Conduit”, Pipeline Congress, ASCE Journal of Materials in Civil
Engineering.
26) Karduri, R. K. R. (2011). Sustainable Reutilization of Excavated Trench
Material. (Master thesis). Retrieved from ProQuest Dissertations and
Theses. (Accession Order No. AAT 1506300).
27) Katz, A., Kovler, K., (2004) “Utilization of Industrial By-Products for the
Production of Controlled Low-Strength Materials”, Journal of Waste
Management. Vol. 24, No.5, 501–12.
28) Krell, W. C., (1998) “Flowable Fly Ash”, Transportation Research Record,
Transportation Research Board, Washington, D. C., No.1234, 8-12.

115
29) Lime Manual, (2004). “Lime-Treated Soil Construction Manual – Lime
Stabilization and Lime Modification”, published by National Lime
Association, USA, Bulletin 326, January 2004.Lime manual, 2004.
30) Mason, T.F., (1998) “Use of Controlled Density to Fill Underslab Void”, The
Design and Application of Controlled Low-Strength Materials (Flowable Fill),
ASTM STP 1331, A. K. Howard and J. L. Hitch, Eds., American Society for
Testing and Materials.
31) Naik, T. R., and Singh, S. S., (1997) “Flowable Slurry Containing Foundry
Sands”, ASCE Journal of Materials in Civil Engineering, Vol.9, No.2, 93-
101.
32) Naik, T. R., Kraus, R. N., Strut. R. F., and Siddique, R., (2003) “Controlled
Low-Strength Materials Containing Mixtures of Coal Ash and New
Pozzolanic Material”, ACI Materials Journal, Vol.100, No.3, 208-215.
33) Ohlheiser, T. R., (1998) “Utilization of Recycled Glass as Aggregate in
Controlled Low-Strength Material (CLSM)”, The Design and Application of
Controlled Low-Strength Materials (Flowable Fill), ASTM STP 1331, A. K.
Howard and J. L. Hitch, Eds., American Society for Testing and Materials.
34) Pierce, C. E., Gassman, S. L., and Richards, T. M., (2002) “Long-Term
Strength Development of Controlled Low-Strength Material”, ACI Materials
Journal, Vol.99, No.2, 157-164.
116
35) Pierce, C. E., Blackwell, M. C., (2003) “Potential of Scrap Tire Rubber as
Lightweight Aggregate in Flowable Fill’, Waste Management, Vol.23.
Elsevier Science Ltd., 197-208.
36) Pierce, C. E., Tripathi, H., and Brown, T. W., (November-December 2003)
“Cement Kiln Dust in Controlled Low-Strength Materials” ACI Materials
Journal, Vol.100, No.6, 455-462.
37) Pons, F., Landwermeyer, J. S., Kerns, L., (1998) “Development of
Engineering Properties for Regular and Quick-Set Flowable Fill”, The
Design and Application of Controlled Low-Strength Materials (Flowable Fill),
ASTM STP 1331, A. K. Howard and J. L. Hitch, Eds., American Society for
Testing and Materials.
38) Riggs, E. H., and Keck, R. H., (1998) “Specifications and Use of Controlled
Low-Strength Materials by State Transportation Agencies”, The Design and
Application of Controlled Low-Strength Materials (Flowable Fill), ASTM STP
1331, A. K. Howard and J. L. Hitch, Eds., American Society for Testing and
Materials.
39) Snethen, D. R., and Benson, J. M., (1998) “Construction of CLSM Approach
Embankment to Minimize the Bump at the End of the Bridge”, The Design
and Application of Controlled Low-Strength Materials (Flowable Fill), ASTM
STP 1331, A. K. Howard and J. L. Hitch, Eds., American Society for Testing
and Materials.

117
40) Siddique, R., (2009) “Utilization of waste materials and by-products in
producing Controlled Low-Strength Materials”, Conservation and Recycling,
Vol. 54, 1-8.
41) Tikalsky, P. J., Smith, E., and Regan, R. W., (1998) “Proportioning Spent
Casting Sand in Controlled Low-Strength Materials”, ACI Materials Journal,
Vol.95, No.6, 740-746.
42) Tikalsky, P., Gaffney, M., Regan, R., (2000) “Properties of Controlled Low-
Strength Material Containing Foundry Sand”, ACI Materials Journal, Vol. 97,
No. 6, 698–702.
43) Trejo, D., Folliard, K., and Du, L., (2003) “Alternative Capping Materials for
Evaluating the Compressive Strength of Controlled Low-Strength Materials”,
ASCE Journal of Materials in Civil Engineering, Vol.15, No.5, 474-490.
44) Wu, J. Y., Eng., E., (2005) “Soil Based Flowable Fill for Pipeline
Construction”, “Pipelines Optimizing Design, Operations, and Maintenance”,
Pipeline Division Specialty Conference.
45) Zhu, J., Zaman, M., and Laguros, J. G., (1999) “Resilient Modulus and
Microstructure of Cement Kiln Dust Stabilized Base/Subbase Aggregate”,
Soils and Foundations, Japanese Geotechnical Society, Vol. 39, No. 6, 33–
42.
46) http://www.aximconcrete.com.
47) http://thestainstore.net.

118
9BIOGRAPHICAL INFORMATION
Anil Kumar Raavi was born on 10th October 1988 in Vijayawada,
Andhra Pradesh, India. He joined in Velagapudi Ramakrishna Siddhartha
Engineering College to pursue his bachelor’s degree. He received his
bachelor’s degree in Civil Engineering from Acharya Nagarjuna University in
2010. He joined the University of Texas at Arlington in 2010 to pursue his
Masters in Civil Engineering with a major concentration in Geotechnical
Engineering. At UTA, he performed research on design of Controlled Low
Strength Material (CLSM) under the guidance of Professor Anand J. Puppala
and successfully defended his thesis in July 2012. He had the chance to work
in various research projects involving basic and advanced soil testing,
performance monitoring of geofoam as an embankment material and various
chemical studies on soil.