Embed Size (px)
Citation preview
Design of Cyclone Shelters Based on Wind Tunnel Studies
S. Selvi Rajan
Chief Scientist and Head, Wind Engineering Lab., CSIR-SERC, CSIR Road, Taramani, Chennai, India, [email protected]
About 2 to 3 tropical cyclones form every year along the coastal line of South Asia, bringing intense winds andsevere flooding with large loss of lives due to storm surge. Therefore, construction of shelters along vulnerablecoastal areas is one of the important cyclone mitigation measures. As these shelters are to be protected fromstorm surge, ground floor area is left open to allow storm water to pass through during the event. This howeverleads to increased loading on the bottom floor slab for which, currently there are no Codal provisions for com-puting wind loads using pressure coefficients on such kind of special structures. Hence, CSIR-SERC has carriedout pressure measurement studies on 1:50 scale models of two cyclone shelters under simulated cyclonic con-ditions using an auxiliary device developed in-house. The pressure distribution on various faces of the cycloneshelter for 0° and 90° angles of wind incidence are evaluated. As the critical angle of wind incidence is 0°, thepressure coefficients corresponding to 0° is only presented in this paper.
Keywords: Cyclone, Wind tunnel, Auxiliary device, Pressure coefficient, Angles of wind incidence.
Introduction
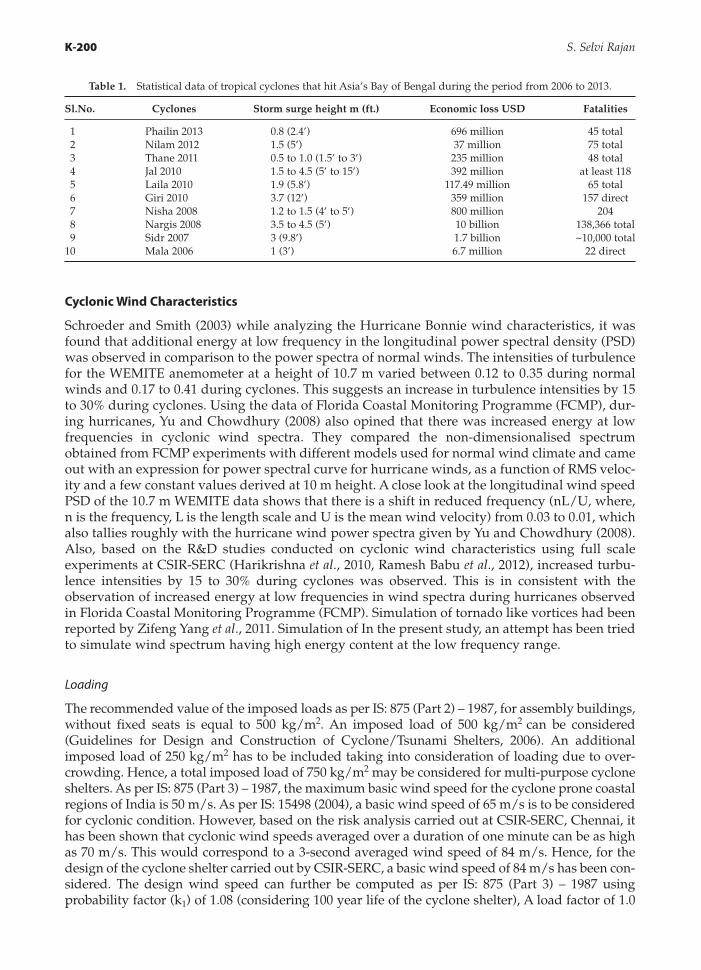
The coastal line of Bay of Bengal in South Asia has a maximum length of 5000 km (approximate)and the weather conditions there are often brutal due to heavy monsoon rains, both summer andwinter (http://en.wikipedia.org/wiki/Bay_of_Bengal). About 2 to 3 tropical cyclones form everyyear, bringing intense winds and severe flooding. Owing to the funnel shape of the shallow Bayof Bengal and low-lying zigzag terrain, waters churn up due to variation in atmospheric pressureduring cyclones, throwing up walls of water produced directly by the strong winds, from 8 m to10 m high (Murthy et. al., 1986). There were about 10 cyclones that hit Asia’s Bay of Bengal dur-ing the period from 2006 to October 2013. The statistical data as given in Table 1 shows the largeloss of lives (according to wikipedia), which is attributed primarily due to very severe storm surgein the region. Table 1 clearly reveals that the number of fatalities had drastically reduced lately,when compared to the year 2008, due to progression in the warning system. This warrants devel-opment of infra structure to abandon the local people living in low-lying areas. Cyclone sheltersform a major infrastructural facility to save vulnerable population from the onslaught of stormsurges during the occurrence of cyclone disturbances. The marooned people are temporarily evac-uated on receipt of warnings and they need to be looked after for 2–3 days by arranging shelter,food and health care facilities. Therefore, construction of shelters along vulnerable coastal areas isone of the important cyclone disaster mitigation measures (Guidelines for Design andConstruction of Cyclone/Tsunami Shelters, GoI 2006). In addition, these shelters are to be pro-tected from storm surge and hence the ground floor area has to be left open to allow storm waterto pass through during the event.
At the request of Indian and German Red Cross and KfW, Germany, CSIR-SERC has designeda stilted cyclone shelter for use in Orissa coast with specialized foundation. The 23 cyclone shel-ters constructed at Orissa have saved nearly 46,000 people during the Super Cyclone which hitOrissa in 1999 and many of these structures are still in service, withstanding the recently hit‘Phailin’ cyclone in October 2013. Recently, National Disaster Management Authority (NDMA,Govt. of India) is also embarking on a large project involving many cyclone shelters being builtalong the entire cyclone prone regions of the country. Based on the experiences of various stagesin construction and maintenance of cyclone shelters, a common strategy has been evolved for sus-tainable use of the shelters, by Ministry of Home Affairs, Government of India (2006).
The Eighth Asia-Pacific Conference on Wind Engineering,December 10–14, 2013, Chennai, India
Copyright © 2013 APCWE-VIII. Published by Research Publishing Services.ISBN: 978-981-07-8012-8 :: doi:10.3850/978-981-07-8012-8_Key-10
K-199
Key-10.qxd 11/26/2013 10:38 AM Page K-199
Cyclonic Wind Characteristics
Schroeder and Smith (2003) while analyzing the Hurricane Bonnie wind characteristics, it wasfound that additional energy at low frequency in the longitudinal power spectral density (PSD)was observed in comparison to the power spectra of normal winds. The intensities of turbulencefor the WEMITE anemometer at a height of 10.7 m varied between 0.12 to 0.35 during normalwinds and 0.17 to 0.41 during cyclones. This suggests an increase in turbulence intensities by 15to 30% during cyclones. Using the data of Florida Coastal Monitoring Programme (FCMP), dur-ing hurricanes, Yu and Chowdhury (2008) also opined that there was increased energy at lowfrequencies in cyclonic wind spectra. They compared the non-dimensionalised spectrumobtained from FCMP experiments with different models used for normal wind climate and cameout with an expression for power spectral curve for hurricane winds, as a function of RMS veloc-ity and a few constant values derived at 10 m height. A close look at the longitudinal wind speedPSD of the 10.7 m WEMITE data shows that there is a shift in reduced frequency (nL/U, where,n is the frequency, L is the length scale and U is the mean wind velocity) from 0.03 to 0.01, whichalso tallies roughly with the hurricane wind power spectra given by Yu and Chowdhury (2008).Also, based on the R&D studies conducted on cyclonic wind characteristics using full scaleexperiments at CSIR-SERC (Harikrishna et al., 2010, Ramesh Babu et al., 2012), increased turbu-lence intensities by 15 to 30% during cyclones was observed. This is in consistent with theobservation of increased energy at low frequencies in wind spectra during hurricanes observedin Florida Coastal Monitoring Programme (FCMP). Simulation of tornado like vortices had beenreported by Zifeng Yang et al., 2011. Simulation of In the present study, an attempt has been triedto simulate wind spectrum having high energy content at the low frequency range.
Loading
The recommended value of the imposed loads as per IS: 875 (Part 2) – 1987, for assembly buildings,without fixed seats is equal to 500 kg/m2. An imposed load of 500 kg/m2 can be considered(Guidelines for Design and Construction of Cyclone/Tsunami Shelters, 2006). An additionalimposed load of 250 kg/m2 has to be included taking into consideration of loading due to over-crowding. Hence, a total imposed load of 750 kg/m2 may be considered for multi-purpose cycloneshelters. As per IS: 875 (Part 3) – 1987, the maximum basic wind speed for the cyclone prone coastalregions of India is 50 m/s. As per IS: 15498 (2004), a basic wind speed of 65 m/s is to be consideredfor cyclonic condition. However, based on the risk analysis carried out at CSIR-SERC, Chennai, ithas been shown that cyclonic wind speeds averaged over a duration of one minute can be as highas 70 m/s. This would correspond to a 3-second averaged wind speed of 84 m/s. Hence, for thedesign of the cyclone shelter carried out by CSIR-SERC, a basic wind speed of 84 m/s has been con-sidered. The design wind speed can further be computed as per IS: 875 (Part 3) – 1987 usingprobability factor (k1) of 1.08 (considering 100 year life of the cyclone shelter), A load factor of 1.0
K-200 S. Selvi Rajan
Table 1. Statistical data of tropical cyclones that hit Asia’s Bay of Bengal during the period from 2006 to 2013.
Sl.No. Cyclones Storm surge height m (ft.) Economic loss USD Fatalities
1 Phailin 2013 0.8 (2.4’) 696 million 45 total2 Nilam 2012 1.5 (5’) 37 million 75 total3 Thane 2011 0.5 to 1.0 (1.5’ to 3’) 235 million 48 total4 Jal 2010 1.5 to 4.5 (5’ to 15’) 392 million at least 1185 Laila 2010 1.9 (5.8’) 117.49 million 65 total6 Giri 2010 3.7 (12’) 359 million 157 direct7 Nisha 2008 1.2 to 1.5 (4’ to 5’) 800 million 2048 Nargis 2008 3.5 to 4.5 (5’) 10 billion 138,366 total9 Sidr 2007 3 (9.8’) 1.7 billion ~10,000 total
10 Mala 2006 1 (3’) 6.7 million 22 direct
Key-10.qxd 11/26/2013 10:38 AM Page K-200
is recommended for wind loads, whereas a load factor of 1.5 is recommended for both dead andimposed loads. As these cyclone shelters are to be protected from storm surge, ground floor area isleft open to allow storm water to pass through during the event. This however leads to additionalwind loading on the bottom floor slab. IS:875 (Part 3) – 1987 does not give recommendations forthis type of stilted structures for computing suction wind pressure acting on the bottom slab of thebuilding wherein wind flow can occur below the floor slab. Hence, CSIR-SERC has carried outpressure measurement studies on two selected models of cyclone shelters to evaluate pressure dis-tribution based on wind tunnel studies under simulated cyclonic wind characteristics incomparison to the pressure distribution under normal simulated boundary layer wind conditions.
Structural Configuration of Cyclone Shelter
The detailed structural configuration of the cyclone shelter models 1 and 2 have been presentedin this section. Majority of the previous cyclone shelters in India are circular in plan. The forcecoefficients for circular cylinders are lower compared to other structural forms, and hence theabove shape may have been chosen earlier. However, the effective floor area utilization is sig-nificantly lower with a circular plan. Hence, the selected cyclone shelters have been designedwith rectangular plan shape even though it attracts more wind loads. However, in case of model2, the efficiency of the structural layout has been improved by providing rounded corners forbetter aerodynamic effect.
Model 1
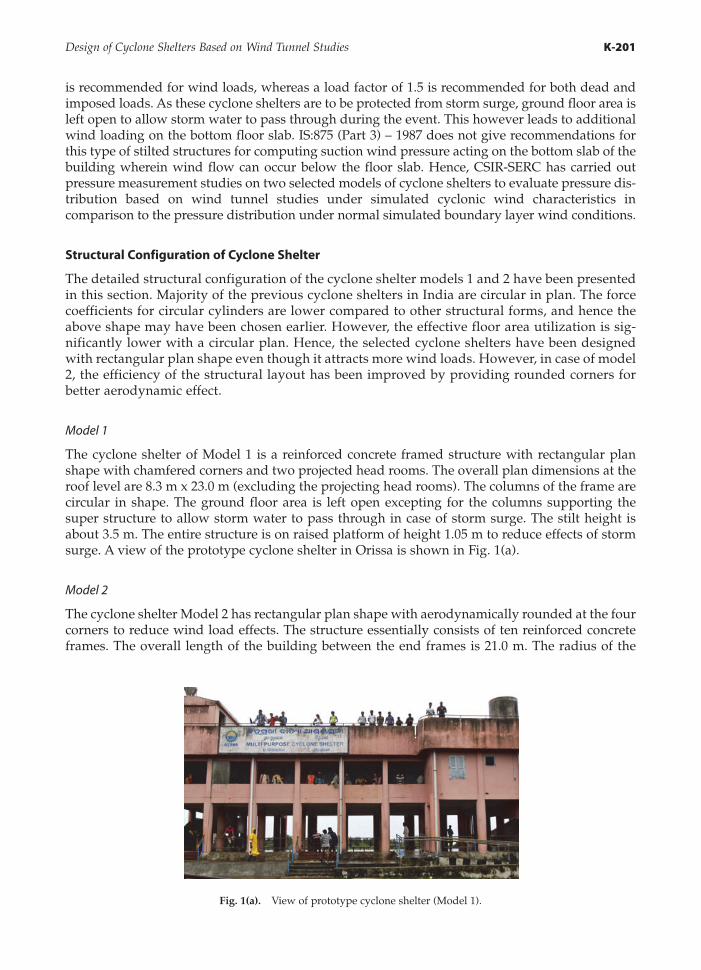
The cyclone shelter of Model 1 is a reinforced concrete framed structure with rectangular planshape with chamfered corners and two projected head rooms. The overall plan dimensions at theroof level are 8.3 m x 23.0 m (excluding the projecting head rooms). The columns of the frame arecircular in shape. The ground floor area is left open excepting for the columns supporting thesuper structure to allow storm water to pass through in case of storm surge. The stilt height isabout 3.5 m. The entire structure is on raised platform of height 1.05 m to reduce effects of stormsurge. A view of the prototype cyclone shelter in Orissa is shown in Fig. 1(a).
Model 2
The cyclone shelter Model 2 has rectangular plan shape with aerodynamically rounded at the fourcorners to reduce wind load effects. The structure essentially consists of ten reinforced concreteframes. The overall length of the building between the end frames is 21.0 m. The radius of the
Design of Cyclone Shelters Based on Wind Tunnel Studies K-201
Fig. 1(a). View of prototype cyclone shelter (Model 1).
Key-10.qxd 11/26/2013 10:38 AM Page K-201
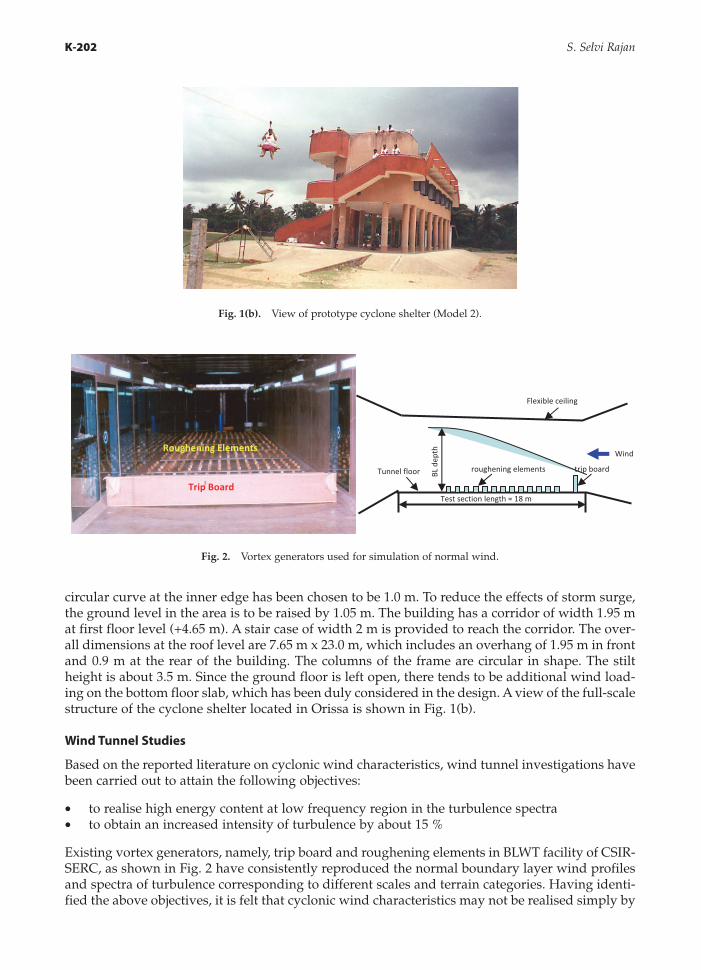
circular curve at the inner edge has been chosen to be 1.0 m. To reduce the effects of storm surge,the ground level in the area is to be raised by 1.05 m. The building has a corridor of width 1.95 mat first floor level (+4.65 m). A stair case of width 2 m is provided to reach the corridor. The over-all dimensions at the roof level are 7.65 m x 23.0 m, which includes an overhang of 1.95 m in frontand 0.9 m at the rear of the building. The columns of the frame are circular in shape. The stiltheight is about 3.5 m. Since the ground floor is left open, there tends to be additional wind load-ing on the bottom floor slab, which has been duly considered in the design. A view of the full-scalestructure of the cyclone shelter located in Orissa is shown in Fig. 1(b).
Wind Tunnel Studies
Based on the reported literature on cyclonic wind characteristics, wind tunnel investigations havebeen carried out to attain the following objectives:
• to realise high energy content at low frequency region in the turbulence spectra• to obtain an increased intensity of turbulence by about 15 %
Existing vortex generators, namely, trip board and roughening elements in BLWT facility of CSIR-SERC, as shown in Fig. 2 have consistently reproduced the normal boundary layer wind profilesand spectra of turbulence corresponding to different scales and terrain categories. Having identi-fied the above objectives, it is felt that cyclonic wind characteristics may not be realised simply by
K-202 S. Selvi Rajan
Fig. 1(b). View of prototype cyclone shelter (Model 2).
BL d
epth
roughening elements trip board
Wind
Flexible ceiling
Test section length = 18 m
Tunnel floor
Trip Board
Roughening Elements
Fig. 2. Vortex generators used for simulation of normal wind.
Key-10.qxd 11/26/2013 10:38 AM Page K-202
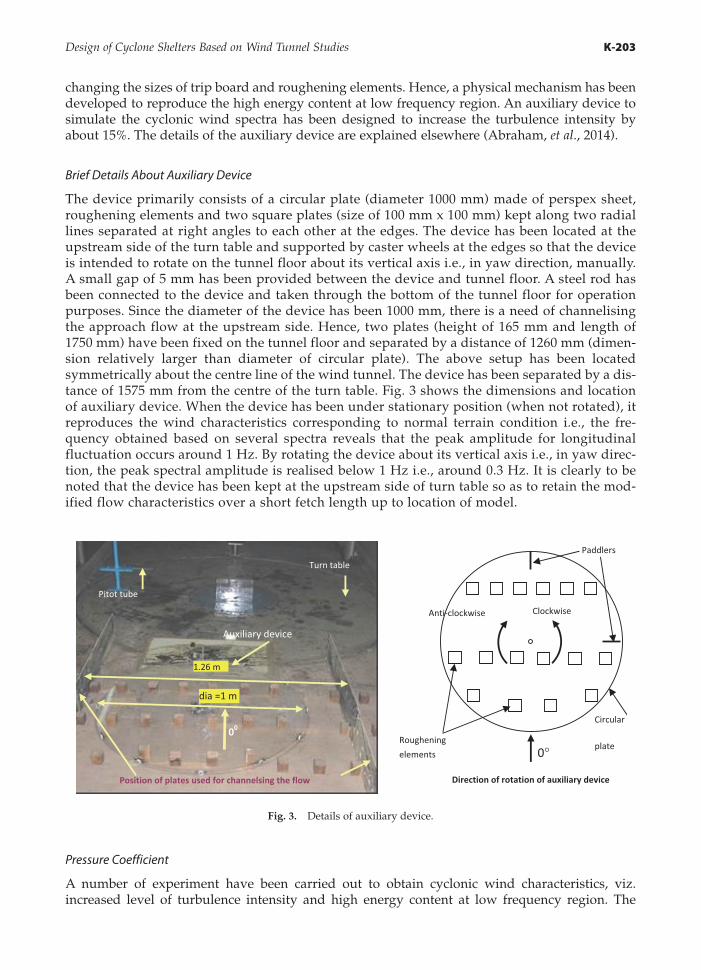
changing the sizes of trip board and roughening elements. Hence, a physical mechanism has beendeveloped to reproduce the high energy content at low frequency region. An auxiliary device tosimulate the cyclonic wind spectra has been designed to increase the turbulence intensity byabout 15%. The details of the auxiliary device are explained elsewhere (Abraham, et al., 2014).
Brief Details About Auxiliary Device
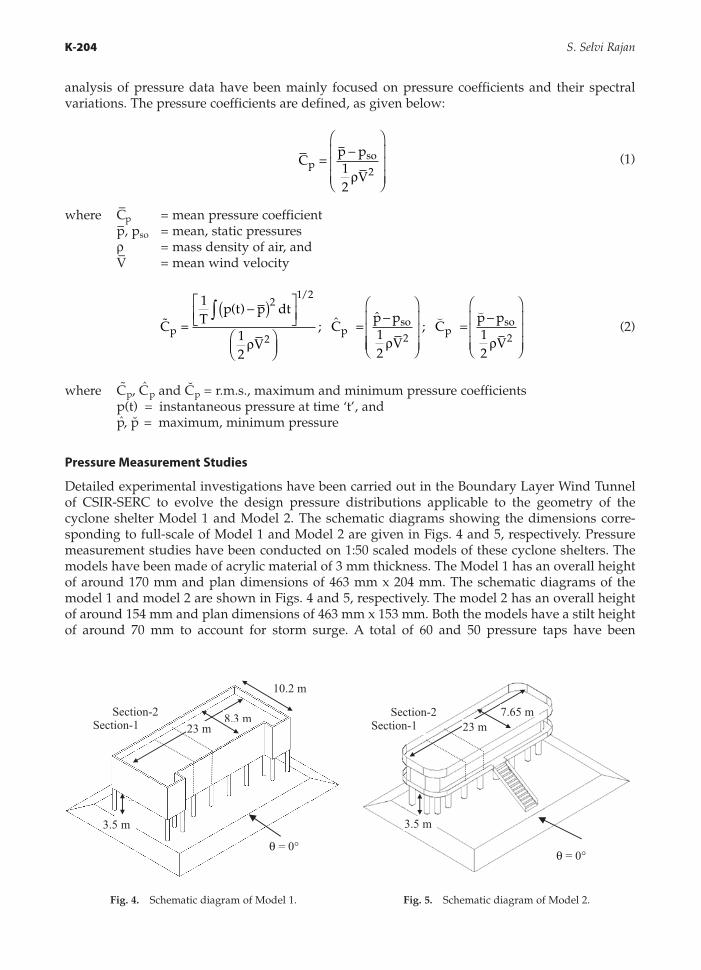
The device primarily consists of a circular plate (diameter 1000 mm) made of perspex sheet,roughening elements and two square plates (size of 100 mm x 100 mm) kept along two radiallines separated at right angles to each other at the edges. The device has been located at theupstream side of the turn table and supported by caster wheels at the edges so that the deviceis intended to rotate on the tunnel floor about its vertical axis i.e., in yaw direction, manually.A small gap of 5 mm has been provided between the device and tunnel floor. A steel rod hasbeen connected to the device and taken through the bottom of the tunnel floor for operationpurposes. Since the diameter of the device has been 1000 mm, there is a need of channelisingthe approach flow at the upstream side. Hence, two plates (height of 165 mm and length of1750 mm) have been fixed on the tunnel floor and separated by a distance of 1260 mm (dimen-sion relatively larger than diameter of circular plate). The above setup has been locatedsymmetrically about the centre line of the wind tunnel. The device has been separated by a dis-tance of 1575 mm from the centre of the turn table. Fig. 3 shows the dimensions and locationof auxiliary device. When the device has been under stationary position (when not rotated), itreproduces the wind characteristics corresponding to normal terrain condition i.e., the fre-quency obtained based on several spectra reveals that the peak amplitude for longitudinalfluctuation occurs around 1 Hz. By rotating the device about its vertical axis i.e., in yaw direc-tion, the peak spectral amplitude is realised below 1 Hz i.e., around 0.3 Hz. It is clearly to benoted that the device has been kept at the upstream side of turn table so as to retain the mod-ified flow characteristics over a short fetch length up to location of model.
Design of Cyclone Shelters Based on Wind Tunnel Studies K-203
00
Turn table
Pitot tube
Position of plates used for channelsing the flow
Auxiliary device
dia =1 m
1.26 m
0°
Clockwise Anti-clockwise
Direction of rotation of auxiliary device
Circular
plate Roughening
elements
Paddlers
Fig. 3. Details of auxiliary device.
Pressure Coefficient
A number of experiment have been carried out to obtain cyclonic wind characteristics, viz.increased level of turbulence intensity and high energy content at low frequency region. The
Key-10.qxd 11/26/2013 10:38 AM Page K-203
analysis of pressure data have been mainly focused on pressure coefficients and their spectralvariations. The pressure coefficients are defined, as given below:
(1)
where C–p = mean pressure coefficientp–, pso = mean, static pressuresρ = mass density of air, andV– = mean wind velocity
(2)
where Cp, Cp and Cp = r.m.s., maximum and minimum pressure coefficientsp(t) = instantaneous pressure at time ‘t’, and p, p = maximum, minimum pressure
Pressure Measurement Studies
Detailed experimental investigations have been carried out in the Boundary Layer Wind Tunnelof CSIR-SERC to evolve the design pressure distributions applicable to the geometry of thecyclone shelter Model 1 and Model 2. The schematic diagrams showing the dimensions corre-sponding to full-scale of Model 1 and Model 2 are given in Figs. 4 and 5, respectively. Pressuremeasurement studies have been conducted on 1:50 scaled models of these cyclone shelters. Themodels have been made of acrylic material of 3 mm thickness. The Model 1 has an overall heightof around 170 mm and plan dimensions of 463 mm x 204 mm. The schematic diagrams of themodel 1 and model 2 are shown in Figs. 4 and 5, respectively. The model 2 has an overall heightof around 154 mm and plan dimensions of 463 mm x 153 mm. Both the models have a stilt heightof around 70 mm to account for storm surge. A total of 60 and 50 pressure taps have been
C Tp t p dt
VC
p p
Vp p
so=-( )È
Î͢˚
ÊËÁ
ˆ¯
=-
Ê
Ë
ÁÁ
Ú1
12
12
21 2
2 2
( );
/
r rÁÁ
ˆ
¯
˜˜˜
=-
Ê
Ë
ÁÁÁ
ˆ
¯
˜˜˜
; C
p p
Vp
so12
2r
Cp p
Vp
so=-
Ê
Ë
ÁÁÁ
ˆ
¯
˜˜˜
12
2r
K-204 S. Selvi Rajan
23 m Section-1
θ = 0°
Section-2 8.3 m
10.2 m
3.5 m
Fig. 4. Schematic diagram of Model 1.
θ = 0°
Section-1 Section-2
23 m 7.65 m
3.5 m
Fig. 5. Schematic diagram of Model 2.
ˆ ˆ
Key-10.qxd 11/26/2013 10:38 AM Page K-204
provided for Models 1 and 2, respectively, in one half of the building envelope, considering thesymmetric dimensions. The pressure measurement studies on the cyclone shelter models havebeen carried out under simulated cyclone conditions and normal wind conditions.
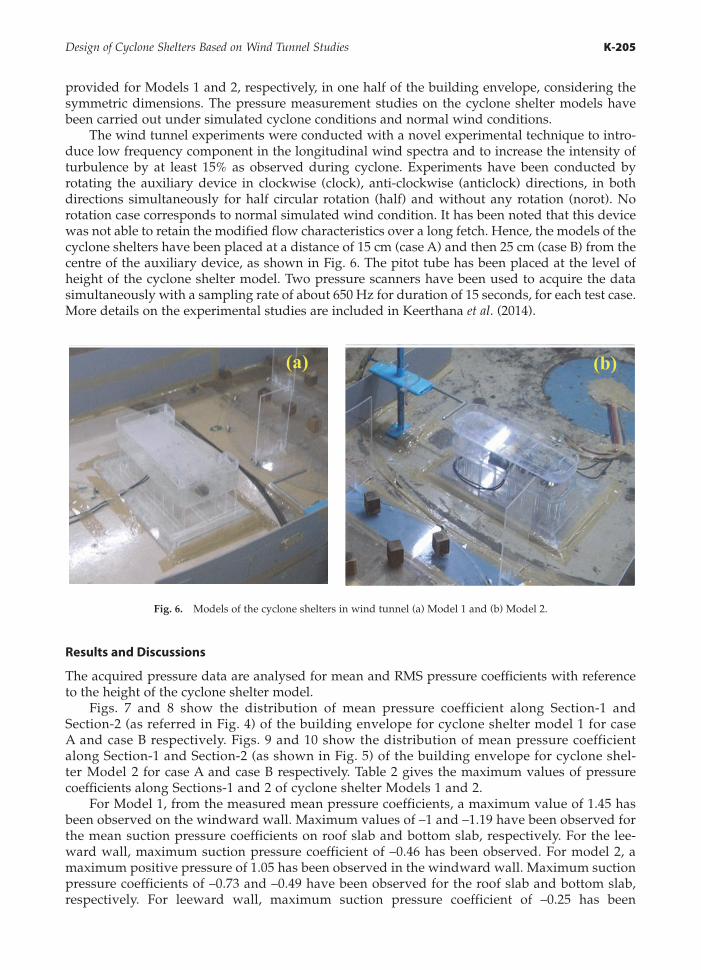
The wind tunnel experiments were conducted with a novel experimental technique to intro-duce low frequency component in the longitudinal wind spectra and to increase the intensity ofturbulence by at least 15% as observed during cyclone. Experiments have been conducted byrotating the auxiliary device in clockwise (clock), anti-clockwise (anticlock) directions, in bothdirections simultaneously for half circular rotation (half) and without any rotation (norot). Norotation case corresponds to normal simulated wind condition. It has been noted that this devicewas not able to retain the modified flow characteristics over a long fetch. Hence, the models of thecyclone shelters have been placed at a distance of 15 cm (case A) and then 25 cm (case B) from thecentre of the auxiliary device, as shown in Fig. 6. The pitot tube has been placed at the level ofheight of the cyclone shelter model. Two pressure scanners have been used to acquire the datasimultaneously with a sampling rate of about 650 Hz for duration of 15 seconds, for each test case.More details on the experimental studies are included in Keerthana et al. (2014).
Design of Cyclone Shelters Based on Wind Tunnel Studies K-205
(a) (b)
Fig. 6. Models of the cyclone shelters in wind tunnel (a) Model 1 and (b) Model 2.
Results and Discussions
The acquired pressure data are analysed for mean and RMS pressure coefficients with referenceto the height of the cyclone shelter model.
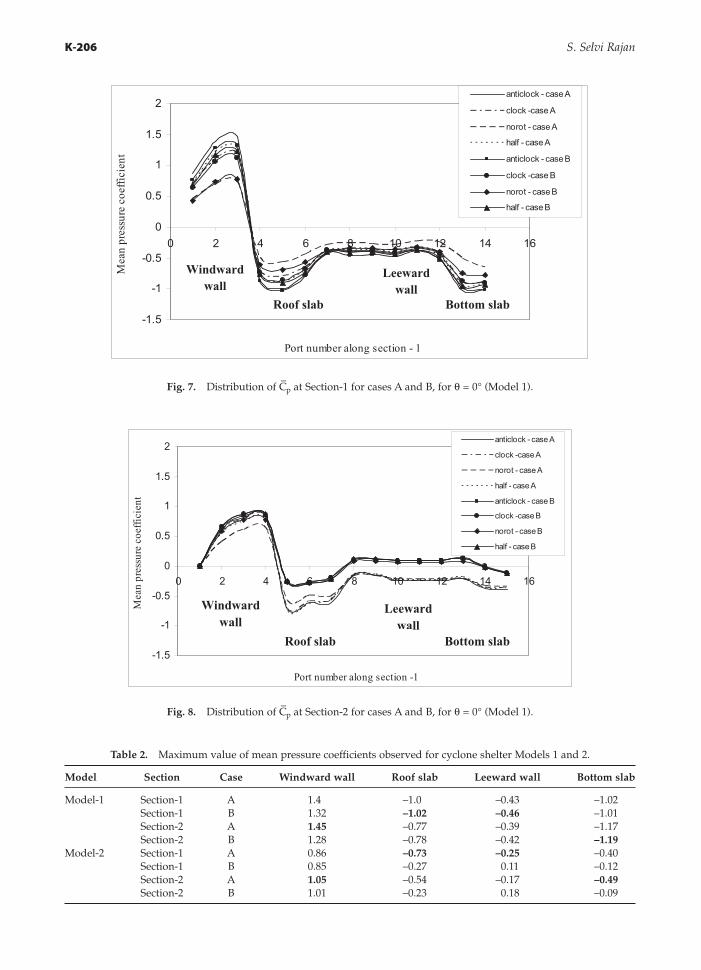
Figs. 7 and 8 show the distribution of mean pressure coefficient along Section-1 andSection-2 (as referred in Fig. 4) of the building envelope for cyclone shelter model 1 for caseA and case B respectively. Figs. 9 and 10 show the distribution of mean pressure coefficientalong Section-1 and Section-2 (as shown in Fig. 5) of the building envelope for cyclone shel-ter Model 2 for case A and case B respectively. Table 2 gives the maximum values of pressurecoefficients along Sections-1 and 2 of cyclone shelter Models 1 and 2.
For Model 1, from the measured mean pressure coefficients, a maximum value of 1.45 hasbeen observed on the windward wall. Maximum values of –1 and –1.19 have been observed forthe mean suction pressure coefficients on roof slab and bottom slab, respectively. For the lee-ward wall, maximum suction pressure coefficient of –0.46 has been observed. For model 2, amaximum positive pressure of 1.05 has been observed in the windward wall. Maximum suctionpressure coefficients of –0.73 and –0.49 have been observed for the roof slab and bottom slab,respectively. For leeward wall, maximum suction pressure coefficient of –0.25 has been
Key-10.qxd 11/26/2013 10:38 AM Page K-205
K-206 S. Selvi Rajan
-1.5
-1
-0.5
0
0.5
1
1.5
2
0 2 4 6 8 10 12 14 16
Port number along section - 1
Mea
n pr
essu
re c
oeffi
cien
t
anticlock - case A
clock -case A
norot - case A
half - case A
anticlock - case B
clock -case B
norot - case B
half - case B
Windward wall
Leeward wall
Bottom slab Roof slab
Fig. 7. Distribution of C–
p at Section-1 for cases A and B, for θ = 0° (Model 1).
-1.5
-1
-0.5
0
0.5
1
1.5
2
0 2 4 6 8 10 12 14 16
Port number along section -1
Mea
n pr
essu
re c
oeffi
cien
t
anticlock - case A
clock -case A
norot - case A
half - case A
anticlock - case B
clock -case B
norot - case B
half - case B
Windward wall
Leeward wall
Bottom slab Roof slab
Fig. 8. Distribution of C–
p at Section-2 for cases A and B, for θ = 0° (Model 1).
Table 2. Maximum value of mean pressure coefficients observed for cyclone shelter Models 1 and 2.
Model Section Case Windward wall Roof slab Leeward wall Bottom slab
Model-1 Section-1 A 1.4 –1.0 –0.43 –1.02Section-1 B 1.32 –1.02 –0.46 –1.01Section-2 A 1.45 –0.77 –0.39 –1.17Section-2 B 1.28 –0.78 –0.42 –1.19
Model-2 Section-1 A 0.86 –0.73 –0.25 –0.40Section-1 B 0.85 –0.27 0.11 –0.12Section-2 A 1.05 –0.54 –0.17 –0.49Section-2 B 1.01 –0.23 0.18 –0.09
Key-10.qxd 11/26/2013 10:38 AM Page K-206
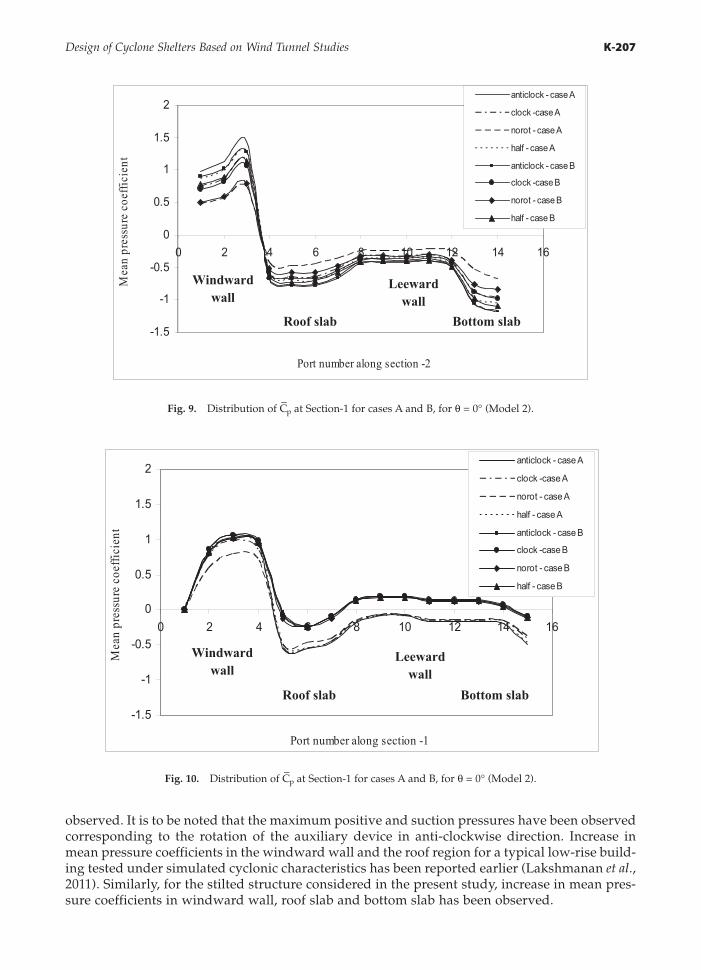
observed. It is to be noted that the maximum positive and suction pressures have been observedcorresponding to the rotation of the auxiliary device in anti-clockwise direction. Increase inmean pressure coefficients in the windward wall and the roof region for a typical low-rise build-ing tested under simulated cyclonic characteristics has been reported earlier (Lakshmanan et al.,2011). Similarly, for the stilted structure considered in the present study, increase in mean pres-sure coefficients in windward wall, roof slab and bottom slab has been observed.
Design of Cyclone Shelters Based on Wind Tunnel Studies K-207
-1.5
-1
-0.5
0
0.5
1
1.5
2
0 2 4 6 8 10 12 14 16
Port number along section -2
Mea
n pr
essu
re c
oeffi
cien
t
anticlock - case A
clock -case A
norot - case A
half - case A
anticlock - case B
clock -case B
norot - case B
half - case B
Windward wall
Leeward wall
Bottom slab Roof slab
Fig. 9. Distribution of C–
p at Section-1 for cases A and B, for θ = 0° (Model 2).
-1.5
-1
-0.5
0
0.5
1
1.5
2
0 2 4 6 8 10 12 14 16
Port number along section -1
Mea
n pr
essu
re c
oeffi
cien
t
anticlock - case A
clock -case A
norot - case A
half - case A
anticlock - case B
clock -case B
norot - case B
half - case B
Windward wall
Leeward wall
Bottom slab Roof slab
Fig. 10. Distribution of C–
p at Section-1 for cases A and B, for θ = 0° (Model 2).
Key-10.qxd 11/26/2013 10:38 AM Page K-207
The maximum positive pressure in the windward wall of the cyclone shelter models corre-sponding to case A (for which the auxiliary device is more close to the model) is higher than that ofcase B for both model 1 and model 2. Similar observation has been drawn for all other faces, viz, roofslab, bottom slab and leeward face. However, the mean pressure coefficients are similar in magni-tudes as well as in trend for model 1 for case A and case B, whereas for Model 2, slight deviationshave been observed within case A and case B. This could be attributed to the presence of open cor-ridor in the first level of the cyclone shelter Model 2. It has also been observed that provision of opencorridors and overhangs as in case of Model 2 reduced the suctions pressures on the stilted slab andon the roof slab, besides reducing windward pressures for the 0° angle of wind incidence.
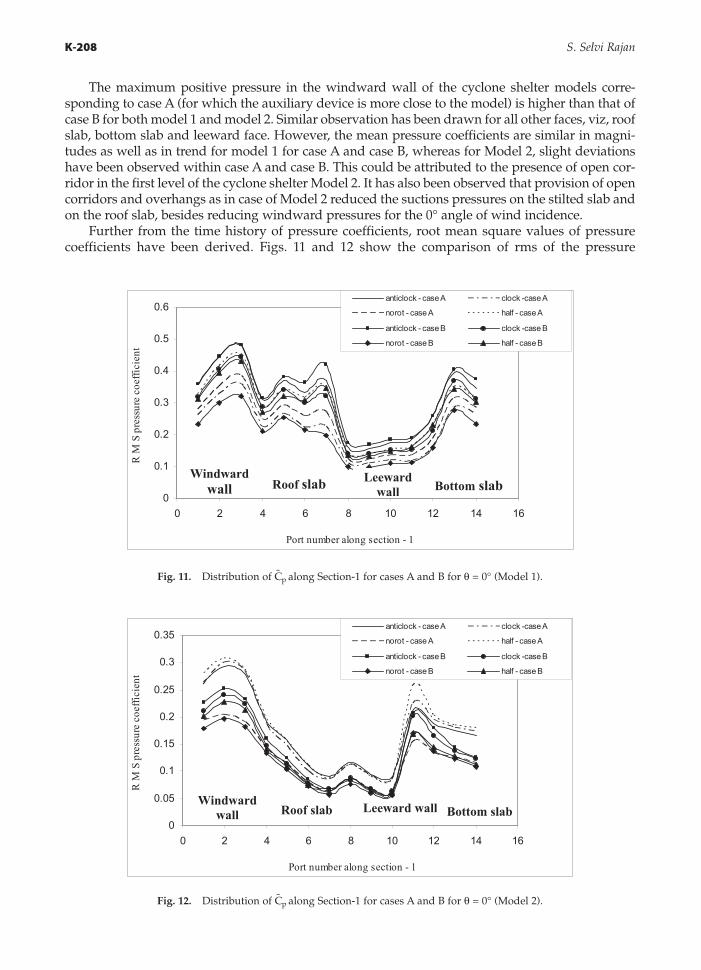
Further from the time history of pressure coefficients, root mean square values of pressurecoefficients have been derived. Figs. 11 and 12 show the comparison of rms of the pressure
K-208 S. Selvi Rajan
0
0.1
0.2
0.3
0.4
0.5
0.6
0 2 4 6 8 10 12 14 16
Port number along section - 1
R M
S p
ress
ure
coef
ficie
nt
anticlock - case A clock -case A
norot - case A half - case A
anticlock - case B clock -case B
norot - case B half - case B
Windward wall
Leeward wall Bottom slab Roof slab
Fig. 11. Distribution of Cp along Section-1 for cases A and B for θ = 0° (Model 1).
0
0.05
0.1
0.15
0.2
0.25
0.3
0.35
0 2 4 6 8 10 12 14 16
Port number along section - 1
R M
S p
ress
ure
coef
ficie
nt
anticlock - case A clock -case A
norot - case A half - case A
anticlock - case B clock -case B
norot - case B half - case B
Windward wall Leeward wall Bottom slab Roof slab
Fig. 12. Distribution of Cp along Section-1 for cases A and B for θ = 0° (Model 2).
Key-10.qxd 11/26/2013 10:38 AM Page K-208
coefficients along Section-1 for cases A and B in cyclone shelter Models 1 and 2, respectively.Increase in rms of pressure coefficients has been observed under simulated cyclonic condition,compared to normal wind condition.
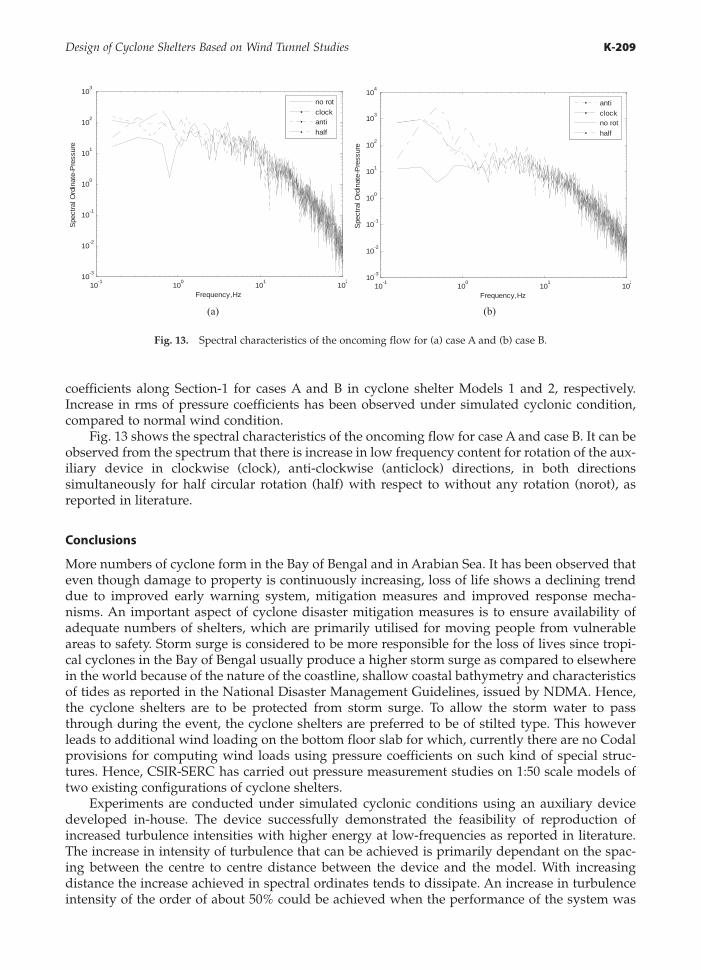
Fig. 13 shows the spectral characteristics of the oncoming flow for case A and case B. It can beobserved from the spectrum that there is increase in low frequency content for rotation of the aux-iliary device in clockwise (clock), anti-clockwise (anticlock) directions, in both directionssimultaneously for half circular rotation (half) with respect to without any rotation (norot), asreported in literature.
Conclusions
More numbers of cyclone form in the Bay of Bengal and in Arabian Sea. It has been observed thateven though damage to property is continuously increasing, loss of life shows a declining trenddue to improved early warning system, mitigation measures and improved response mecha-nisms. An important aspect of cyclone disaster mitigation measures is to ensure availability ofadequate numbers of shelters, which are primarily utilised for moving people from vulnerableareas to safety. Storm surge is considered to be more responsible for the loss of lives since tropi-cal cyclones in the Bay of Bengal usually produce a higher storm surge as compared to elsewherein the world because of the nature of the coastline, shallow coastal bathymetry and characteristicsof tides as reported in the National Disaster Management Guidelines, issued by NDMA. Hence,the cyclone shelters are to be protected from storm surge. To allow the storm water to passthrough during the event, the cyclone shelters are preferred to be of stilted type. This howeverleads to additional wind loading on the bottom floor slab for which, currently there are no Codalprovisions for computing wind loads using pressure coefficients on such kind of special struc-tures. Hence, CSIR-SERC has carried out pressure measurement studies on 1:50 scale models oftwo existing configurations of cyclone shelters.
Experiments are conducted under simulated cyclonic conditions using an auxiliary devicedeveloped in-house. The device successfully demonstrated the feasibility of reproduction ofincreased turbulence intensities with higher energy at low-frequencies as reported in literature.The increase in intensity of turbulence that can be achieved is primarily dependant on the spac-ing between the centre to centre distance between the device and the model. With increasingdistance the increase achieved in spectral ordinates tends to dissipate. An increase in turbulenceintensity of the order of about 50% could be achieved when the performance of the system was
Design of Cyclone Shelters Based on Wind Tunnel Studies K-209
10-1
100
101
102
10-3
10-2
10-1
100
101
102
103
Frequency,Hz
Spe
ctra
l Ord
inat
e-P
ress
ure
no rot
clockanti
half
10-1
100
101
102
10-3
10-2
10-1
100
101
102
103
104
Frequency,Hz
Spe
ctra
l Ord
inat
e-P
ress
ure
anti
clockno rot
half
(a) (b)
Fig. 13. Spectral characteristics of the oncoming flow for (a) case A and (b) case B.
Key-10.qxd 11/26/2013 10:38 AM Page K-209
fine tuned. Based on the wind tunnel pressure measurement studies on the two models (Models1 and 2) of cyclone shelters, it is observed that a maximum value of mean positive pressure hasbeen observed in the windward wall. And maximum values of mean suction pressure coefficientshave been observed for the roof slab and bottom slab. Increased mean pressure coefficients havebeen observed for both the cyclone shelter models in cyclonic condition, in comparison with nor-mal condition (no rotation of the device). This increased value of pressure coefficients and themaximum value of suction pressure coefficients on the bottom slabs, showing tendency todevelop large suction pressures for wind direction perpendicular to the longer side of the build-ing have to be considered while designing the cyclone shelters. The rms pressure coefficients arefound to be more under simulated cyclonic wind characteristics compared to normal wind con-ditions, as expected.
Acknowledgment
Sincere and grateful acknowledgements are due to Dr. N. Lakshmanan (Former Director andProject Advisor) and Dr. S. Arunachalam (Former Chief Scientist). Acknowledgements are due toMs. Keerthana, Scientist and Ms.Manimekala, Project Assistant, who helped in the analysis of data.This paper has been published with the approval of Director, CSIR-SERC.
References
Abraham, A., Selvi Rajan, S., Ramesh Babu, G., Harikrishna, P and Chitra Ganapathi, S., ‘Auxiliary device to create cyclonicwind spectra in wind tunnel studies’, Proc. of the International Conference on Disaster Management’, Chennai, January2014 (Accepted for publication).
Harikrishna, P., Selvi Rajan, S., Ramesh Babu, G. Arunachalam, S. Lakshmanan. N., Abraham, A., Chitra Ganapathi, S., andSankar, S., ‘Simulation of Cyclonic Turbulence Intensities in Boundary Layer Wind tunnel’, SERC Research ReportNo.6, MLP 14041, April 2010.
Guidelines for Design and Construction of Cyclone/Tsunami Shelters (2006), GoI-UNDP Disaster Risk ManagementProgramme, Ministry of Home Affairs, Government of India.
http://en.wikipedia.org/wiki/Bay_of_Bengal(2013)Wilson, K.J. Characteristics of the sub cloud layer wind structure in tropical cyclones, Proceedings of the International
Conference On Tropical Cyclones, Perth Australia, 1979.Murthy T.S., Flather R.A., and Henry R.F. (1986), The storm surge problem in Bay of Bengal, Prog. Oceanog., Vol.16,
195–233.Lakshmanan, N. , S. Selvi Rajan, S. Arunachalam, A. Abraham, G. Ramesh Babu, and P. Harikrishna, "Auxiliary device to
create cyclonic wind spectra in wind tunnel studies", Report No.11, MLP 140 41, CSIR-SERC, February 2011.Black, P.G. Evolution of maximum wind estimates in typhoons, Proceedings of the ICSU/WMO International Conference
on Tropical Cyclone Disasters, Beijing, China, October 12, 18, 1992, Beijing University Press, 1993, pp. 104–115.Ramesh Babu, G., Harikrishna, P., Abraham, A., Selvi Rajan, S., Keerthana, M., Nagesh R. Iyer and Arunachalam, S., ‘Field
measurement of wind characteristics during cyclone "Nilam"’, Proc. of VI National Conference on Wind Engineering,New Delhi, December 2012, pp. 465–477.
Schroeder, J.L., and Smith, D.A., (2003), Hurricane wind flow characteristics as determined from WEMITE, Jl. of WindEngg and Industrial Aerodynamics, 91, 767–789.
Selvi Rajan S., M. Keerthana, P. Harikrishna, A. Abraham, G. Ramesh Babu, M. Kameshwaran, ‘Wind Tunnel PressureMeasurement Studies on Models of Cyclone Shelters under Simulated Cyclonic Wind Characteristic’, Proc. of theInternational Conference on Disaster Management’, Chennai, January 2014 (Accepted for publication).
Simiu, E and Scanlan, R. H. (1996), Wind Effects on Structures, 3rd Ed., John Wiley & Sons, New York, USA.Yu, B.O., Choudhary, A.G., and Masters, F.J., (2008), Hurricane wind power spectra, Co spectra and integral length scales,
Boundary Layer Meteorology, 29: 411–430.
K-210 S. Selvi Rajan
Key-10.qxd 11/26/2013 10:38 AM Page K-210