Embed Size (px)
Citation preview

Design of Deep Foundations
for Slope Stabilization
J. Erik Loehr, Ph.D., P.E.
University of Missouri
Annual Kansas City Geotechnical Conference
Overland Park, Kansas
April 23, 2015
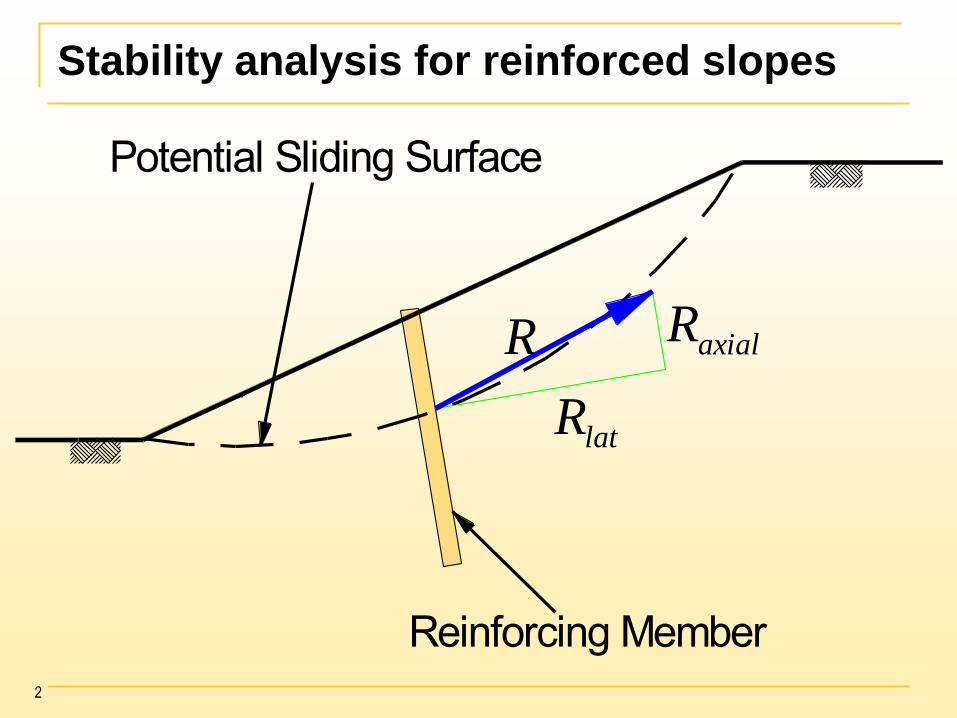
Stability analysis for reinforced slopes
R
latR
axialR
Reinforcing Member
Potential Sliding Surface
2

Application – drilled shafts
3
Fill
Stiff ClayObserved sliding surface
drilled shafts
after Bruce and Jewell, 1986

Application – drilled shafts
4 Photo courtesy of Alabama Electric Cooperative

Application – driven piles
5 Graphic courtesy of Hayward Baker

Application – driven piles
6 Photo courtesy of Hayward Baker
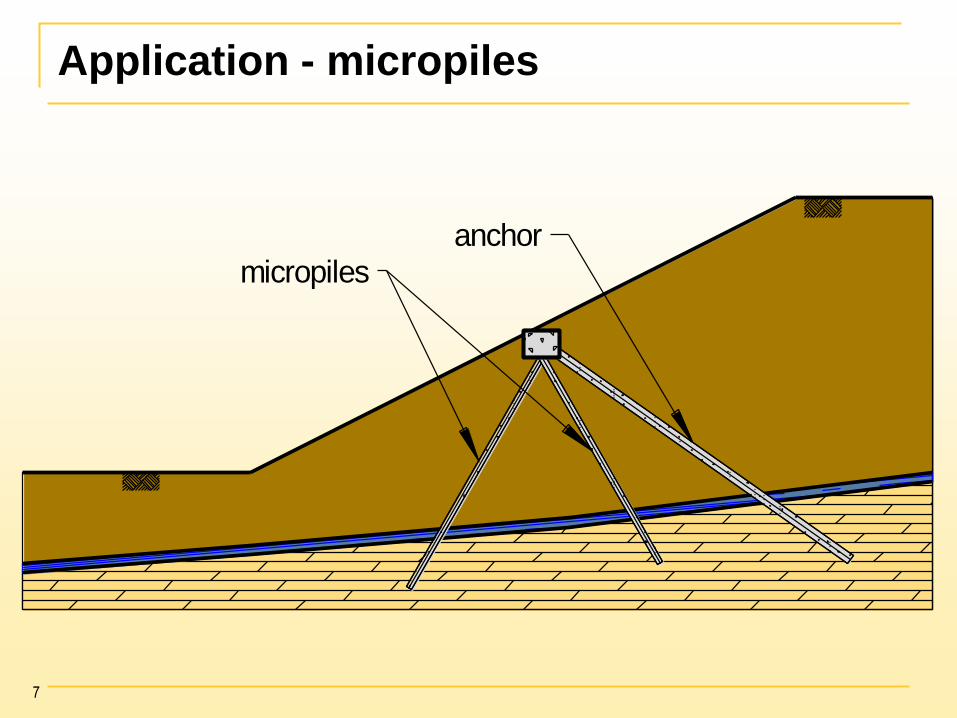
Application - micropiles
7
micropilesanchor

Application - micropiles
8
Photo courtesy of Hayward Baker
Photo courtesy of Schnabel Engineering

Application – soil nails
9
shotcretefacing
soil nailsRailway
soil nails
sliding surface
after Bruce and Jewell, 1986

Application – soil nails
10 Photo courtesy of Schnabel Foundation
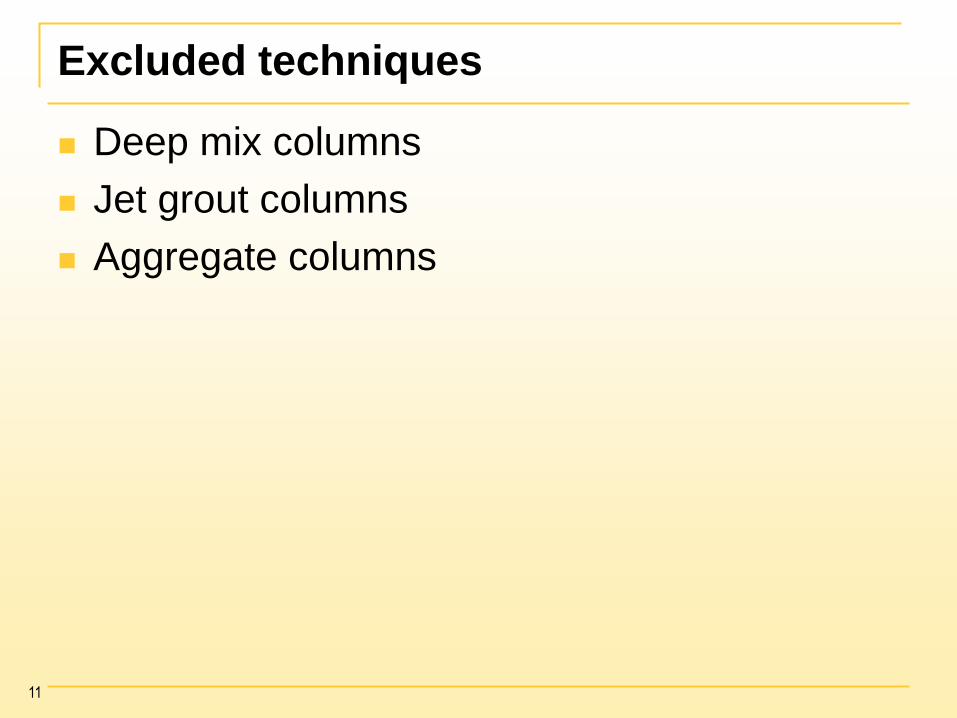
Excluded techniques
Deep mix columns
Jet grout columns
Aggregate columns
11

Application – ground anchors
12

Application – ground anchors
13 Photos courtesy of Schnabel Foundation

Challenges for predicting resistance
Load transfer is complex
Deformation required to mobilize resistance
Numerous limit states
Soil provides both load and resistance
Axial and lateral resistance may be
“incompatible”
14

Soil movement components
15
axial
lat.
soil
lat.
axial
soil
Slope Surface
SlidingSurface
lat.
soil
axial
SlidingSurface
Slope Surface

0
5
10
15
20
25
30
35
40
-400 -200 0 200 400
Lateral Soil Reaction (kip/in)
=0.01 in
=0.1 in
=0.3 in
=1.0 in
ℓ
ℓ
ℓ
ℓ
limit soilpressure
Lateral load transfer – “long” pile
16
sliding surface
0
5
10
15
20
25
30
35
40
-1.2 -0.8 -0.4 0.0 0.4 0.8 1.2
Dep
th (f
t)
Pile Deflection (in)
sliding surface

Lateral load transfer – “long pile” mode
17
sliding surface
0
5
10
15
20
25
30
35
40
-400 -200 0 200 400
Lateral Soil Reaction (kip/in)
limit soilpressure
0
5
10
15
20
25
30
35
40
-1.2 -0.6 0.0 0.6 1.2
Dep
th (f
t)
Pile Deflection (in)
0
5
10
15
20
25
30
35
40
-60 0 60 120 180
Bending Moment (kip-in)
=0.01 in
=0.1 in
=0.3 in
=1.0 in
ℓ
ℓ
ℓ
ℓ
0
5
10
15
20
25
30
35
40
-3.0 -1.5 0.0 1.5 3.0
Shear Force (kip)
Sliding
surface

Lateral load transfer – “short pile” mode
18
0
5
10
15
20
25
30
35
40
-12 -6 0 6 12
Dep
th (f
t)
Pile Deflection (in)
sliding surface
0
5
10
15
20
25
30
35
40
-400 -200 0 200 400
Lateral Soil Reaction (kip/in)
=0.1 in
=0.5 in
=1.0 in
=10.6 in
ℓ
ℓ
ℓ
ℓlimit soilpressure

Lateral load transfer – “short pile” mode
19
0
5
10
15
20
25
30
35
40
-12 -6 0 6 12
Dep
th (f
t)
Pile Deflection (in)
sliding surface
0
5
10
15
20
25
30
35
40
-400 -200 0 200 400
Lateral Soil Reaction (kip/in)
limit soilpressure
0
5
10
15
20
25
30
35
40
-3000 -2000 -1000 0 1000
Bending Moment (kip-in)
=0.1 in
=0.5 in
=1.0 in
=10.6 in
ℓℓℓℓ
0
5
10
15
20
25
30
35
40
-30 -15 0 15 30
Shear Force (kip)

0
5
10
15
20
25
30
35
40
-400 -200 0 200 400
Lateral Soil Reaction (kip/in)
=0.1 in
=0.5 in
=10 in
=30 in
ℓ
ℓ
ℓ
ℓ
0
5
10
15
20
25
30
35
40
-40 -20 0 20 40
Dep
th (f
t)
Pile Deflection (in)
Lat. load transfer – “intermediate” mode
20
sliding surface
limit soil
pressure

0
5
10
15
20
25
30
35
40
-400 -200 0 200 400
Lateral Soil Reaction (kip/in)
0
5
10
15
20
25
30
35
40
-40 -20 0 20 40
Dep
th (f
t)
Pile Deflection (in)
Lat. load transfer – “intermediate” mode
21
sliding
surface
limit soil
pressure
0
5
10
15
20
25
30
35
40
-1000 0 1000 2000 3000
Bending Moment (kip-in)
=0.1 in
=0.5 in
=10 in
=30 in
ℓℓℓℓ
0
5
10
15
20
25
30
35
40
-30 -15 0 15 30
Shear Force (kip)

0
5
10
15
20
25
30
35
40
0 10 20 30 40 50 60
Dep
th (f
t)
Mobilized Axial Load (kip)
=0.05 in
=0.1 in
=0.3 in
=0.5 in
a
a
a
a
Axial load transfer
22
sliding surface

Limit states for deep foundations in slopes
Soil failure • passive (lateral) failure
above/below sliding surface
• pullout (axial) failure above/below sliding surface
Structural failure • flexural failure
• shear failure
• axial failure
- compression
- tension
Serviceability limits
23
Sliding Surface
Slope Surface
ReinforcingMember
FailedSoil
Relative Movement
Sliding Surface
Initial Location
Location afterSliding
FailedSoil
RelativeMovement
Sliding Surface
Initial Location
Failure of member in bending
RelativeMovement
Sliding Surface
Initial Location
Failure of member in Shear
RelativeMovement

Lessons
Load transfer is complex…depends on
• Soil and pile stiffness
• Sliding depth
• Orientation of reinforcement
• Structural and geotechnical limit states
It is dangerous to assume load distribution!!
24
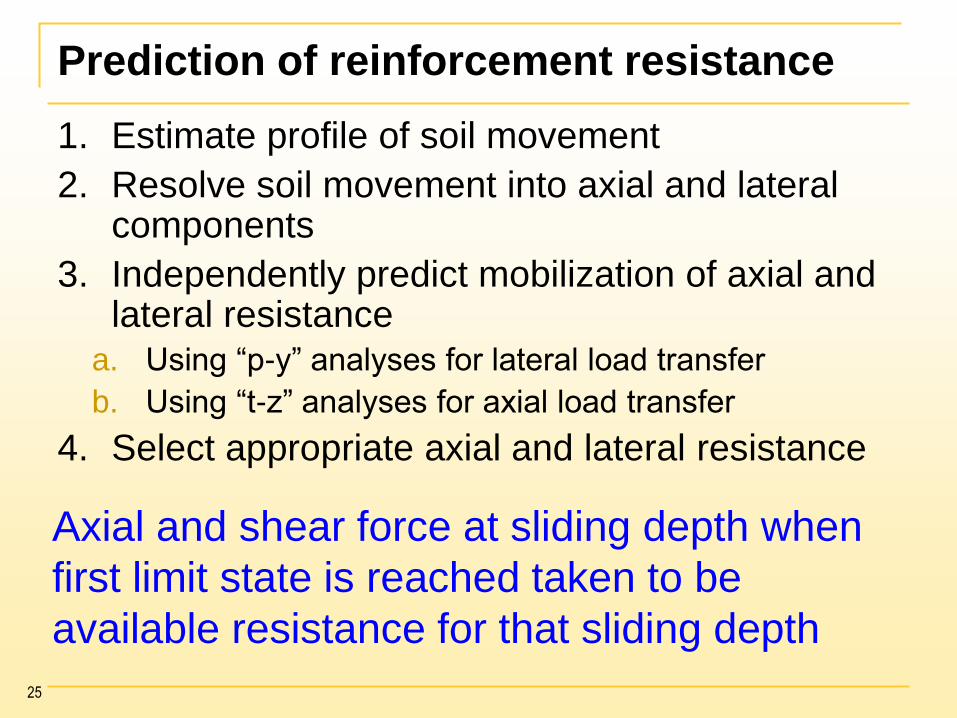
Prediction of reinforcement resistance
1. Estimate profile of soil movement
2. Resolve soil movement into axial and lateral components
3. Independently predict mobilization of axial and lateral resistance
a. Using “p-y” analyses for lateral load transfer
b. Using “t-z” analyses for axial load transfer
4. Select appropriate axial and lateral resistance
25
Axial and shear force at sliding depth when
first limit state is reached taken to be
available resistance for that sliding depth
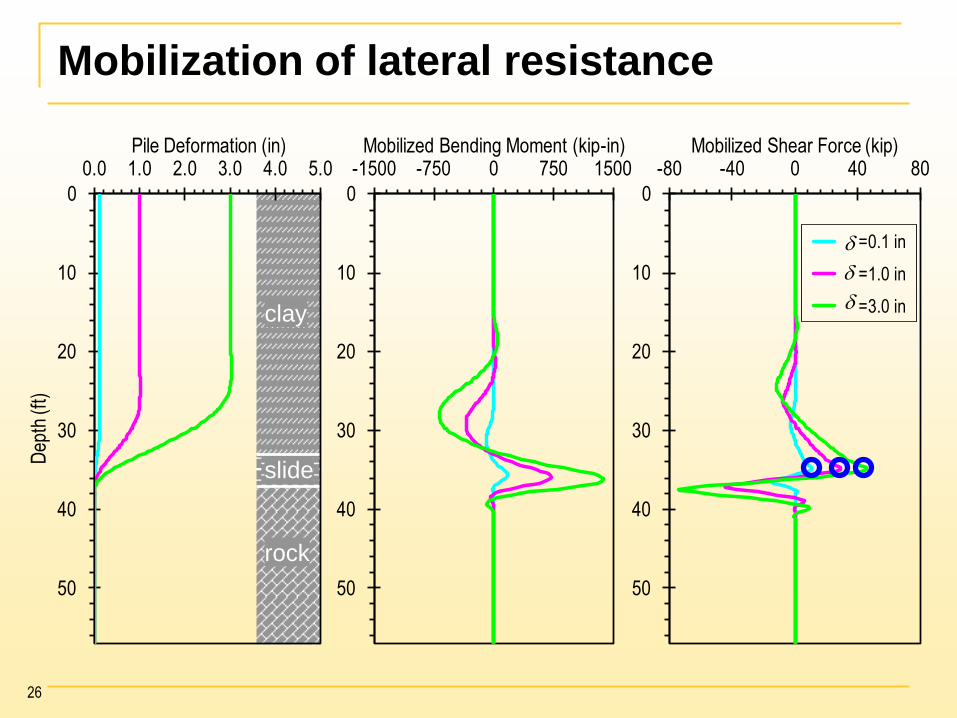
clay
rock
slide
0
10
20
30
40
50
0.0 1.0 2.0 3.0 4.0 5.0
Dep
th (f
t)
Pile Deformation (in)
0
10
20
30
40
50
-80 -40 0 40 80Mobilized Shear Force (kip)
=0.1 in
=1.0 in
=3.0 in
Mobilization of lateral resistance
0
10
20
30
40
50
-1500 -750 0 750 1500Mobilized Bending Moment (kip-in)
26
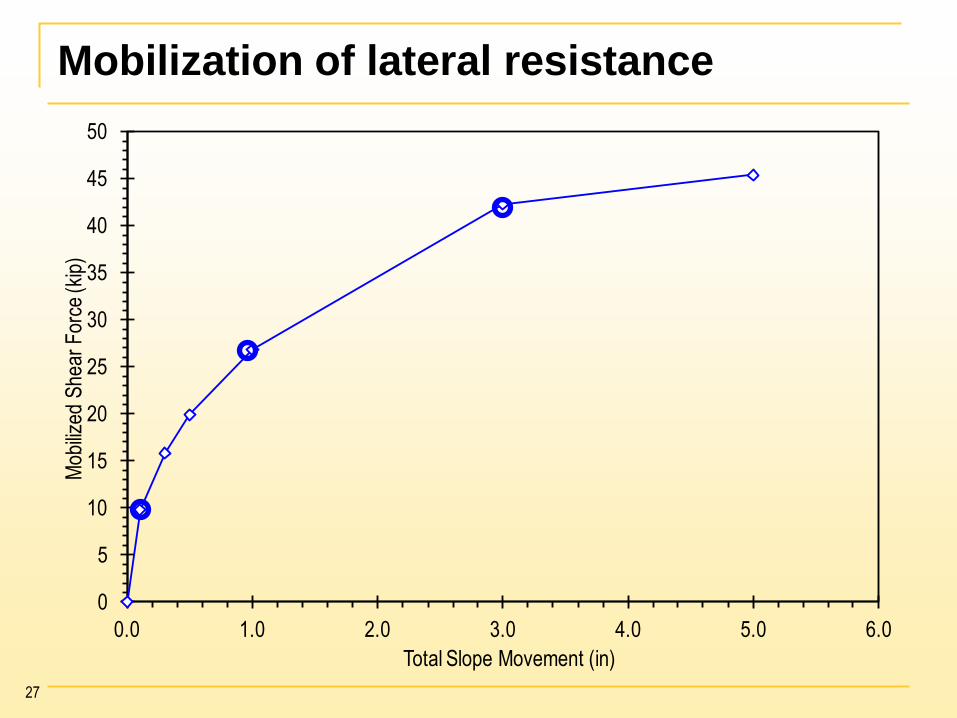
Mobilization of lateral resistance
27
0
5
10
15
20
25
30
35
40
45
50
0.0 1.0 2.0 3.0 4.0 5.0 6.0
Mob
ilize
d S
hear
For
ce (k
ip)
Total Slope Movement (in)

clay
rock
slide
0
10
20
30
40
50
0 20 40 60 80 100 120 140 160
Dep
th (f
t)
Mobilized Axial Load (kip)
=0.1 in
=0.3 in
=0.42 in
=0.5 in
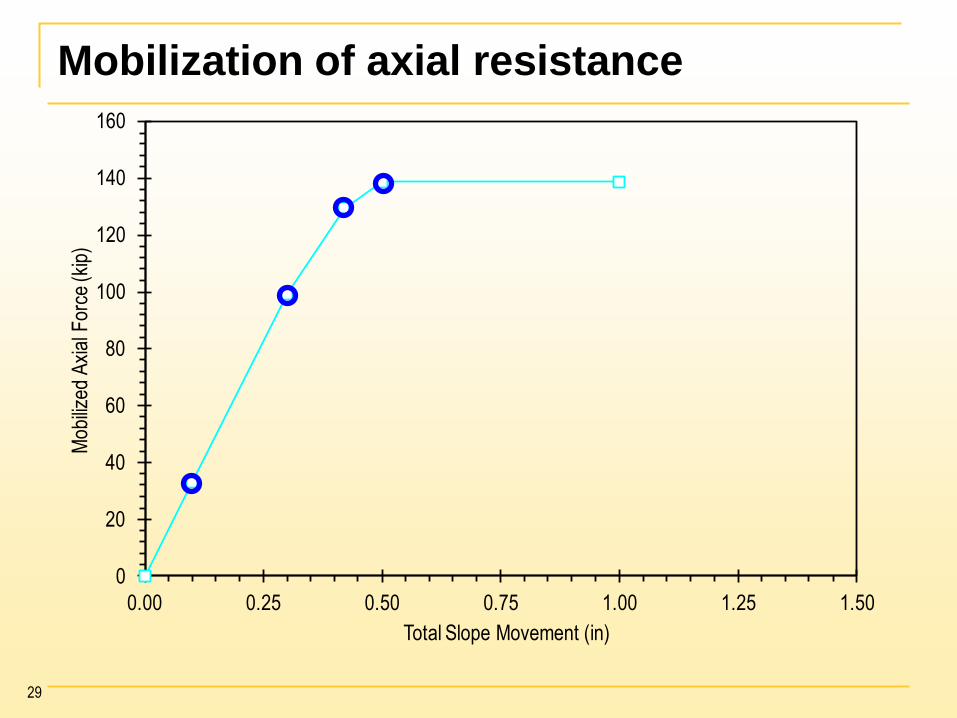
Mobilization of axial resistance
28
0
20
40
60
80
100
120
140
160
0.00 0.25 0.50 0.75 1.00 1.25 1.50
Mob
ilize
d A
xial
For
ce (k
ip)
Total Slope Movement (in)
Mobilization of axial resistance
29
clay
rock
0
10
20
30
40
50
0 50 100 150 200 250
Slid
ing
Dep
th (
ft)
Axial Resisting Force (kip)
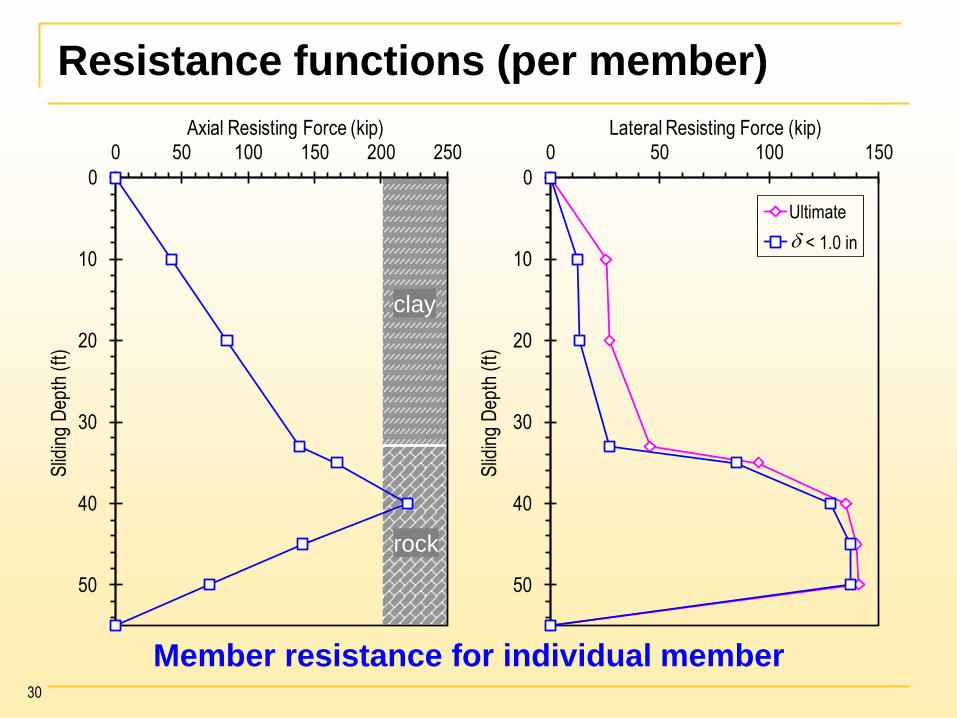
Resistance functions (per member)
Member resistance for individual member
0
10
20
30
40
50
0 50 100 150
Slid
ing
Dep
th (
ft)
Lateral Resisting Force (kip)
Ultimate
< 1.0 in
30
clay
rock
0
10
20
30
40
50
0 10 20 30 40 50
Slid
ing
Dep
th (
ft)
Axial Resisting Force (kip/ft)
0
10
20
30
40
50
0 5 10 15 20 25
Slid
ing
Dep
th (
ft)
Lateral Resisting Force (kip/ft)
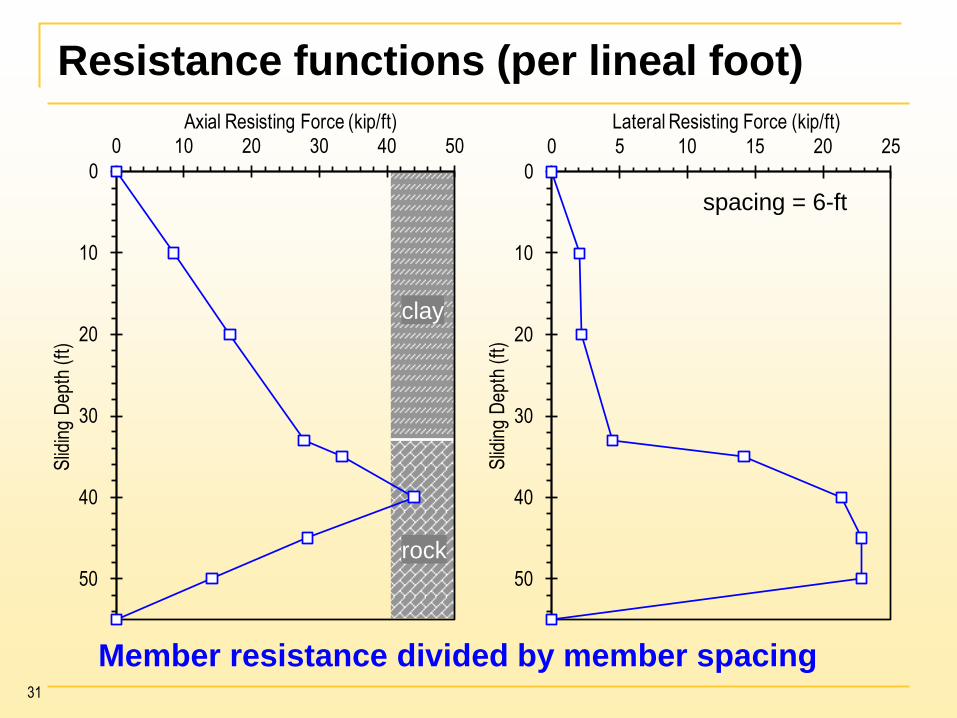
Resistance functions (per lineal foot)
Member resistance divided by member spacing
spacing = 6-ft
31

AEC – Lowman Power Plant
54-inch diameter shafts
Reinforcement: 54 #10 bars; 18 #18 bars
Permanent steel casing through mixed sands
120-ft length
15-ft c-c staggered spacing
32
II. soft to stiff clay
VI. stiff to hard clay
VII. weathered limestone
I. Fill
III. mixed sands & clays
IV. dense sandV. stiff clay
AEC-Lowman Power PlantLeroy, Alabama
-80-ft
-60-ft
-40-ft
-20-ft
0-ft
20-ft
40-ft
II. soft to stiff clay
VI. stiff to hard clay
VII. weathered limestone
I. Fill
III. mixed sands & clays
IV. dense sandV. stiff clay
AEC-Lowman Power PlantLeroy, Alabama
0 10' 20'10'
B-104B-101B-4
B-5B-6
MB-9
-80-ft
-60-ft
-40-ft
-20-ft
0-ft
20-ft
40-ft
??
Observed Sliding Surface

AEC – Lowman Power Plant
33

CL
SM
CH
LS
0
10
20
30
40
50
60
70
80
0.0 1.0 2.0 3.0 4.0 5.0
Dep
th (f
t)
Pile Deformation (in)
AEC – Design Analyses
34
0
10
20
30
40
50
60
70
80
-8000 -4000 0 4000 8000
Mobilized Bending Moment (kip-ft)
0
10
20
30
40
50
60
70
80
-2000 -1000 0 1000 2000
Mobilized Shear Force (kip)
d=0.1 in
d=0.5 in
d=1.0 in
d=2.0 in
d=3.0 in

AEC – Design Analyses
35
0
100
200
300
400
500
600
700
800
0.0 0.5 1.0 1.5 2.0 2.5 3.0 3.5 4.0
Mob
ilize
d S
hear
Res
ista
nce
at S
lidin
g S
urfa
ce (k
ips)
Soil Movement (in)
8-ft
16-ft
24-ft
29-ft
40-ft
47-ft
56-ft
sliding depth

CL
SM
CH
LS
0
10
20
30
40
50
60
70
80
0 10 20 30 40
Slid
ing
Dep
th (
ft)
Lateral Resisting Force (kips/ft)
shaft spacing = 15-ft
Design resistance – AEC Lowman PP
36
0
10
20
30
40
50
60
70
80
0 200 400 600 800
Slid
ing
Dep
th (
ft)
Lateral Shaft Resistance (kips)
soil movement
moment capacity
shear capacity

AEC Lowman PP – Completed Shafts
37 Photos courtesy of A.H. Beck Foundation Co.

CL
SM
CH
LS
-82
-72
-62
-52
-42
-32
-22
-12
-2
-1500 -500 500 1500
Ele
vatio
n (f
t)
Bending Moment (kip-ft)
7/25/2006
9/14/2006
11/27/2006
3/27/2007
6/28/2007
10/25/2007
installed7/19/2006
AEC – Lowman PP Observations
38
-82
-72
-62
-52
-42
-32
-22
-12
-2
-1500 -500 500 1500
Ele
vatio
n (f
t)
Bending Moment (kip-ft)
L-pile
L-pile (mod)
10/25/2007

Brown and Chancellor, 1997
39

Bending moments – Littleville
40
0
10
20
30
40
50
-40 -20 0 20 40
Dep
th (
ft)
Bending Moment (in-kips)
predicted
measured (2+70U)
measured (1+70U)
tot = 0.39-in
upslopepmod = 0.2
0
10
20
30
40
50
-40 -20 0 20 40
Dep
th (
ft)
Bending Moment (in-kips)
predicted
measured (2+70U)
measured (1+70U)
downslopepmod = 0.2
tot = 0.31-in

Axial resistance – Littleville
41
0
10
20
30
40
50
-60 -40 -20 0 20 40 60
Dep
th, z
(ft
.)
Axial Load T, kip (+=tension)
predicted
measured (2+70U)
measured (1+70U)tot = 0.24-in
downslope
= 0.3zult = 0.06-in
0
10
20
30
40
50
-60 -40 -20 0 20 40 60
Dep
th, z
(ft
.)
Axial Load T, kip (+=tension)
predicted
measured (2+70U)
measured (1+70U)
tot = 0.34-in
upslope
= 0.3zult = 0.06-in

Large-scale model tests
42

Reinforced slope (s/d≈2) w/ capping beam
43

Influence of Pile Batter
44
0.0
0.5
1.0
1.5
2.0
2.5
-45 -30 -15 0 15 30 45
p-m
ult
iplie
r
Batter Angle (degrees)
Kubo (1965)
Awoshika & Reese (1971)
Model Tests
Reese et al. (2006)
Recommended for Slopes
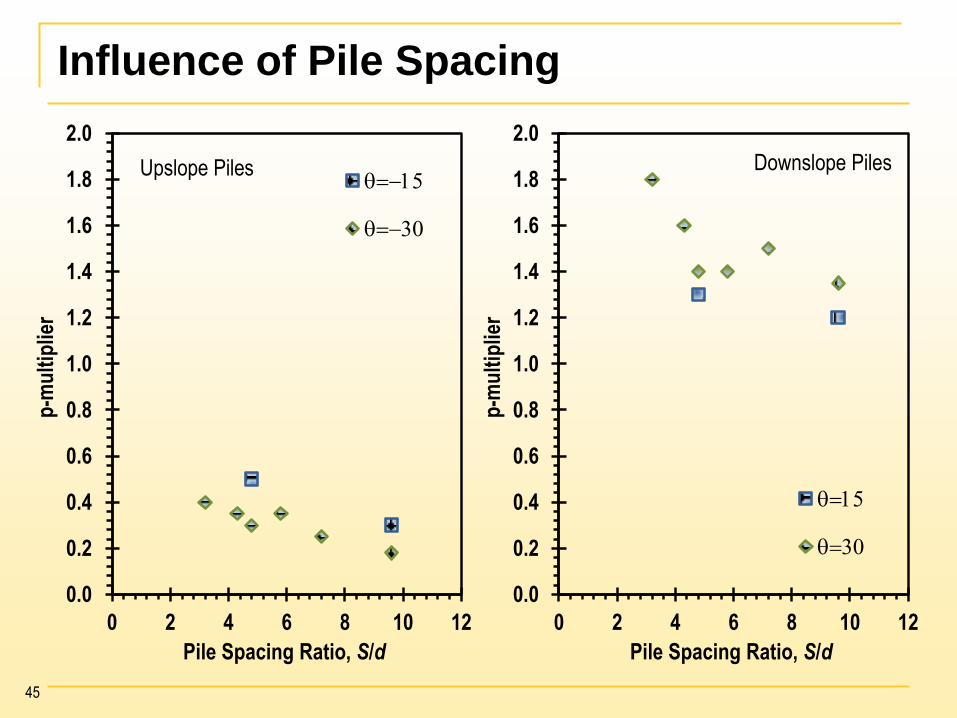
Influence of Pile Spacing
45
0.0
0.2
0.4
0.6
0.8
1.0
1.2
1.4
1.6
1.8
2.0
0 2 4 6 8 10 12
p-m
ult
iplie
r
Pile Spacing Ratio, S/d
=15
=30
Upslope Piles
0.0
0.2
0.4
0.6
0.8
1.0
1.2
1.4
1.6
1.8
2.0
0 2 4 6 8 10 12
p-m
ult
iplie
r
Pile Spacing Ratio, S/d
=15
=30
Downslope Piles

Conclusions
Predicting resistance for deep foundations
used for slope stabilization is complex
Current tools provide reasonably practical
means to accurately predict resistance
Predictions of lateral resistance are generally
consistent with field and lab measurements
Predictions of axial resistance are sometimes
inconsistent with field and lab measurements
46

Things to remember…
It is dangerous to assume load distribution
• Should not “wish” resisting forces
• Should not compute resistance from structural
capacity alone
Improvement limited by controlling limit state • YOU SHOULD NOT PREDICT RESISTANCE BASED
SOLELY ON STRUCTURAL CAPACITY!!!
• Improving one limit state may only make another most critical
• Improving non-critical limit state provides no benefit
47