Embed Size (px)
Citation preview
Design of Experiments
Industrial Quality Consultants LLC page 1
How People Learn Lessons from the 20 Questions exercise o o The two elements in any learning process o o The Iterative learning process 1. 3. 2. 4.
Knowledge
Experience
1.
1. 1.
2. 2. 2.
3.
3. 3.
4. 4.
Design of Experiments
Industrial Quality Consultants LLC page 2
Doing a DOX / DOE
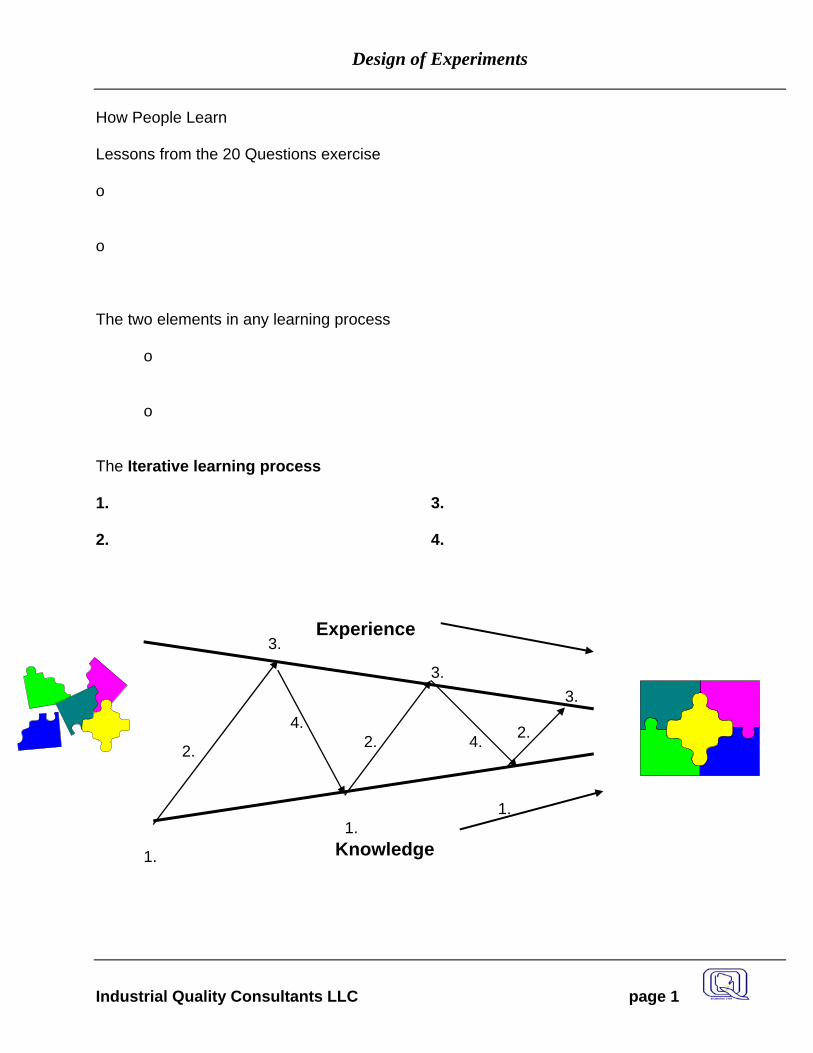
Steps for Doing a DOX determine problem and extent fishbone process flow
brainstorming KT determine response variables determine factors and levels determine organizational opportunities let computer help you design experiment perform "envelope test" run experiment using data sheet collect data analyze results determine important factors optimize for cost or stability the unimportant factors follow up
Design of Experiments
Industrial Quality Consultants LLC page 3
The Fishbone Example
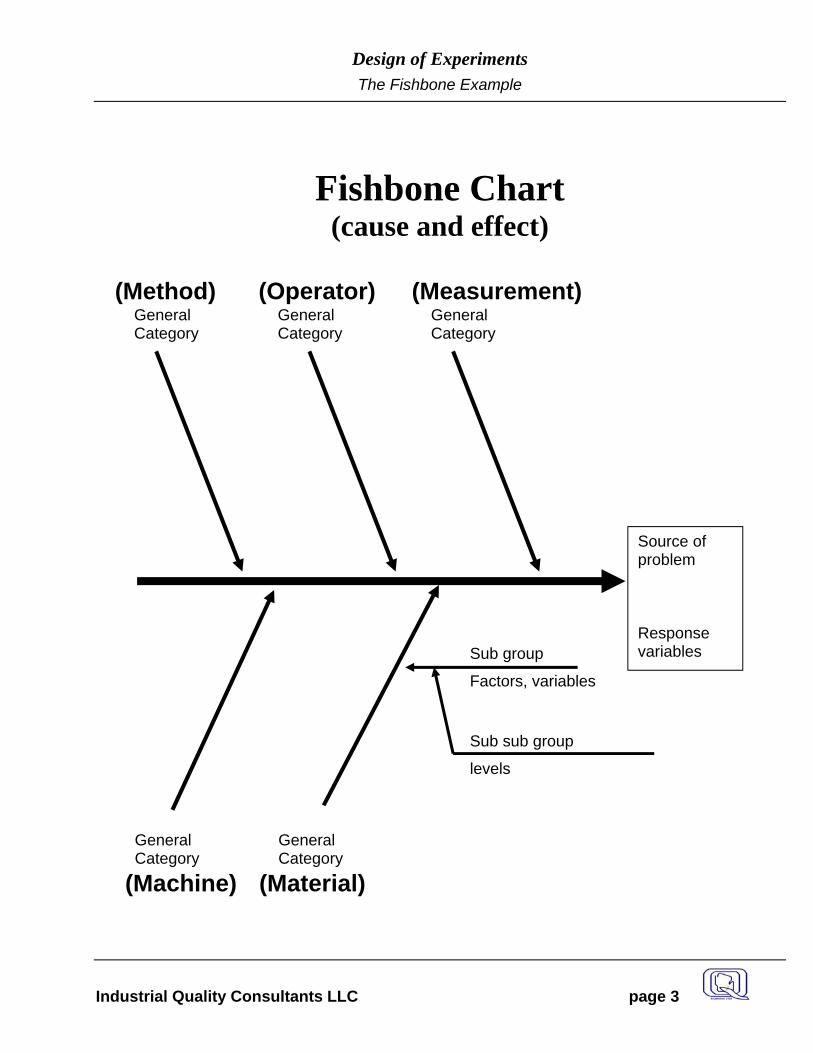
Fishbone Chart (cause and effect)
Source of problem Response variables
General Category
General Category
General Category
General Category
General Category
(Method) (Operator) (Measurement)
(Machine) (Material)
Sub group
Factors, variables
Sub sub group
levels
Design of Experiments
Industrial Quality Consultants LLC page 4
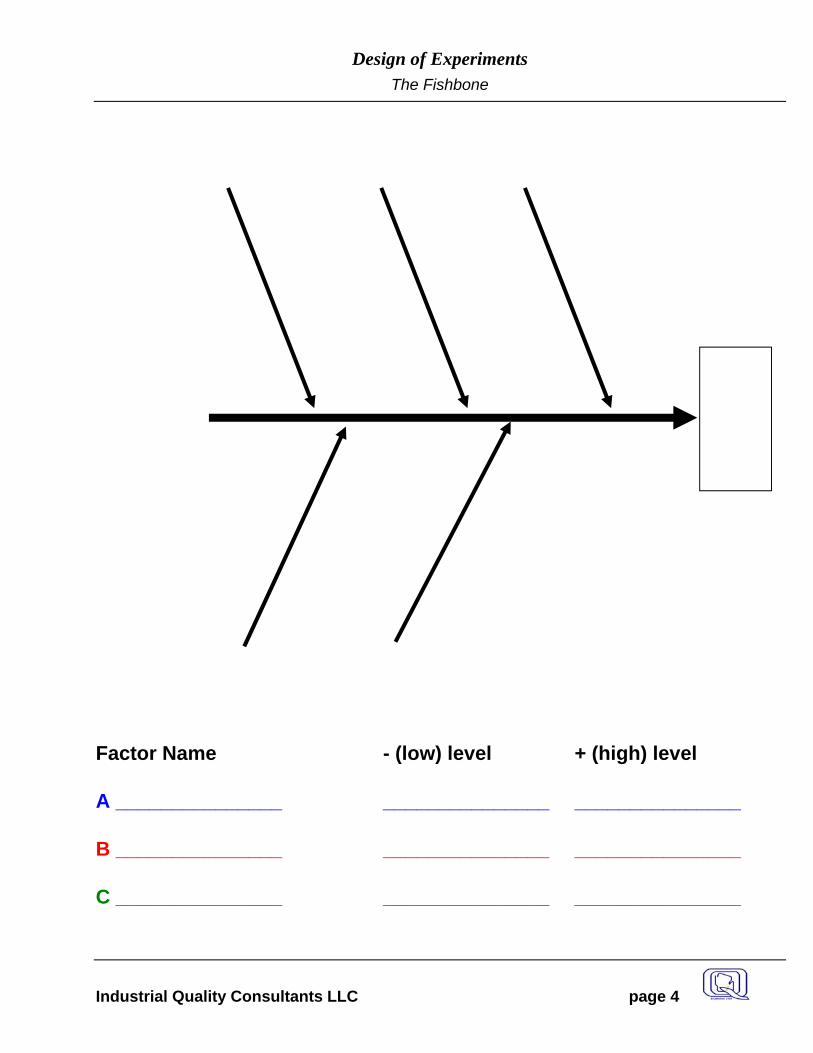
The Fishbone
Factor Name - (low) level + (high) level A _______________ _______________ _______________ B _______________ _______________ _______________ C _______________ _______________ _______________
Design of Experiments
Industrial Quality Consultants LLC page 5
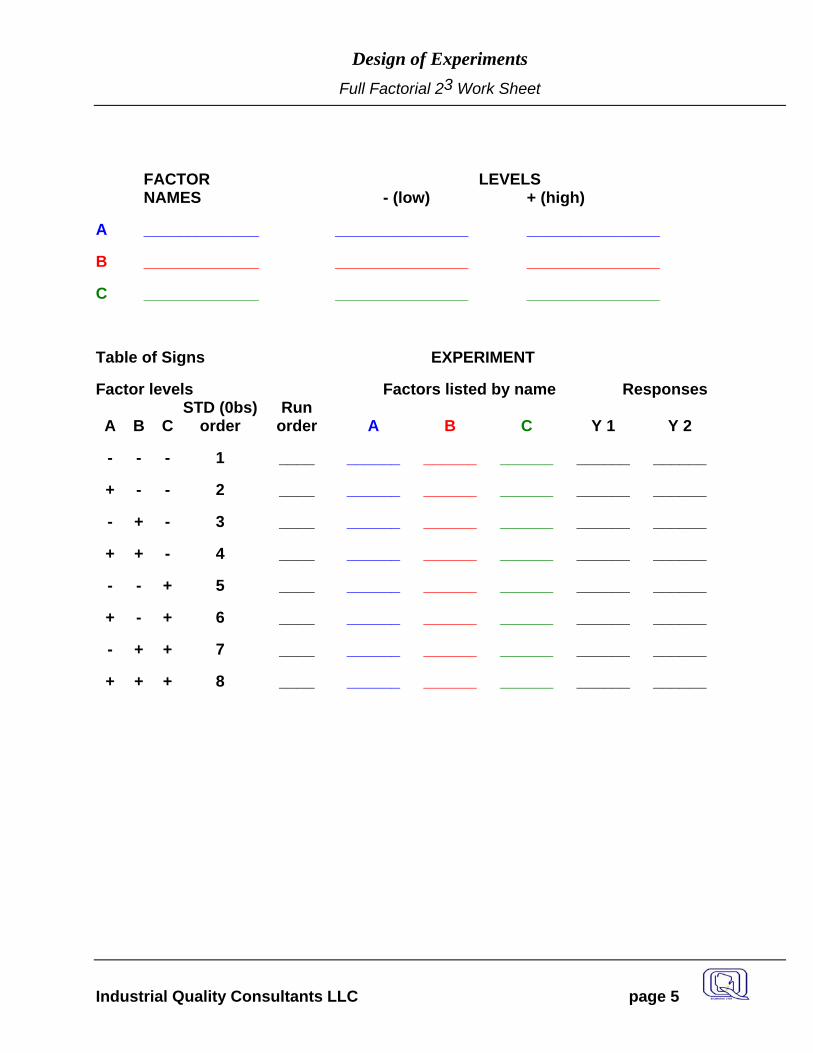
Full Factorial 23 Work Sheet
FACTOR LEVELS NAMES - (low) + (high)
A _____________ _______________ _______________
B _____________ _______________ _______________
C _____________ _______________ _______________
Table of Signs EXPERIMENT
Factor levels Factors listed by name Responses
A
B
C STD (0bs)
order Run
order
A
B
C
Y 1
Y 2
- - - 1 ____ ______ ______ ______ ______ ______
+ - - 2 ____ ______ ______ ______ ______ ______
- + - 3 ____ ______ ______ ______ ______ ______
+ + - 4 ____ ______ ______ ______ ______ ______
- - + 5 ____ ______ ______ ______ ______ ______
+ - + 6 ____ ______ ______ ______ ______ ______
- + + 7 ____ ______ ______ ______ ______ ______
+ + + 8 ____ ______ ______ ______ ______ ______
Design of Experiments
Industrial Quality Consultants LLC page 6
Envelope Test
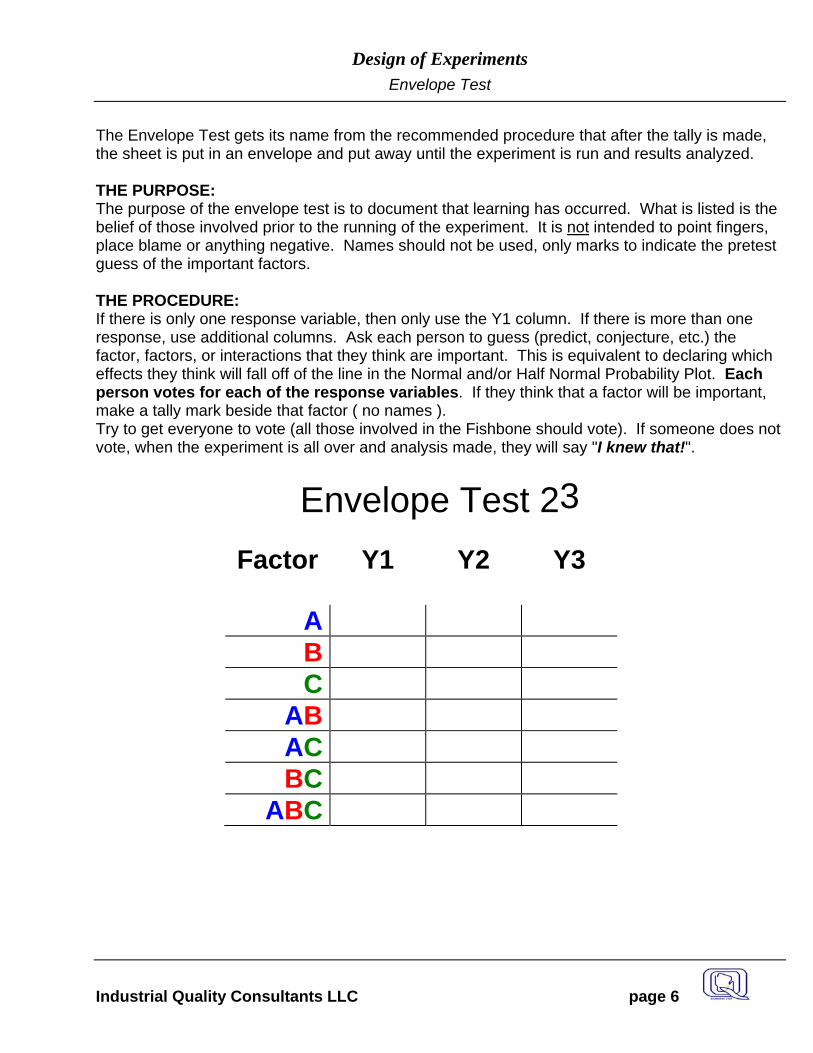
The Envelope Test gets its name from the recommended procedure that after the tally is made, the sheet is put in an envelope and put away until the experiment is run and results analyzed. THE PURPOSE: The purpose of the envelope test is to document that learning has occurred. What is listed is the belief of those involved prior to the running of the experiment. It is not intended to point fingers, place blame or anything negative. Names should not be used, only marks to indicate the pretest guess of the important factors. THE PROCEDURE: If there is only one response variable, then only use the Y1 column. If there is more than one response, use additional columns. Ask each person to guess (predict, conjecture, etc.) the factor, factors, or interactions that they think are important. This is equivalent to declaring which effects they think will fall off of the line in the Normal and/or Half Normal Probability Plot. Each person votes for each of the response variables. If they think that a factor will be important, make a tally mark beside that factor ( no names ). Try to get everyone to vote (all those involved in the Fishbone should vote). If someone does not vote, when the experiment is all over and analysis made, they will say "I knew that!".
Envelope Test 23
Factor
Y1 Y2 Y3
A B C
AB AC BC
ABC
Design of Experiments
Industrial Quality Consultants LLC page 7
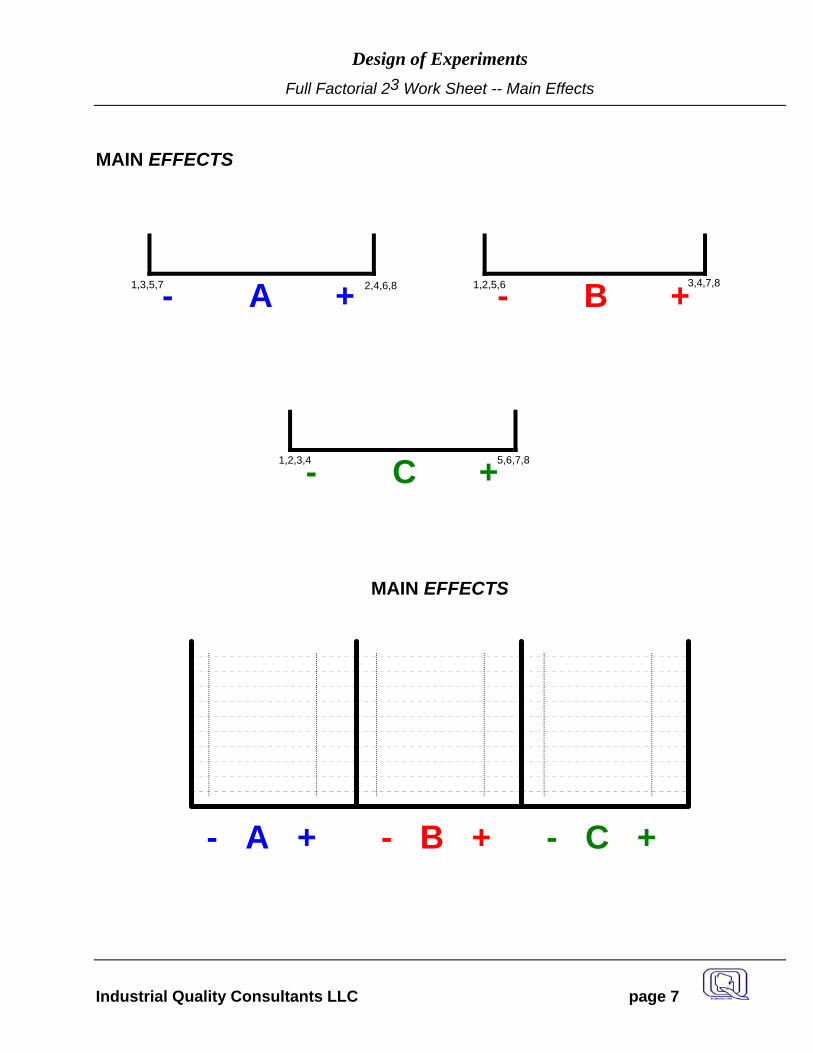
Full Factorial 23 Work Sheet -- Main Effects
MAIN EFFECTS
- A + - B +
- C +
MAIN EFFECTS
- A + - B + - C +
- A + - B + - C +
1,3,5,7 2,4,6,8 1,2,5,6 3,4,7,8
1,2,3,4 5,6,7,8
Design of Experiments
Industrial Quality Consultants LLC page 8
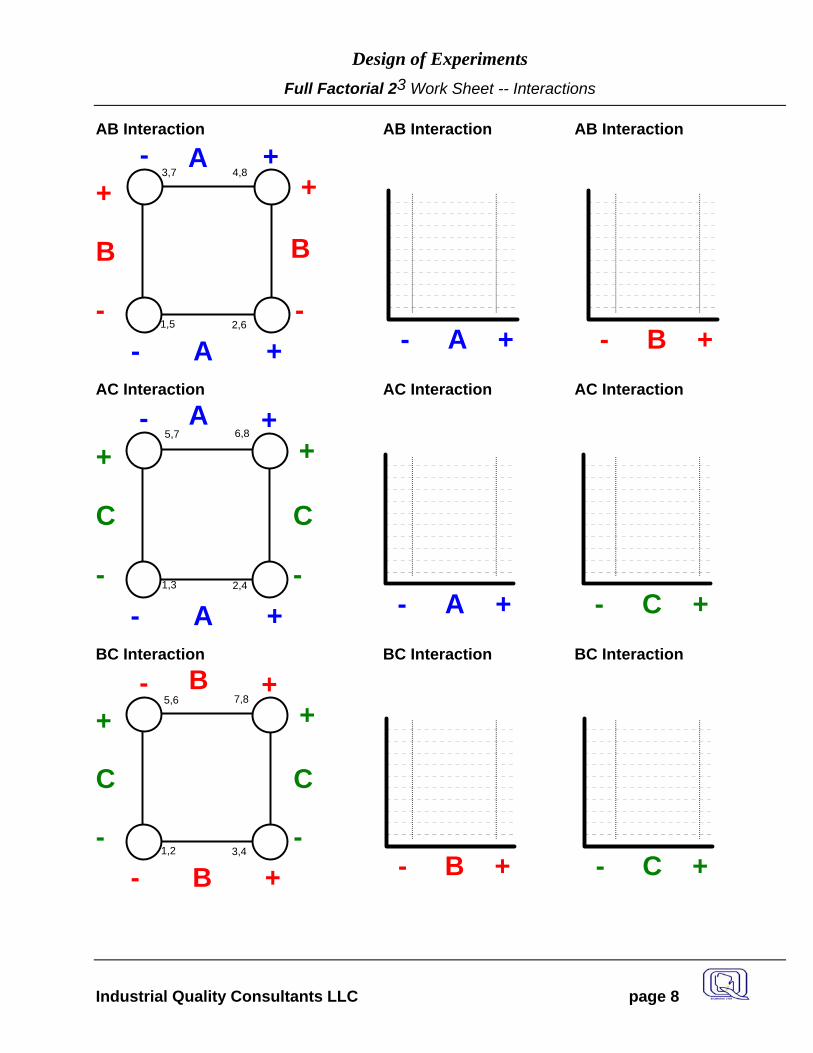
Full Factorial 23 Work Sheet -- Interactions
AB Interaction AB Interaction AB Interaction
- A + - A + - B +
B
-
+ ++
-
- A
B
AC Interaction AC Interaction AC Interaction
- A + - A + - C +
C
-
+ ++
-
- A
C
BC Interaction BC Interaction BC Interaction
- B + - B + - C +
C
-
+ ++
-
- B
C
5,7 6,8
1,3 2,4
1,5
4,8
2,6
3,7
5,6 7,8
1,2 3,4
Design of Experiments
Industrial Quality Consultants LLC page 9
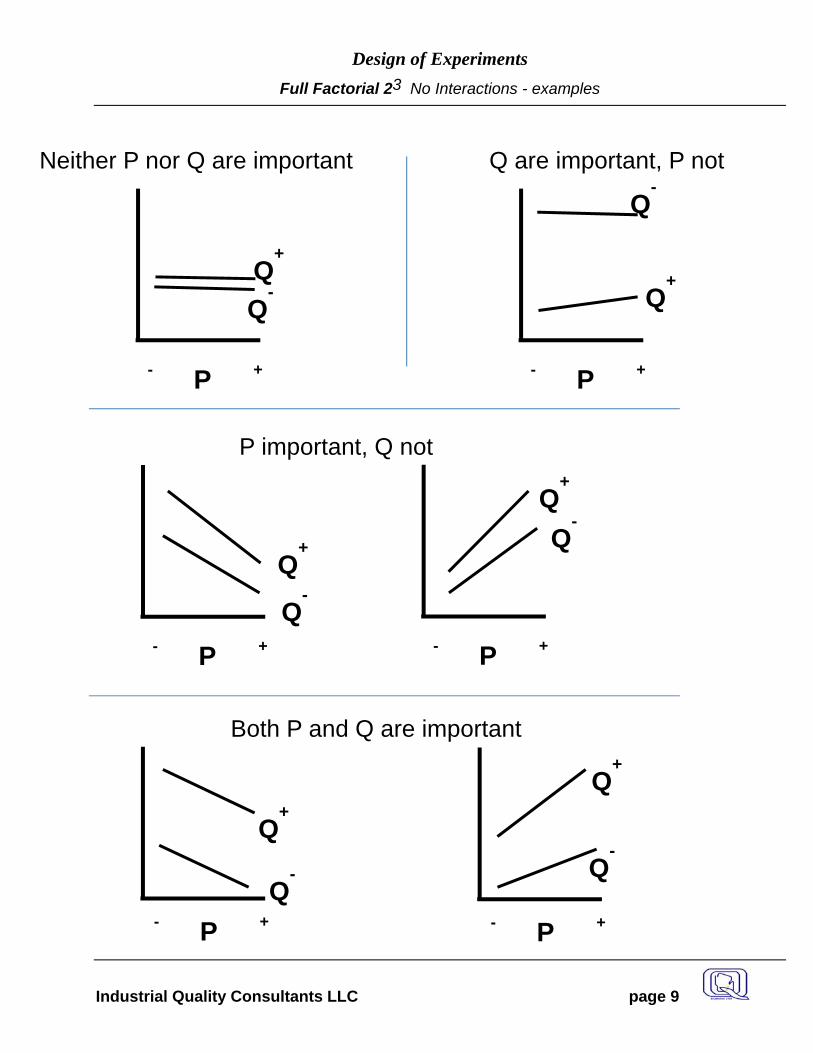
Full Factorial 23 No Interactions - examples
P - +
Q-
Q+
Neither P nor Q are important
P - +
Q-
Q+
Q are important, P not
P - +
Q-
Q+
P important, Q not
P - +
Q-
Q+
Both P and Q are important
P - +
Q-
Q+
P - +
Q-
Q+
Design of Experiments
Industrial Quality Consultants LLC page 10
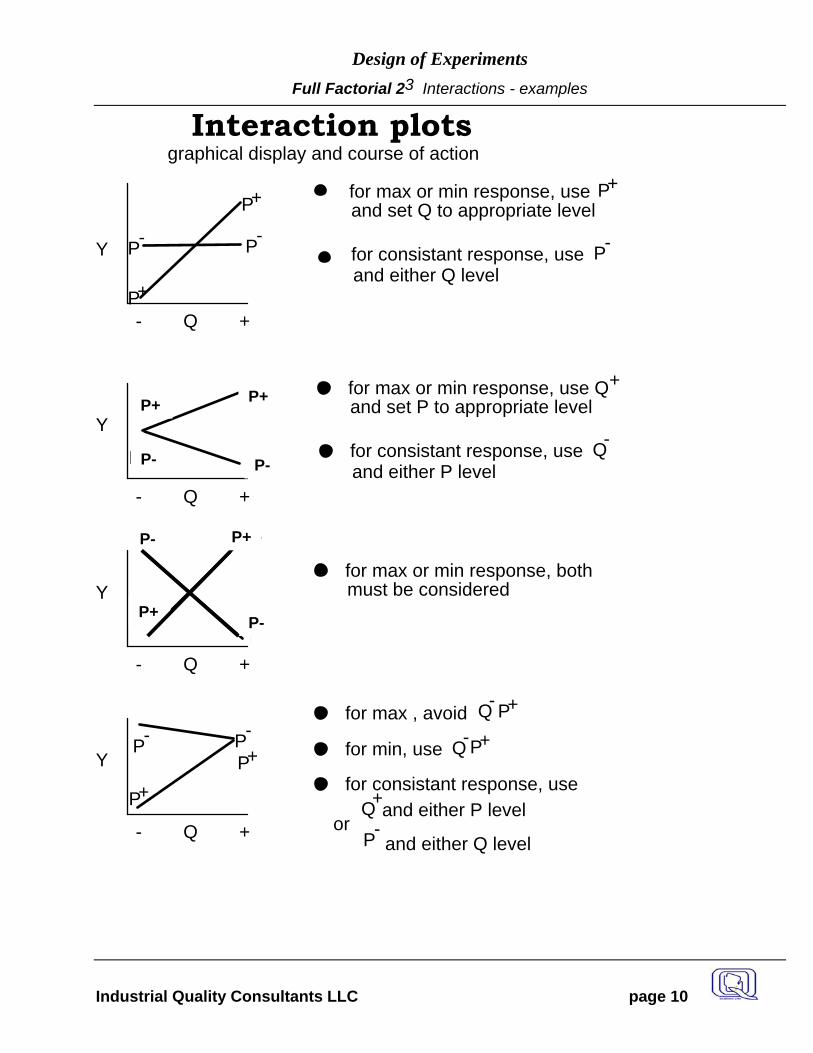
Full Factorial 23 Interactions - examples
Interaction plotsgraphical display and course of action
Y
- Q +
P+
Y
- Q +
Y
- Q +
Y
- Q +
P- P-
P+
P+
P-
for max or min response, use P+and set Q to appropriate level
for consistant response, use P-
and either Q level
P+
P-
P+
P-
for max or min response, use Q+and set P to appropriate level
for consistant response, use Q-
and either P level
P+
P-
for max or min response, bothmust be considered
P-P+
P+
P-for max , avoid P+Q-
for min, use P+Q-
for consistant response, useand either P level
and either Q level
Q+
P-or
P+
P- P-
P+
P+
P+
P-
P-
Design of Experiments
Industrial Quality Consultants LLC page 11
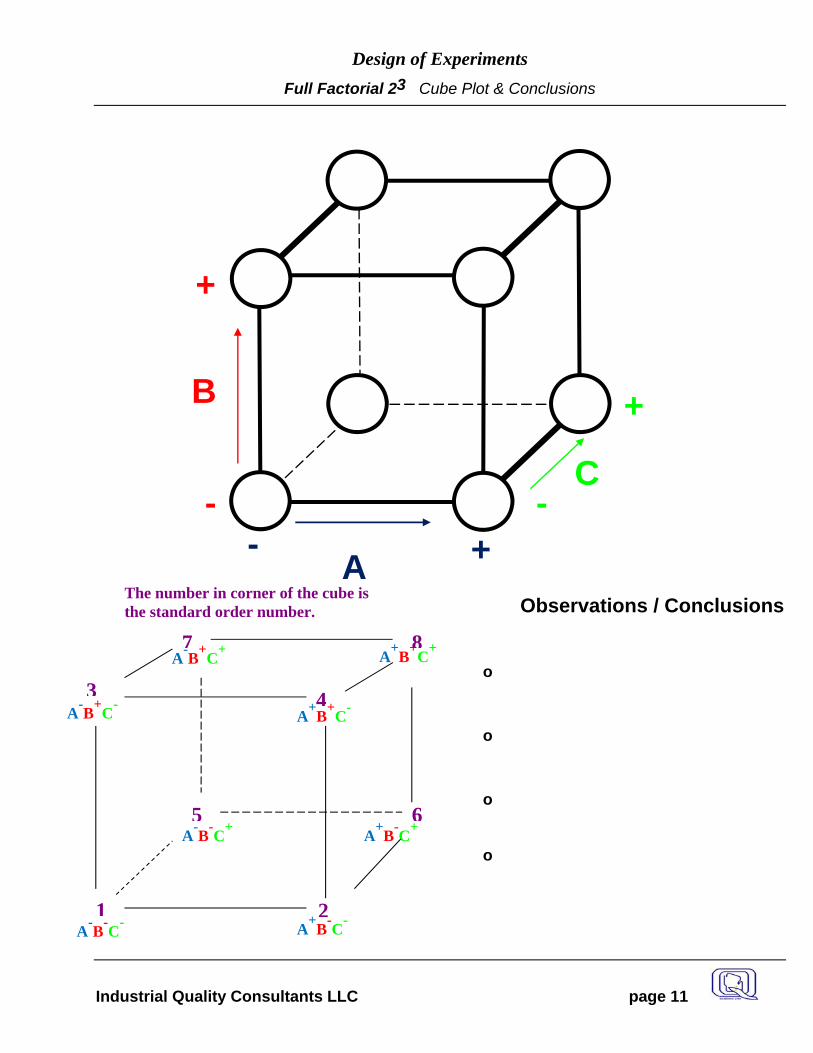
Full Factorial 23 Cube Plot & Conclusions
Observations / Conclusions
o
o
o
o
2A-B-C- A+B-C-
A-B+C- A+B+C-
A-B-C+ A+B-C+
A-B+C+ A+B+C+
The number in corner of the cube is the standard order number.
A - +
B
C
+
+
- -
6
1
5
3 4
7 8
Design of Experiments
Industrial Quality Consultants LLC page 12
Two Variables - a Geometric View
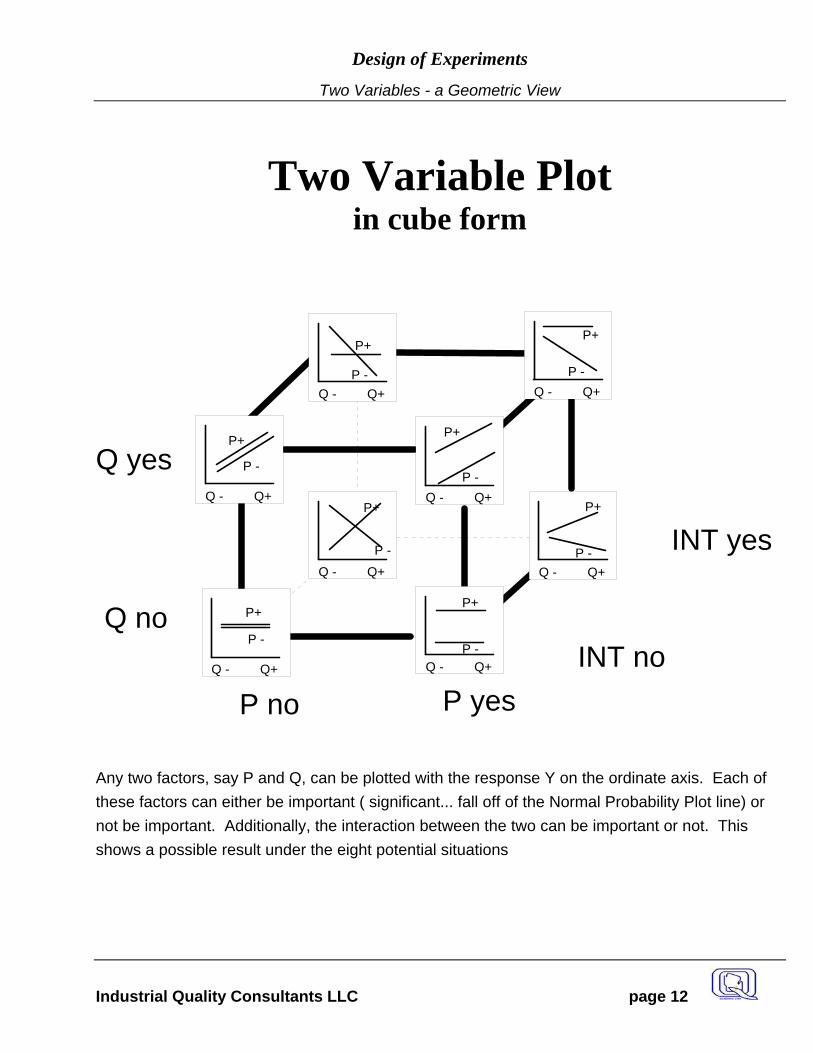
Two Variable Plot in cube form
P+
P -
Q - Q+
P+
P -Q - Q+
P+
P -Q - Q+
P+
P -Q - Q+
P+
P -Q - Q+
P+
P -
Q - Q+
P+
P -Q - Q+
P+
P -Q - Q+
P no P yes
Q no
Q yes
INT no
INT yes
Any two factors, say P and Q, can be plotted with the response Y on the ordinate axis. Each of these factors can either be important ( significant... fall off of the Normal Probability Plot line) or not be important. Additionally, the interaction between the two can be important or not. This shows a possible result under the eight potential situations
Design of Experiments
Industrial Quality Consultants LLC page 13
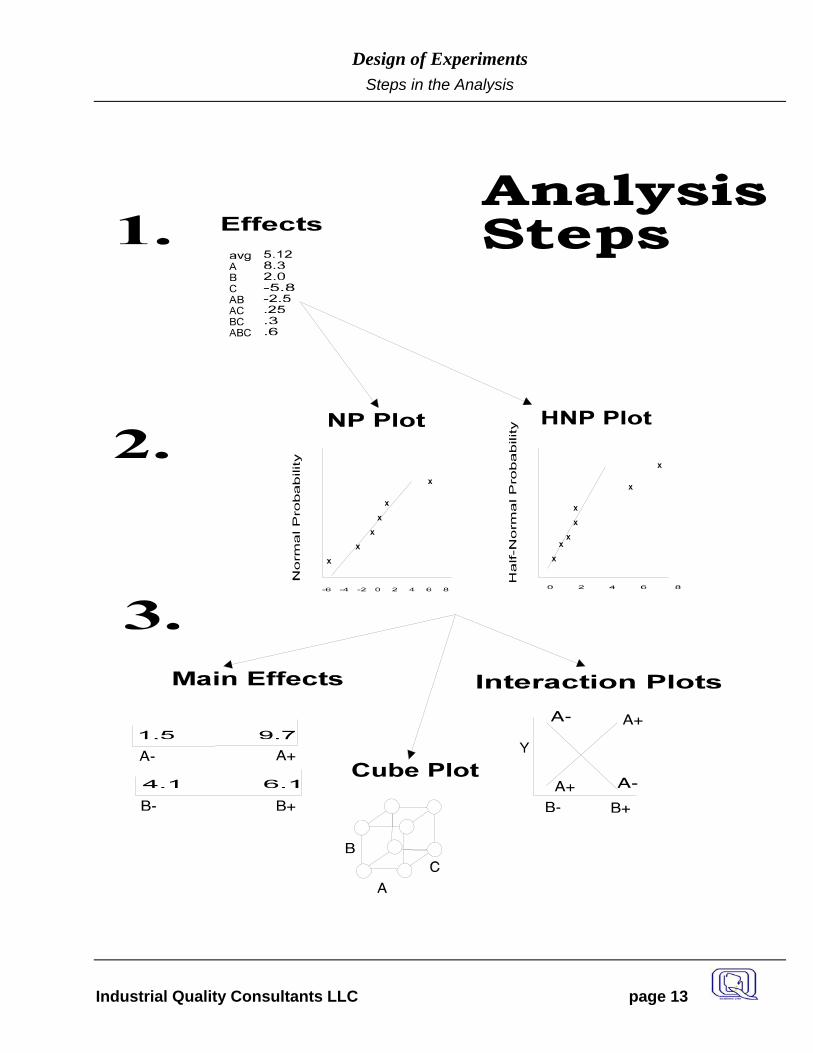
Steps in the Analysis
Design of Experiments
Industrial Quality Consultants LLC page 14
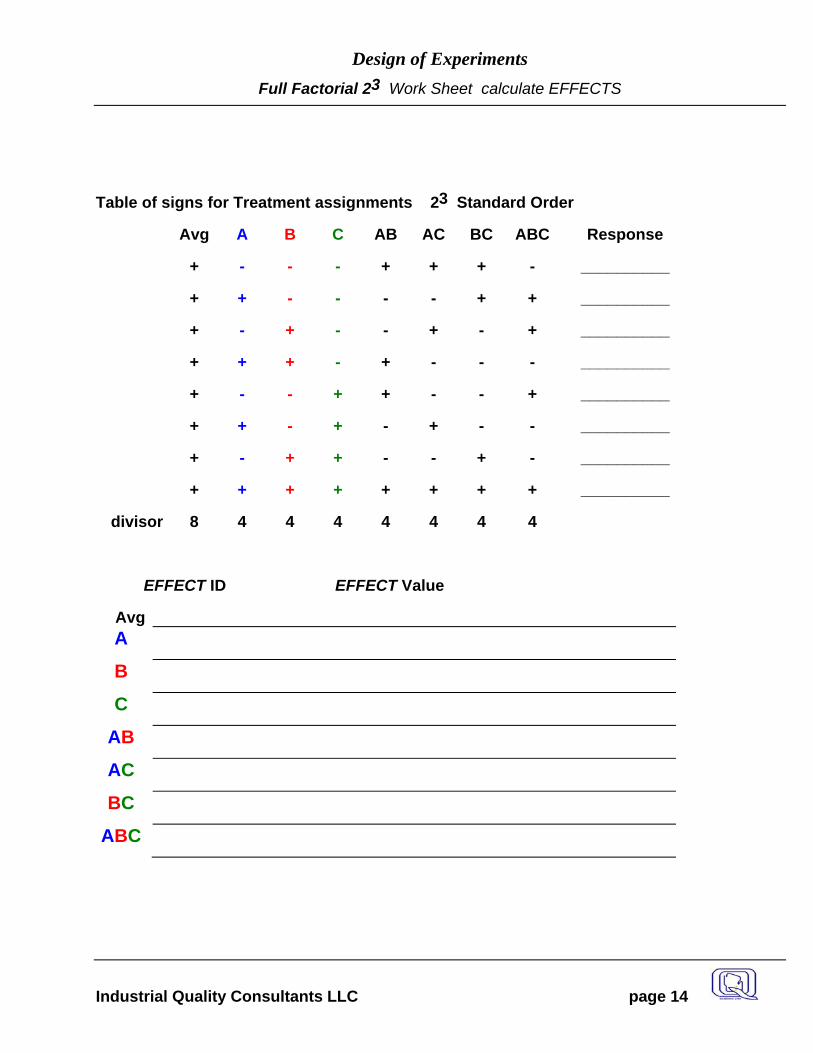
Full Factorial 23 Work Sheet calculate EFFECTS
Table of signs for Treatment assignments 23 Standard Order
Avg A B C AB AC BC ABC Response
+ - - - + + + - __________
+ + - - - - + + __________
+ - + - - + - + __________
+ + + - + - - - __________
+ - - + + - - + __________
+ + - + - + - - __________
+ - + + - - + - __________
+ + + + + + + + __________
divisor 8 4 4 4 4 4 4 4
EFFECT ID EFFECT Value
Avg A B C
AB AC BC
ABC
Design of Experiments
Industrial Quality Consultants LLC page 15
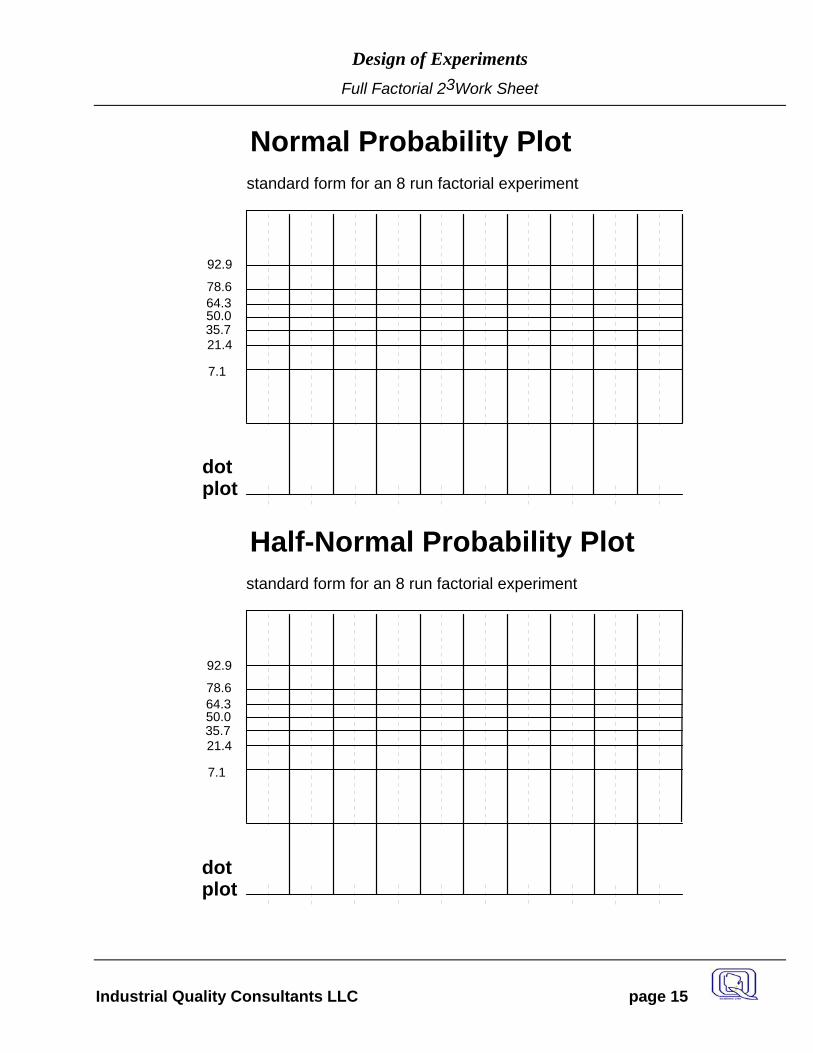
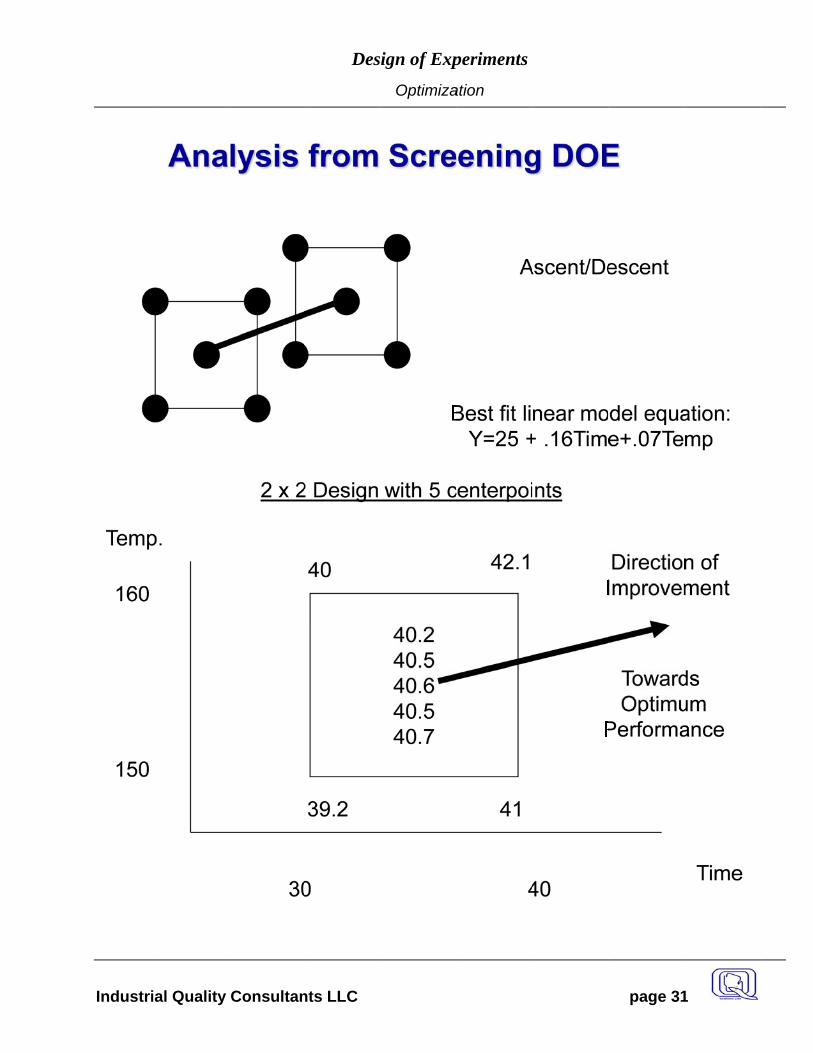
Full Factorial 23Work Sheet
7.1
21.435.750.064.378.6
92.9
dotplot
standard form for an 8 run factorial experiment
Normal Probability Plot
7.1
21.435.750.064.378.6
92.9
dotplot
standard form for an 8 run factorial experiment
Half-Normal Probability Plot
Design of Experiments
Industrial Quality Consultants LLC page 16
Helpful Hints for Interpretation
Pareto Chart: Look for groups or patterns of long and short bars. Remember “effect sparcity” - more should be unimportant than important.
Normal Probability Plot: Fat dots and wide lines. Again “effect sparcity”, most of the dots make up the line. Important (big players, significant factors) will be off the line - below and to the right or above and to the left. Caution- sometimes the only reason is it off the line is because it is the only negative value - its size(magnitude may be small).
For both probability plots, when the point is far off the line, it is obvious. If it is not far off the line, then there is not much evidence to say the factor associated with that effect has a strong influence.
Half Normal Probability Plot: (used more often for factor selection - especially 8 run designs.) Fat dots and wide lines. Again “effect sparcity”, most of the dots make up the line. Important (big players, significant factors) will be off the line - only below and to the right. It looks only at the magnitude of the effect.
For designed experiments with centerpoints and replicates, a p-value is available to provide statistical evidence of influential factors and interactions.
The List of Calculated Effects: Three factor interactions rarely exist - most of the time it is more an indication of the variation (noise) of the process. If it is one of the points off the line, most of the time you should conclude that none of the factors are important.
Design of Experiments
Industrial Quality Consultants LLC page 17
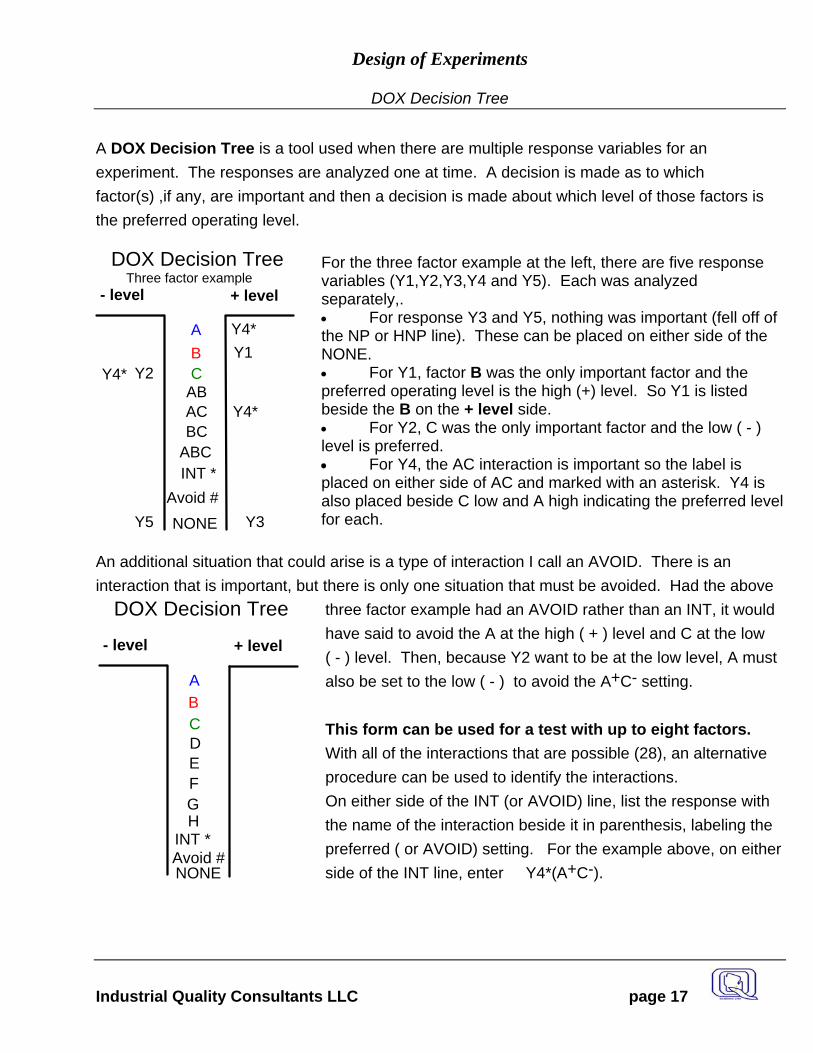
DOX Decision Tree A DOX Decision Tree is a tool used when there are multiple response variables for an experiment. The responses are analyzed one at time. A decision is made as to which factor(s) ,if any, are important and then a decision is made about which level of those factors is the preferred operating level.
For the three factor example at the left, there are five response variables (Y1,Y2,Y3,Y4 and Y5). Each was analyzed separately,. • For response Y3 and Y5, nothing was important (fell off of the NP or HNP line). These can be placed on either side of the NONE. • For Y1, factor B was the only important factor and the preferred operating level is the high (+) level. So Y1 is listed beside the B on the + level side. • For Y2, C was the only important factor and the low ( - ) level is preferred. • For Y4, the AC interaction is important so the label is placed on either side of AC and marked with an asterisk. Y4 is also placed beside C low and A high indicating the preferred level for each.
An additional situation that could arise is a type of interaction I call an AVOID. There is an interaction that is important, but there is only one situation that must be avoided. Had the above
three factor example had an AVOID rather than an INT, it would have said to avoid the A at the high ( + ) level and C at the low ( - ) level. Then, because Y2 want to be at the low level, A must also be set to the low ( - ) to avoid the A+C- setting. This form can be used for a test with up to eight factors. With all of the interactions that are possible (28), an alternative procedure can be used to identify the interactions. On either side of the INT (or AVOID) line, list the response with the name of the interaction beside it in parenthesis, labeling the preferred ( or AVOID) setting. For the example above, on either side of the INT line, enter Y4*(A+C-).
ABC
ABACBC
ABC
DOX Decision Tree
- level + level
INT *Avoid #NONE
Three factor example
Y1Y2
Y3
Y4*
Y5
Y4*
Y4*
ABCDEFG
DOX Decision Tree
- level + level
INT *Avoid #NONE
H
Design of Experiments
Industrial Quality Consultants LLC page 18
The Advantages and Disadvantages
The Advantages and Disadvantages of DOX / DOE over OAATS
Advantages of DOX / DOE over OAATS
•
•
•
•
• Disadvantages of DOX / DOE over OAATS
•
•
•
•
Design of Experiments
Industrial Quality Consultants LLC page 19
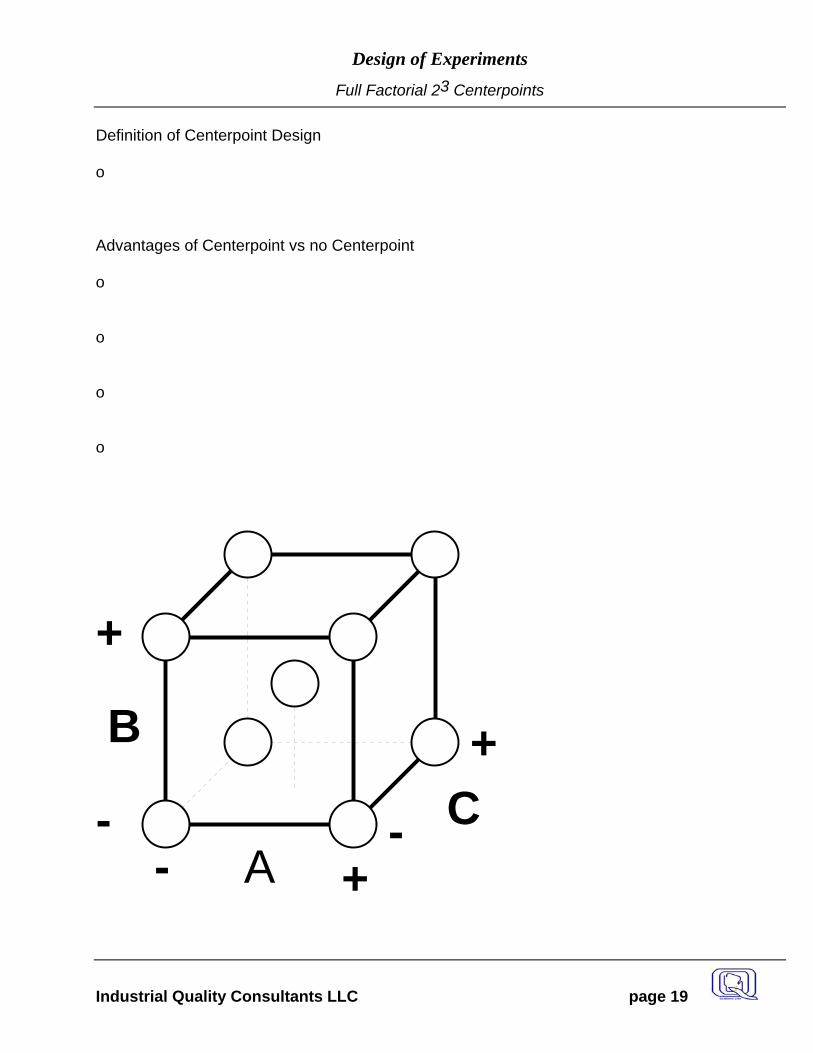
Full Factorial 23 Centerpoints
Definition of Centerpoint Design o Advantages of Centerpoint vs no Centerpoint o o o o
A- +
B
C+
+
- -
Design of Experiments
Industrial Quality Consultants LLC page 20
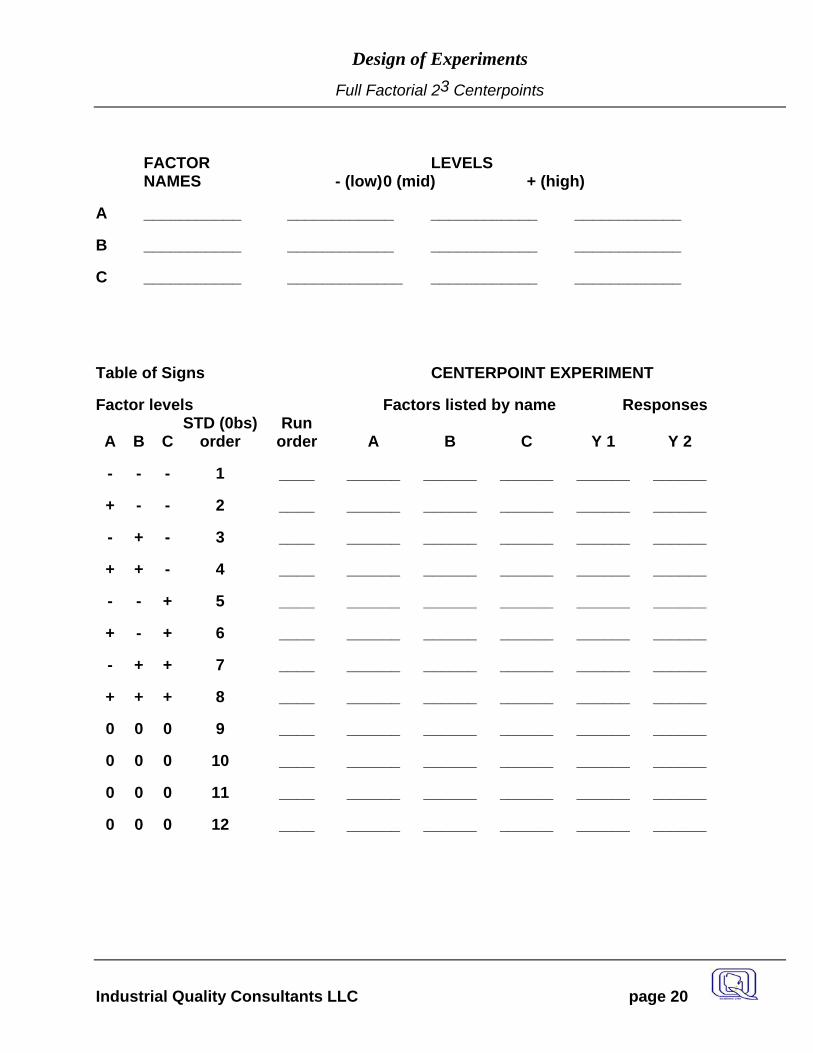
Full Factorial 23 Centerpoints
FACTOR LEVELS NAMES - (low) 0 (mid) + (high)
A ___________ ____________ ____________ ____________
B ___________ ____________ ____________ ____________
C ___________ _____________ ____________ ____________
Table of Signs CENTERPOINT EXPERIMENT
Factor levels Factors listed by name Responses
A
B
C STD (0bs)
order Run
order
A
B
C
Y 1
Y 2
- - - 1 ____ ______ ______ ______ ______ ______
+ - - 2 ____ ______ ______ ______ ______ ______
- + - 3 ____ ______ ______ ______ ______ ______
+ + - 4 ____ ______ ______ ______ ______ ______
- - + 5 ____ ______ ______ ______ ______ ______
+ - + 6 ____ ______ ______ ______ ______ ______
- + + 7 ____ ______ ______ ______ ______ ______
+ + + 8 ____ ______ ______ ______ ______ ______
0 0 0 9 ____ ______ ______ ______ ______ ______
0 0 0 10 ____ ______ ______ ______ ______ ______
0 0 0 11 ____ ______ ______ ______ ______ ______
0 0 0 12 ____ ______ ______ ______ ______ ______

Design of Experiments
Industrial Quality Consultants LLC page 21
Full Factorial 24
Definition of Full Factorial 4 factor design
std orde
r
A B C D AB AC AD BC BD CD ABC ABD ACD BCD ABCD
1 - - - - + + + + + + - - - - + 2 + - - - - - - + + + + + + - - 3 - + - - - + + - - + + + - + - 4 + + - - + - - - - + - - + + + 5 - - + - + - + - + - + - + + - 6 + - + - - + - - + - - + - + + 7 - + + - - - + + - - - + + - + 8 + + + - + + - + - - + - - - - 9 - - - + + + - + - - - + + + -
10 + - - + - - + + - - + - - + + 11 - + - + - + - - + - + - + - + 12 + + - + + - + - + - - + - - - 13 - - + + + - - - - + + + - - + 14 + - + + - + + - - + - - + - - 15 - + + + - - - + + + - - - + - 16 + + + + + + + + + + + + + + +
Advantages o o o o o o
Design of Experiments
Industrial Quality Consultants LLC page 22
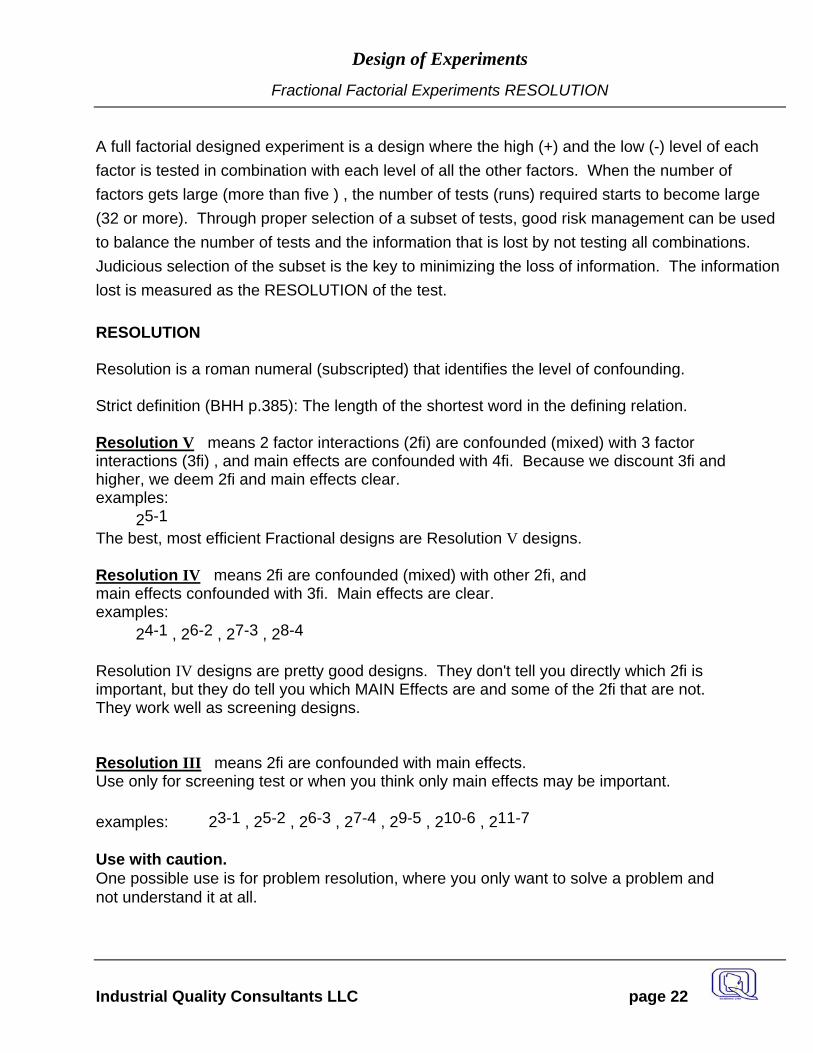
Fractional Factorial Experiments RESOLUTION
A full factorial designed experiment is a design where the high (+) and the low (-) level of each factor is tested in combination with each level of all the other factors. When the number of factors gets large (more than five ) , the number of tests (runs) required starts to become large (32 or more). Through proper selection of a subset of tests, good risk management can be used to balance the number of tests and the information that is lost by not testing all combinations. Judicious selection of the subset is the key to minimizing the loss of information. The information lost is measured as the RESOLUTION of the test. RESOLUTION Resolution is a roman numeral (subscripted) that identifies the level of confounding. Strict definition (BHH p.385): The length of the shortest word in the defining relation. Resolution V means 2 factor interactions (2fi) are confounded (mixed) with 3 factor interactions (3fi) , and main effects are confounded with 4fi. Because we discount 3fi and higher, we deem 2fi and main effects clear. examples: 25-1 The best, most efficient Fractional designs are Resolution V designs. Resolution IV means 2fi are confounded (mixed) with other 2fi, and main effects confounded with 3fi. Main effects are clear. examples: 24-1 , 26-2 , 27-3 , 28-4 Resolution IV designs are pretty good designs. They don't tell you directly which 2fi is important, but they do tell you which MAIN Effects are and some of the 2fi that are not. They work well as screening designs. Resolution III means 2fi are confounded with main effects. Use only for screening test or when you think only main effects may be important. examples: 23-1 , 25-2 , 26-3 , 27-4 , 29-5 , 210-6 , 211-7 Use with caution. One possible use is for problem resolution, where you only want to solve a problem and not understand it at all.
Design of Experiments
Industrial Quality Consultants LLC page 23
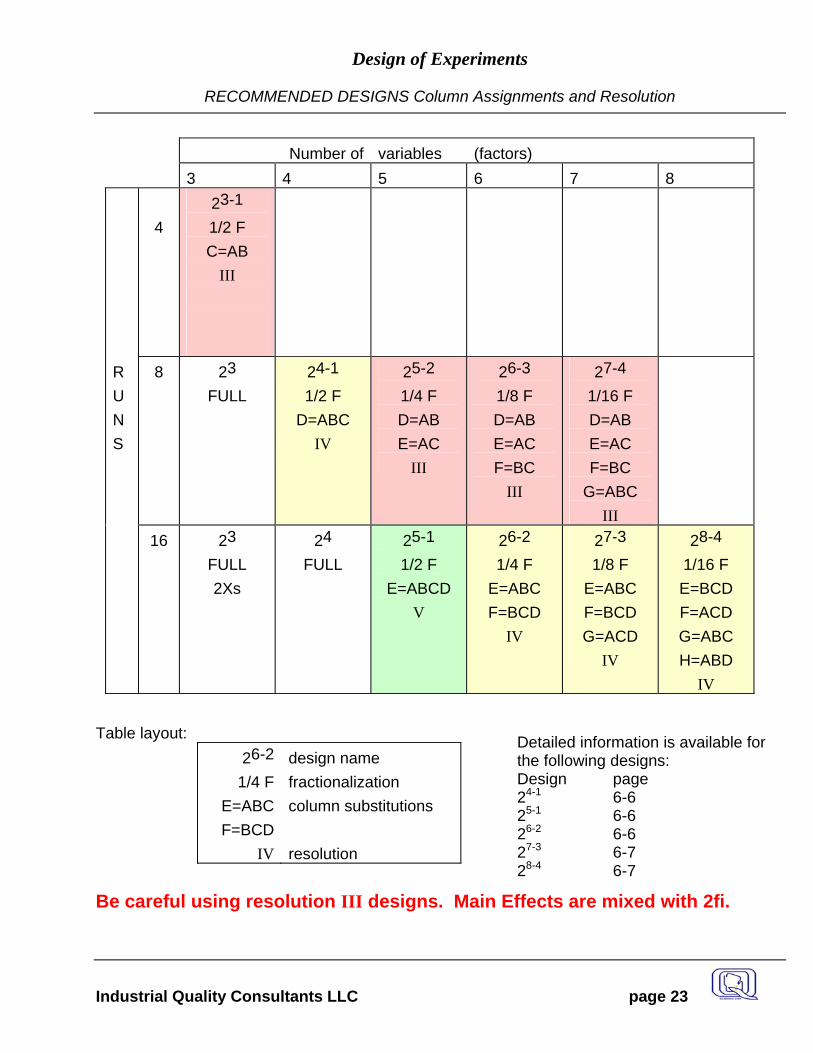
RECOMMENDED DESIGNS Column Assignments and Resolution
Number of variables (factors) 3 4 5 6 7 8
4 23-1 1/2 F C=AB
III
RUNS
8 23 FULL
24-1 1/2 F
D=ABC IV
25-2 1/4 F D=AB E=AC
III
26-3 1/8 F D=AB E=AC F=BC
III
27-4 1/16 F D=AB E=AC F=BC
G=ABC III
16 23 FULL 2Xs
24 FULL
25-1 1/2 F
E=ABCD V
26-2 1/4 F
E=ABC F=BCD
IV
27-3 1/8 F
E=ABC F=BCD G=ACD
IV
28-4 1/16 F E=BCD F=ACD G=ABC H=ABD
IV
Table layout: 26-2
1/4 F E=ABC F=BCD
IV
design name fractionalization column substitutions resolution
Be careful using resolution III designs. Main Effects are mixed with 2fi.
Detailed information is available for the following designs: Design page 24-1 6-6 25-1 6-6 26-2 6-6 27-3 6-7 28-4 6-7
Design of Experiments
Industrial Quality Consultants LLC page 24
Fractional Factorial column of signs demo
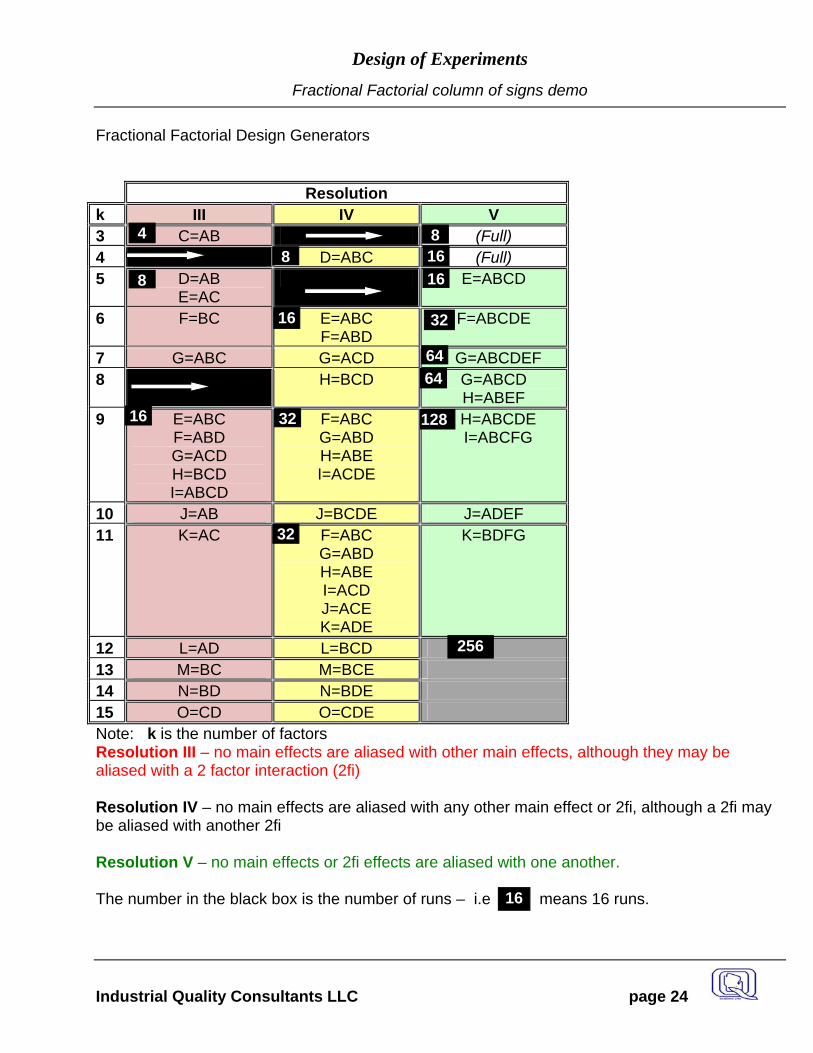
Fractional Factorial Design Generators Resolution k III IV V 3 C=AB (Full) 4 D=ABC (Full) 5 D=AB
E=AC E=ABCD
6 F=BC E=ABC F=ABD
F=ABCDE
7 G=ABC G=ACD G=ABCDEF 8 H=BCD G=ABCD
H=ABEF 9 E=ABC
F=ABD G=ACD H=BCD I=ABCD
F=ABC G=ABD H=ABE I=ACDE
H=ABCDE I=ABCFG
10 J=AB J=BCDE J=ADEF 11 K=AC F=ABC
G=ABD H=ABE I=ACD J=ACE K=ADE
K=BDFG
12 L=AD L=BCD 13 M=BC M=BCE 14 N=BD N=BDE 15 O=CD O=CDE Note: k is the number of factors Resolution III – no main effects are aliased with other main effects, although they may be aliased with a 2 factor interaction (2fi) Resolution IV – no main effects are aliased with any other main effect or 2fi, although a 2fi may be aliased with another 2fi Resolution V – no main effects or 2fi effects are aliased with one another. The number in the black box is the number of runs – i.e means 16 runs.
4
8 8
81616
16
16 32
32
6464
128
256
16
32
Design of Experiments
Industrial Quality Consultants LLC page 25
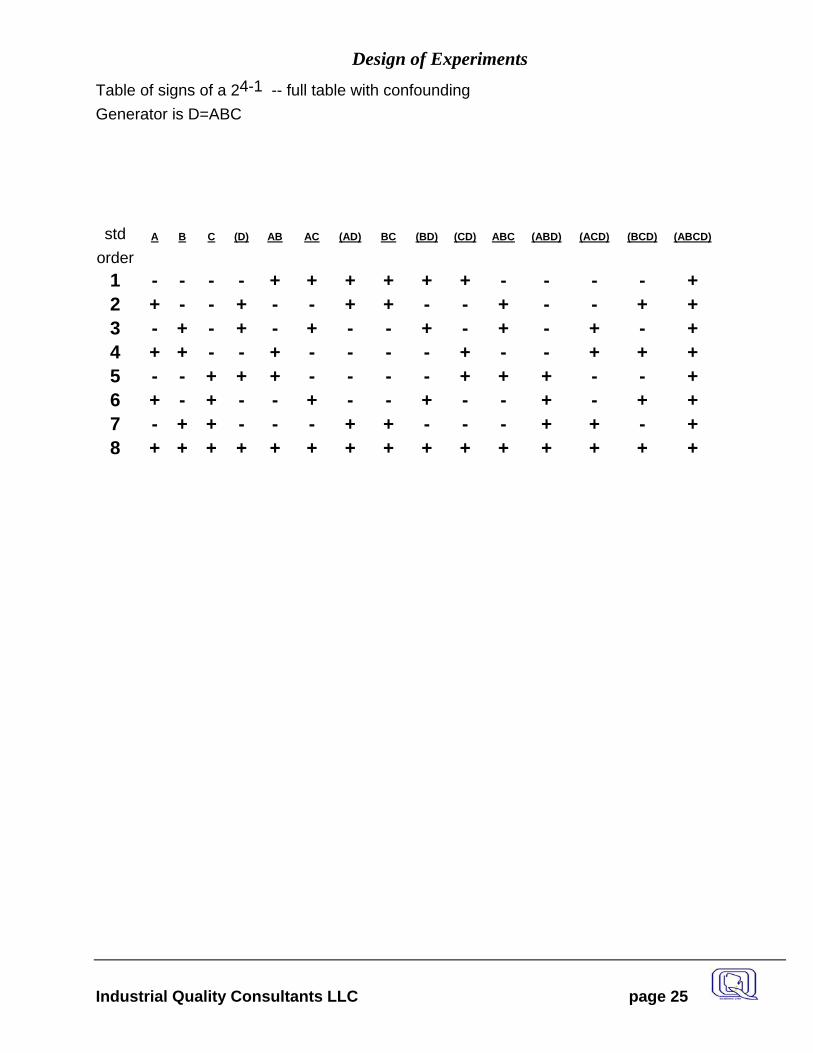
Table of signs of a 24-1 -- full table with confounding Generator is D=ABC std
order
A B C (D) AB AC (AD) BC (BD) (CD) ABC (ABD) (ACD) (BCD) (ABCD)
1 - - - - + + + + + + - - - - + 2 + - - + - - + + - - + - - + + 3 - + - + - + - - + - + - + - + 4 + + - - + - - - - + - - + + + 5 - - + + + - - - - + + + - - + 6 + - + - - + - - + - - + - + + 7 - + + - - - + + - - - + + - + 8 + + + + + + + + + + + + + + +
Design of Experiments
Industrial Quality Consultants LLC page 26
Graphical Display of Fractional Factorial
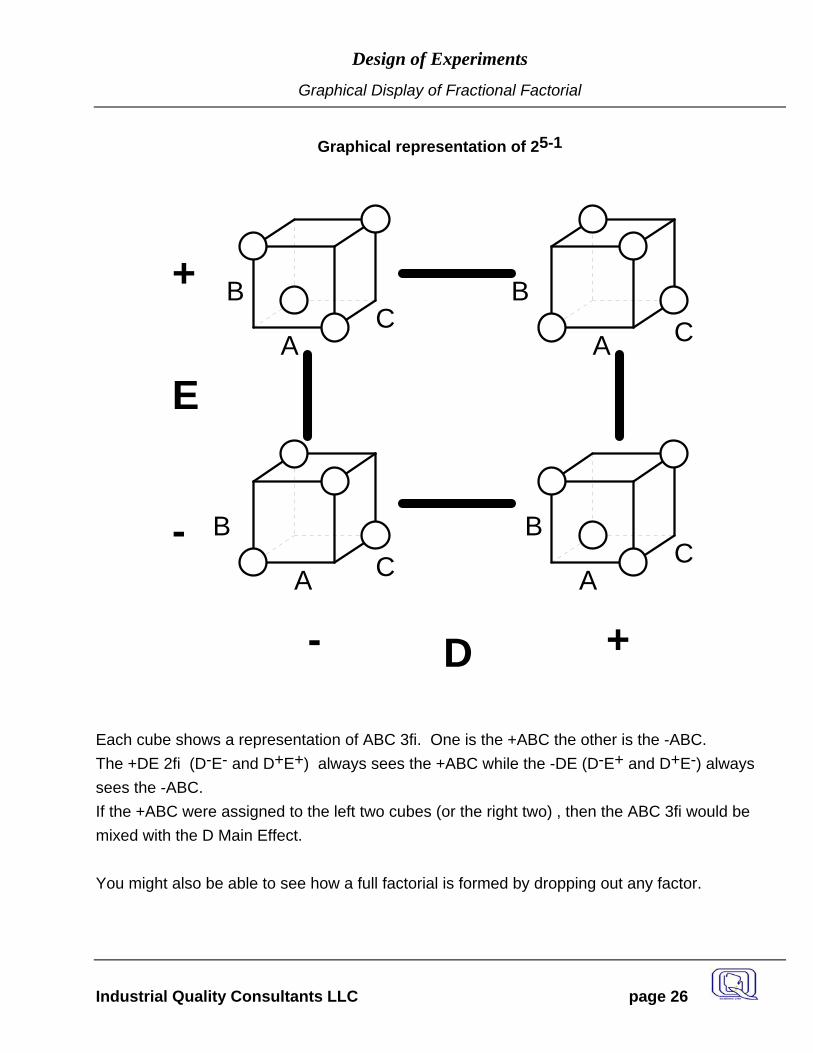
Graphical representation of 25-1
A
BC CA
B
A
BCCA
B
D- +
+
-
E
Each cube shows a representation of ABC 3fi. One is the +ABC the other is the -ABC. The +DE 2fi (D-E- and D+E+) always sees the +ABC while the -DE (D-E+ and D+E-) always sees the -ABC. If the +ABC were assigned to the left two cubes (or the right two) , then the ABC 3fi would be mixed with the D Main Effect. You might also be able to see how a full factorial is formed by dropping out any factor.
Design of Experiments
Industrial Quality Consultants LLC page 27
Miscellaneous
Blocking
Definition of Blocking A block is a portion of the experimental material that is expected to be more homogeneous than the aggregate. (BHH) Removing a source of variation from the analysis (not the test program) , which is not of interest in testing. Most of the time it you block because you have to , not because you want to. Examples : Batches of raw material which you will be subjecting to test. ( It is best to run your test all from the same batch. If you cannot, you can use blocking to remove differences between batches from the analysis.) Shifts There may be a difference between 1st and 2nd shift and all of the tests cannot be run on the same shift, but we don't want the differences between shifts to pollute the experiment. Operators To remove the difference between operators from the experiment when all runs cannot be made by the same operator, use the operator as a blocking factor. Benefits of blocking
An experiment can produce good results in spite of a known ( or potential ) source of variation. SORTING is not the same as BLOCKING. Sorting is when you want to not randomize one or more of the test factors for economic or connivance reasons. The statistically correct procedure is to completely randomize, however sometimes the economic decision is made not to randomize all factors. As we have said, randomizing is like and insurance policy. You can choose not to take the insurance with increased risk. Good blocking experiments use higher order interactions to set up the blocking schemes. Sorting is using one of the MAIN EFFECTS to set up the blocking scheme. Block what you can and randomize what you cannot !
Design of Experiments
Industrial Quality Consultants LLC page 28
Miscellaneous
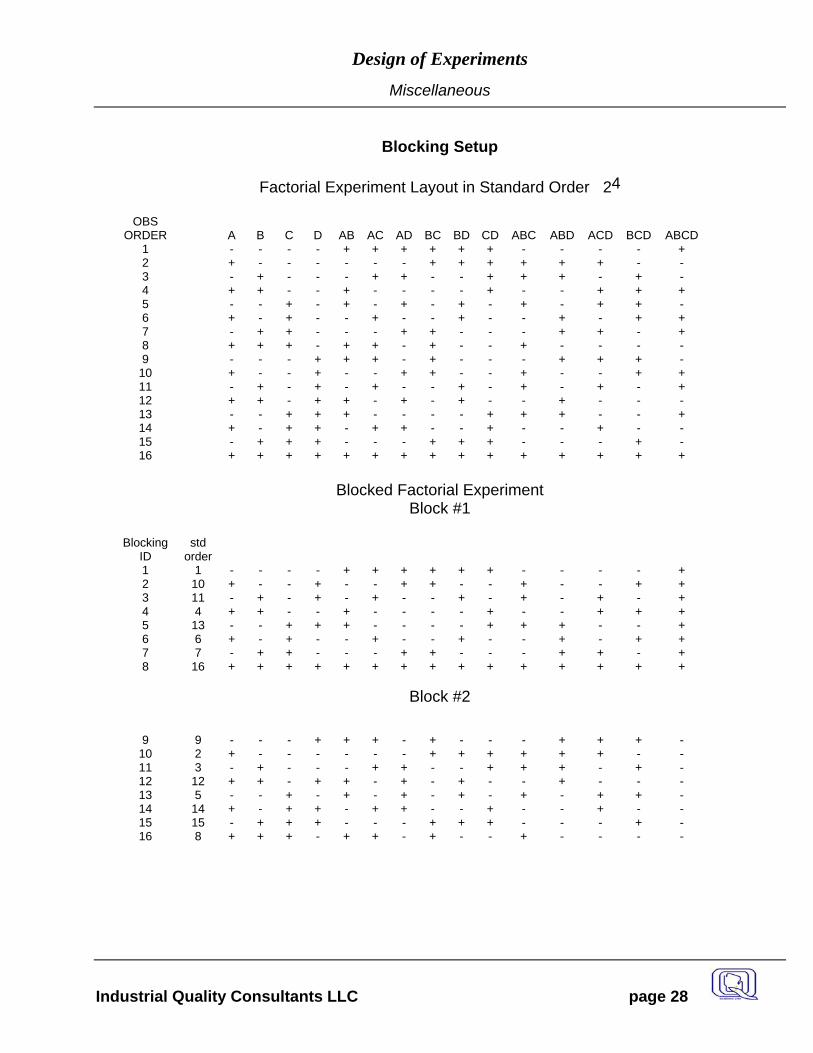
Blocking Setup
Factorial Experiment Layout in Standard Order 24
OBS
ORDER A B C D AB AC AD BC BD CD ABC ABD ACD BCD ABCD 1 - - - - + + + + + + - - - - + 2 + - - - - - - + + + + + + - - 3 - + - - - + + - - + + + - + - 4 + + - - + - - - - + - - + + + 5 - - + - + - + - + - + - + + - 6 + - + - - + - - + - - + - + + 7 - + + - - - + + - - - + + - + 8 + + + - + + - + - - + - - - - 9 - - - + + + - + - - - + + + -
10 + - - + - - + + - - + - - + + 11 - + - + - + - - + - + - + - + 12 + + - + + - + - + - - + - - - 13 - - + + + - - - - + + + - - + 14 + - + + - + + - - + - - + - - 15 - + + + - - - + + + - - - + - 16 + + + + + + + + + + + + + + +
Blocked Factorial Experiment
Block #1
Blocking std ID order 1 1 - - - - + + + + + + - - - - + 2 10 + - - + - - + + - - + - - + + 3 11 - + - + - + - - + - + - + - + 4 4 + + - - + - - - - + - - + + + 5 13 - - + + + - - - - + + + - - + 6 6 + - + - - + - - + - - + - + + 7 7 - + + - - - + + - - - + + - + 8 16 + + + + + + + + + + + + + + +
Block #2
9 9 - - - + + + - + - - - + + + -
10 2 + - - - - - - + + + + + + - - 11 3 - + - - - + + - - + + + - + - 12 12 + + - + + - + - + - - + - - - 13 5 - - + - + - + - + - + - + + - 14 14 + - + + - + + - - + - - + - - 15 15 - + + + - - - + + + - - - + - 16 8 + + + - + + - + - - + - - - -
Design of Experiments
Industrial Quality Consultants LLC page 29
Miscellaneous
Transformations
Handling Skewed Distributions Another data characteristic that is often encountered in the analysis of process variation studies is the skewed distribution. Such situations are often present when: 1. There is a positive relationship between the sample standard deviation (S) and average ( X ). 2. The standard deviation is more than 20 to 30 percent of the average.
3. The data range over more than an order of magnitude (i.e. XX
maxmin
is greater than 10).
4. The response must always be positive but can take on small values close to zero as well as
much larger values. Variance components are most frequently used to construct sampling plans that assume the
random variation in the data can be described by a normal distribution. It is, therefore, generally recommended that when a skewed distribution is encountered, the observations be transformed to another scale (e.g., log or square root) so that the variation can be more closely approximated by a normal distribution.
The power transformation is very useful in modeling skewed distributions because it contains
many well-known transformations as special cases. The transformation is given by: Y = XP where X is the original measurement scale and Y is the transformed scale. The parameter P
defines the transformation. Some examples follow: P Transformation 1 none 0.5 square root 0 log -1 reciprocal The value of P can be estimated from the data using either the procedure of Box and Cox (1964), also see Box, Hunter, and Hunter (1978), or by studying the relationship between the average and the standard deviation (Box, Hunter, and Hunter [1978]).
Design of Experiments
Industrial Quality Consultants LLC page 30
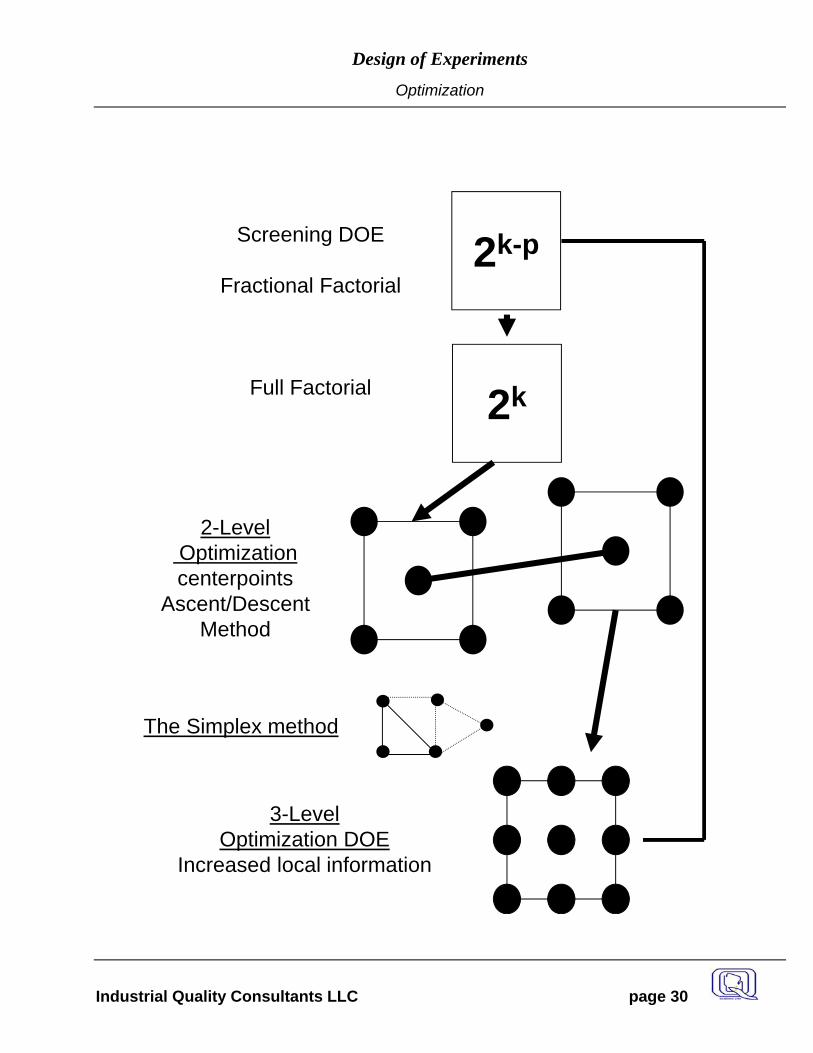
2k
2-LevelOptimizationcenterpoints
Ascent/DescentMethod
3-LevelOptimization DOE
Increased local information
2k-pScreening DOE
Fractional Factorial
Full Factorial
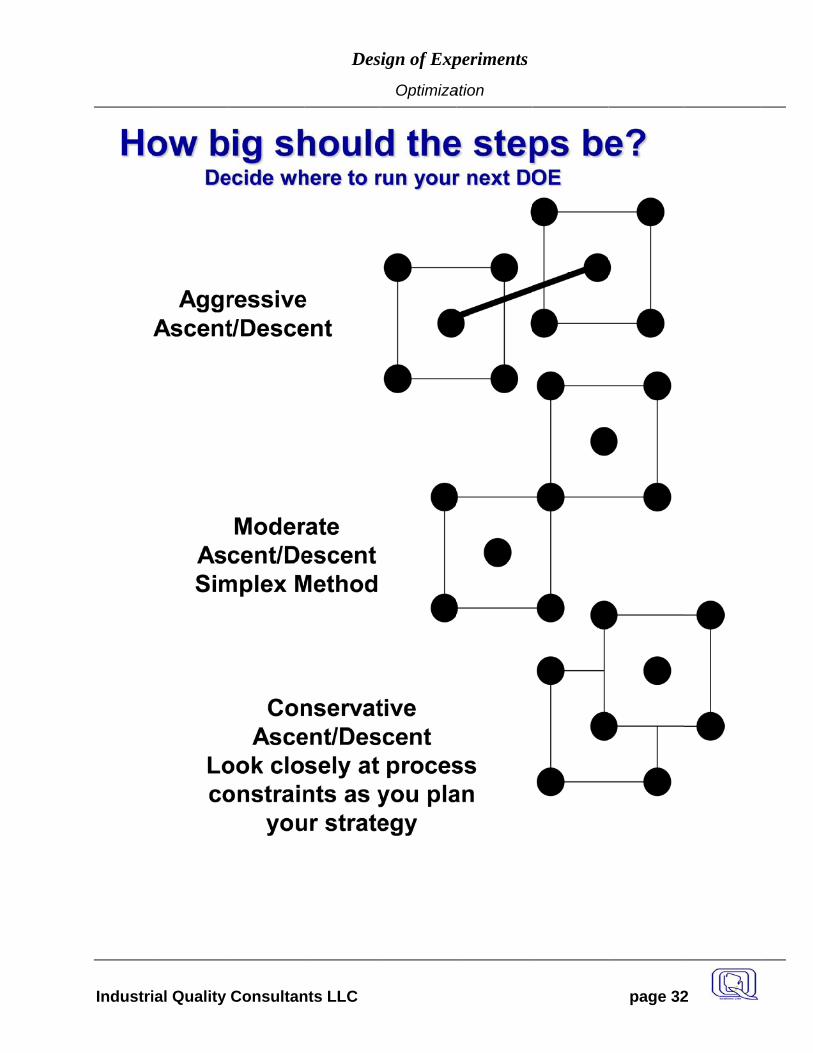
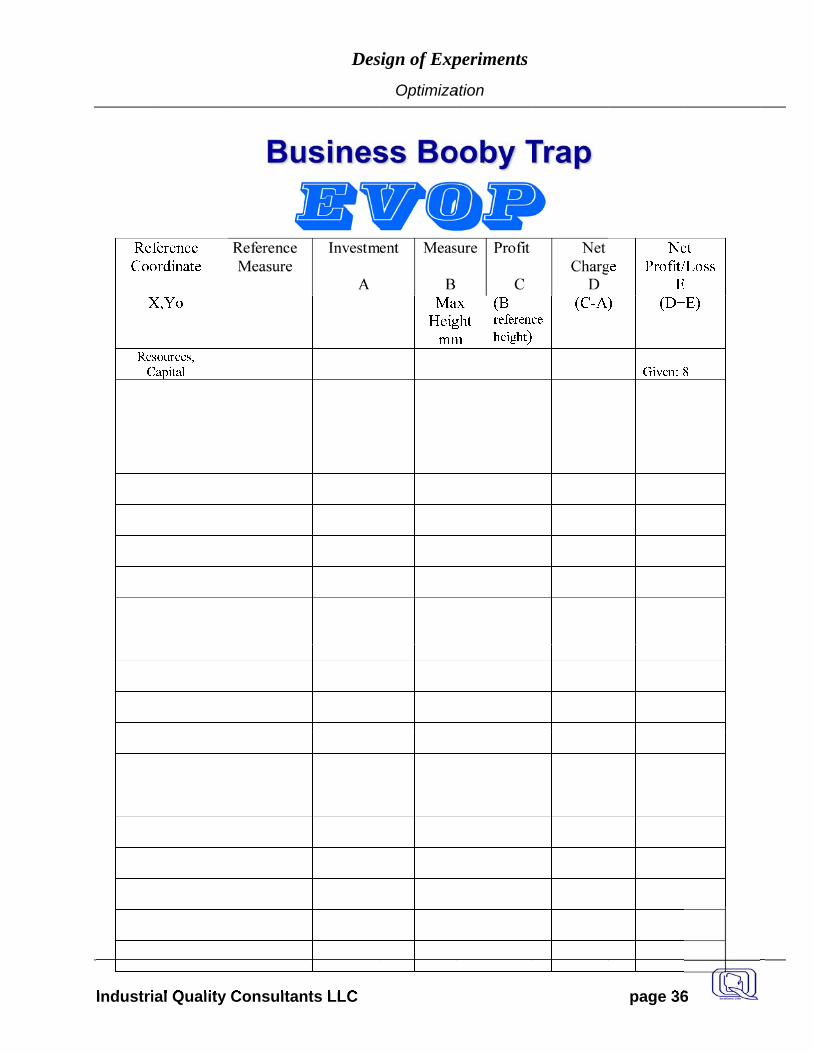
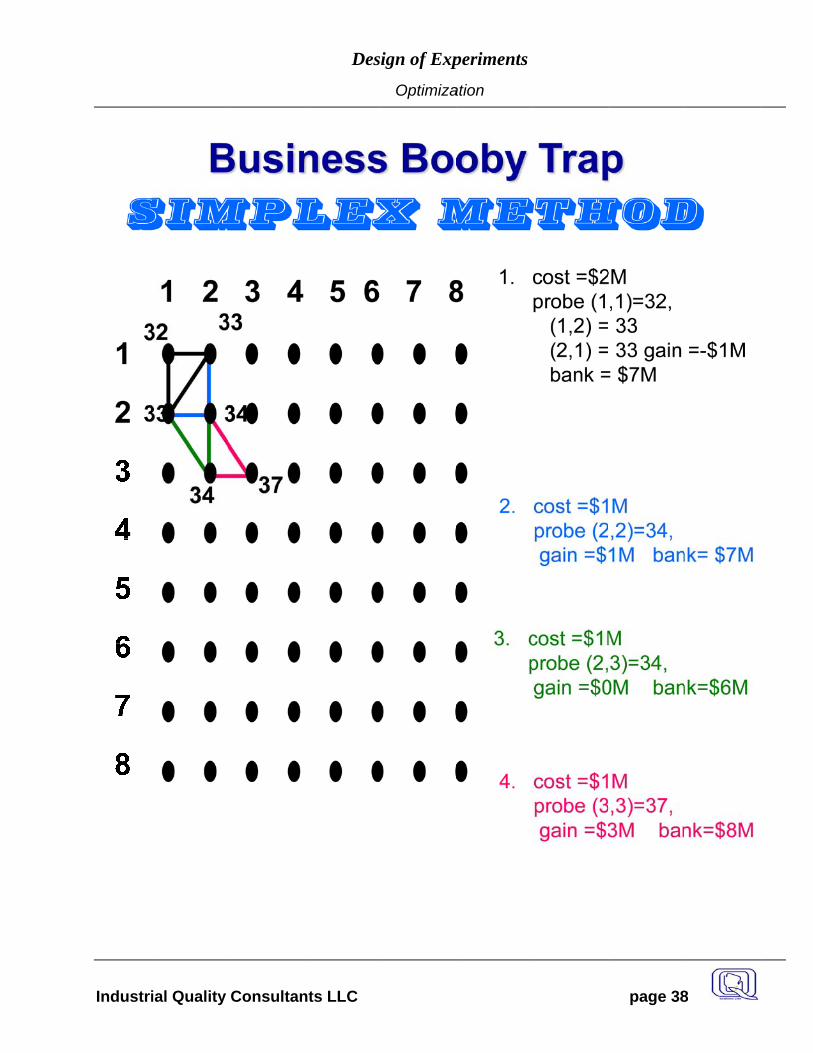
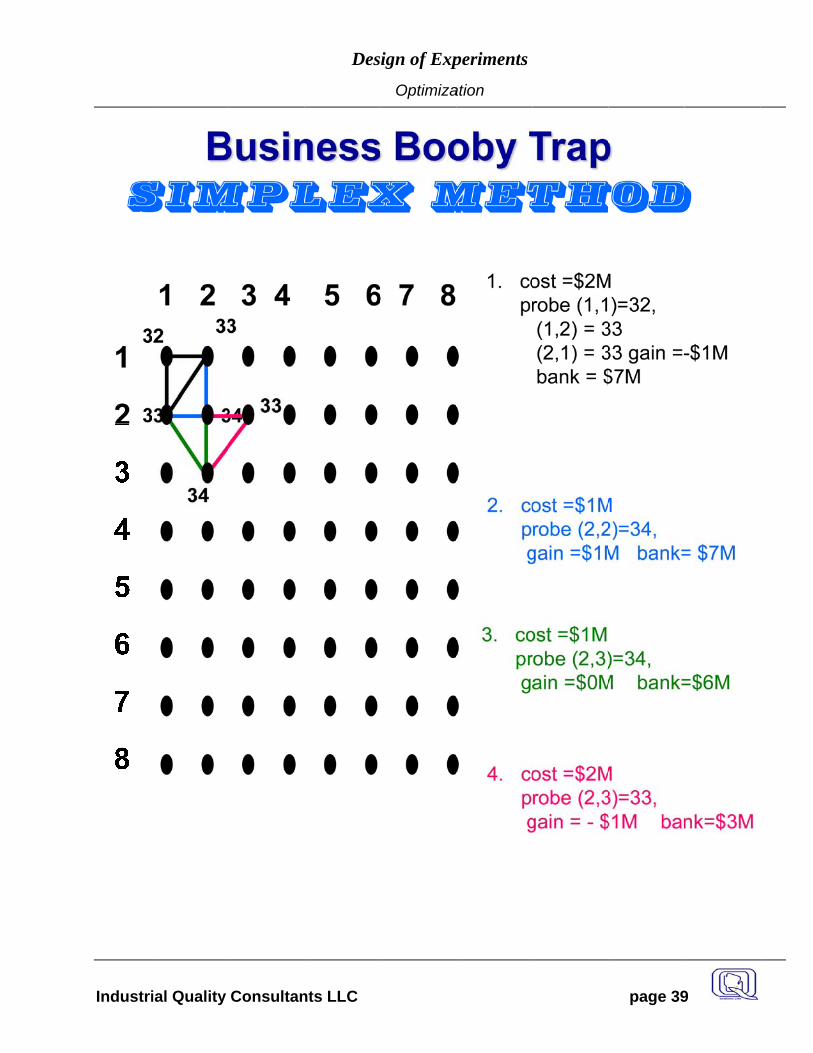
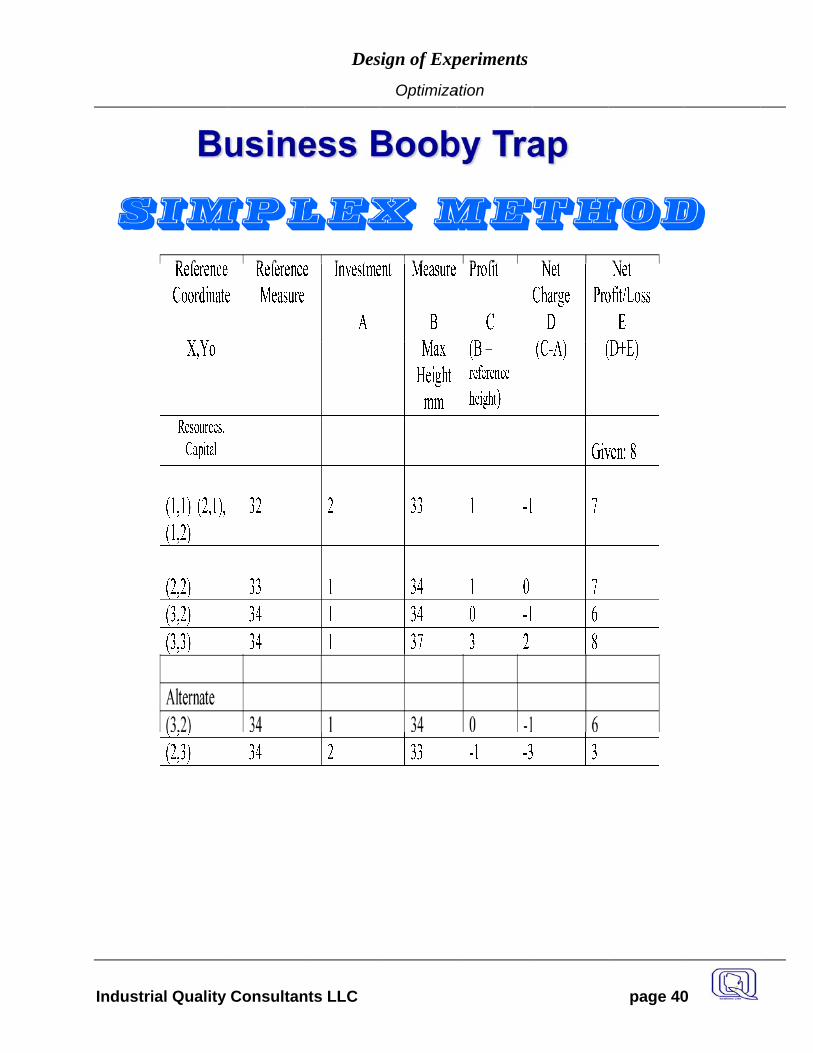
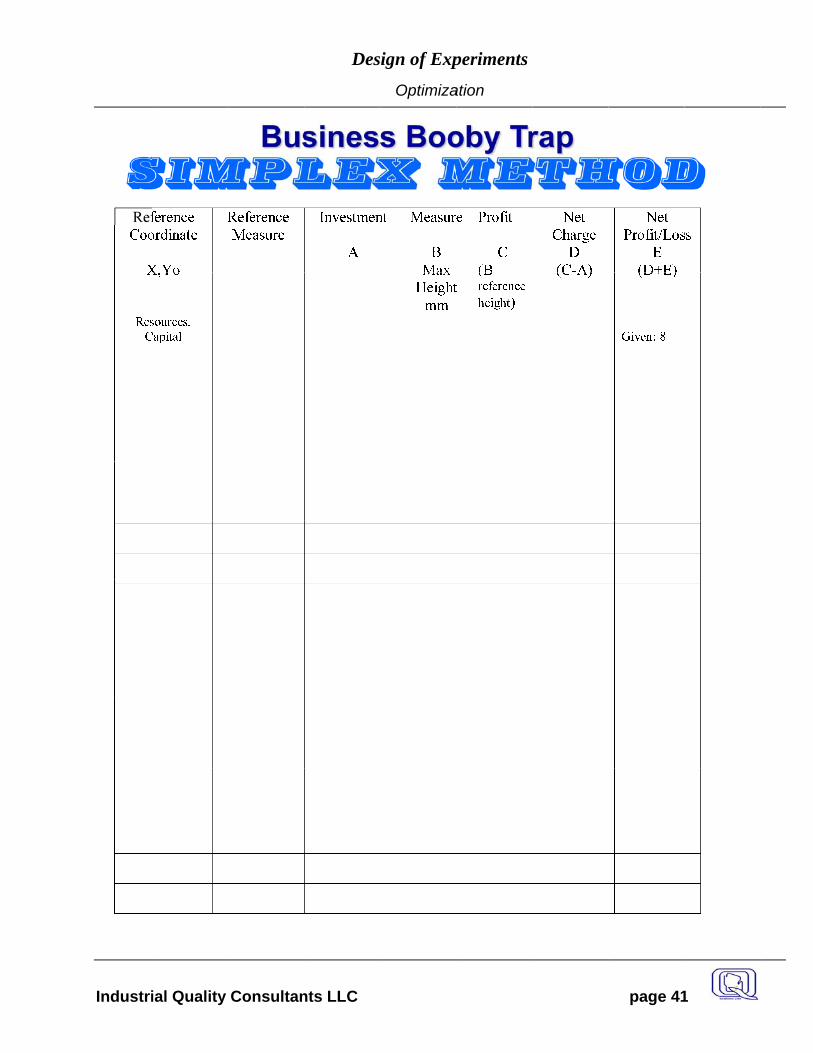
The Simplex method
Optimization
Industri
ial Quality Consultan
Des
nts LLC
ign of Exp
Optimiza
periments
ation
page 311
Industri
ial Quality Consultan
Des
nts LLC
ign of Exp
Optimiza
periments
ation
page 322
Industri
ial Quality Consultan
Des
nts LLC
ign of Exp
Optimiza
periments
ation
page 333
Industri
ial Quality Consultan
Des
nts LLC
ign of Exp
Optimiza
periments
ation
page 344
Industri
ial Quality Consultan
Des
nts LLC
ign of Exp
Optimiza
periments
ation
page 355
Industri
ial Quality Consultan
Des
nts LLC
ign of Exp
Optimiza
periments
ation
page 366
Industri
ial Quality Consultan
Des
nts LLC
ign of Exp
Optimiza
periments
ation
page 377
Industri
ial Quality Consultan
Des
nts LLC
ign of Exp
Optimiza
periments
ation
page 388
Industri
ial Quality Consultan
Des
nts LLC
ign of Exp
Optimiza
periments
ation
page 399
Industri
ial Quality Consultan
Des
nts LLC
ign of Exp
Optimiza
periments
ation
page 400
Industri
ial Quality Consultan
Des
nts LLC
ign of Exp
Optimiza
periments
ation
page 411
Industri
ial Quality Consultan
Des
nts LLC
ign of Exp
Optimiza
periments
ation
page 422
Design of Experiments
Industrial Quality Consultants LLC page 43
-1.5
-0.7
5
0
0.75
1.5
- 1 . 5
- 0 . 2 5
1- 2
- 1
0
1
2
3
Y
AB
P r e d i c t e d V a l u e s
2 - 31 - 20 - 1- 1 - 0- 2 - - 1
-1.5
-0.7
5
0
0.75
1.5
- 1 . 5
- 0 . 2 5
1- 2
- 1
0
1
2
3
Y
AB
P r e d i c t e d V a l u e s
2 - 31 - 20 - 1- 1 - 0- 2 - - 1
-1.5
-0.7
5
0
0.75
1.5
- 1 . 5
- 0 . 2 5
1- 8- 6- 4- 202468
Y
AB
P r e d i c t e d V a l u e s6 - 84 - 62 - 40 - 2- 2 - 0- 4 - - 2- 6 - - 4- 8 - - 6
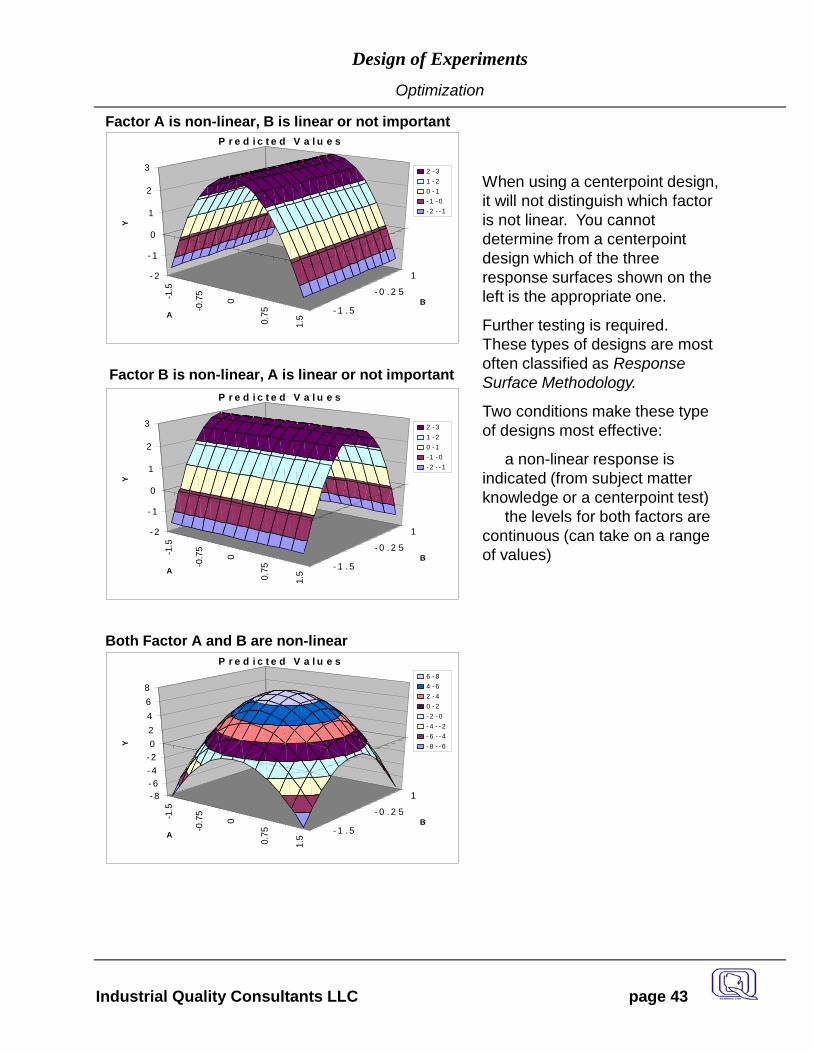
When using a centerpoint design, it will not distinguish which factor is not linear. You cannot determine from a centerpointdesign which of the three response surfaces shown on the left is the appropriate one.
Further testing is required.These types of designs are most often classified as Response Surface Methodology.
Two conditions make these type of designs most effective:
a non-linear response is indicated (from subject matter knowledge or a centerpoint test)
the levels for both factors are continuous (can take on a range of values)
Factor A is non-linear, B is linear or not important
Factor B is non-linear, A is linear or not important
Both Factor A and B are non-linear
Optimization
Industri
ial Quality Consultan
Des
nts LLC
ign of Exp
Optimiza
periments
ation
page 444
Design of Experiments
Industrial Quality Consultants LLC page 45
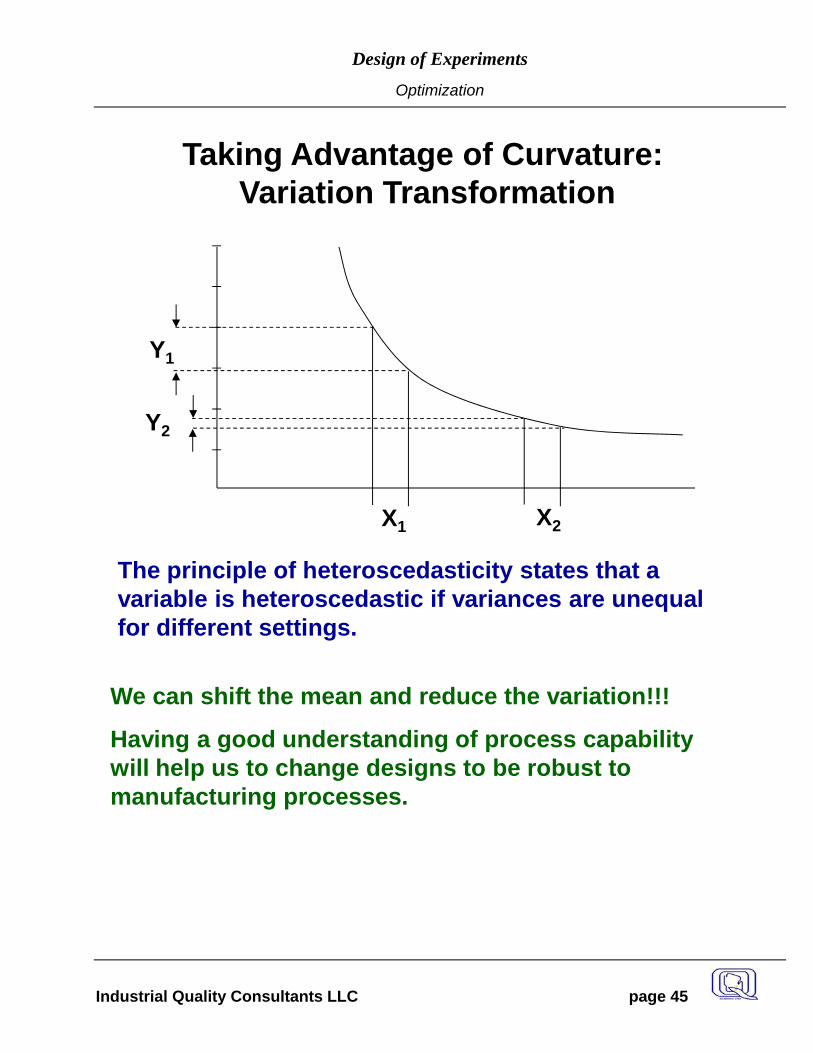
Taking Advantage of Curvature:Variation Transformation
The principle of heteroscedasticity states that a variable is heteroscedastic if variances are unequal for different settings.
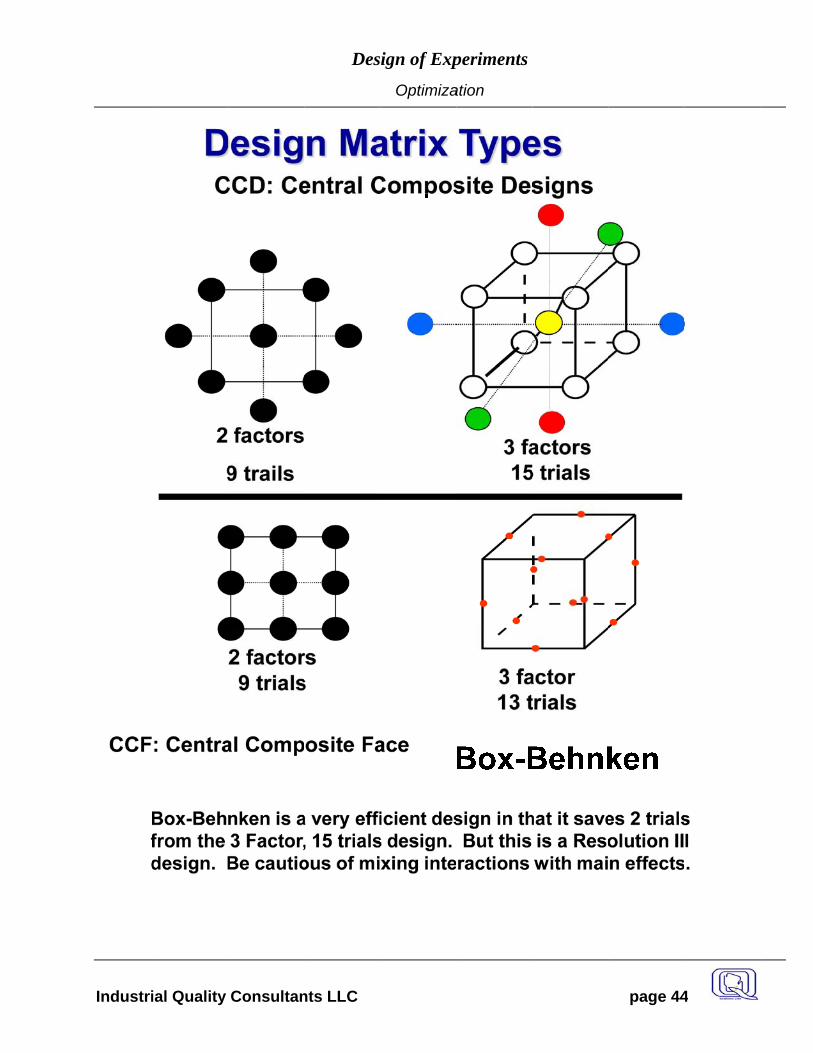
We can shift the mean and reduce the variation!!!
Having a good understanding of process capability will help us to change designs to be robust to manufacturing processes.
X1 X2
Y2
Y1
Optimization
Design of Experiments
Industrial Quality Consultants LLC page 46
Bibliography & References
• ASQC & Marcel Dekker, Quality Tree, Quality Engineering, ASQC Press, Vol. 5, Num 1. • Barker, TB., Quality By Experimental Design, Marcel Dekker, Inc, New York 1985. • Box, Hunter, Hunter, Statistics For Experiments, First Edition John Wiley & Sons, New York. • The learning process - pages 1-13. • One-at-a-time - pages 12-17. • Full Factorial - pages 306-334. • Fractional factorial - pages 374 - 400. • Box, Hunter, Hunter, Statistics For Experiments, 2nd Edition John Wiley & Sons, New York. • Box, G.E.P. Teaching Engineers Experimental Design with Paper Helicopter, Quality
Engineering, 1992 Vol. 4 Num 2. • Design-Ease Software, by Stat-Ease , Statistics Made Easy , (800-325-9816). • Finn, Lynda, Kramer, Tim, Raynard, Sue, Design of Experiments,: Shifting Quality
Improvement Into High Gear. Joiner Associates, Inc, Quality Progress Magazine by ASQC, 1987
• Gunter, Bert - Idea for the Funnel Test, @ John Deere & Company. 1990. • Gunter, Bert, Statistically Designed Experiments (5 part series), Quality Progress, Dec 1989,
Feb 1990, April 1990, June 1990, Aug 1990. • Hladik, Lori J., Experimental Design Fringe Benefits, Quality Magazine by ASQC, April 1990. • Hendrix, D.C., Sixteen Ways to Mess Up An Experiment, ChemTech Magazine, April 1985. • Kerber, M.W., An analysis of the Catapult, Final Report, EM499, Spring 1990. • Knowtton, Jeff, Kepplinger, Ren, The Exerpimentation Process, Quality Progress by ASQC,
February 1993. • Nybeck, William, Design For Quality, John Deere Dubuque Works, 1990. • Schubert, Kerber, Schmidt, The Catapult Problem: Enhanced Engineering Modeling Using
Experimental Design, Quality Engineering, ASQC Press, Vol. 4 Number 4, 1992.