Embed Size (px)
Citation preview

1'. Report No. 2. Government Accession No.
FHWA/TX-78/07+l96-lF
4. Title and Subtitle
DESIGN OF REINFORCEMENT FOR NOTCHED ENDS OF PRESTRESSED CONCRETE GIRDERS
7. Author' 5)
Gangadharan Menon and Richard W. Furlong
9. Performing Organization Name and Address
TECHNICAL REPORT STANDARD TITLE PAGE
3. Recipient's Catalog No.
5. Report Dote
Augus t 1977 6. Performing Organi zation Code
B. Performing Organi zotion Report No.
Research Report 196-lF
10. Work Unit No.
11. Contract or Grant No.
Research Study 3-5-76-196
Center for Transportation Research The University of Texas at Austin Austin, Texas 78712
13. Type of Report and Period Covered ~~----------~--~~---------------------------4
12. Sponsoring Agency Name and Addreu
Texas State Deparbment of Highways and Public Transportation; Transportation Planning Division
P. O. Box 5051
Final
14. Spon.oring Agency Code
Austin, Texas 78763 15. Supplementary Notes
study conducted in cooperation with the U. S. Deparbment of Transportation, Federal Highway Administration. Research Study Title: "Optimum Reinforcement for Notched Ends of Prestressed Concrete Girders"
16. Abstract
This study was intended to analyze the shear strength of the notched ends of prestressed concrete girders and to evaluate the ultimate shear capacity by testing a model with reinforcing details simpler than those currently adopted in practice. Various discrete element analyses by a computer program showed that it is possible to identify the most highly stressed regions of an end block and also to predict a likely crack pattern that would occur before failure.
One specimen with two different end block details was tested to failure. The failure of the specimen did not occur at either notch, and the notch capacity with uncongested reinforcement was shown to be adequate for the intended load. The end block with the provision of a hanger strap assembly and reinforcement welded to the bearing plate behaved well during the test. As concluded from the observation of crack widths, such a design with hanger straps seems to possess a higher degree of serviceability than a design based on the provision of large web plates embedded at the notched end.
A design procedure derived from two potential failure modes has been suggested. The two failure modes involved are (a) a shear friction separation parallel to the inclined hanger strap reinforcement and (b) a shear compression separation from the corner of the notch into the flexural compression zone of the end block. An example design for the end block of a standard highway bridge stringer has been given to illustrate the design procedure.
17. Key Word.
prestressed concrete, girder, notched ends, shear strength, reinforcement, hanger strap assembly
lB. Distribution Statement
No restrictions. This document is available to the public through the National Technical Information Service, Springfield, Virginia 22161.
19. Security Clallif. (of thi. report) 20. Security Clouif. (of thi s page) 21. No. of Page. 22. Price
Unc lass ified Unc lass ified 166
Form DOT F 1700.7 le-69)
•
DESIGN OF REINFORCEMENT FOR NOTCHED ENDS OF PRESTRESSED CONCRETE GIRDERS
by
Gangadharan Menon Richard W. Furlong
Research Report Number 196-1F
Optimum Reinforcement for Notched Ends of Prestressed Concrete Girders
Research Project 3-5-76-196
conducted for
Texas State Department of Highways and Public Transport3tion
in cooperation with U. S. Department of Transportation
Federal Highway Administration
by the
CENTER FOR TRANSPORTATION RESEARCH
BUREAU OF ENGINEERING RESEARCH
THE UNIVERSITY OF TEXAS AT AUSTIN
August 1977

The contents of this report reflect the views of the authors, who are responsible for the facts and the accuracy of the data presented herein. The contents do not necessarily reflect the official views or policies of the Federal Highway Administration. This report does not constitute a standard, specification, or regulation.
There was no invention or discovery conceived or first actually reduced to practice in the course of or under this contract, including any art, method, process, machine, manufacture, design or composition of matter, or any new and useful improvement thereof, or any variety of plant which is or may be patentable under the patent laws of the United States of America or any foreign country.
ii
..
ABSTRACT
This study was intended to analyze the shear strength of the notched ends
of prestressed concrete girders and to evaluate the ultimate shear capacity by
testing a model with reinforcing details simpler than those currently adopted
in practice. Various discrete element analyses by a computer program showed
that it is possible to identify the most highly stressed regions of an end
block and also to predict a likely crack pattern that would occur before
failure.
One specimen with two different end block details was tested to failure.
The failure of the specimen did not occur at either notch, and the notch
capacity with uncongested reinforcement was shown to be adequate for the
intended load. The end block with the provision of a hanger strap assembly
and reinforcement welded to the bearing plate behaved well during the test.
As concluded from the observation of crack widths, such a design with hanger
straps seems to possess a higher degree of serviceability than a design based
on the provision of large web plates embedded at the notched end.
A design procedure derived from two potential failure modes has been
suggested. The two failure modes involved are (a) a shear friction separation
parallel to the inclined hanger strap reinforcement and (b) a shear compres
sion separation from the corner of the notch into the flexural compression
zone of the end block. An example design for the end block of a standard
highway bridge stringer has been given to illustrate the design procedure.
iii


..
SUMMARY
Standard size prestressed concrete bridge beams can span across an
opening no greater than about 130 ft. The flexibility of deformations would
be excessive if the largest girders were supported at greater distances.
Consequently the maximum width of opening across which the girders can be used
would be 130 ft unless the girder support points could be extended an addi
tional distance outward from the limits of the opening.
Girders can be extended outward as suggested in Fig A in order to make
possible an opening more than 160 ft wide
without changing the basic standard
girder configuration. The sketch of
Fig A does show that a notch or shelf
must be used at the connection between
girders.
Roadway Surface
130'
160' to 170' maximum .. I FIGURE A
Extra reinforcement must be placed in the region of the notched end in
order to maintain shear capacity after half the depth of the girder is removed
at the notch. The analysis and physical tests reported here indicate that
only two principal types of reinforcement must be added at the notch. In
addition to stirrups that are needed even without a notch, a strap-type hanger
mechanism plus supplementary longitudinal steel for maintaining shear friction
at the throat of the notch can be used effectively without congesting the
notch region. Concrete is not difficult to place if the accumulated rein
forcement can be kept uncongested.
Design procedures and an example problem are presented in order to
implement recommendations derived from the project.
v

}
•

, •
IMPLEMENTATION STATEMENT
The research study reported herein revealed that there are only two major
failure mechanisms that need to be considered for the proportioning of extra
reinforcement in notched ends of prestressed concrete beams. Simple and
direct design procedures are expressed in the form of a strength equation
which expresses resistance to the formation of a diagonal shear failure and
another equation for resistance to a shear friction failure at the notch.
An analytic effort was developed which required the use of a discrete
element model and a computer program for predicting crack propagation and
probable load paths. The analysis was considered more sophisticated and no
more accurate than the direct formulation of strength in the failure mechanism
that describes diagonal cracking or that describes shear friction at the
notch.
Notched ends can be reinforced for adequate strength and for control of
cracking at service loads by means of longitudinal bars welded to a bearing
plate at the notch and by a diagonal strap hanger mechanism, each of which
must be used in addition to the "normal" quantity of stirrups that would be
used in the absence of the notch. The extra reinforcement does not create
unusual congestion in the region of the notch.
Notched end beams can be fabricated at costs which are insignificantly
greater than costs associated with beams that are not notched. Clear span
openings for bridge prestressed stringer composite beam structures can be
extended from 130 ft to 160 to 170 ft without requiring the creation of new,
deeper forms for larger standard beam cross sections.
vii

-.
"'..
,.
. •
TABLE OF CONTENTS
ABSTRACT
SUMMARY
IMPLEMENTATION STATEMENT
CHAPTER 1. INTRODUCTION
1.1 General . . . . . . 1.2 Objective of Study 1.3 Scope of Work 1.4 Previous Studies . . . .
1.4.1 Work done by Ali A. Hamoudi et al 1.4.2 Work done by M. J. N. Priestley . 1.4.3 Work done by M. P. Werner and W. H. 1.4.4 Work done by J. R. Gaston and L. B.
CHAPTER 2. PRELIMINARY STUDY
2.1 Mechanism of Shear Failure •••.•..• 2.2 Mechanism of Shear Failure at Notched End
2.2.1 Distribution of internal shears. 2.2.2 Effect of prestressing
2.3 Load Paths at Notched End Region ..•.
CHAPTER 3. THE SPECIMEN
3.1 Design of the Specimen 3.2 Scale of the Model .. 3.3 Design of the Model 3.4 Prestressing .•• 3.5 Concrete ...•• 3.6 Release of Strands
CHAPTER 4. SPECIMEN LOAD TEST
4.1 General ..•• 4.2 First Stage •••• 4.3 Second Stage
ix
. . . .
. . .
Dilger Kriz
iii
v
vii
1 1 4 4 4 5 5 5
9 9 9
11 14
23 28 28 31 36 36
37 37 42
x
CHAPTER 5. DISCUSSION OF TEST RESULTS
5.1 General · · · · · 5.2 Deflections · · · · · · · · 5.3 Crack Widths . · · · · · · · · · · 5.4 Strains 5.4.1 Steel strains · · · · · 5.4.2 Concrete strains · · ·
CHAPTER 6. SHEAR STRENGTH OF NOTCHED END
6.1 Shear Friction . · · · · · · · · · 6.1.1 The concept · · · · · 6.1.2 Application to the notched end 6.2 Diagonal Tension ·
6.2.1 Mode of failure · · · · · · · 6.2.2 Length and direction of crack 6.2.3 Neutral axis depth · · · · 6.2.4 Calculation of capacity R 6.2.5 Effect of neutral axis depth 6.2.6 Effect of d
6.3 Design Procedure r · · · · · · 6.4 Computer Methods · · · ·
CHAPTER 7. RECOMMENDATIONS
7.1 7.2 7.3
Analytical Study . . • • • • • Test Study • • • • . • • • • Design of Notched End Reinforcement 7.3.1 Step 1 7.3.2 Step2
· · · · · · · · · · · · · ·
· · · · · · · · · · · · ·
· · · · · · · · · · · · · ·
· ·
REFERENCES . . . . . . . . . . . . . . . . . . . . . . APPENDICES
Appendix A Appendix B Appendix C Appendix D Appendix E Appendix F Appendix G Appendix H Appendix I
. . . . . . . . . . . . . . . . . .
. . . . . . . . .
· · · · · · · · ·
· · · · · · · · · ·
47 47 52 52 52 55
57 57 57 60 60 61 61 64 67 67 69 75
83 83 84 84 84
85
89 93
101 107 119 125 129 143 149
.r
•
, •

•
•
a
A cr
c
C
d cr
d
E c
E s
F
f I C
f'. C1
f p
F P
f ps
L
N
NOTATION
Distance from the vertical face of a notch to the centroid of the reaction at the notched end
Area of a shear plane
Area of tension reinforcement necessary to insure enough normal force to develop shear friction strength
Distance from compression face of a member to its neutral axis
Compression force on a beam cross section
Horizontal projection of length of a diagonal shear compression crack
Distance from compression face of a member to the centroid of tensile forces on a cross section
Modulus of elasticity of concrete
Modulus of elasticity of steel
Friction force
Compression ultimate stress of standard concrete cylinders
Compression ultimate stress of concrete when prestress strands are released
Stress created by prestress force
Force in prestress strand
Stress developed in strand from end of member to the shear friction crack
Distance between supports of a simply supported beam
Force normal (perpendicular) to a cross section
N. Specific component i of normal force N 1
xi
xii
n Modular ratio between steel and concrete stiffness E IE s c
P Force applied normal to a shear friction crack u
R Reaction or force applied at the reaction of a notched end beam
s Spacing of reinforcement
T Tension force in reinforcement
v Shear stress
V Vertical shear capacity attributed to aggregate interlock ag
v Shear stress capacity of concrete c
V Vertical shear force capacity of concrete cz
Vertical shear force attributed to dowel action of longitudinal reinforcement
V s
Vertical shear force attributed to stirrups
V Ultimate shear force capacity u
v Ultimate shear stress capacity u
Angle between horizontal axis and diagonal shear compression crack
~ Vertical displacement
~ cc Deformation of extreme fibers of concrete across
~st Deformation of tensile reinforcement across
~. Sliding friction coefficient
~' Modified sliding friction coefficient
¢ Capacity reduction factor
d cr
d cr length
length
.1
CHAPTER 1. INTRODUCTION
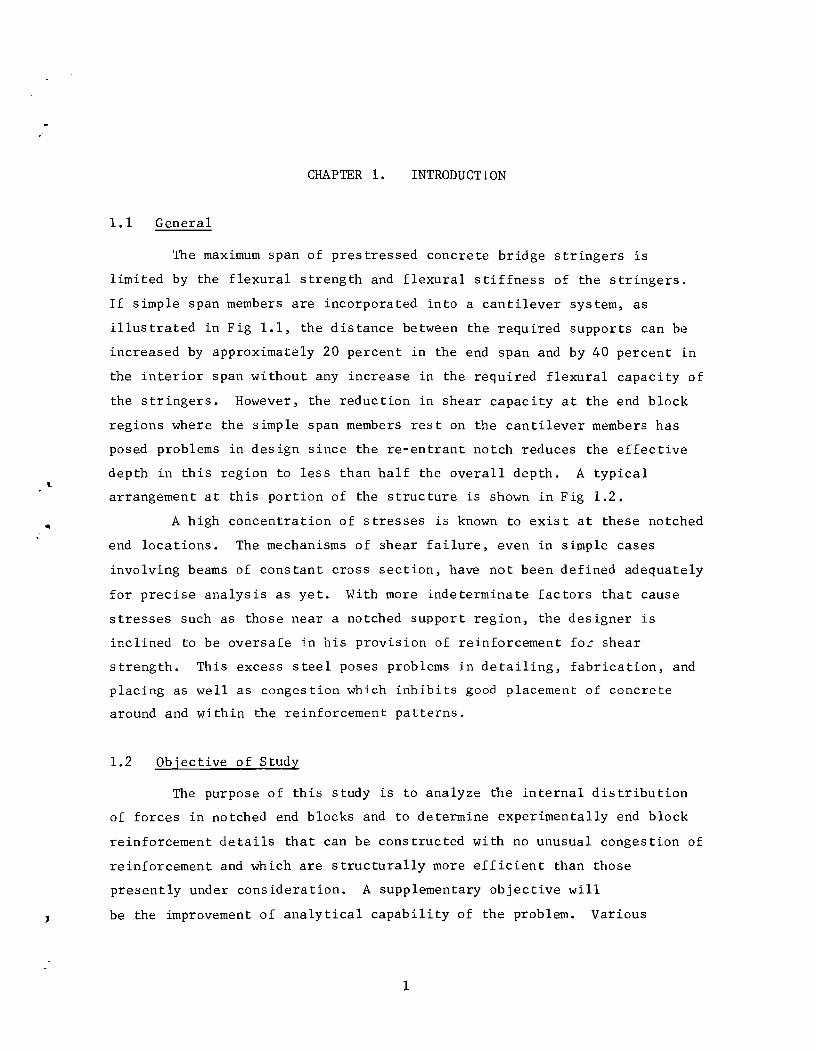
1.1 General
The maximum span of prestressed concrete bridge stringers is
limited by the flexural strength and flexural stiffness of the stringers.
If simple span members are incorporated into a cantilever system, as
illustrated in Fig 1.1, the distance between the required supports can be
increased by approximately 20 percent in the end span and by 40 percent in
the interior span without any increase in the required flexural capacity of
the stringers. However, the reduction in shear capacity at the end block
regions where the simple span members rest on the cantilever members has
posed problems in design since the re-entrant notch reduces the effective
depth in this region to less than half the overall depth. A typical
arrangement at this portion of the structure is shown in Fig 1.2.
A high concentration of stresses is known to exist at these notched
end locations. The mechanisms of shear failure, even in simple cases
involving beams of constant cross section, have not been defined adequately
for precise analysis as yet. With more indeterminate factors that cause
stresses such as those near a notched support region, the designer is
inclined to be oversafe in his provision of reinforcement fo: shear
strength. This excess steel poses problems in detailing, fabrication, and
placing as well as congestion which inhibits good placement of concrete
around and within the reinforcement patterns.
1.2 Objective of Study
The purpose of this study is to analyze the internal distribution
of forces in notched end blocks and to determine experimentally end block
reinforcement details that can be constructed with no unusual congestion of
reinforcement and which are structurally more efficient than those
presently under consideration. A supplementary objective will
be the improvement of analytical capability of the problem. Various
1

2
STANDARD PRECAST GIRDER FORMS / " / - rot .. - - - - ,.----..:-;.....-----?., - - -- --
..... ---------"""'----r r-5 ----I ,---I I I I I I I I
Simple Span JJ,. Simple Span ,j,)",
M aximu
Maximum
M ment
V:I~ ~ L _I ~
I Defle~tion
Maximum Moment
Simple span Moments
Simple span Deflection
Cantilever Sys tem
'------L----~r--.~~~-----&---~~~-r----Moments
Contilever Framinq
1-2 L 1-4 L
Maximum Deflectio (s ligh t ly more than 6. )
Fig 1.1. Cantilever and simple framing.
Cantilever System
Deflections
'.
..

3
Elastomer
1.2. Arrangements at notched end.
,

4
analytical models of the end block will be tried for a computer aided
study,
1.3 Scope of Work
The scope of the work on this investigation consists of
(a) a preliminary study of stress distribution at the notched
end with the aid of an available computer program for
plane frames,
(b) selection of two types of design details based on the
initial appraisal of the problem and on the above study,
(c) design of the specimen for testing in the laboratory,
(d) establishing the degree of efficiency of computer aided
analysis, and
(e) suggestion of a simple design procedure for notched end
reinforcement.
1.4 Previous Studies
Very few reports have been published regarding studies of problems
connected with notched end stress conditions. The following brief summary
of some of the relevant works published in this area will help describe
the problem.
1.4.1 Work done by Ali A. Hamoudi et al (1)
The state of stress near the root of the notched end was derived on
the basis of an elastic equilibrium plane stress analysis. Calculated
stresses were compared with experimental data. Eight prestressed concrete
T-beams were fabricated and tested. Spanning 30 ft each, these beams were
pretensioned with l/2-in. strands. Web reinforcement at notched ends
consisted of (1) l/2-in.-diameter Stressteel (145 ksi) post-tensioned
bars, (2) vertical and horizontal rebar stirrups, and (3) rebars inclined
at 300 to the horizontal. The authors concluded that prestressing the
notched ends with inclined high strength steel provided a satisfactory
method for web reinforcement and furthermore prevented shear cracking in
this area at working loads.
"
5
1.4.2 Work done by M. J. N. Priestley (12)
Tests were carried out on four specimens in the Central Labora
tories, New Zealand, to check the shear strength of the notched ends of
beams which were to be built in an overpass. All specimens were post
tensioned. Shear reinforcement at notched ends consisted of vertical
stirrups closely spaced and light horizontal stirrups. None of the
specimens failed in shear at the notched end. However, the notched ends
were found to possess capacities much greater than their design strength.
Though cracking occurred at low levels of load, the crack widths remained
very small until the flexural capacity of the beams was reached. No design
method was presented in this report. The crack pattern and stress contours
of the specimens are suggestive of a truss action by which load is trans
ferred from the notched end to the full section of the beam.
1.4.3 Work done by M. P. Werner and W. H. Dilger (14)
This study was aimed at finding (1) the shear force required to
form a crack at the re-entrant corner of the notched end and (2) whether
the cracking shear could be taken as the contribution of concrete to total
shear strength. Based on a finite element analysis and experimental data
from five beams tested, the authors suggested that the shear cracking load
can be predicted with reasonable accuracy and that this could be taken as
the concrete strength in shear. All the beams tested were post-tensioned
and it is possible that anchor plates could have had an effect on the
stress distribution in the end zone, a condition which does not exist in
pretensioned beams.
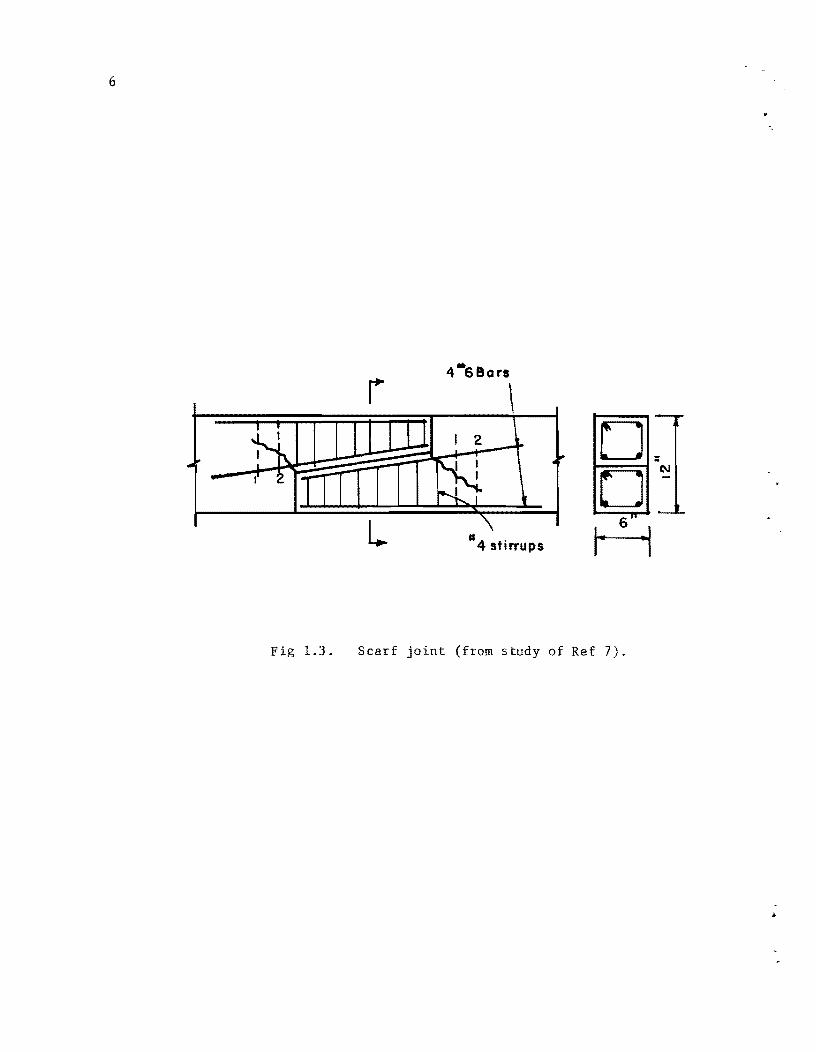
1.4.4 Work done by J. R. Gaston and L. B. Kriz (7)
A similar problem of scarf joints used in precast frames for
buildings was investigated at the Research and Development Laboratories of
the Portland Cement Association. These tests were conducted mainly for
studying flexural behavior, but the mode of failure reported is consistent
with what could be expected in the shear problem of girders with notched
ends, i.e., a failure initiated from cracking at a re-entrant corner. (See
Fig 1.3). These tests were conducted for connections (a) without stir
rups 1 and 2, (b) with stirrup 1 only, and (c) with stirrups 1 and 2. In
6
.. 4 6ears r
2 0 =
0 N -
L 6" -4 . H stirrUPS
Fig 1.3. Scarf joint (from study of Ref 7).

the first two cases the inclined 4F6 bars were very short and in the third
case these were well anchored. The capacities were found to be 25 percent
higher and 70 percent higher than (a) for (b) and (c) respectively. The
tests clearly established the importance of providing stirrups that cross
potential cracks, and also illustrated the role of anchorage requirements.
7
1 1 1 1 1 1 1 1 1 1 1 1 1 1 1 1 1 1 1 1 1 1 1 1 1 1 1 1 1 1 1 1 1 1 1 1 1 1 1 1 1 1 1 1 1 1 1 1 1 1 1 1 1 1 1 1 1 1 1 1 1 1 1 1
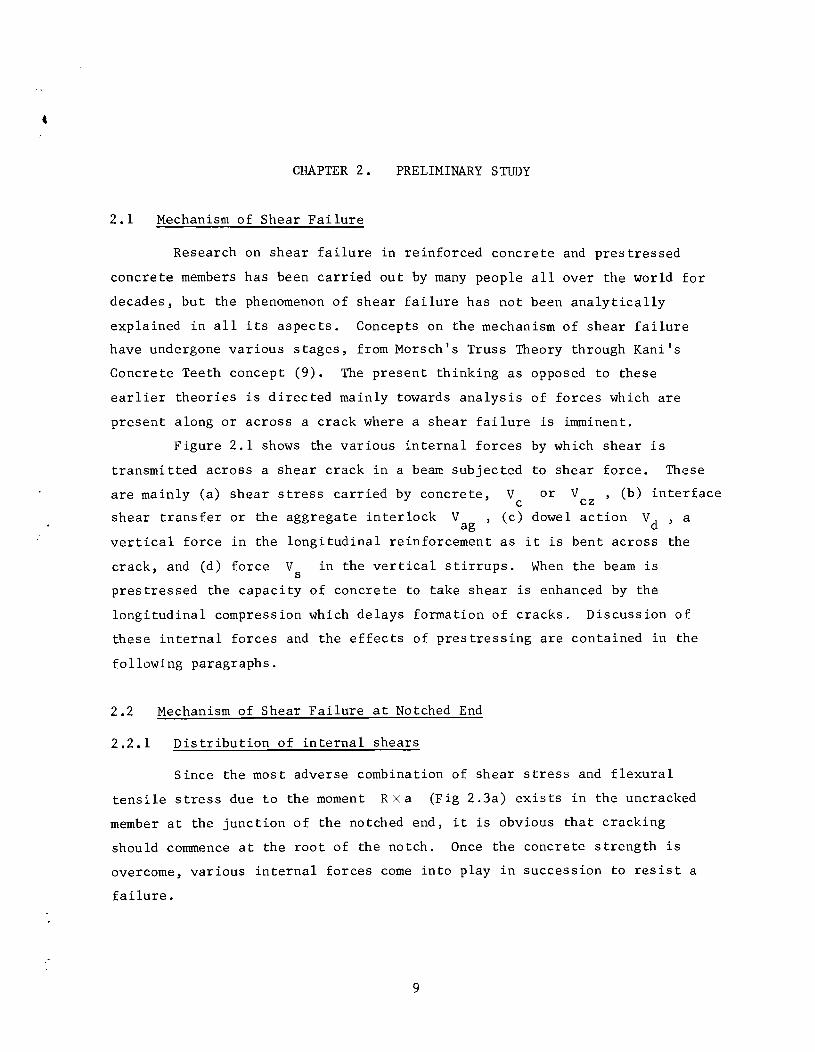
CHAPTER 2. PRELIMINARY STUDY
2.1 Mechanism of Shear Failure
Research on shear failure in reinforced concrete and prestressed
concrete members has been carried out by many people allover the world for
decades, but the phenomenon of shear failure has not been analytically
explained in all its aspects. Concepts on the mechanism of shear failure
have undergone various stages, from Morsch's Truss Theory through Kani's
Concrete Teeth concept (9). The present thinking as opposed to these
earlier theories is directed mainly towards analysis of forces which are
present along or across a crack where a shear failure is imminent.
Figure 2.1 shows the various internal forces by which shear is
transmitted across a shear crack in a beam subjected to shear force. These
are mainly (a) shear stress carried by concrete, V or V , (b) interface c cz
shear transfer or ilie aggregate interlock V , (c) dowel action Vd , a ag vertical force in ilie longitudinal reinforcement as it is bent across the
crack, and (d) force V in the vertical stirrups. When the beam is s
prestressed the capacity of concrete to take shear is enhanced by the
longitudinal compression which delays formation of cracks. Discussion of
these internal forces and the effects of prestressing are contained in the
following paragraphs.
2.2 Mechanism of Shear Failure at Notched End
2.2.1 Distribution of internal shears
Since the most adverse combination of shear stress and flexural
tensile stress due to the moment Rxa (Fig 2.3a) exists in the uncracked
member at the junction of the notched end, it is obvious that cracking
should commence at the root of the notch. Once the concrete strength is
overcome, various internal forces come into play in succession to resist a
failure.
9

10
v
Fig 2.1. Forces at an inclined crack.
11
The distribution of internal forces as they occur in a reinforced
beam with web reinforcement has been discussed extensively in the report by
the ASCE-ACI Committee 426 on Shear and Diagonal Tension (8). In the case
of a prestressed concrete beam with shear reinforcement, the distribution
of internal shears can be described at various load stages as follows.
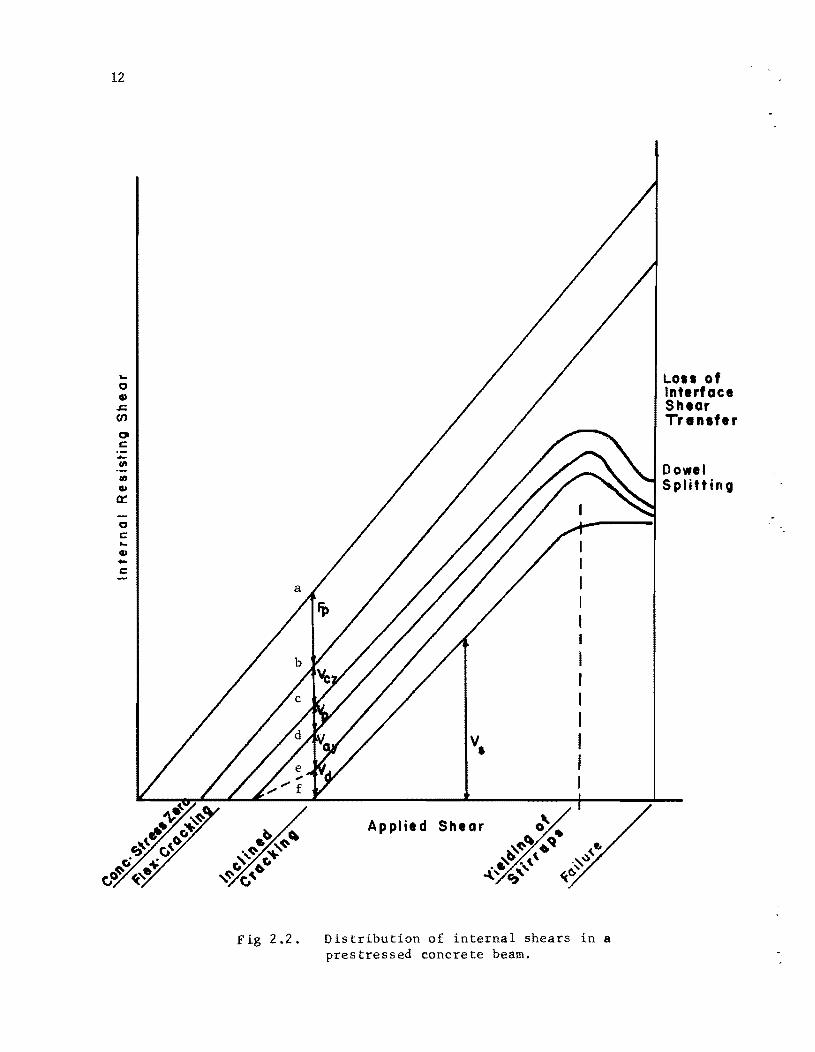
The internal shear can be related to the applied shear diagram
matically as shown in Fig 2.2. As the external loading applied to the beam
is increased, the precompressed concrete resists the tension that is
induced below the neutral axis of the cross section until the load is large
enough to nullify the compressive stress at the bottom fiber. This stage
is represented by the zone ab of Fig 2.2. Thereafter. the shear is
carried by concrete alone by virtue of its shear strength v cz until the
occurrence of flexural cracking. From this stage onwards the behavior is
identical to a reinforced concrete beam, except for the effects of the
vertical component V of the prestress in draped strands. Between p
flexural cracking and the inclined cracking, shear is resisted by the
concrete V ,the interface shear transfer V ,the dowel action Vd cz ay
and the vertical component of the prestressing forces. After formation of
inclined cracks the shear reinforcement carries part of the shear, V s
As
the cracks widen the interface shear transfer decreases forcing Vcz ' Vd '
and V to increase until failure occurs either by compression failure of s
concrete or splitting failure of the longitudinal reinforcement or yielding
of shear reinforcement.
2.2.2 Effect of prestressing
As can be seen from the distribution of internal shears, the
horizontal component of the prestressing force delays the flexural cracking
and the vertical component delays the inclined cracking. In addition to
this the compression prestress forces a shear crack into a more horizontal
orientation resulting in longer crack lengths than in a reinforced concrete
beam. This is advantageous because with an increased crack length more
vertical stirrups share the shear resistance.
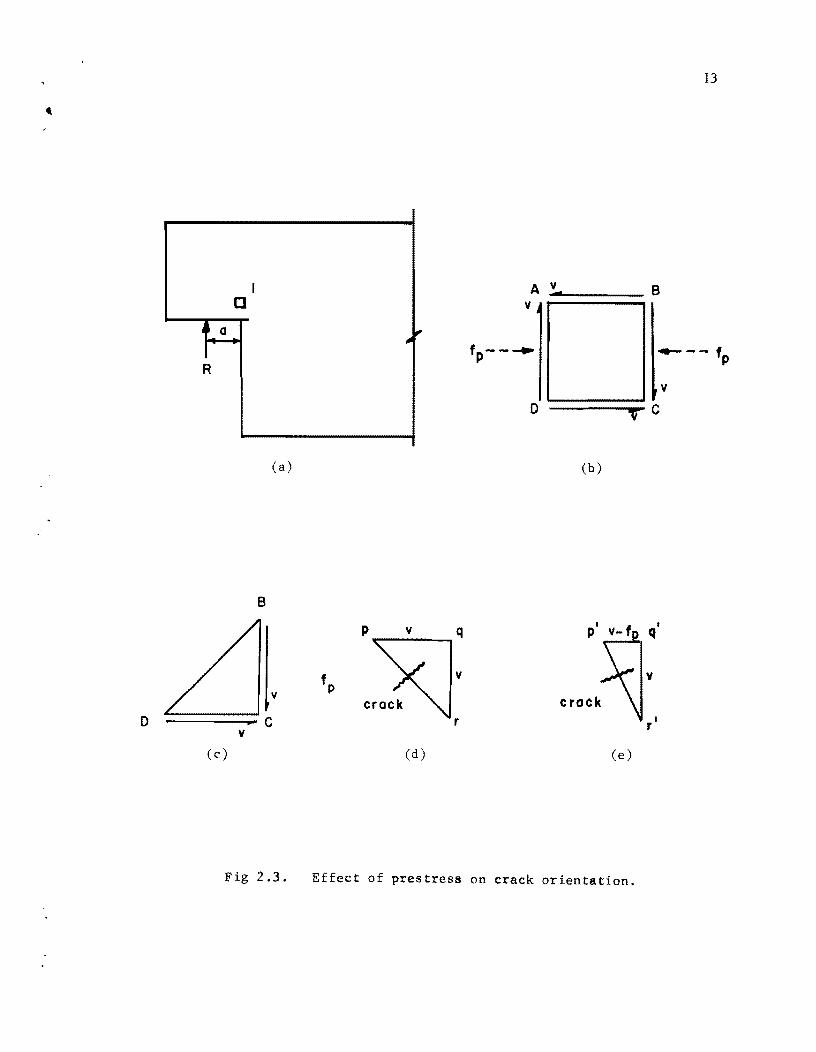
The flat orientation of cracks when there is prestressing can be
explained by analyzing the stress conditions on an element as shown in
Fig 2.3. At the neutral axis the forces caused by applied bending moments
12
... 0 ., s:. (f)
CJI c -fit I/)
OJ a:
0 c ... ., -c -
Fig 2.2.
Applied Shear
Distribution of internal shears in a prestressed concrete beam.
Loss of Interface Shear Transfer
Dowel Splittino
".
I []
, a ~
R
(a)
B
v
o =====;;::. c y
(c)
Fig 2.3.
A v ... v
.. ~ f -- ....... p
0 V
(b)
I
P
crack
(d) (e)
Effect of prestress on crack orientation.
13
B
.....--- f
c
I q
v
I r
v
P
14
are zero, and the element would be subjected to pure shear v if there
were no prestressing. The tensile principal stress occurs at 45 0 from the
vertical as the sum of the shear forces on the element BDC and is repre
sented by pr in the triangle of forces pqr (Fig 2.3d). If a prestress
f is introduced, the resultant will be p 'r I (Fig 2.3e), which is closer p
to the vertical than pr. Since cracks form approximately perpendicular
to the direction of the principal tensile stress the effect of prestressing
is to make the crack less steep.
2.3 Load Paths at Notched End Region
The notched end region of a beam has been analyzed as an elastic
continuum (16) in order to identify regions of maximum principal tensile or
shear stress before cracking. After cracking occurs the continuum must be
redefined, and a finite element representation becomes complicated by the
need to employ dissimilar elements, some representing concrete and others
representing reinforcement. An alternate analytic representation of the
notched end region can be composed of truss elements that, if pin connected,
possess only the capacity to resist axial forces. If connected as homogen
eous, continuous elements, the "truss" members possess also the capacity to
resist shear forces between the ends of the elements. Individual elements
can be modeled to represent the stiffness and strength of the steel rein
forcement or they can be made less stiff to represent concrece. In order
to model cracking, elements that appear to be in tension high enough to
fracture concrete can be eliminated, and the analytical procedure can be
repeated.
A frame analysis program named 'LINFIX' was used for the truss
analysis. This program is capable of analyzing the axial load, moment, and
shear forces, rotations, and deflections of all members of a two-dimensional
frame with member connections that may be specified as pinned or continuous.
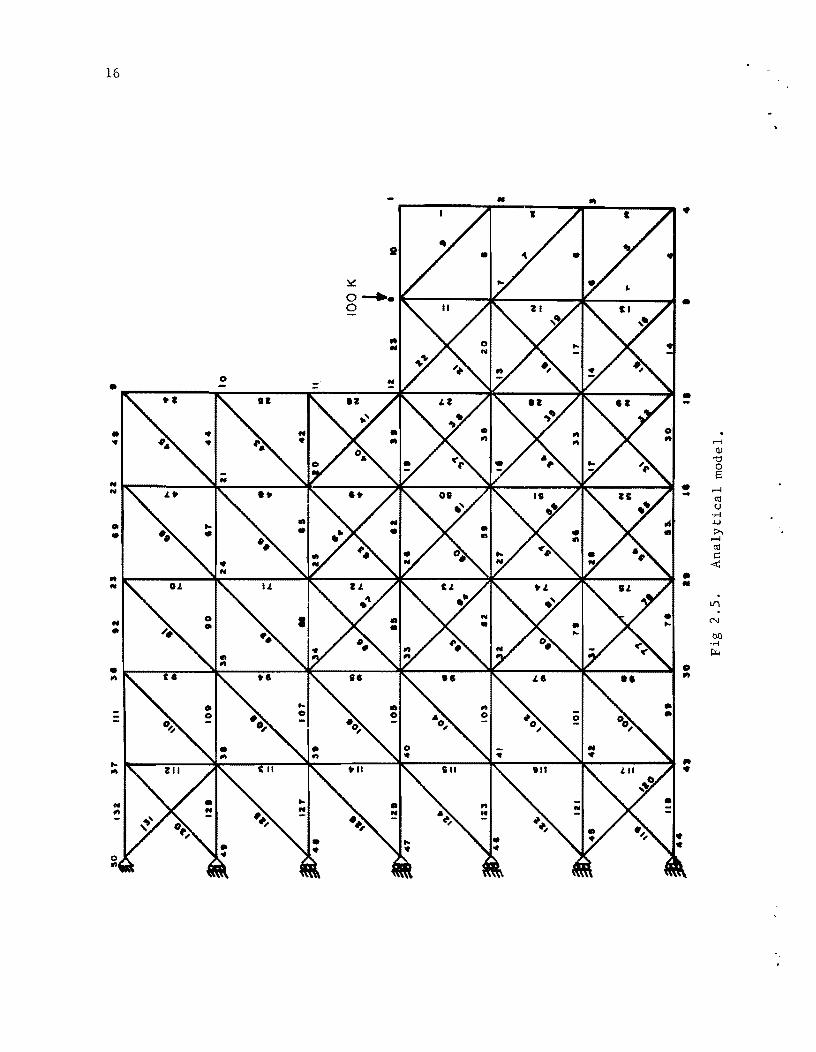
A typical end block of a beam, shown in Fig 2.4, was chosen for the
initial study of load paths. Figure 2.5 shows the pattern of the analytical
model adopted for this end block. The end block is divided into 132
members with 50 node points all serially numbered from right to left. Each
member is designated by the number indicated adjoining the
member. Prestressing is represented by external loads applied at node
,

.. I'Ii')
. .
-----'r---------------------------------------------------------·----1 c
................
Draped Strands
(Prestressed)
Prestressing Strands
'1
12 Ye
Bearing Plate
, 37* .. t I-
Fig 2.4. End block details for preliminary analysis.
. I'-
=0 C\I
t-' V1
16
.~-----------r----------~F---------~~--------~~----------~----------~
~
w ~ 0 e
N N ~
~ 0 .~
~
~ ~
~ C ~
~
N
~ .~
~
17
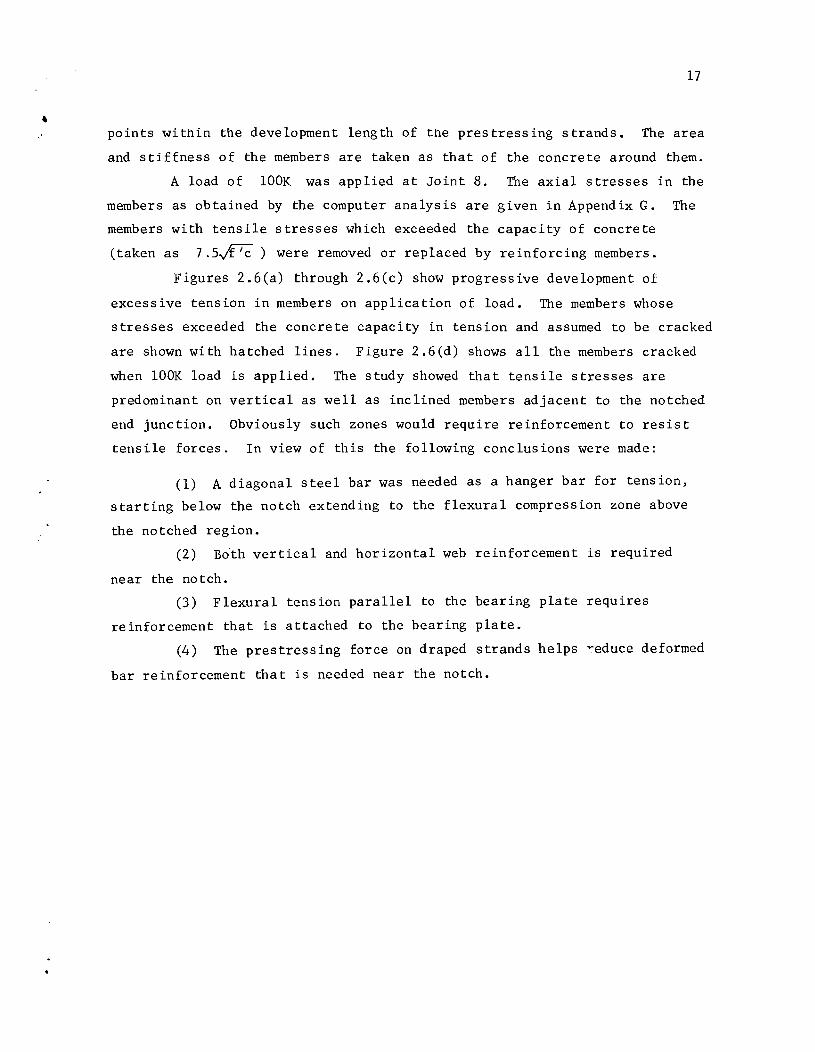
points within the development length of the prestressing strands. The area
and stiffness of the members are taken as that of the concrete around them.
A load of lOOK was applied at Joint 8. The axial stresses in the
members as obtained by the computer analysis are given in Appendix G. The
members with tensile stresses which exceeded the capacity of concrete
(taken as 7.Svf!C) were removed or replaced by reinforcing members.
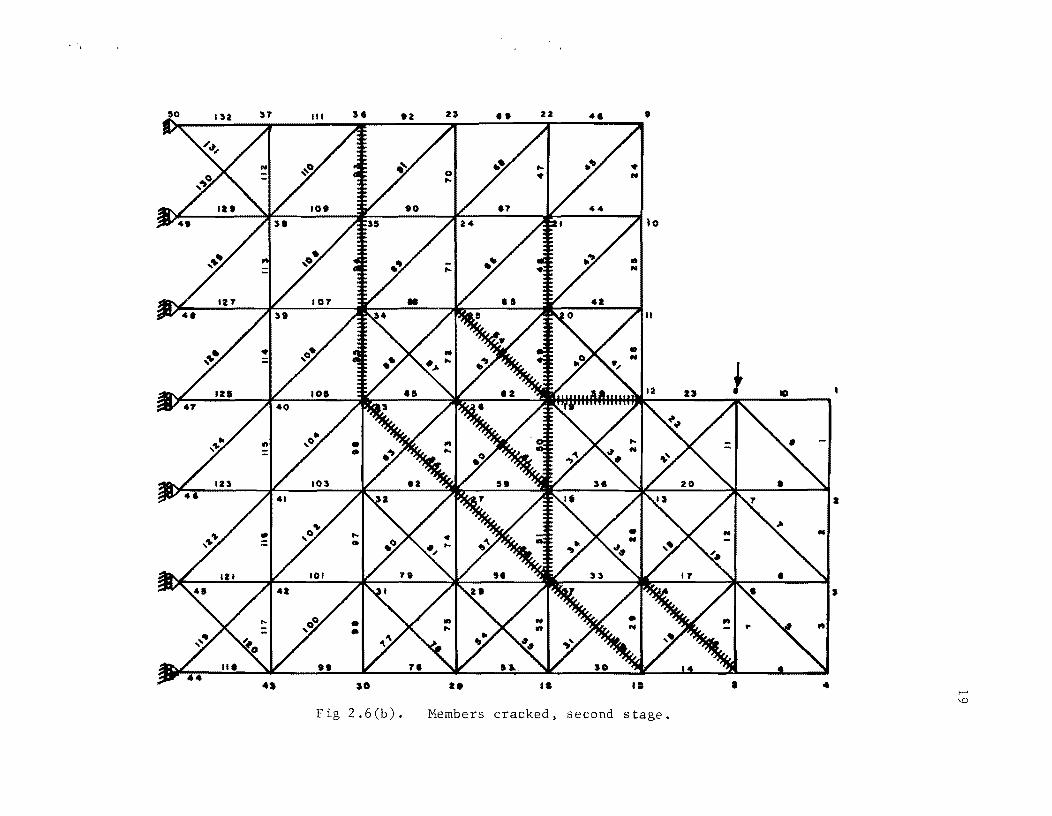
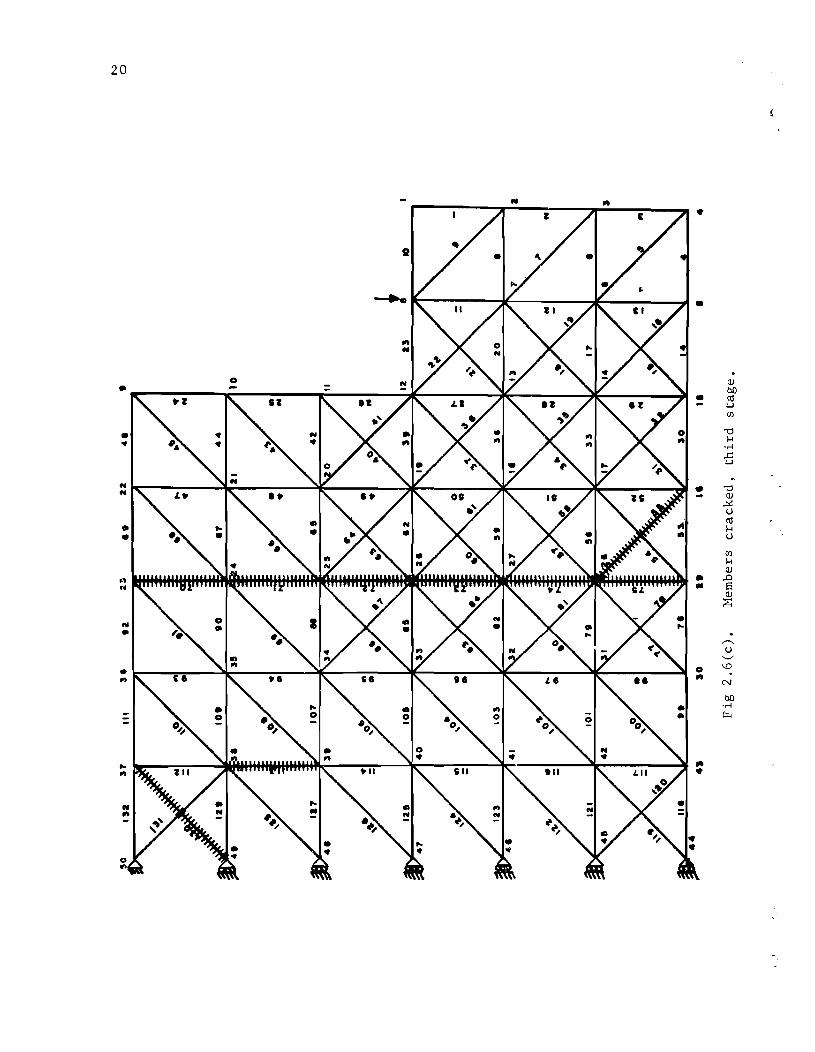
Figures 2.6(a) through 2.6(c) show progressive development of
excessive tension in members on application of load. The members whose
stresses exceeded the concrete capacity in tension and assumed to be cracked
are shown with hatched lines. Figure 2.6(d) shows all the members cracked
when lOOK load is applied. The study showed that tensile stresses are
predominant on vertical as well as inclined members adjacent to the notched
end junction. Obviously such zones would require reinforcement to resist
tensile forces. In view of this the following conclusions were made:
(1) A diagonal steel bar was needed as a hanger bar for tension,
starting below the notch extending to the flexural compression zone above
the notched region.
(2) Bdth vertical and horizontal web reinforcement is required
near the notch.
(3) Flexural tension parallel to the bearing plate requires
reinforcement that is attached to the bearing plate.
(4) The prestressing force on draped strands helps ~educe deformed
bar reinforcement that is needed near the notch.

U' S' 2S II •
F 2.6 ). Members cracked, first stage (all members concrete).
. .
I
- ..
....... 00
. ,
'0
Fig 2.6 (b).
la 12 •
Members cracked, second stage.
a
I-' \0
20
QJ • bD til .i-J UJ
'"0 H
"04 ..c .i-J
'"0 QJ
~ U til H U
UJ H QJ
.0 8 QJ
~
........ u
'-" \.0
N
bD "04
~

21
\
N

I
\
CHAPTER 3. THE SPECIMEN
3.1 Design of the Specimen
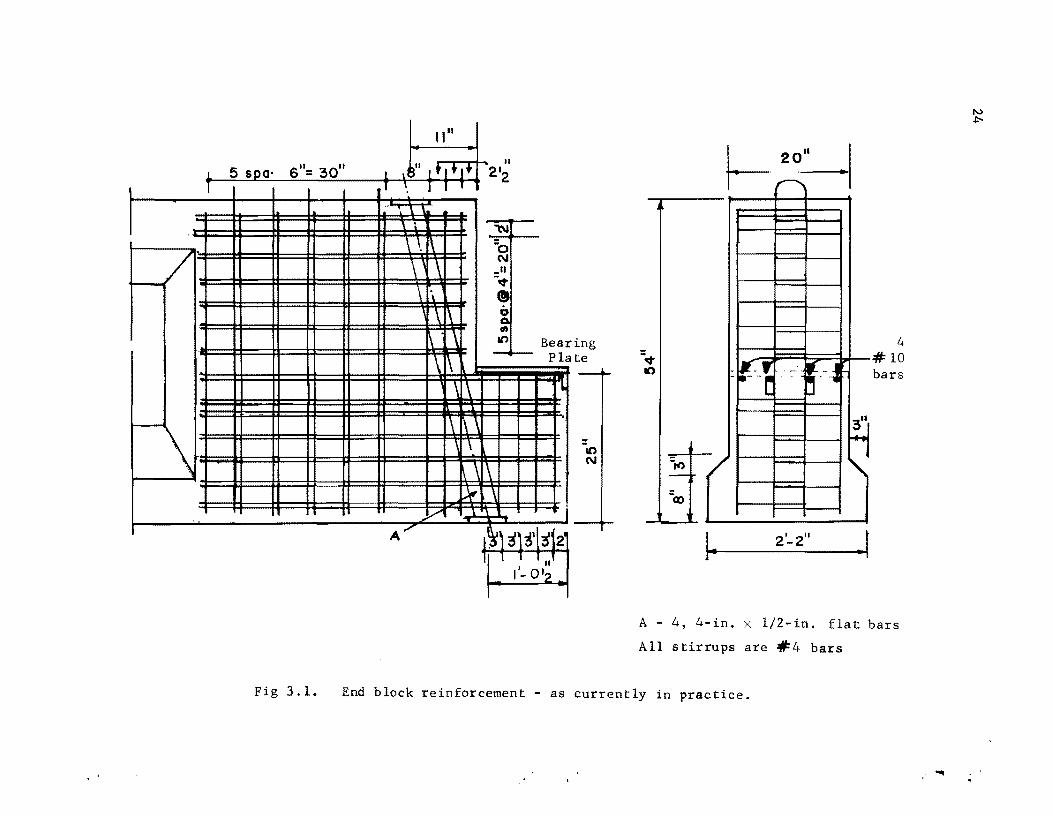
For the design of the test specimen, the 54-inch-deep standard beam
of the State Department of Highways and Public Transportation was selected as
a prototype. Figure 3.1 shows details at the notched end of the 54-in. beam
as proposed by one of the district offices of the Department. This beam with
composite action offered by the deck slab on top is supposedly designed for a
service load reaction of 178 k and an ultimate load reaction of 300 k. Calcu
lations for this load are based on a girder spacing of 7.5 ft for a standard
lane loading of HS-20-44 and are given in Appendix A.
With the data from the discrete element truss analysis at hand, a
critical study of the design of the beam described above was made. The
proposed reinforcement for this beam, as shown in Fig 3.1, calls for heavy
steel bars horizontal and vertical, and one set of four diagonal straps
near the reentrant corner of the notched end. The congestion caused by the
reinforcement makes concrete placement difficult. For examining the
effectiveness of the reinforcement provided at different locations the
notched end was analyzed by the computer program as a truss model with
elements continuous at joints. Details of this analysis are given in
Chapter 6. The computations led to the conclusion that most of the hori
zontal reinforcement does not get stressed on application of load at the
notched end. Hence a reduction of steel is possible in such locations.
Accordingly, one end of the specimen was designed with reduced reinforcement.
A design for the other end of the specimen was developed with reinforcement
that is based on a different concept. Embedded web plates intended to
resist shear at the notched end and to transfer the load from the notch to
the full cross section of the beam, were selected. The shape and position
of these web plates can be seen in Figs 3.2 and 3.3(a) and (d).
23
I
/ -
-e-\
Fig 3.1.
11"
\
\ . \ \. i\
\ ' \ \ ,'\
\ \ 1\ \ \ 1\
\ 1\
1\ ~ , , \ 1\ \
l-¥ V
A'"
II
2'2
"'N
=0 t'\I
_II -. " ~ '" 10 Bea:
Pl~
"L
1\ \ . \
( I~ 3l31~ 3f2i ~ 1'-0 1 •
ing te
10 t'\I
-. IC)
::fC')
-ex>
t-~~
4 L;:J: i I >' U :11= 10
bars
J.. 2'- 2" • r
A - 4, 4-in. X 1/2-in. flat bars
All stirrups are #4 bars
End block reinforcement - as currently in practice.
...
N .po

Strap end , ,. Saddle plate end I L 17-6 _
.. ..I I 1811 I .t, •• ~Al ' 4·S,3'-Olleach 21t' strands
B 14-6,2'-3"ea or
pia tes ... , ,'. -. =Q)
~ SECTION AA
~3,U stirrups
3~ Olleae h
D\ 6, f draped stran.d s
bearinQ plate
H 1\ 12 xlO x
~ 10"1 I,. ..
8 .tranda, stlo __ ~L. -15'-102'6" I ' SECTION SS I·' - ·1- -I.. 2 6 -i.. ~
Details showinO strands, strops and plates
2spa 3spa
2~1f~~+@ ~'i. 8 spao@6" I I. 8spa@9" .. I. 9spa@6" ~~S~;~~:I
...... t',
-- ...............
~ l"III
I
-
2,~3 bars
Details showinO stirrups
Fig 3.2. Details of specimen.
" lJ
j
r-
#3,U stirrups 3 - O"each
..
N \Jl

-'It
-10
NI ~1
U If II
10'5" 14'75~21 7 ~ --=:1 ,. . . . -,
Bearing plate
10"/. 1/2"-1'-0"
=",
o ~ 6"~.. I'S" ~ 14 6 bars
Elevation
= - --~4====~~L----------------------
II ~ 1: 6"1 2'3"
Plan
Fig 3.3(a). Saddle plate.
U:>
-",
cb
=-T J-
:: . c\I 10 -
-~ =~ ..:.l ~
(\J
1
4" I- -f
Fig 3.3 ) . Strap.
-fc5,.....,2.51--
Straps 3" " 1/4" bars
I 9" I • ·1 -f 2'1-! 3" j.....j ~'l-
Beal' plate, 10", 1/2" - 1'-0
-----til 1------------:Jf 1------
-C\I
.~ 1------. ------I.. 10" .1
/I ~,
,_ 3'0" I- 8'5" ~
Fig 3.3 (c) . Bearing platewith reinforcements welded.
If'
N 0'

, '
!? " .. ~ ,', , - - I
I , ... ..--. ~ ---'''''' ~.' ~---'. . I
I' : ' (i J -I ; 1 ' ''''~ I ~ I - " • _ .. .. ---'_ ~ .... ~I , \~tt~"'-"""-; '.'
I \ .. ~ ,~ ... ~" '~. ~.:: :-;.--'~ - .. I _ ..
t' ~ --.---.~-! \ ~i ~ ~~...~ _~.'- ~
\ .. ~ -' If··. -.: ..... 0': '.' ~ ..., - . r,'., ! ~ . ~ .. "'. ; . ~I ~ ~ ". :'i:~-~ __ ~ ~ , -: (' -.... . "'t ~, ' IQ' .. tW. {. : c;;.I a..:; " ';':. h~.'.'1:' :"' __ :>,IW: ~-- - • U w':. . to ,. ; "' . t . r -
. ,, ~_~..: . n . ~ \ .. __ ~ --/ ~.~ .•.. ~ .. ' ; . : .... ~- ~ , . , ,.. , .
. , .,.. : ,or;,' E .. ~ _ J" ~. . - ... ~~ --
...
... =
Sadd Ie pIa te. Saddle plate in position.
Strap and bearing plate with bars welded. Strap in position.
Fig 3.3(d)
..
I'V .......,
28
3.2 Scale of the Model
A scale of 0.5 was adopted for modeling the specimen. This
unusually large scale for a model was chosen in order to have a better
understanding of the behavior of the beam under field conditions than could
be possible with a smaller model. Figure 3.2 shows detailed dimensions of
the model. Figures 3.3(a) to (d) show the different component parts used
at the notched ends. A comparison of dimensions between prototype and
model is given in Table 3.1. It can be seen that the quantity of hori-
zontal stirrups is reduced considerably and has a ratio of only 0.085.
The area ratio for the specimen has been maintained at an average of 0.4.
Calculations for the moment capacity and stresses at different
stages of loading for the 54-in.-deep beam are contained in Appendix B.
The shear strength of the notched end of the 54-in. beam was estimated
as 500 k, based on the ACI Code method of calculating shear capacity v c of prestressed concrete beams. Details of calculations are given in
Appendix C. According to the scale adopted the shear capacity of the model
should be approximately 0.4 x 500 = 200 k. The capacity was estimated
using the ACI Code equations, which gave a value of 185 k for the strap end
and 189 k for the shear plate end. Calculations are given in Appendix E.
It was thought that this could represent an upper-bound value of the shear
capacity of the notched end of the model and was taken as a guide for the
design and arrangements for the loading frame for the test.
3.3 Design of the Model
Appendices Band D give detailed calculations for the service load
stresses and ultimate capacities for the prototype and the model respec
tively. Table 3.2 gives a comparison of the loading conditions, flexural
capacities, and stresses at different stages of the prototype and the
model. For the model, tensile stress in concrete at transfer is more than
the allowable stress of 3~ stipulated by the ACI Code but considered CL
not of much significance since the tensile capacity of the concrete is not
exceeded. Moreover, this stage of stress conditions remains for a very
short period of time.
Calculations for arriving at a load-deflection relationship for the
model are contained in Appendix D. Following the methods suggested by

Situation
Span
(support to free end, clc distance)
Depth
Depth at notched end
Top width
Bottom wid th
Area of end block
Area of strands (1/2 in., 270 ksi)
Inclined straps A36
Horizontal bars welded to base plate Grade 60
Vertical stirrups at notched end Grade 60
Horizontal stirrups Grade 60
TABLE 3.1
Dimensions and Areas
Prototype
14 ft 0 in.
54 in.
24-1/4 in.
20 in.
26 in.
1137 in. 2
6.273 in. 2
(41 strands)
8 . 2 ~n.
5.08 2
in.
.8 in. 21ft
26#4 U-type
Model
8 ft 9 in.
34 in.
16 in.
12 in.
18 in.
445.5 in.2
2.45 in. 2
(16 strands)
3 . 2 ~n.
1. 76 2
in.
4# 3 U-type
29
Ratio
.625
.63
.66
.60
.69
.392
.390
.375
.345
.41
.085
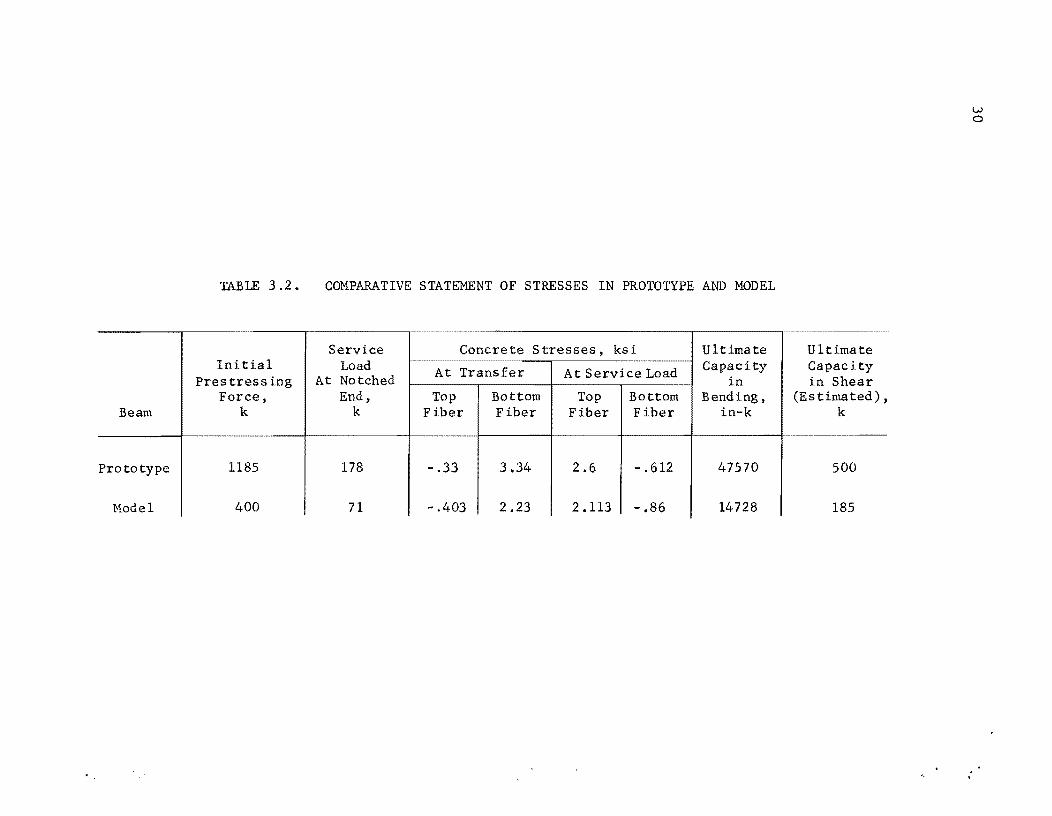
TABLE 3.2.
Initial Pres tress ing
Force, Beam k
Prototype 1185
Model 400
COMPARATIVE STATEMENT OF STRESSES IN PROTOTYPE AND MDDEL
Service Concrete Stresses, ksi Ultimate Load At Transfer At Service Load Capacity
At Notched in End, Top Bottom Top Bottom Bending.
k Fiber Fiber Fiber Fiber in-k
178 -.33 3.34 2.6 -.612 47570
71 - .403 2.23 2.113 -.86 14728
-------------
Ultimate Capacity in Shear
(Estimated) , k
500
185
l.;.)
o
31
Burns (4) the Moment Curvature relationships at different sections of the
beam were computed taking into account the variation in effective depth in
relation to the draping of strands. Deflections are computed based on
these moment curvature relationships with the cracking stress for concrete
assumed as 7.SJf! These calculations for load-deflection relationship c
were made in order to compare them with the observed values during the
test.
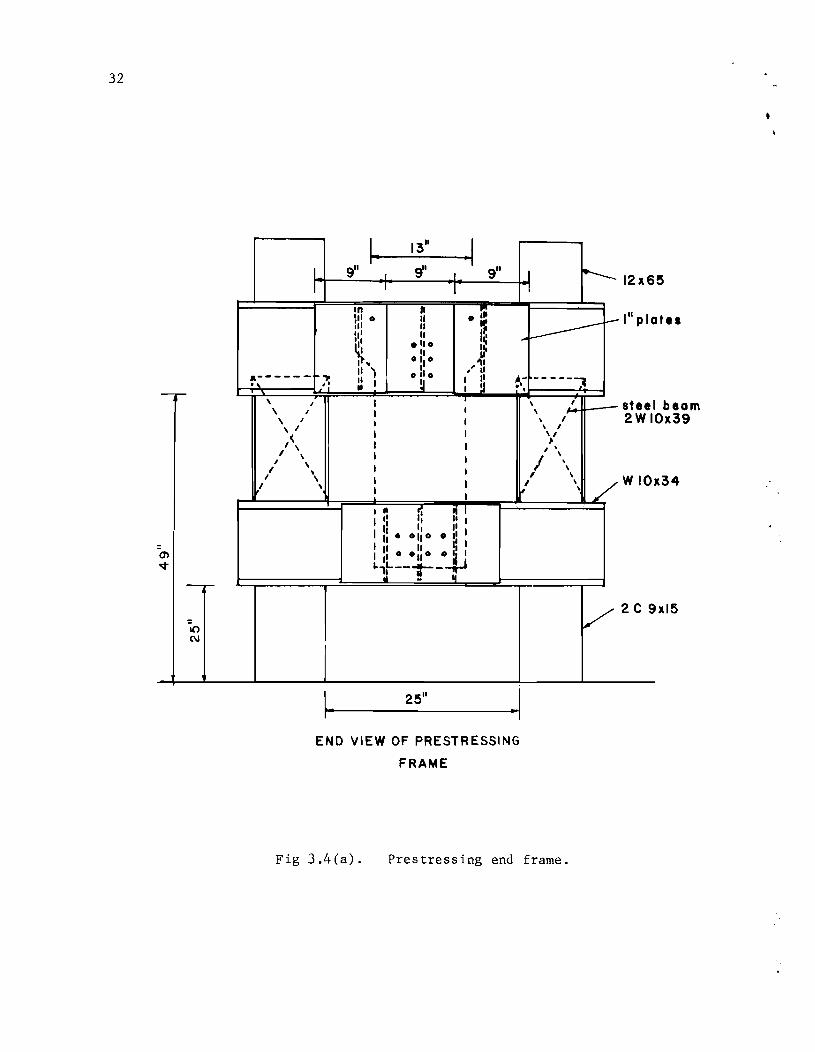
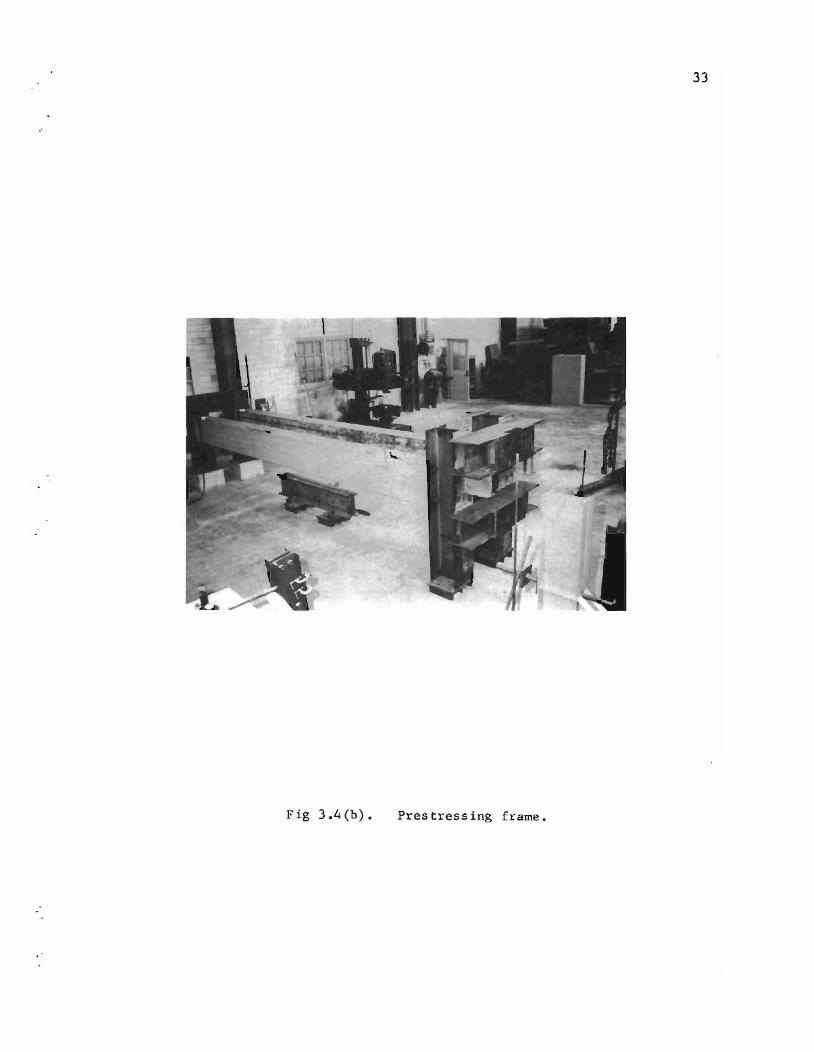
3.4 Prestressing
The specimen was fabricated at the Civil Engineering Structures
Research Laboratory of The University of Texas at Austin. The specimen was
cast in an inverted position with respect to its anticipated position in
service in order to keep the widest portion (the bottom flange) in the top
of the form. Only one specimen was made and tested, but each end employed
different notch reinforcement. The arrangements and set up for preten-
s ioning are shown in Figs 3.4a and b. Two horizontal beams, each made up
of two W lOx 39 sections, were used to take the thrust of the 400Kprestressing
force. End frames were made up of (a) two vertical posts with two C 9 x lS
3-1/2 in. apart with l/2-in. stiffeners welded in between and (b) two
horizontal beams of I-sections with l-in. plates welded to them. These
members were designed for any combination of loading which could occur
during stressing operations.
The ends of the two horizontal beams were not square, and a l/2-in.
gap for grouting was used between the frames and the beam ends. Hydrostone
grout in the gap was added after alignment in the horizontal as well as the
vertical direction was satisfactory. After hardening of hydrostone, all
connecting bolts were tightened with a pneumatic wrench.
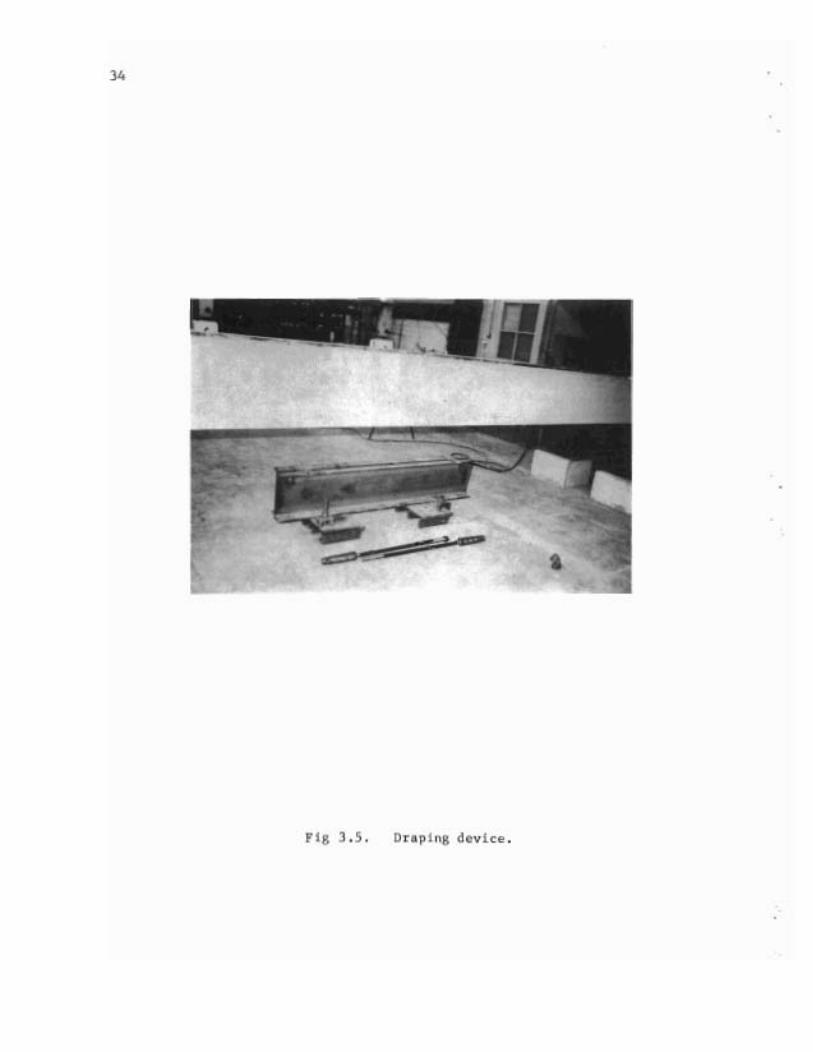
The reinforcement, web plates, strap bars, and bearing plates were
placed in position resting on the bottom of the form. Strands were
threaded through one end of the frame and held in position temporarily by
chucks. Strands were tensioned by hydraulic jacks, one strand at a time.
Draping was achieved by using cast iron hold-down devices with l-in.-dia.
A-490 high strength bolts anchored to the laboratory floor. Details can be
seen in the photograph of Fig 3.S.
32
-,.--
-,--
10 C\I
l I
.-._--- ,. .-, ,. , I
\ I
\ I , I
,<. , \ 1 , , \
In 'II ° :11 'II III ~I It .. II ) ~ I
I I
,. II II II
.110 II 0:10
0110
~
·1 I
I
I
J ~ 12x6!5 I
.. J __ ---f--III plate.
" ..... '...-_-- steel beam \ ,- 2WIOx39 \ 1 'I ~
1 \
/ \ I \ , ,
I
I I I I I
I I
, , ",' '. /WIOX34
I
I ~ r: n : I II II I' I I II • 0lt0 0 II I II II I, I I I' 0 0110 0 ~ : .. ,!---~-~
Ii !! Ii
~I END VIEW OF PRESTRESSING
FRAME
Fig 3.4(a). Prestressing end frame.
V 2C 9xl5
33
Fig 3.4 (b) • Prestressing frame.
Dn~I"3 do. I .. .
35
Since the grid used for strands was 2 in. and strands were to be
pulled one at a time, a special "chair" was made so that it could be placed
against any strand without interference with anchor chucks and free ends of
strands already stressed. A plate within the chair prevented chucks from
moving away from the bearing plate while the strands were stressed.
Allowance was made for the extra load required for the slip of grips into
the chuck on release of pressure in the hydraulic jack. The prestressing
force applied was calculated such that the net force after release of
strands should be equal to the prestress corresponding to field conditions -
i.e., after all losses, including time-dependent losses, have occurred.
Calculations for this are given in Appendix D. According to these calcu
lations the load to be applied on one strand was 30 k to get the
required stress of 163 ksi after stressing operations were complete.
Strands were stressed in a sequence that caused minimum eccen
tricity on the frames. After all the strands were stressed, loads in three
strands were measured to find out whether any immediate losses have
occurred, possibly, by creep in steel or by overall shortening of the
frame, after all strands had been stressed. This was done by measuring
the hydraulic pressure required to pull the strand to an extent just
sufficient to cause separation of grips from the chuck holding the strand.
The following are the values of the retensioning forces on the three
strands checked.
(1)
(2 )
(3)
22.6 k
23.5 k
23.2 k
} Average 23 k Desired 24.4 k
For the two straight strands at the top of the cross section, bond
was destroyed for the l8-in. end region of the strand in order to eliminate
the undesirable effects of prestressing force. Bond was prohibited by
application of grease and paper wrapping.

36
3.5 Concrete
The mix for the concrete used is given below:
Cement
Coarse aggregate
Fine aggregate
Water
Airsene
6-1/2 sacks
1780 lb
1600 lb
30 gal
50 oz/sack
The above mix was designed to yield a strength of 6000 psi.
slump obtained was 4 in. The beam was cured for 10 days by covering with
polythene sheets. This concrete resulted in the following strengths at
different ages of the specimen.
Days After Casting Strength Recorded Average Remarks
7 (1) 5446 psi
(2 ) 5305 psi 4951 psi
(3 ) 4102 psi
26 ( 1) 6330 psi
(2 ) 5765 psi 5517 psi Release of strands
(3) 4456 psi
46 (1) 7215 psi
(2) 5871 psi
(3) 7427 psi Test of (4) 6402 psi 6667 psi specimen
(5) 6119 psi
(6) 6867 psi
3.6 Release of Strands
Strand forces were released by burning each strand 26 days after
concrete casting. The hold-down bolts for draped strands were released by
loosening the nuts on the holding mechanism. The projecting portions of
the hold-down bolts were burned off later.
,
CHAPTER 4. SPECIMEN LOAD TEST
4.1 General
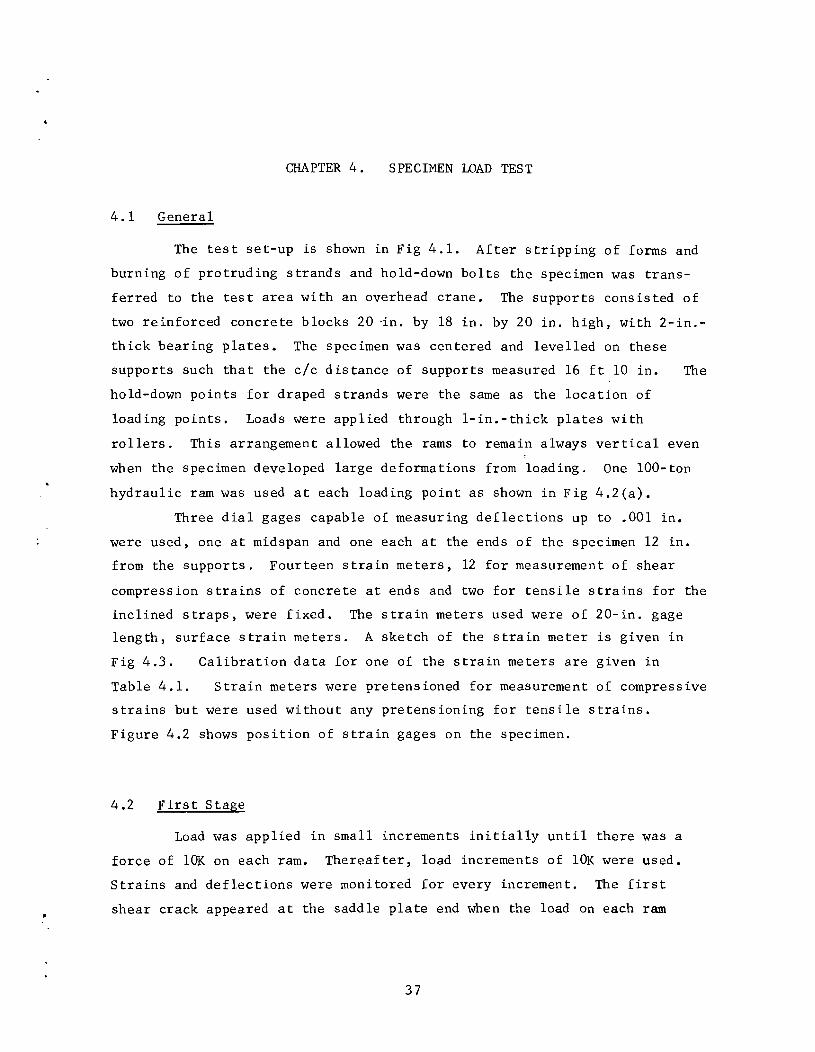
The test set-up is shown in Fig 4.1. After stripping of forms and
burning of protruding strands and hold-down bolts the specimen was trans
ferred to the test area with an overhead crane. The supports consisted of
two reinforced concrete blocks 20 -in. by 18 in. by 20 in. high, with 2-in.
thick bearing plates. The specimen was centered and levelled on these
supports such that the c/c distance of supports measured 16 ft 10 in. The
hold-down points for draped strands were the same as the location of
loading points. Loads were applied through l-in.-thick plates with
rollers. This arrangement allowed the rams to remain always vertical even
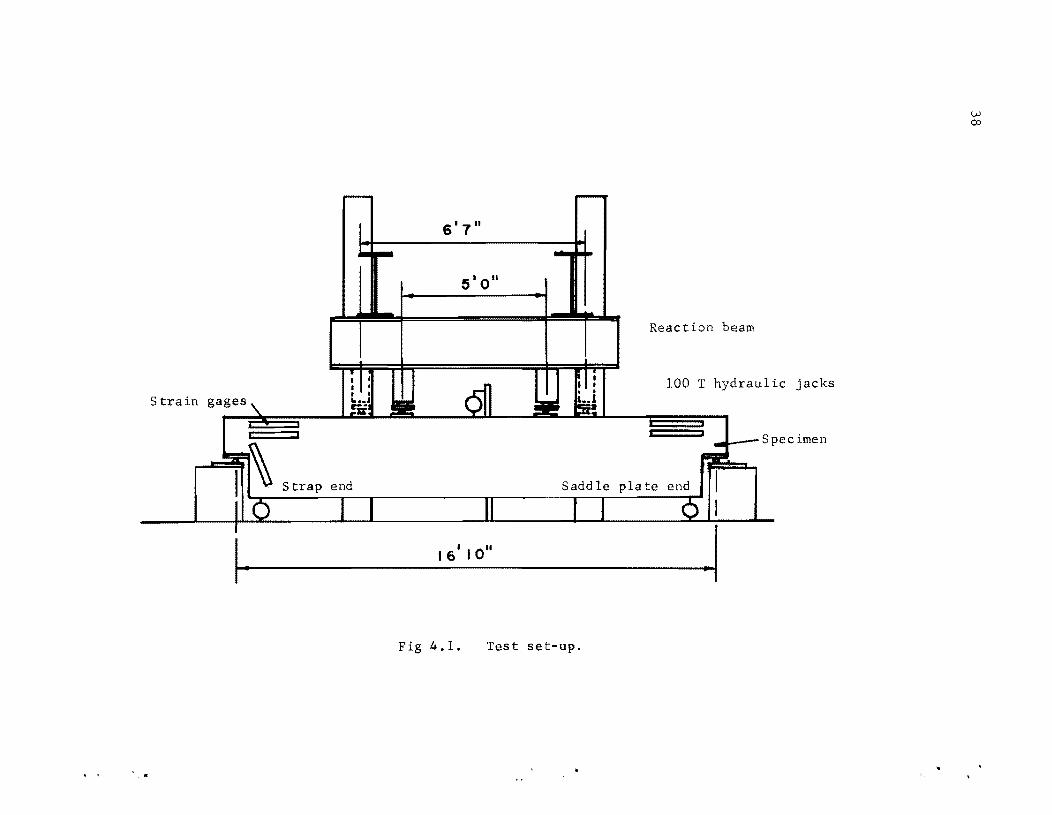
when the specimen developed large deformations from loading. One 100-ton
hydraulic ram was used at each loading point as shown in Fig 4.2(a).
Three dial gages capable of measuring deflections up to .001 in.
were used, one at midspan and one each at the ends of the specimen 12 in.
from the supports. Fourteen strain meters, 12 for measurement of shear
compression strains of concrete at ends and two for tensile strains for the
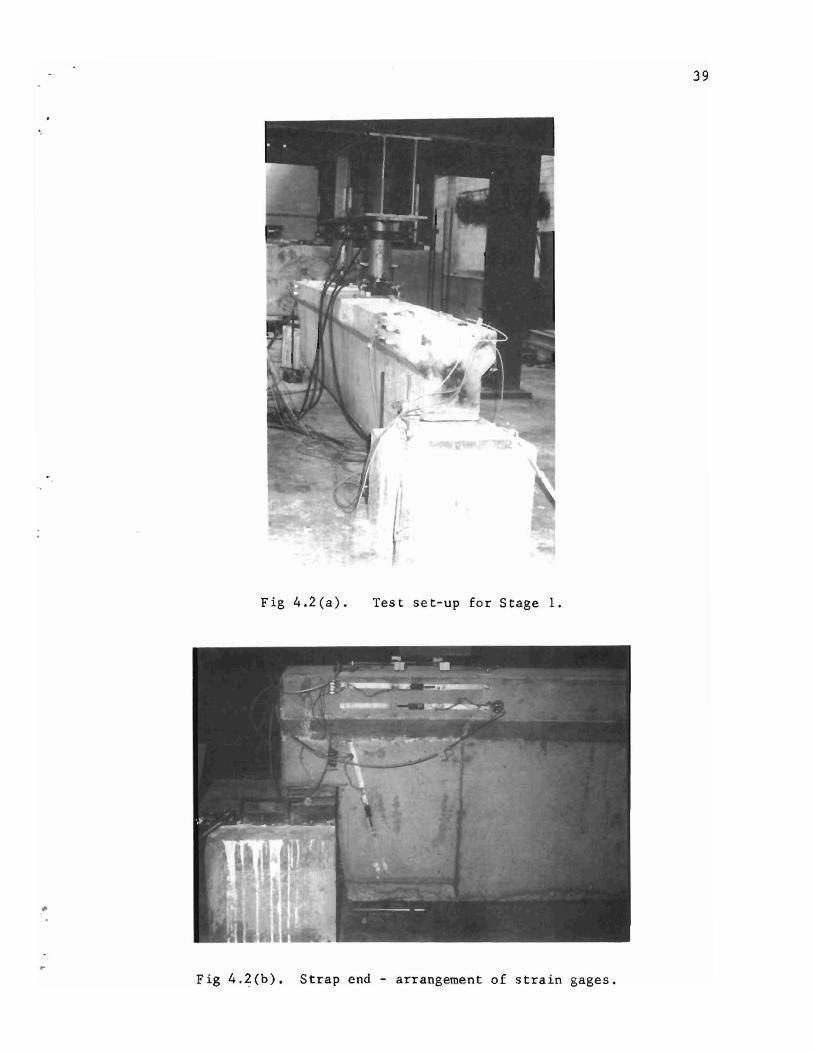
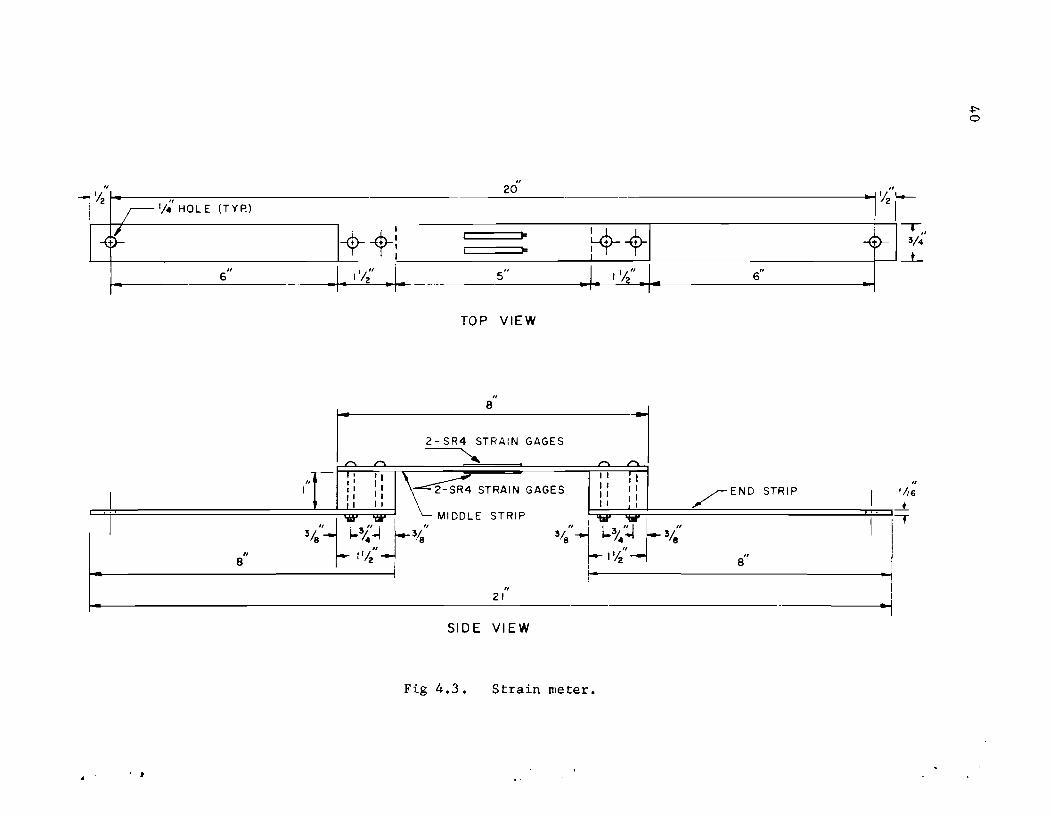
inclined straps, were fixed. The strain meters used were of 20-in. gage
length, surface strain meters. A sketch of the strain meter is given in
Fig 4.3. Calibration data for one of the strain meters are given in
Table 4.1. Strain meters were pretensioned for measurement of compressive
strains but were used without any pretensioning for tensile strains.
Figure 4.2 shows position of strain gages on the specimen.
4.2 First Stage
Load was applied in small increments initially until there was a
force of 10K on each ram. Thereafter, load increments of 10K were used.
Strains and deflections were monitored for every increment. The first
shear crack appeared at the saddle plate end when the load on each ram
37
6' 7 11
5'0"
Strain gages
Fig 4.1. Test set-up.
Reaction beam
100 T hydraulic jacks
.......&---Specimen
w 00
39
Fig 4.2(a). Test set-up for Stage 1.
Fig 4.2(b). Strap end - arrangement of strain gages,
I/~' HOl E (TYP.)
6"
J++l I I" I ... i /2 ...
[ ~
"
H>-+I I';'i
.1. 1'1," I t I;;: .... 6" ~ "I
20
5"
TOP VIEW
" 8
2 - SR4 STRAIN GAGES
~
\~ STRAIN GAGES i: : : i 1
=:j::;::::============~~;::::;~ ~ MI DDl E S TRI P . 'tIP ~ "
I %"-1 -'~3J.'~{3/:' %" -..j l.3/.:! ~ 3/~' I " r- IIA ~ IIA ~ " I
- 8 , 2t" i· ' 8 :I I
SIDE VIEW
Fig 4.3. Strain meter •
• .t
~ o

,
TABLE 4.1. CALIBRATION DATA FOR STRAIN :METER
Gage Factor Sett 2.00
Gage Length 20.20 inches
Indicator Dial Gage Displacement Unit Strain Indica tor Reading Average
Reading in. X 10-3 X 10⁻⁴ in. lin. Reading (Reverse) Increment
0 0 0 0 + 2 0
90 10 5 222 238 229
80 20 10 453 470 232
70 30 15 689 710 238
60 40 20 930 946 238
50 50 25 1171 1190 242
40 60 30 1420 1430 245
30 70 35 1669 1681 250
20 80 40 1910 1923 247
10 90 45 2160 2170 248
0 100 50 2410 2410 245
S.M. Factor (Sum of Average Increment) I Sum of Unit Strain
= 13037/275 47.4 x 10⁻⁴ in./in.
Strain Meter No. SM3
Tension Test No. 1
Increment Sum Remark
0
229
461
699
927
1169
1414
1664
1911
2159
2404
.j:c"t-'

42
was 80K. Subsequently a crack of minor nature appeared at the strap end
at lOOK loading. The first flexural crack was observed at 120K on each
ram. As the load was increased, more cracks developed at midspan,
spreading in areas beyond load points with inclinations characteristic of
flexural cracks in any beam loaded in this manner. No new cracks developed
at the saddle plate end between the stages of Il0K and 160K loading. After
the 160K stage of loading, additional cracks started appearing. Cracks at
the strap end did not appear to be so significant as did those at the plate
end.
At the l70K load a crack developed from the bottom of the specimen
and reached within 8 inches of the top of the specimen. The location of
this crack was at the plate end, about 6 ft from the reaction. The
specimen appeared very stable, and there was no suggestion of failure. The
testing was temporarily stopped at the next load stage, i.e., 180K on each
ram, because 90 percent of the capacity of the rams had been reached,
and it was felt that the loading frame and floor anchor bolts had to be
strengthened before application of additional load.
Results of this first stage are discussed in Chapter 5. The crack
widths at the ends and deflections at midspan were measured on release of
loads and again after two days and were recorded.
4.3 Second Stage
The testing frame was reinforced by attaching cross channels at the
end of the reaction girder and anchoring them to the floor. This
attachment could share one-fifth of the total load. Control of load
sharing by the two systems could be modified by loosening or tightening the
nuts provided for the bolts connecting the channels to the floor. Two rams
of 100-ton capacity each were used on either side of the midspan for the
second stage loading. The additional ramS were positioned 9-1/2 in. away
from the first two rams on either side. These are indicated by dashed
lines in Fig 4.1. All measurements were recorded as before for each increment of
loading. No new cracks appeared until 180K load had been restored. At
this stage fresh cracks appeared at the notched ends as well as the
flexural cracking zone. Figures 4.4 and 4.5 show portions of the cracked

.... :::: ... ':::.
Fig 4.4. The cracked specimen.
./:' w
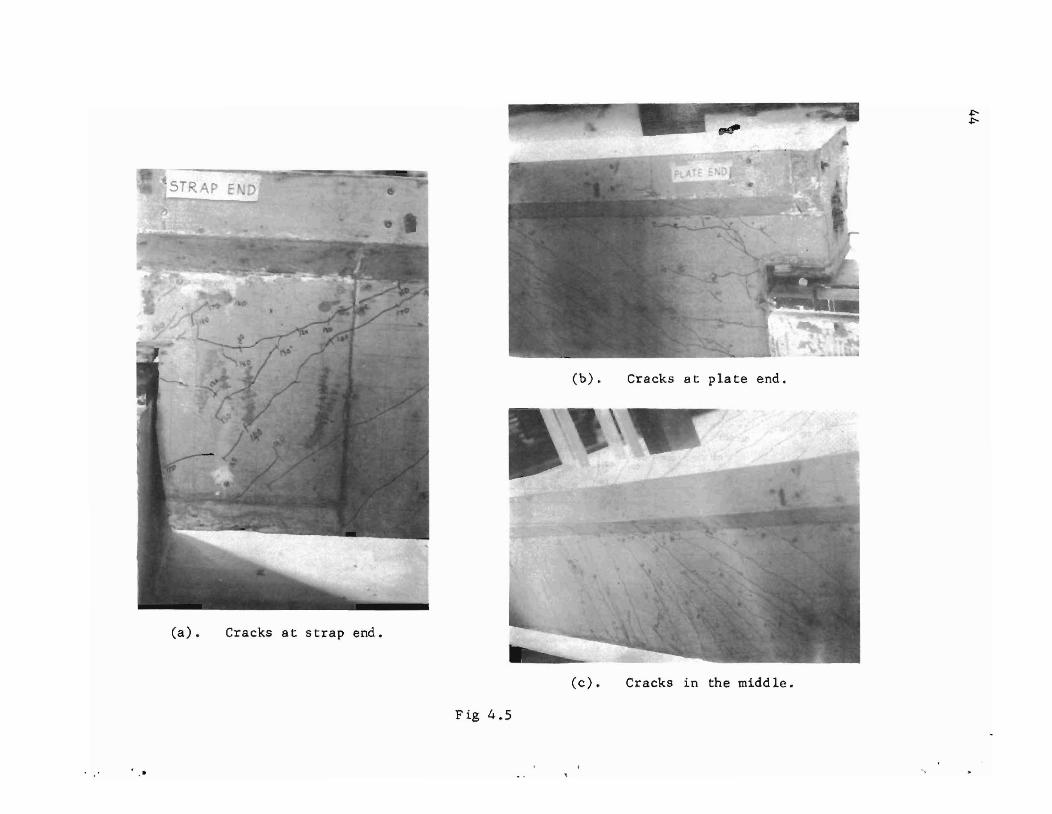
(a). Cracks at strap end.
Fig 4.5
(b). Cracks at plate end .
(c). Cracks in the middle.
~ ~
4S
specimen in detail. The dashed lines shown in Fig 4.4 are the cracks which
appeared during the second stage of the test. When the load on each side
was 200K the crack which had formed at l70K during the first stage started
widening rapidly. The position of this crack was approximately 6 ft from
the saddle plate end. A general shear failure occurred along this par
ticular crack when the load on each side was 2l0K. At the same end another
crack had lengthened as much as to encroach the flange portion of the
specimen to an extent of about 2 in. when the load was only l80K, but it
propagated no further.

CHAPTER 5. DISCUSSION OF TEST RESULTS
5.1 General
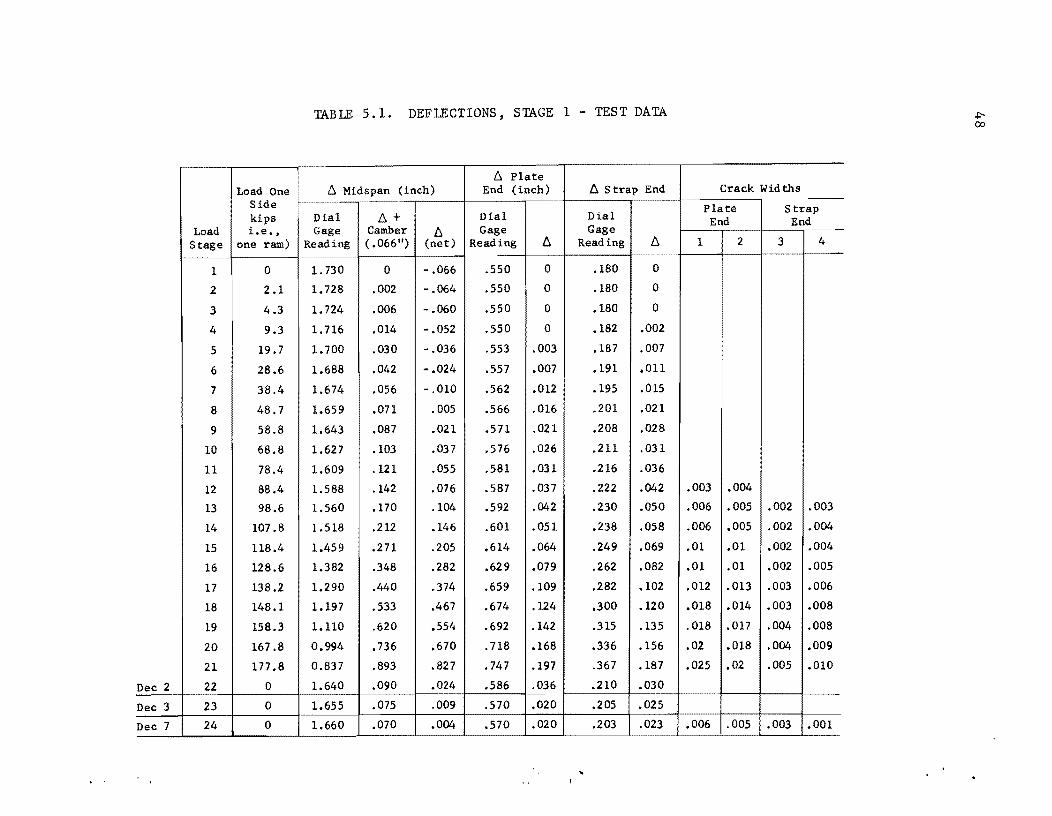
Deflection gage readings and crack width measurements are shown in
Tables 5.1 and 5.2. A sketch of the specimen with cracks marked for
various loading stages was shown in Fig 4.4. Cracks shown as solid lines
or as dashed lines distinguish the first stage and second stage of the
test, respectively. As mentioned in Chapter 4, at the saddle plate end a
crack extended into the flange portion at l80K load, but it was not a part
of the failure. Various cracks developed at both ends below the notch as
loads increased from l30K to l80K. Most cracks closed up almost immedi
ately after the specimen was unloaded before stage 2 loads were applied.
5.2 Deflections
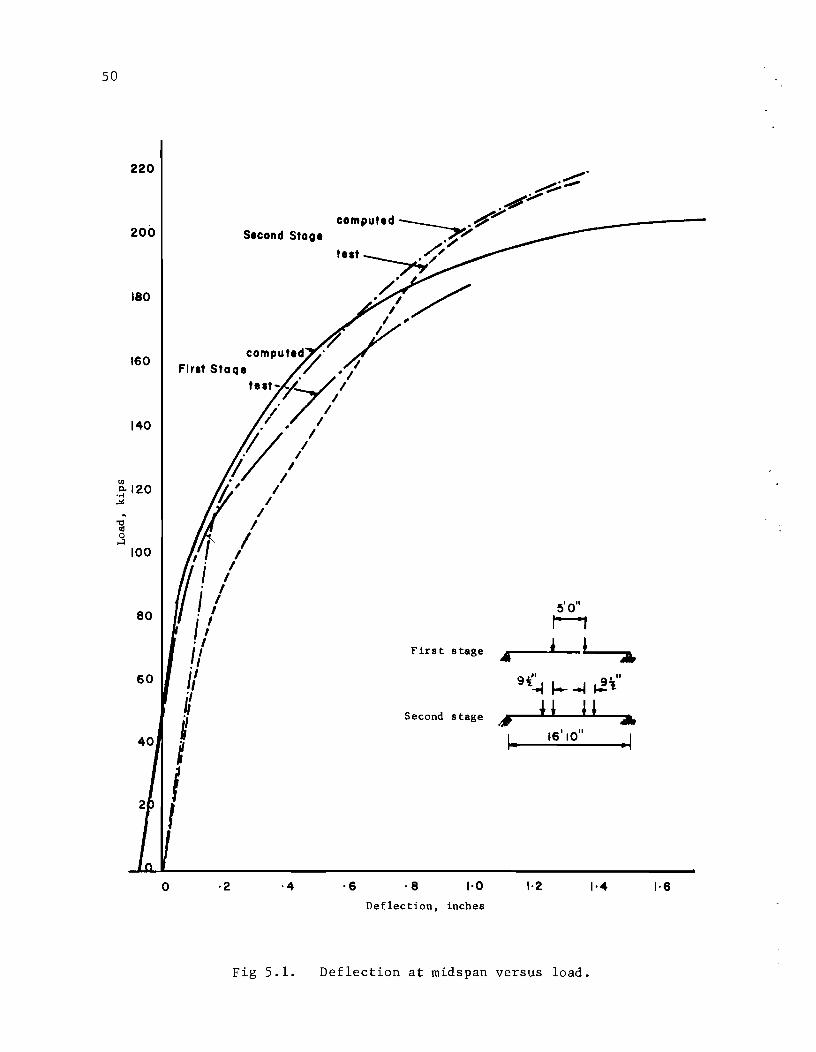
Deflections at midspan are plotted against loading as shown in
Fig 5.1. Maximum variation between the theoretical and measured rela
tionship exists at the onset of cracking. The actual response was less
stiff than the analysis suggested prior to the reloading stage. For loads
above 190K in the reloading stage, the actual response was more stiff than
that predicted, but the ultimate load predicted was about th~ same as that
which was actually resisted. Measured data points are plotted and a
line marks the loading sequence. The solid line represents an analytical
prediction of deformation. Details of the analysis are given in Appendix D.
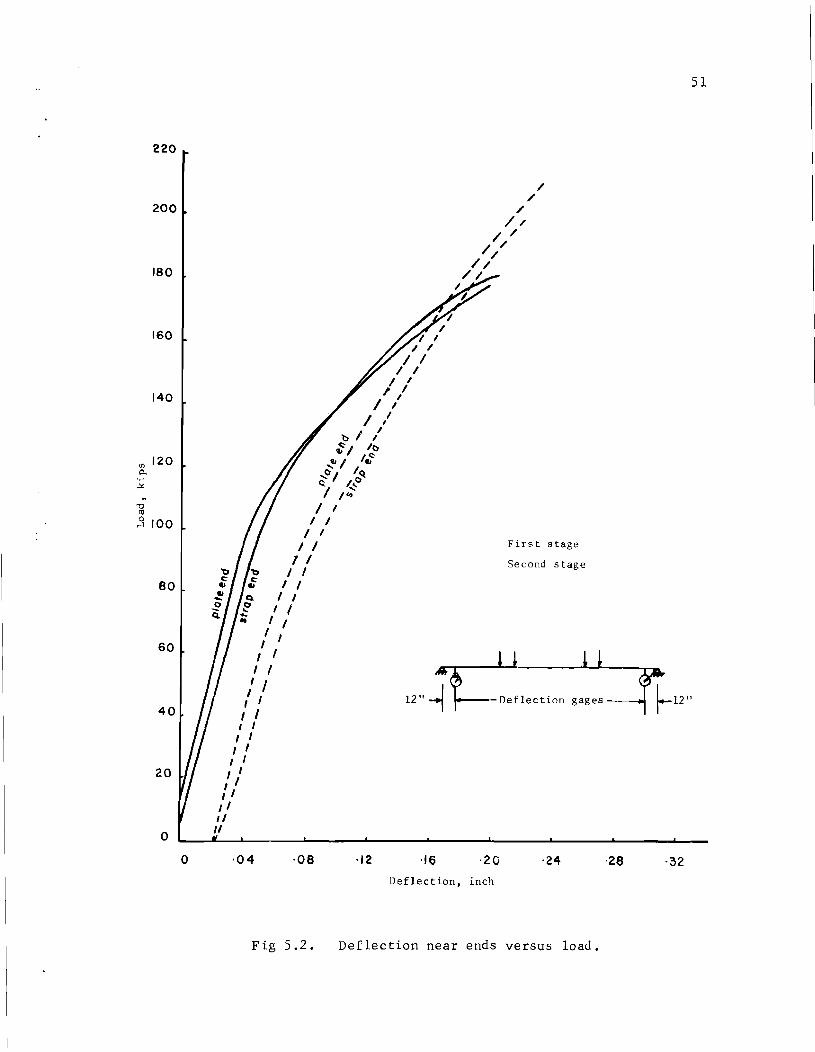
Deflections that were measured near ends are plotted against loads
in Fig 5.2. In the first stage of the test, deflections are larger at the
strap end than at the plate end initially, but the reverse was observed at
later stages. In the second stage of the test the strap end deflections
are consistently larger. Deflections at these points were relatively
small, and, since they involve a combined effect of shear and bending
deformations, no analytical data were derived for comparison. At the load
level of observed flexural cracking, the rate of deformation increased in
47
Load One Side kips
Load i.e., Stage one ram)
1 0
2 2.1
3 4.3
4 9.3
5 19.7
6 28.6
7 38.4
8 48.7
9 58.8
10 68.8
11 78.4
12 88.4
13 98.6
14 107.8
15 118.4
16 128.6
17 138.2
18 148.1
19 158.3
20 167.8
21 177 .8
Dec 2 22 0
Dec 3 23 0
Dec 7 24 0 -
TABLE 5.1. DEFLECTIONS, STAGE 1 - TEST DATA
t, Plate t, Midspan (inch) End (inch) D. Strap End
i----
Dial t,+ Dial Dial Gage Camber D. Gage Gage
Reading ( .066") (net) Reading D. Reading D.
1.730 0 -.066 .550 0 .180 0
1.728 .002 - .064 .550 0 .180 0
1.724 .006 - .060 .550 0 .180 0
1.716 .014 - .052 .550 0 .182 .002
1.700 .030 - .036 .553 .003 .187 .007
1.688 .042 -.024 .557 .007 .191 .011
1.674 .056 - .010 .562 .012 .195 .015
1.659 .071 .005 .566 .016 .201 .021
1.643 .087 .021 .571 .021 .208 .028
1.627 .103 .037 .576 .026 .211 .031
1.609 .121 .055 .581 .031 .216 .036
1.588 .142 .076 .587 .037 .222 .042
1.560 .170 .104 .592 .042 .230 .050
1.518 .212 .146 .601 .051 .238 .058
1.459 .271 .205 .614 .064 .249 .069
1.382 .348 .282 .629 .079 .262 .082
1.290 .440 .374 .659 .109 .282 .102
1.197 .533 .467 .674 .124 .300 .120
1.110 .620 .554 .692 .142 .315 .135
0.994 .736 .670 .718 .168 .336 .156
0.837 .893 .827 .747 .197 .367 .187
1.640 .090 .024 .586 .036 .210 .030
1.655 .075 .009 .570 .020 .205 .025
1.660 .070 .004 .570 .020 .203 .023
Crack Wid ths
Plate Strap End End
1 2 3 4
.003 .004
.006 .005 .002 .003
.006 .005 .002 .004
.01 .01 .002 .004
.01 .01 .002 .005
.012 .013 .003 .006
.018 .014 .003 .008
.018 .017 .004 .008
.02 .018 .004 .009
.025 .02 .005 .010
.006 .005 .003 .001
~ co
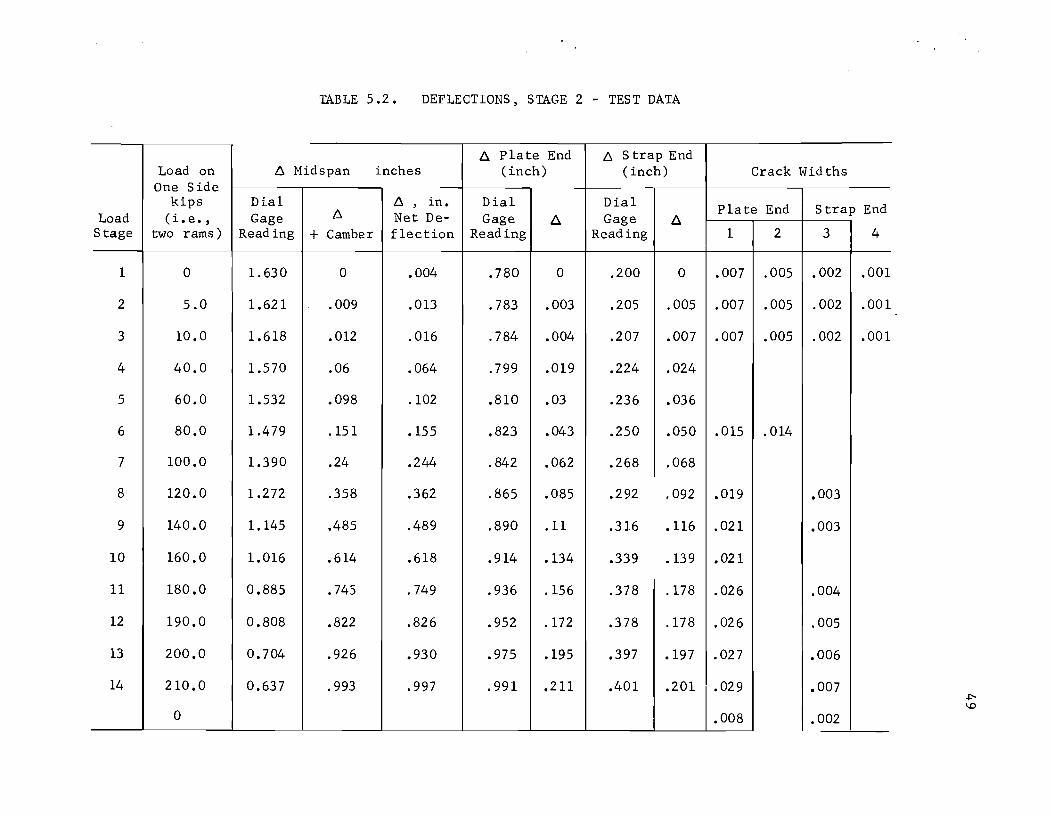
TABLE 5.2. DEFLECTIONS, STAGE 2 - TEST DATA
D. plate End 6 S trap End Load on 6 Midspan inches (inch) (inch)
One Side kips Dial 6 , in. Dial Dial
Load (Le. , Gage 6 Net De- Gage D. Gage D. Stage two rams) Reading + Camber flection Reading Reading
1 0 1.630 0 .004 .780 0 .200 0
2 5.0 1.621 .009 .013 .783 .003 .205 .005
3 10.0 1.618 .012 .016 .784 .004 .207 .007
4 40.0 1.570 .06 .064 .799 .019 .224 .024
5 60.0 1.532 .098 .102 .810 .03 .236 .036
6 80.0 1.479 .151 .155 .823 .043 .250 .050
7 100.0 1.390 .24 .244 .842 .062 .268 .068
8 120.0 1.272 .358 .362 .865 .085 .292 .092
9 140.0 1.145 .485 .489 .890 .11 .316 .116
10 160.0 1.016 .614 .618 .914 .134 .339 .139
11 180.0 0.885 .745 .749 .936 .156 .378 .178
12 190.0 0.808 .822 .826 .952 .172 .378 .178
13 200.0 0.704 .926 .930 .975 .195 .397 .197
14 210.0 0.637 .993 .997 .99l .211 .401 .201
0
Crack Widths
Plate End S trap End
1 2 3 4
.007 .005 .002 .001
.007 .005 .002 .001
.007 .005 .002 .001
.015 .014
.019 .003
.021 .003
.021
.026 .004
.026 .005
.027 .006
.029 .007
.008 .002
~ \0
50
220 .~'
.".~ 200 Second Stoge
computed ~,;/::I'/' .~
teat~ . 180 '~I/
~/' computed . 160
Firat Staqe '7. / t .. t-~'
. I
140 '/ I
~</ 'I I 0) . / P-120 ~' / .... ~
,(/ ~
'" al 0
....1 100
fl . I I I ~;O"
80 . I
I / r---1 . I
First stage • l /, ... ., . /
60 II 9t'~ ~ ~ 12\" ./ I,
Second stage
" ! L H ... g
40 I- 16"0" .1 I 2 I
/
o ·2 ·4 ·6 ·8 '·0 1·2 '·4 '·6 Deflection, inches
Fig 5.1. Deflection at midspan versus load.
220
200
180
160
140
80
60
40
20
o o
"I /
"I I / /
I I I I
I I , I
I " I ,I
'b I " ~I Ib 'II <:c
"'I I", ..... 0'1 Iq q bOo
/ 1::-/ I
I I I I
/ /
/
/" / /
/ /
/ // //
" "I.
I I First stage
, I Second stage I I
I I I I
I I I I
I I I
I I ~
// 12" -oj ~-D'fl,e"O" gag,"
I I I / / I
I I / /
I / / I
I I /1 II II
·04 ·08
Fig 5.2.
·12 ·16 ·20 ·24
Deflection, inch
Deflection near ends versus load.
51
·28 ·32
52
end regions, suggesting that cracking in end regions permitted larger
deflections than uncracked end regions.
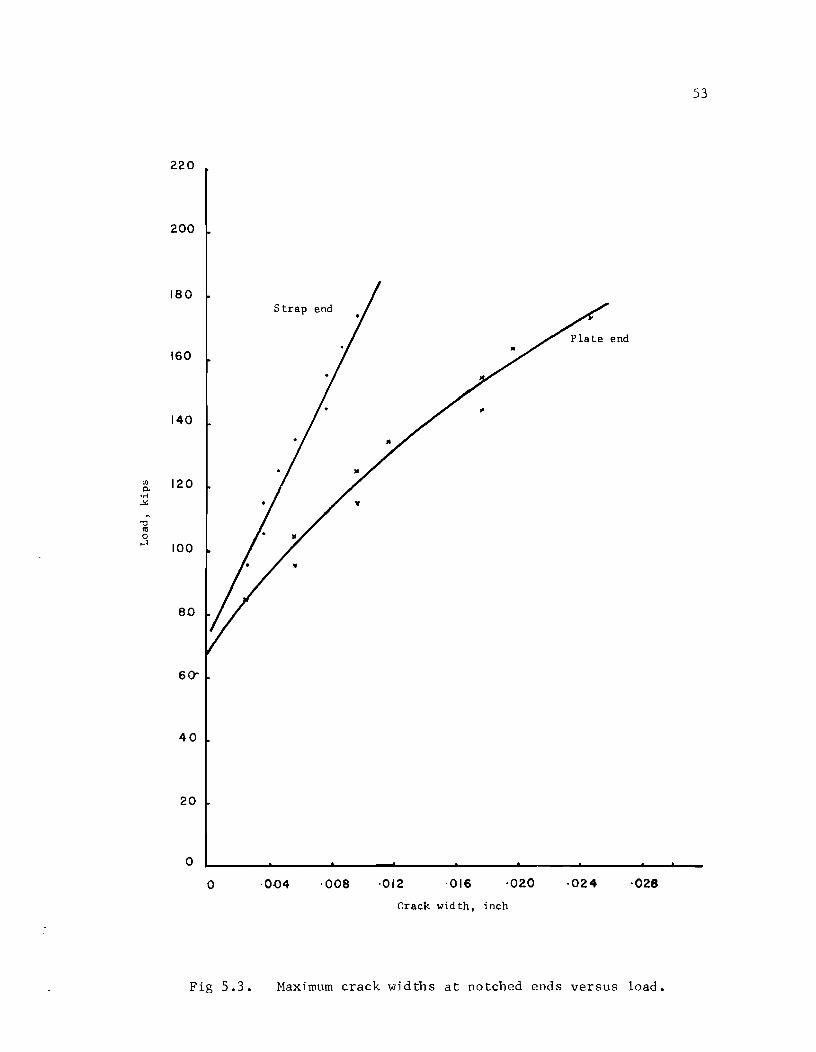
5.3 Crack Widths
A graph showing crack widths at the notched ends versus load is
given in Fig 5.3. Crack widths appear to increase almost linearly with
load. The crack at the plate end increased in width more than twice as
much as the crack at the strap end under the same increase in load. The
rebar and strap arrangement appears to be more effective in controlling
cracks than are the web plates.
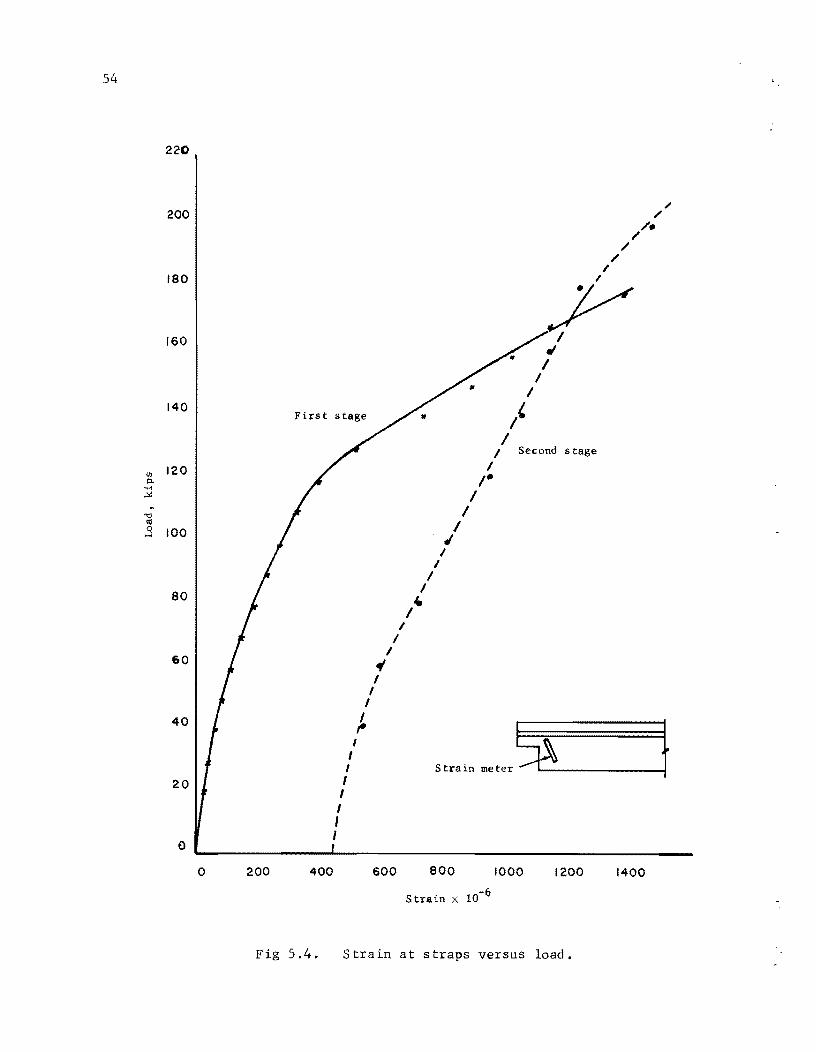
5.4 Strains
5.4.1 Steel strains
The relationship between the strains sustained by the straps are
shown as a function of load in Fig 5.4. In the first stage of the test
the function is distinctly different in two parts. The initial steep
portion indicates the small degree of contribution of steel to the shear
resistance. During this stage the concrete is uncracked and is effective
in resisting shear. The first crack in this region was observed at a 110K
load and the load-strain curve retained its steepness up to this load.
After cracking, the straps had to resist most of the shear load, and the
graph displays a slope about one-sixth of the uncracked region. At
about l75K load the stress in the strap would have reached 38 ksi, corre
sponding to a measured strain of 0.132 percent. On release of load a
residual strain of .044 percent was observed for the strap, suggesting that
the strap had yielded before load was removed.
In the second stage of the test, the strap with an initial strain
of .044 percent revealed a linear load-strain function. It remained linear
to loads above l75K, suggesting that strain hardening may have occurred.
Since concrete was already cracked before the second load stage, the strap
probably had no range of load in which concrete shared force during the
reloading stage.
The second stage of the test started with initially cracked shear
zones. The cracks which formed at the final loads of the first stage of
53
220
200
180 Strap end
160
.. 140
120
100
80
60'
40
20
o o . 0'()4 ·008 ·012 ·016 ·020 ·024 ·028
Crack width, inch
Fig 5.3. Maximum crack widths at notched ends versus load.
54
220
200
180
160
140
!fl 120 p.. ....
.!ol
~
"0 <II 0 100 .....
80
60
40
20
o
o 200
First stage
I
II( I
I I
I
I
~ I
I I I I I ,
I
400 600
I I-
I I
I J
I I
I I
/'
/ /
/ I
I
Y I
I' I
I
.t I
I
I Second stage
'" / /-
Strain ~t" %"---~ -----It 800 1000 1200 1400
S train x 10-6
Fig 5.4. Strain at straps versus load.

55
the test existed across the draped strands. The strands, whose contri
bution to shear resistance was not significant in the first stage of the
test, had to resist in the second stage forces trying to enlarge the crack.
The horizontal stirrups also probably started to resist forces at cracks
immediately upon reloading. Rebar reinforcement may have shared enough
force at the straps to inhibit them from straining, making it appear that
the straps were stiffer in the second stage.
5.4.2 Concrete strains
Compression strains in concrete in the shear compression zone were
measured and are plotted against load in Fig 5.5. The maximum strains
reached were 0.0004 at the saddle plate end and 0.00024 at the strap end.
At each end the compression strains increased linearly with load. The
lower strain in concrete at the strap end implies that the bar reinforce
ment helped resist flexural compression near the notch more effectively
than did the saddle plates at the opposite end.

200
160
co c:>. .....
120 ..>G ~
'tl III 0 H
80
40
0'" o 40 80 120
Fig 5.5.
~ Strain gages '"
~E3 J 160 200 240 280 320 360 400 440
St:rain 10-6
Concrete strain at notched ends versus load.
VI 0'\

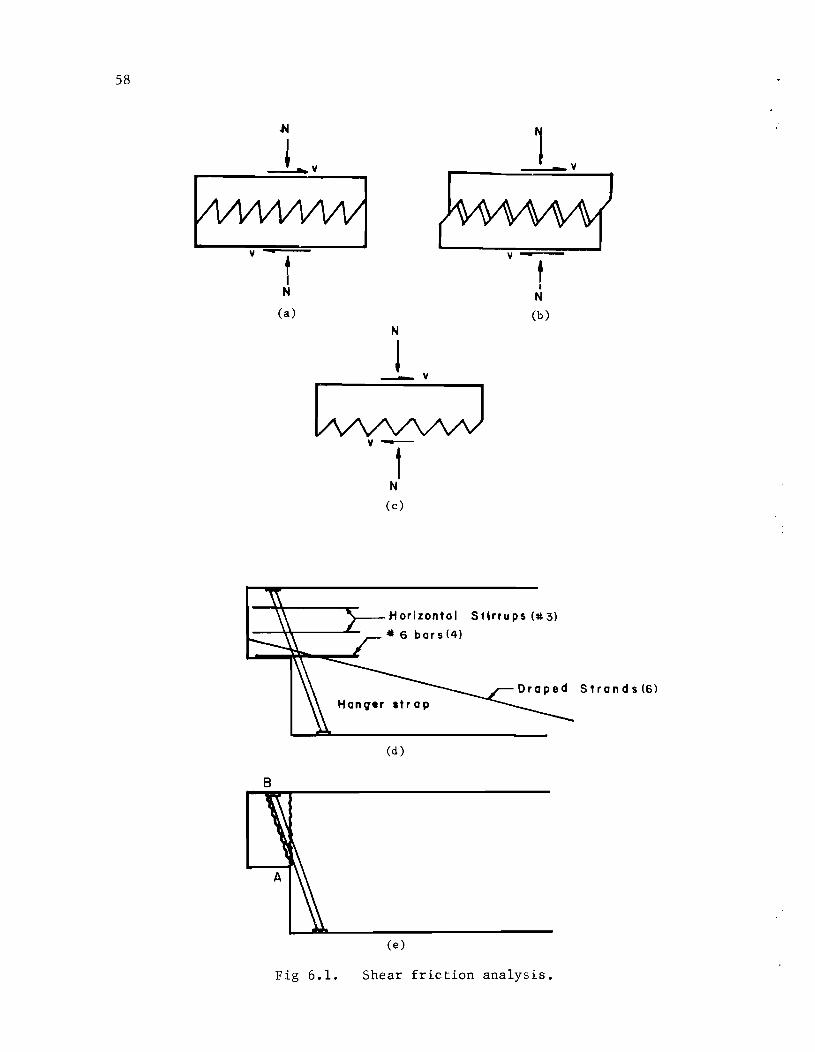
CHAPTER 6. SHEAR STRENGTH OF NOTCHED END
6.1 Shear Friction
6.1.1 The concept
The theory of shear friction is based on the concept that shear is
resisted by sliding resistance between the interfaces of concrete along a
potential surface for a shear failure. This hypothesis was originally
suggested by Phillip W. Birkeland and Halvard W. Birkeland as a tool for
the design of connections between two heavily loaded structural members
where a sliding shear interface can exist (3). As indicated in Figs 6.la,
6.lb, and 6.lc, a failure by sliding is considered to be resisted by a
frictional force which can be taken as the product of the normal force N
and a coefficient of sliding friction ~. Reinforcement that crosses the
shear face provides the normal force N. The values of ~ suggested by
Birkeland were 1.7 for monolithic concrete, 1.4 for artificially roughened
construction joints, .8 to 1.0 for smooth concrete construction joints and
concrete to steel interfaces. On the basis of further investigations,
ACI 318-71 stipulates the following values for ~.
Concrete cast monolithically 1.4
Concrete placed against hardened concrete 1.0
Concrete placed against as-rolled
structural steel 0.7
The Building Code also restricts the yield strength of reinforce
ment to a maximum of 60 ksi in the determination of the steel capacity to
maintain the normal force N .
6.1.2 Application to the notched end
In the notched end that contained hanger straps, there are
principally three reinforcement systems penetrating the shear plane as
shown in Fig 6.ld. These are (1) the hanger straps inclined at an angle
of 15 0 from the vertical, (2) horizontal 4F6 bars welded to the bearing
57
58
[1IWVW1 v q f
N
(a)
N
! _v
Hanqer .trap
(d)
(e)
~ V Q
t I
N
(b)
Stirrups (#3)
Ora p e d S t ran d s (6)
Fig 6.1. Shear friction analysis.
59
plate and 4t3 horizontal stirrups, and (3) the draped prestressing strands.
A vertical shear plane with a crack starting at the notch (F 6. Ie) is
unlike ly to form a crack since all major systems of reinforcement cross it.
In contrast the plane AB parallel to the straps is penetrated only by
the 4t6 bearing plate bars and the strands. It is the most likely plane at
which a crack could be assumed for a shear friction analysis. The value
of ~ would be 0.7 at the edge of straps, but it could be 1.4 everywhere
else. The of straps occupies l/l2th of the width. A weighted average
value for !..1
conservative.
I 11 can be taken as x. 7 + 12 "" 1.4 = 1.34 or 1.3 to be
Modification for the value of the friction coefficient ~ has been
suggested in the PCI Design Handbook, Eq 6.5, reproduced below:
LL I 300hl,
u (-- + 0.5) v u
where
~' modified value of the friction coefficient.
v V / ¢A u u cr
A = area of the shear plane cr
The above modification is possible only if
case under discussion, assuming
v u
200;~ 1000 237
1.34
1.3
V == 200K , u
844 ps i
+ .5)
v u
i::; known. In the
The beam ordinarily will be subjected to a longitudinal force in
addition to the vertical reaction R. This longitudinal force is created
by shrinkage and creep of the superstructure of the bridge, drag due to
vehicle movement, and the resistance of frictional force at the bearings.
A minimum value equal to 20 percent of the vertical reaction is advised by
the ACI Building Code, and that value will be used in the calculations.

60
The force N normal to the assumed failure plane can be calculated
as follows:
Nl from 4F6 bars (4 X .44 X 60) cos 150 102 k
N2 from 4F3 stirrups = (2 x .22 X 60) cos 150 = 25.5 k
N 3 from strands
N4 from reaction R
and longitudinal
force
Total Normal force N
Frictional force F
(6 X .153 X 60) sin 630 49.0 k
(R sin 150
- .2R cos 15 0) =
.066R k
(176.5 + .066R) k
1.3 (176.5 + .066R)
(229.5 + .0858R) k
Equating F to the component of the applied load parallel to
the shear plane, (229.5 + .0858R) = R cos 150
R = 260 k > 205 k measured maximum value from test
The above calculation indicates that failure along a shear friction
plane would have been unlikely even with a longitudinal force. The number
of ~6 bars welded to the bearing plate appears to have been excessive for
the laboratory model which did not involve a longitudinal force.
The above procedure with the shear friction hypothesis could be
used as a first step in estimating the area of horizontal steel that is to
be welded to the bearing plate.
6.2 Diagonal Tension
6.2.1 Mode of failure
A diagonal crack that starts at the re-entrant corner of the notch
could extend towards the compression face of the beam. The specific
diagonal angle at which the crack propagates will follow the path of least
resistance. Several possible cracks can be studied in terms of a distance
d measured from the corner of the notch longitudinally along the beam to cr
61
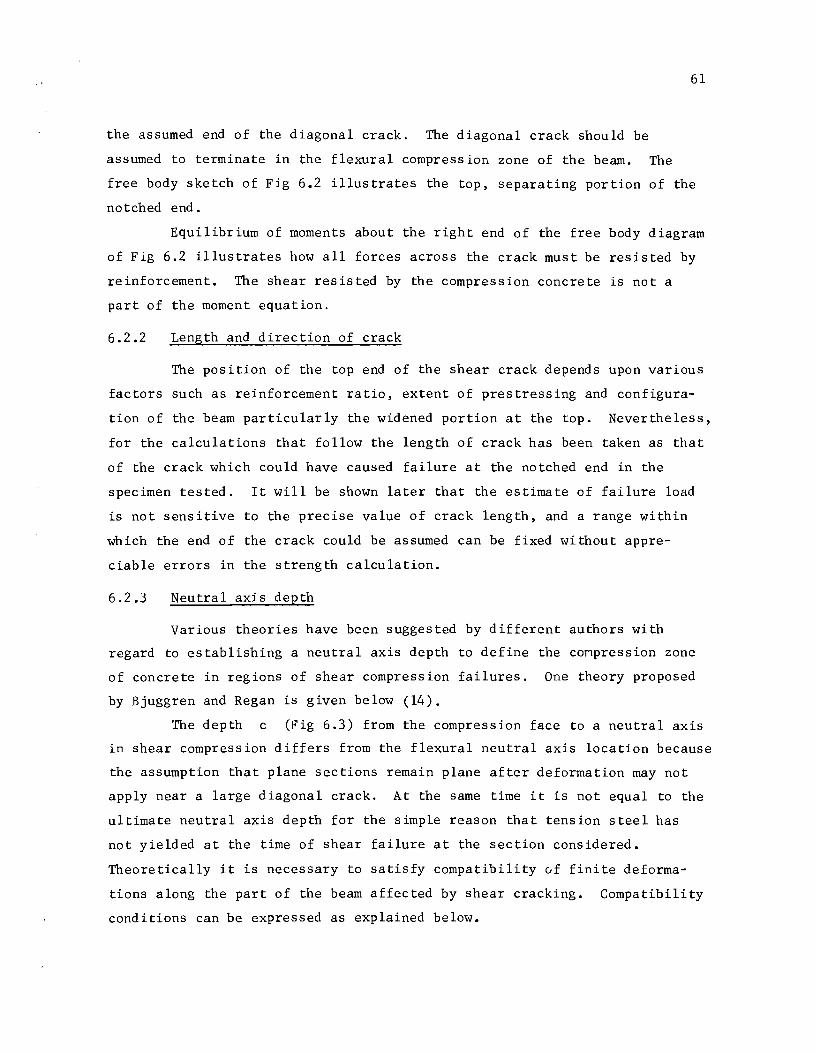
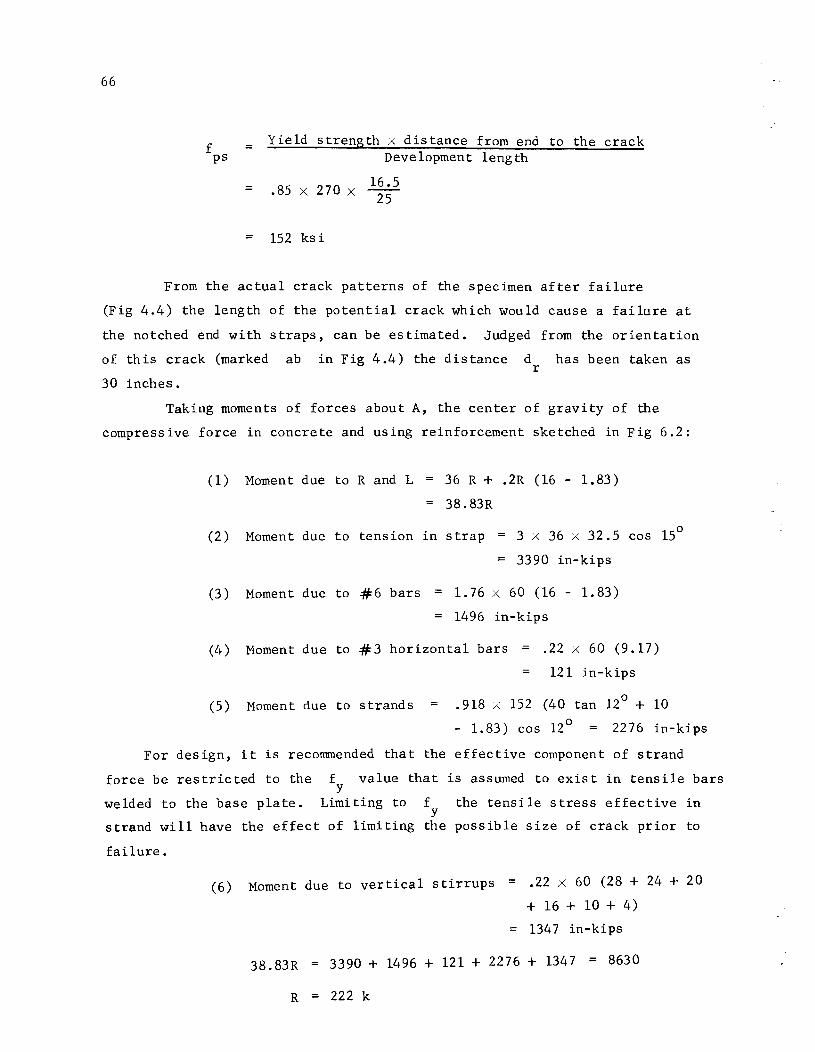
the assumed end of the diagonal crack. The diagonal crack should be
assumed to terminate in the flexural compression zone of the beam. The
free body sketch of Fig 6.2 illustrates the top, separating portion of the
notched end.
Equilibrium of moments about the right end of the free body diagram
of Fig 6.2 illustrates how all forces across the crack must be resisted by
reinforcement. The shear resisted by the compression concrete is not a
part of the moment equation.
6.2.2 Length and direction of crack
The position of the top end of the shear crack depends upon various
factors such as reinforcement ratio, extent of prestressing and configura
tion of the beam particularly the widened portion at the top. Nevertheless,
for the calculations that follow the length of crack has been taken as that
of the crack which could have caused failure at the notched end in the
specimen tested. It will be shown later that the estimate of failure load
is not sensitive to the precise value of crack length, and a range within
which the end of the crack could be assumed can be fixed without appre
ciable errors in the strength calculation.
6.2.3 Neutral axis depth
Various theories have been suggested by different authors with
regard to establishing a neutral axis depth to define the conpression zone
of concrete in regions of shear compression failures. One theory proposed
by Bjuggren and Regan is given below (14).
The depth c (Fig 6.3) from the compression face to a neutral axis
in shear compression differs from the flexural neutral axis location because
the assumption that plane sections remain plane after deformation may not
apply near a large diagonal crack. At the same time it is not equal to the
ultimate neutral axis depth for the simple reason that tension steel has
not yielded at the time of shear failure at the section considered.
Theoretically it is necessary to satisfy compatibility Gf finite deforma
tions along the part of the beam affected by shear cracking. Compatibility
conditions can be expressed as explained below.
-(0
=(1)
I d = 3011
• cr 4 _1.Li
Jflc ---
. o~ c<'C'<- T e . -t-e'\\SJ..
-0
2'*3
O .. 2RI ; VI :r--=-.:- -.L ~ 4 .. JS" 4" I 4" 6'1 .. ell
------- ------~ ----
Fig 6.2. Forces acting on free body.
0\ N

R
Fig 6.3.
2
c
2
Depth of neutral axis (referenced in 6.2.3).
63
R

64
Since section 1-1 as shown in Fig 6.3 undergoes only negligible
deformation during loading and section 2-2 is a plane section which remains
plane, the neutral axis depth c at section 2-2 is given by the equation
where
c = 6.cc l-c 6.st
6.cc = deformation of extreme concrete fiber between
sections 1 and 2 and
6.st = deformation of tension steel between
sections 1 and 2.
By the above definition the value of c can be calculated from
measurements of strains in concrete and steel where these data are known.
The end of the beam is required to resist moments that are not
adequate to cause flexural steel to yield nor flexural concrete stress to
reach very large values. Consequently an analysis of cross section
properties at section 2-2 based on the elastic behavior of a cracked
section should be relevant at a distance of perhaps one beam depth away
from the notch. Cross section properties and calculations for the location
of a neutral axis are illustrated in Fig 6.4. The modular ratio n was
taken as 6.3.
6.2.4 Calculation of capacity R
In the calculations that follow, it is assumed that all steel
acroSS the crack except the strands yield before failure. Near the end of
the beam the strand may not be able to develop its full yield strength, and
the strand stress should be limited to the developable amount. The
development length of the l/2-inch strand was taken as 50 diameters or
25 inches. Therefore the allowable stress in the strands is calculated as
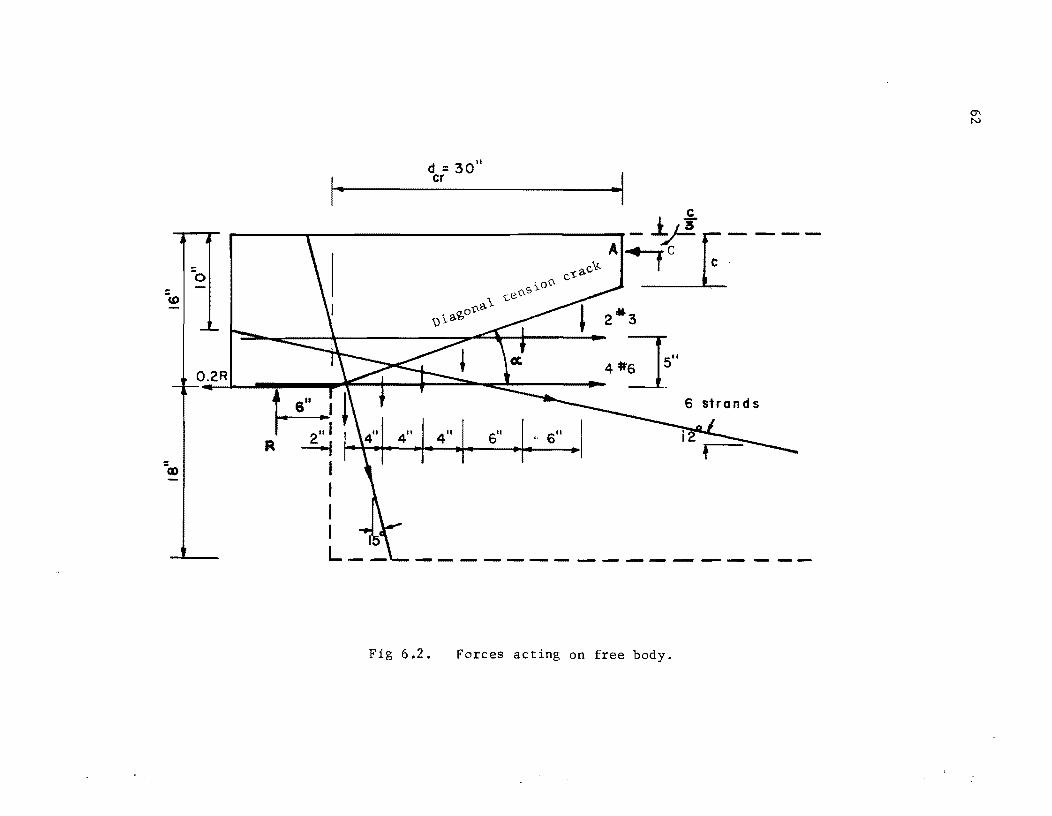
Modular Ratio n =
=
Ec 29000 4635
6.3
Taking moments of areas of concrete and transformed area of
steel about the neutral axis,
c 18 X c X 2 = .918 x 6.3 (18.53 - c) + 1.224 X 6.3 (31 - c)
9c2 = 344 - 13.1 X c
c = 5.48 in.
I-40" Al
Axis I .. 18" .. I
=~ -It)
~ CD
= -1;t -It) .2 It)
. 918 In -.2
1.224 In -~ .J
SECTION AA
Fig 6.4. Depth of neutral axis.
65
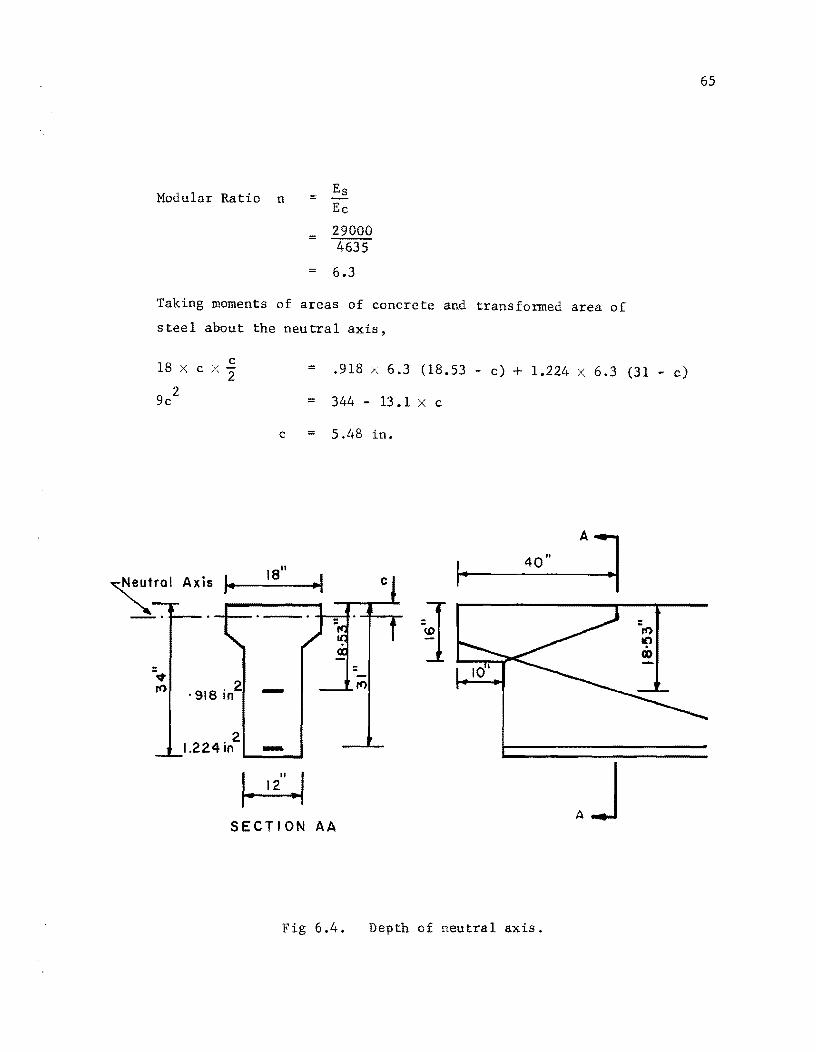
66
f ps = Yield strength X distance from end to the crack
Development length
= .85 x 270 X 16.5 25
= 152 ksi
From the actual crack patterns of the specimen after failure
(Fig 4.4) the length of the potential crack which would cause a failure at
the notched end with straps, can be estimated. Judged from the orientation
of this crack (marked
30 inches.
ab in Fig 4.4) the distance d has been taken as r
Taking moments of forces about A, the center of gravity of the
compressive force in concrete and using reinforcement sketched in Fig 6.2:
(1) Moment due to Rand L 36 R + .2R (16 - 1.83 )
38.83R
(2 ) Moment due to tension in strap 3 x 36 x 32.5 cos 150
= 3390 in-kips
(3 ) Moment due to #6 bars 1.76 x 60 (16 - 1.83 )
1496 in-kips
(4) Moment due to #3 horizontal bars .22 X 60 (9.17)
121 in-kips
(5) Moment due to strands == .918 X 152 (40 tan 120 + 10
o - 1.83) cos 12 2276 in-kips
For design, it is recommended that the effective component of strand
force be restricted to the f value that is assumed to exist in tensile bars y
welded to the base plate. Limiting to f the tensile stress effective in y
strand will have the effect of limiting the possible size of crack prior to
failure.
(6) Moment due to vertical stirrups .22 x 60 (28 + 24 + 20
+ 16 + 10 + 4)
1347 in-kips
38.83R := 3390 + 1496 + 121 + 2276 + 1347 = 8630
R = 222 k
67
The value of R increases to 240K if L, the longitudinal force,
is not present.
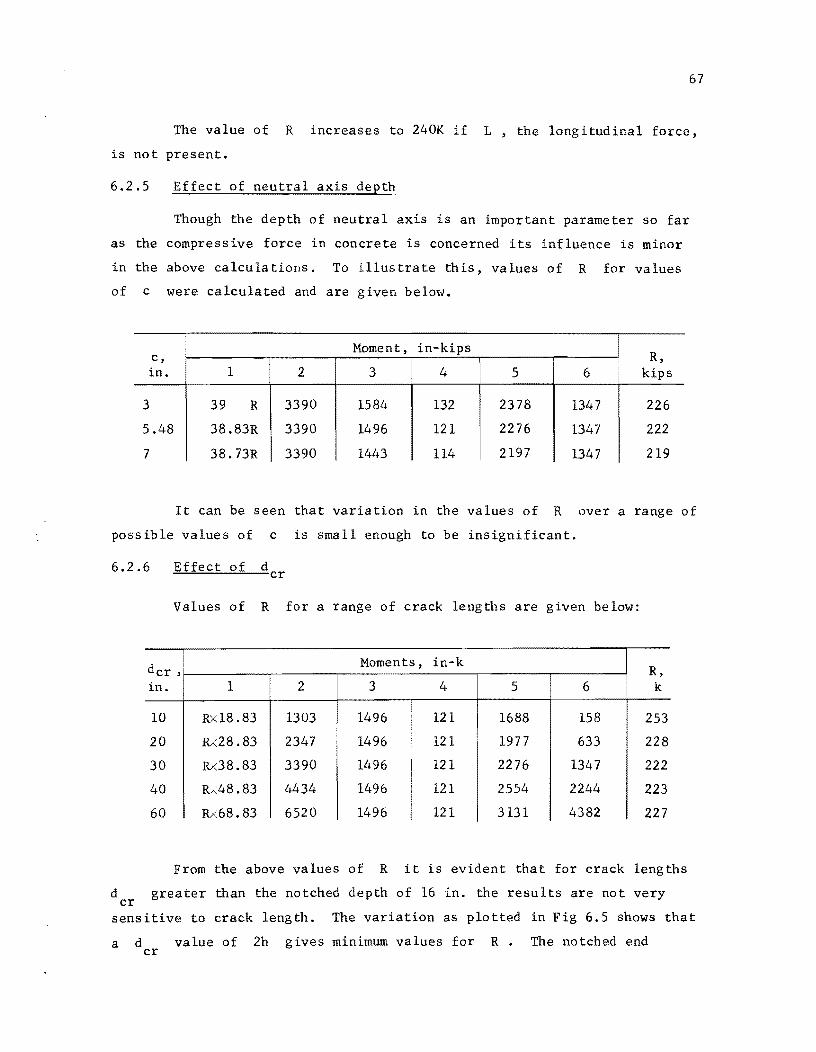
6.2.5 Effect of neutral axis depth
Though the depth of neutral axis is an important parameter so far
as the compressive force in concrete is concerned its influence is minor
in the above calculations. To illustrate this, values of R for values
of c were calculated and are given below.
Moment, in-kips R, c,
in. 1 2 3 4 5 6 kips
3 39 R 3390 1584 132 2378 1347 226
5.48 38.83R 3390 1496 121 2276 1347 222
7 38.73R 3390 1443 114 2197 1347 219
It can be seen that variation in the values of R over a range of
possible values of c is small enough to be insignificant.
6.2.6 Effect of dcr
Values of R for a range of crack lengths are given below:
dcr , Moments, in-k R,
in. 1 2 3 4 5 6 k
10 Rx18.83 1303 1496 121 1688 158 253
20 Rx28.83 2347 1496 121 1977 633 228
30 RA38.83 3390 1496 121 2276 1347 222
40 ~48.83 4434 1496 121 2554 2244 223
60 Rx68.83 6520 1496 121 3131 4382 227
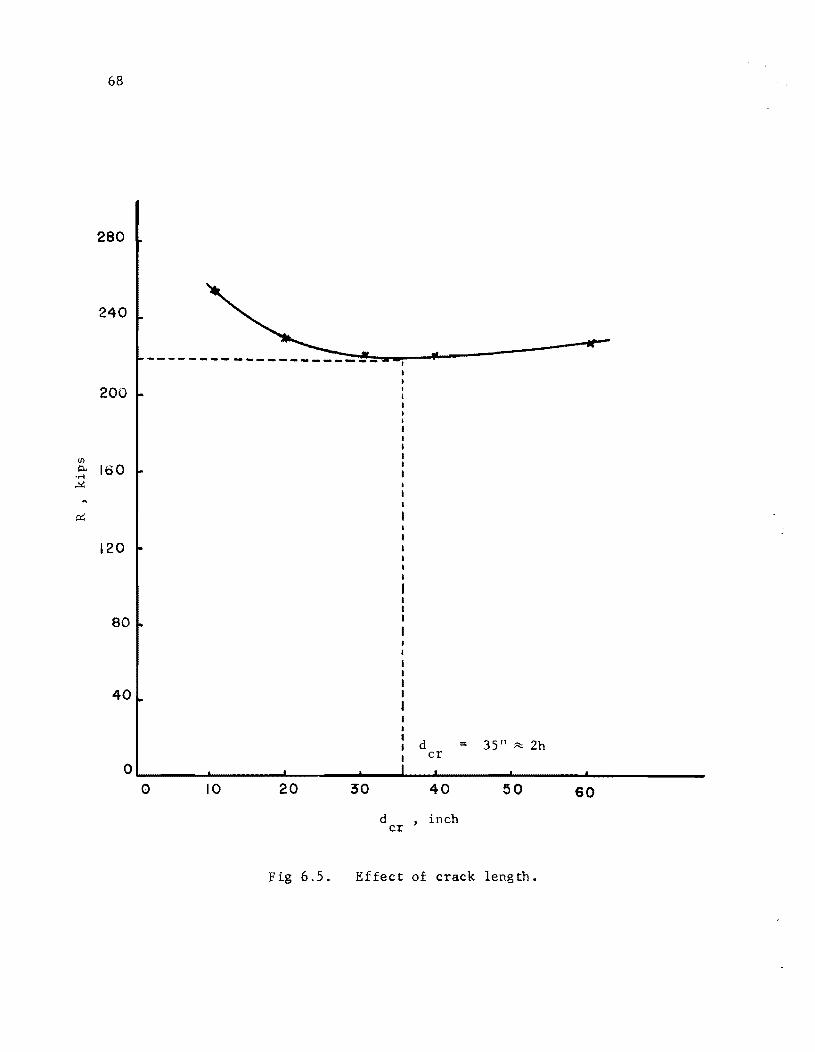
From the above values of R it is evident that for crack lengths
d greater than the notched depth of 16 in. the results are not very cr
sensitive to crack length. The variation as plotted in Fig 6.5 shows that
a d value of 2h gives minimum values for R. The notched end cr
68
280
240
200
rn .~ 160 ~
120
80
40
~ .-- - - - - - - - - - - - - - - - - -:-:-::-!:~-=---I"I-"I--'''&''''--------''''''111'-
d = 35":=:;:; 2h cr
o~ ____ ~ ______ ~ ______ ~ __ ~ __ ~ ____ ~ ______ ~ __________ _ o 10 20 30 40 50 60
d ,inch cr
Fig 6.5. Effect of crack leng th.

height h should include the thickness of a composite slab if the shear
capacity is to include the live load which must be resisted by the full
composite cross section.
6.3 Design Procedure
69
On the basis of the two potential failure modes, one with a shear
friction separation parallel to inclined strap reinforcement, and the other
with a shear-compression separation from the corner of the notch into the
flexural compression zone of the end block, a procedure for designing
notched end reinforcement becomes apparent. Horizontal bars in the side
faces of the end block above the notch plus bars welded to a bearing plate
at the notch can be proportioned to satisfy bracket design recommendations
of Sections 11.14 and 11.15 in the ACI Building Code. The size of inclined
strap hangers then can be determined from the required capacity to balance
ultimate forces from steel including straps that cross the potential shear
compression crack.
A sample design will be used to illustrate the procedure. It is
assumed that the sole purpose for using a notch is to allow a "standard"
beam to be used with an elevated support shelf in order that a continuous
top or bottom profile may be maintained in the structural assembly.
Therefore it may be further assumed that an end block region with vertical
and horizontal reinforcement adequate for shear is already d3signed. The
design example illustrates only the modifications of end block details to
accommodate the notch.
For this example a 54-in.-deep standard section of the Bureau of
Public Roads (15) will be taken as the standard member for which a notched
end is desired. The maximum span for this pretensioned girder is given
as 70 feet for a 28-ft roadway. Details of all reinforcement, design loads
and material strengths are given in the referenced document. All strands in
the reference stringer are straight. In order to illustrate the role of
draped strands it will be assumed that 14 strands are draped with two drape
points 5 feet on either side of the midspan. Cross section details and
strand drape dimensions are as shown in Figs 6.6a and 6.6b. Dimensions
assumed at the notch also are given in Fig 6.6b.
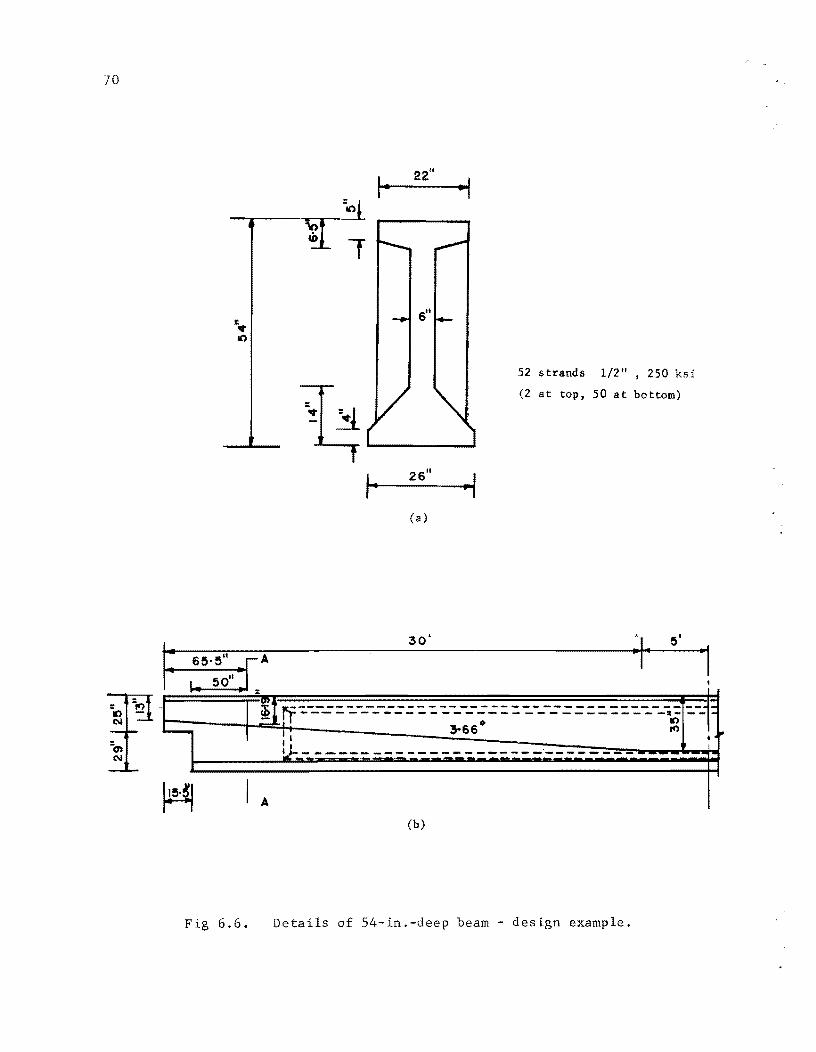
70
22/1
2S"
(a)
30'
.. ,
52 strands 1/2", 250 ks i
(2 at top, 50 at bottom)
'\
-:a! ~ ~I. '!liJ ~-:.-_-= - -:.-_-_-:= =:.:. -:.~~-;=:.:. -:. -_-= = =:.:.:.:.:.-:. -_.~ :.-_ •
=c".: · N ~-- ------------ -------------
(b)
Fig 6.6. Details of 54-in.-deep beam - design example.

Calculations:
d cr
2 h = 2 X 25
Depth of neutral axis
at 50 in. from notch
50 in.
9.5 in.
(For procedure for calculating depth, see Fig 6.4)
Inclination of crack = -1 15.5 tan ----so- =
71
The strap is positioned perpendicular to the crack but in any case
the strap end at the top should be located above the center of the bearing
for the stringer. See Fig 6.7a.
From the details of service loads given in the reference document
ultimate load reaction at the notched end is calculated as
Reaction (1.35 x 48.6) + 2.25 (43.2 + 11.1)
188 k
Longitudinal
force at bearing .2 x 188 37.6 k
Calculation of horizontal steel by shear friction analysis
A shear plane is assumed as parallel to the hanger strap. Refer to
Fig 6.7b.
Applied shear force at crack
Applied normal force at crack
v u
p u
=
179.6 + 11.0
190.6 k
55.6 35.9
19.7 k
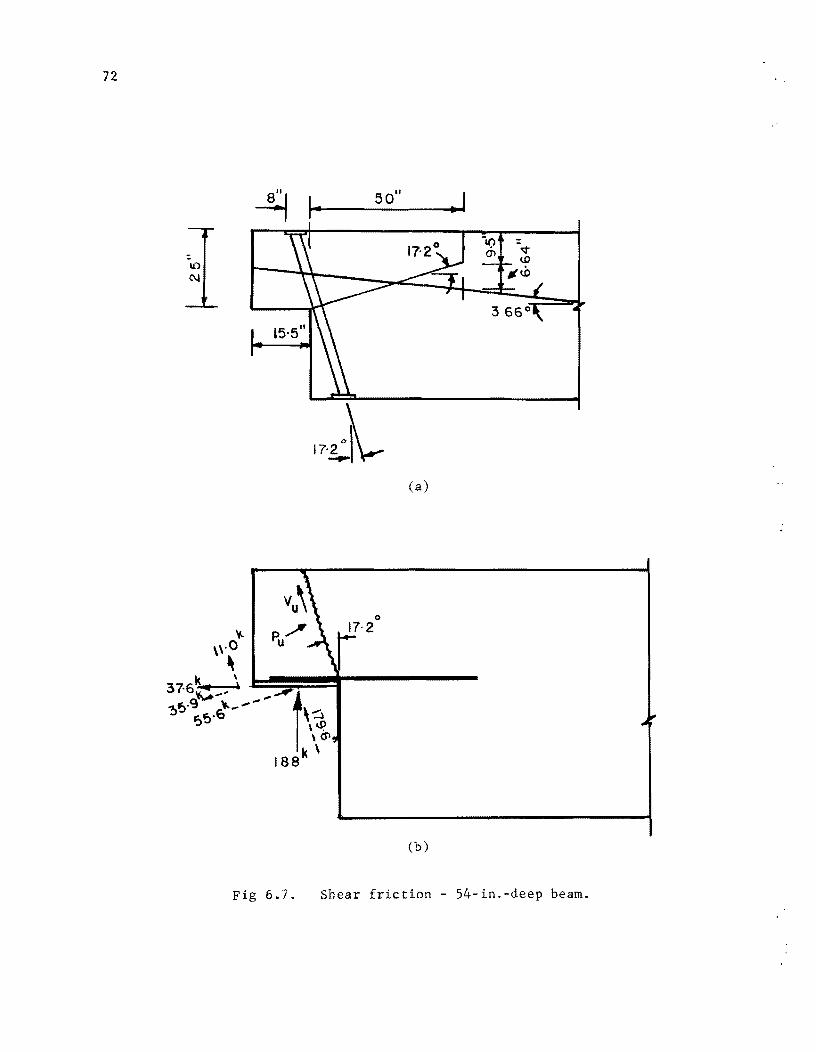
72
.. ,
(a)
(b)
Fig 6.7. Shear friction - 54-in.-deep beam.
Check maximum v u
Required reinforcement Avf
for the shear friction force
Strand contribution to Avf
Additional horizontal
steel required
= 190.7 cos 17.2 24 X 22
73
= .345 < 0.840 ksi O,K.
= 1 ¢F
Y
= 1 (191
0.4.7_ 19.7)
.85 x 60
= 2.28 in. 2
=
=
=
~4( .08)
3.04 in.2
cos (17.2 + 3. 7 ~ 152
X 60
(or 1/3 Avf '
whichever is smaller)
2 2.28 - x 3 cos 17.2
1.59 in. 2
Specify 3 7¥7 bars welded to plate 1.80 in. 2
Calculation of hanger strap area (Fig 6.8a)
(52.3 + 1.8) F
S trap force,
With A36 s tee 1 >
A s tp
Use 4 straps
F
188(58) + 37.6(21.83) - 6(.40)(26)(60)
- 14(.080)(60)(13.02) cos3.7 - 1.80(60)(20.39)
90.6 k
90.6 ¢ 36 =
3 in. x 1/4 in.
2.96 in. 2
or 2 straps 3 X 1/2
Anchor plates for straps: See Fig 6.8b for relative amount of
congestion at straps

74
65-1/2"
7-1/2'1 58"
--~~----------------------~
I
Isskl I I I L __
r
9"45
(a)
..
(b-l)
2 straps 1/2 - inch thick require heavier anchor plate
I
oJ
II .. II 6xl'!5x20 Plate
I
S"X, 7 5"x 20 11 Pia t e
-II
2-1/2" I .. 5 " .. ~. 5 J.5 "j 2-1/2"
20" (b-2)
4 straps 1/4-inch thick require thinner anchor plate
Fig 6.S. Analysis for strap area.
75
Moment on anchor plate M u
90.6 20 x
(2 .5) 2
2 = 14.2 in.-k
Thickness of 6-in. plate 6(.85)(36.0)
6 X 14.2 0.68 in.
Use 3
6 X 4 X 20-in. plate
6.4 Computer Methods
As indicated earlier in Chapter 2, various discrete element models
of the notched end block were analyzed using the computer program 'LINFIX.'
The following basic assumptions were made in modeling.
(1) A reinforced concrete member can be conceived of as a frame
or truss consisting of members with stiffness properties
concentrated along their centroidal axes.
(2) Each truss member is assumed to represent one-fourth of the
concrete and one-half of the steel occurring within the
area between the two adjacent truss members on either side
of it, as indicated in Fig 6.9.
(3 )
(4 )
Transformed section properties can be assigned to each
member with appropriate values of E and E c s
~he continuity between the end block and the rest of the
beam can be represented by a set of supports. rtS indicated
in Fig 2. 6a, all the nodes on a vertical line at the left
end are considered as supports with one hinge at the top
node and the rest with rollers to allow for rotation and
vertical deflection.
(5) Prestressing can be represented by external loads applied
at appropriate joints. For a pretensioned beam these could
be calculated in proportion to the distance from the end of
. the strand, assuming that the full prestress develops
within a length of 50 diameters of the strand.
(6) On application of load, if the tensile force in a truss
member exceeds the concrete capacity the member should
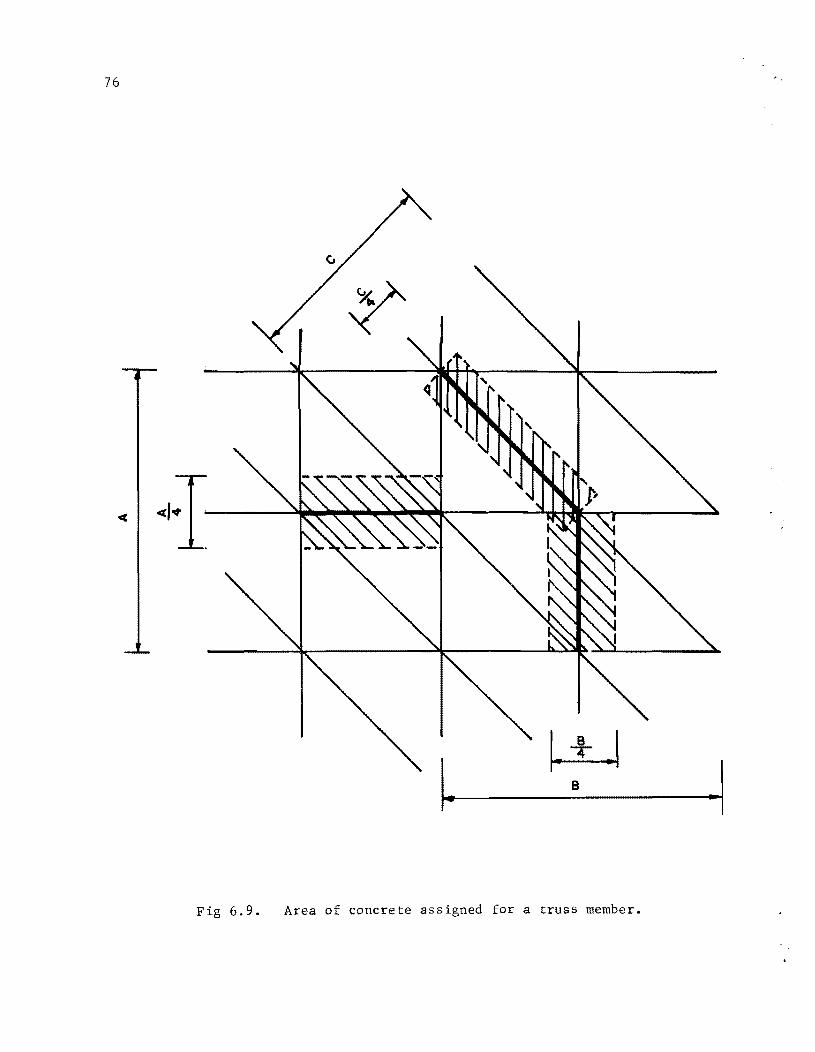
76 , .
I. I· ~ .1
B -I
Fig 6.9. Area of concrete assigned for a truss member.

either be disconnected by assigning negligible values for
its properties if the member consists of concrete alone; or
be converted to a steel member by assigning the properties
of the reinforcement.
77
Following the basic assumptions as described, the end block of the
prototype beam was modeled in different patterns and analyzed using the
computer program. Results for one of the models are contained in
Appendix H. The hatched lines in Fig 6.10 are the truss members which are
overtensioned beyond the tensile capacity of concrete. These were either
reinforced in stages or disconnected depending upon their positions and the
magnitude of stress in them. Results from this analysis also confirmed
that the horizontal stirrups were not sharing much load and hence their
quantity could be reduced.
The test specimen design with reduced reinforcement was analyzed.
Appendix I contains computed member stresses. Figures 6.11 and 6.12 show
the cracked members cross-hatched. The load applied was SOK followed by an
additional SOK. Figure 6.13 shows an approximate layout of expected
cracking. The cracks are assumed to form across the overtensioned members.
The crack pattern obtained based on the analytical study is in general
agreement with the test results shown in Fig 4.4.
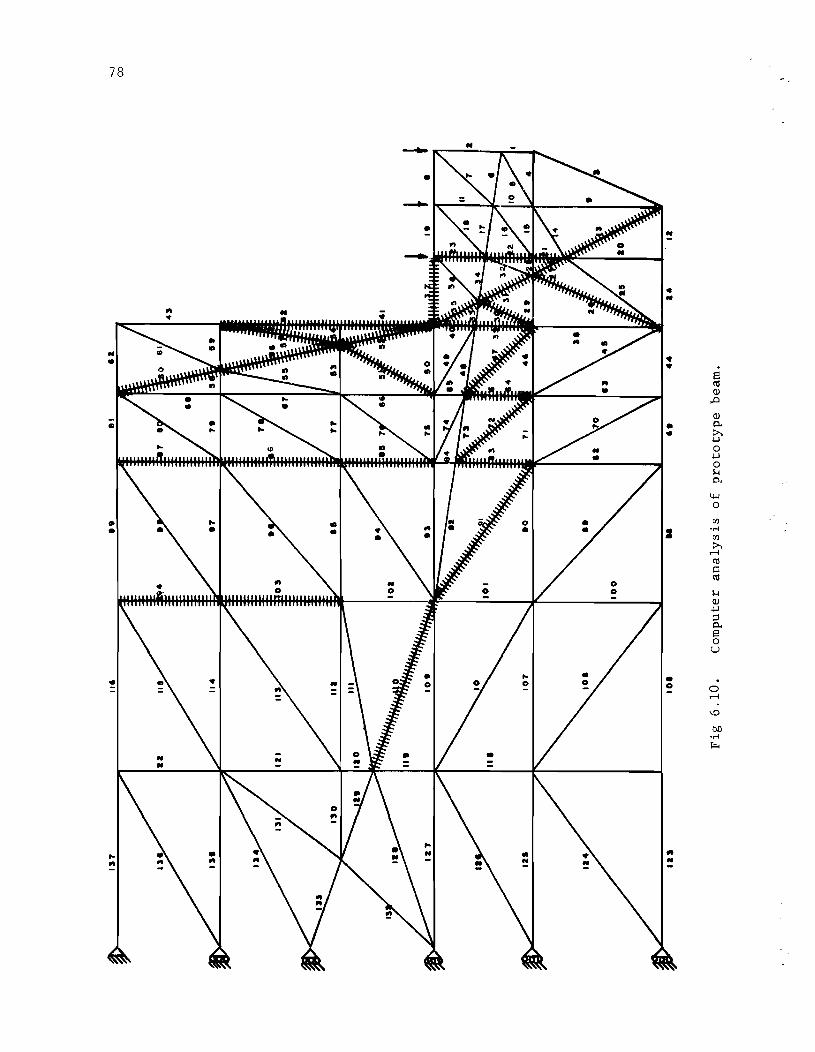
78
• .. 8 I'll Q)
,.0
Q)
• c.. • :>..
.j..J
0 .j..J
0 1-1 c..
4-l 0
(IJ . ...; (IJ
:>.. .--I I'll c: I'll
1-1 Q) .j..J
::I c.. S 0 u
0 .--I
\.0
bD . ...; ~
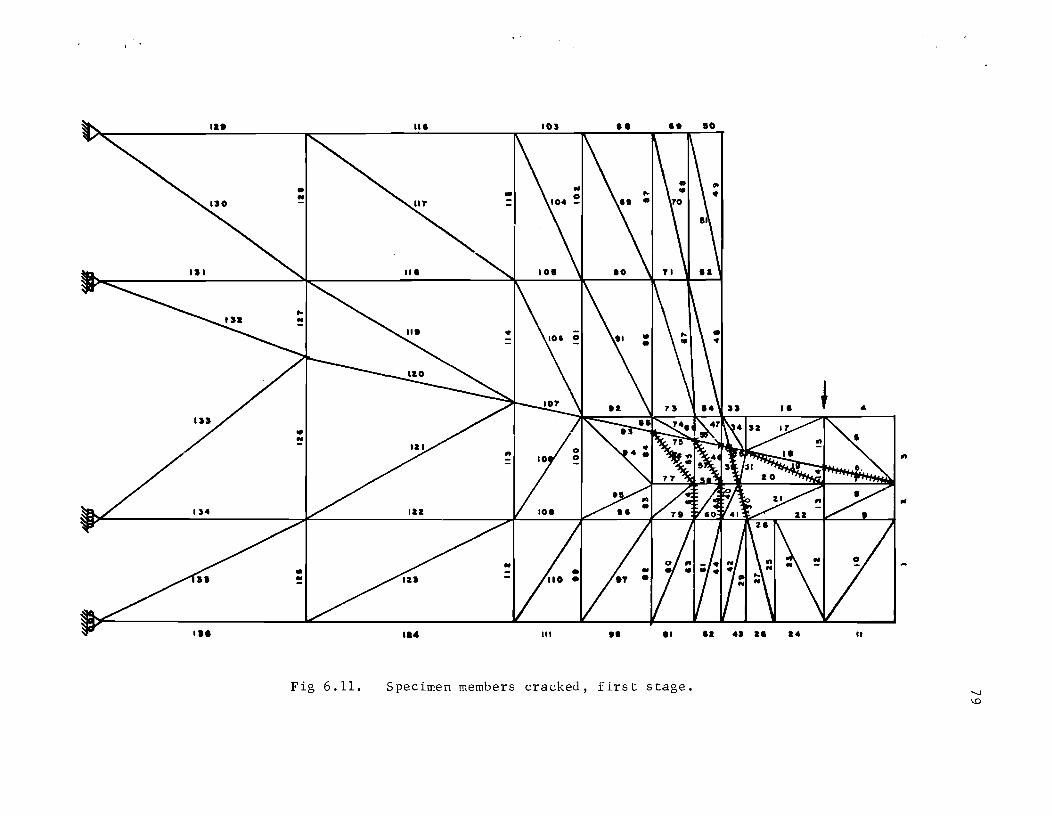
Fig 6.11. Specimen members cracked, first stage.
"
..
-....J \0

80
'0 t:: o (J Qj
CIl
CIl 1-4 Qj
~ Qj
E
t:: Qj
E 0.., (J Qj
0.. [J)

Fig 6.13. Cracks as predicted by computer analysis (figure reversed for comparison with Fig 4.4).
"
..
CX> t-'


CHAPTER 7. RECOMMENDATIONS
7.1 Analytical Study
A two-dimensional stress analysis of the notched block modeled by
discrete elements is useful for identifying the load paths and resulting
crack propagation. For problems of this nature it helps the designer to
locate the tensile zones where reinforcement is necessary. However, this
method does not appear practical for predicting the ultimate load capacity,
nor for common design circumstances.
7.2 Test Study
Based on test results the following recommendations are made.
(1) Shear at the notched ends can be supported by provision of
structural steel inclined straps plus horizontal bars
welded to a bearing plate. The bearing plate and bars plus
the inclined straps need not constrict the placement of
concrete in the notched end region.
(2) A design with web plates was employed in order to transfer
with steel plates the stress concentrations from the
notched end into the region of full member depth. The use
of two large web plates involved the minimum interruption
of cross section space and the simplest details of rein
forcement for the end block region. The web plate rein
forcement performed adequately, resisting the total load
applied before the beam itself failed in shear. However,
there were more cracks and larger crack widths in the web
plate reinforced end than in the strap and rebar rein
forced end. It is felt that the web plate assembly also
involves more expense than does the strap and rebar rein
forcement detail.
83

84
7.3 Design of Notched End Reinforcement
Two mechanisms of potential failure should be considered in order
to establish reinforcement requirements in the notched end region of a
beam. The design procedure recommended here assumes that an end block
region of a standard beam has been functioning successfully, and the same
type member is to be modified for a notched end bearing. A steel strap
hanger is to be inclined from the midpoint of the notched region above the
bearing to the bottom of the end block region in the deep part of the beam.
7.3.1 Step 1
The bars that must be welded to the bearing plate can be designed on
the basis of bracket shear friction requirements at an assumed shear plane
along the exterior edge of the inclined strap hanger assembly. Additional
horizontal bars into the end block above the notch should also fulfill
bracket design recommendations.
7.3.2 Step 2
Retain the longitudinal spacing of vertical stirrups for the end
block without a notch, and compute the required area of steel in inclined
straps in order to resist forces on a free body of the flexural com
pression region of the notched end. The free body, as described in
Chapter 6, is bounded by a potential crack from the root of the notch into
the compression zone of the end block.
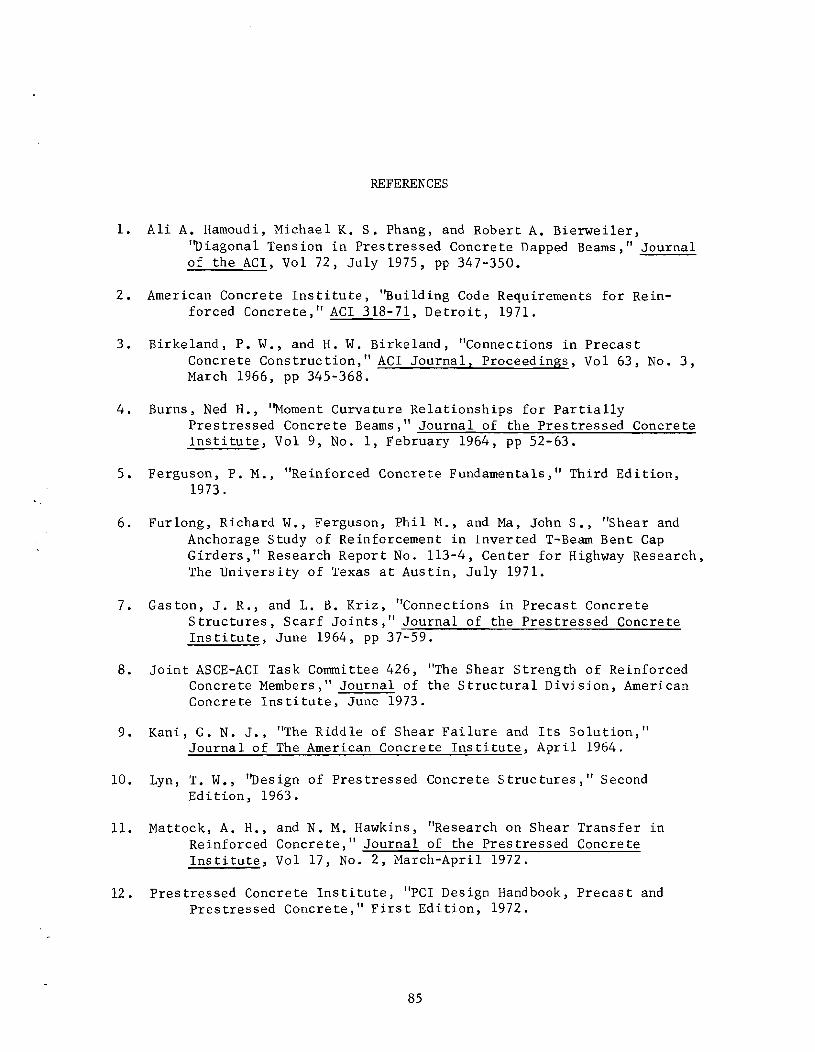
REFERENCES
1. Ali A. Hamoudi, Michael K. S. Phang, and Robert A. Bierweiler, ''Diagonal Tension in Prestressed Concrete Dapped Beams," Journal of the ACI, Vol 72, July 1975, pp 347-350.
2. American Concrete Institute, "Building Code Requirements for Reinforced Concrete," ACI 318-71, Detroit, 1971.
3. Birkeland, P. W., and H. W. Birkeland, "Connections in Precast Concrete Construction," ACI Journal, Proceedings, Vol 63, No.3, March 1966, pp 345-368.
4. Burns, Ned R., '~oment Curvature Relationships for Partially Prestressed Concrete Beams," Journal of the Prestressed Concrete Institute, Vol 9, No.1, February 1964, pp 52-63.
5. Ferguson, P. M., "Reinforced Concrete Fundamentals," Third Edition, 1973.
6. Furlong, Richard W., Ferguson, Phil M., and Ma, John S., "Shear and Anchorage Study of Reinforcement in Inverted T-Beam Bent Cap Girders ,II Research Report No. 113-4, Center for Highway Research, The University of Texas at Austin, July 1971.
7. Gaston, J. R., and L. B. Kriz, '~onnections in Precast Concrete Structures, Scarf Joints," Journal of the Prestressed Concrete Institute, June 1964, pp 37-59.
8. Joint ASCE-ACI Task Connnittee 426, "The Shear Strength of Reinforced Concrete Members," Journal of the Structural Division, American Concrete Institute, June 1973.
9. Kani, G. N. J., "The Riddle of Shear Failure and Its Solution," Journal of The American Concrete Institute, April 1964.
10. Lyn, T. W., ''Design of Prestressed Concrete Structures," Second Edition, 1963.
11. Mattock, A. H., and N. M. Hawkins, "Research on Shear Transfer in Reinforced Concrete," Journal of the Prestressed Concrete Institute, Vol 17, No.2, March-April 1972.
12. Prestressed Concrete Institute, "PCI Design Handbook, Precast and Pres tres sed Concre te," Firs t Ed i tion, 1972.
85
86
13. Priestly, M. J. N., "Tests on Notched Ends of Prestressed Concrete Bridge Beams," Report No. 289, Thorndon Overbridge Central Laboratories, Gracefie1d Lower Hutt, New Zealand, January 1968.
14. The Institution of Structural Engineers, London, "The Shear Strength of Reinforced Concrete Beams," A Report by the Shear Study Group, Series No. 49, January 1969.
15. U. S. Department of Commerce, Bureau of Public Roads, "Standard Plans for Highway Bridge Superstructures," Revised 1956.
16. Werner, M. P., and W. H. Dilger, "Shear Design of Prestressed Concrete Stepped Beams," Journal of the Prestressed Concrete Institute, Vol 18, No.4, July-August 1973, pp 37-49.

APPENDIX A

· .
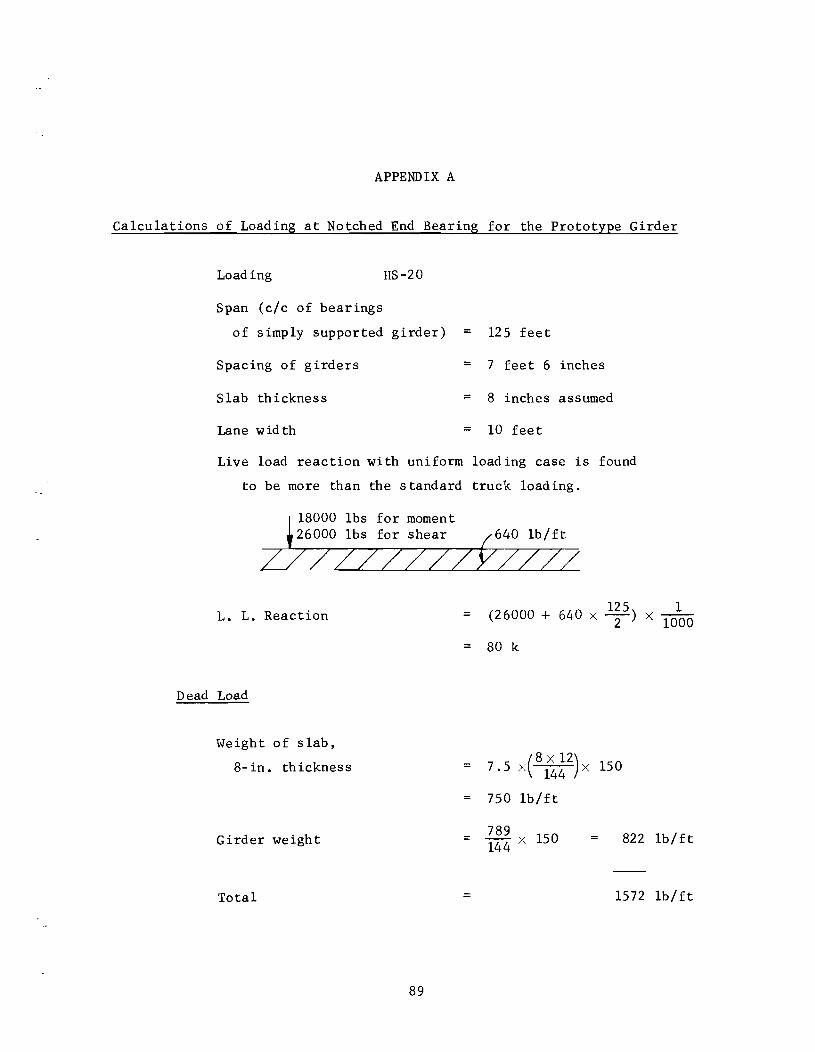
APPENDIX A
Calculations of Loading at Notched End Bearing for the Prototype Girder
Loading HS-20
Span (c/c of bearings
of simply supported girder) = 125 feet
Spacing of girders = 7 feet 6 inches
Slab thickness = 8 inches assumed
Lane width = 10 feet
Live load reaction with uniform loading case is found
to be more than the standard truck loading.
L. L. Reaction = (26000 + 640 X 125) 2
= 80 k
Dead Load
Weight of slab,
8- in. thickness (8 X 12) 7.5 X ~ X 150
750 lb/ft
Girder weigh t 789 150 822 144 X
Total = 1572
89
1 X 1000
Ib/ft
lb/ft
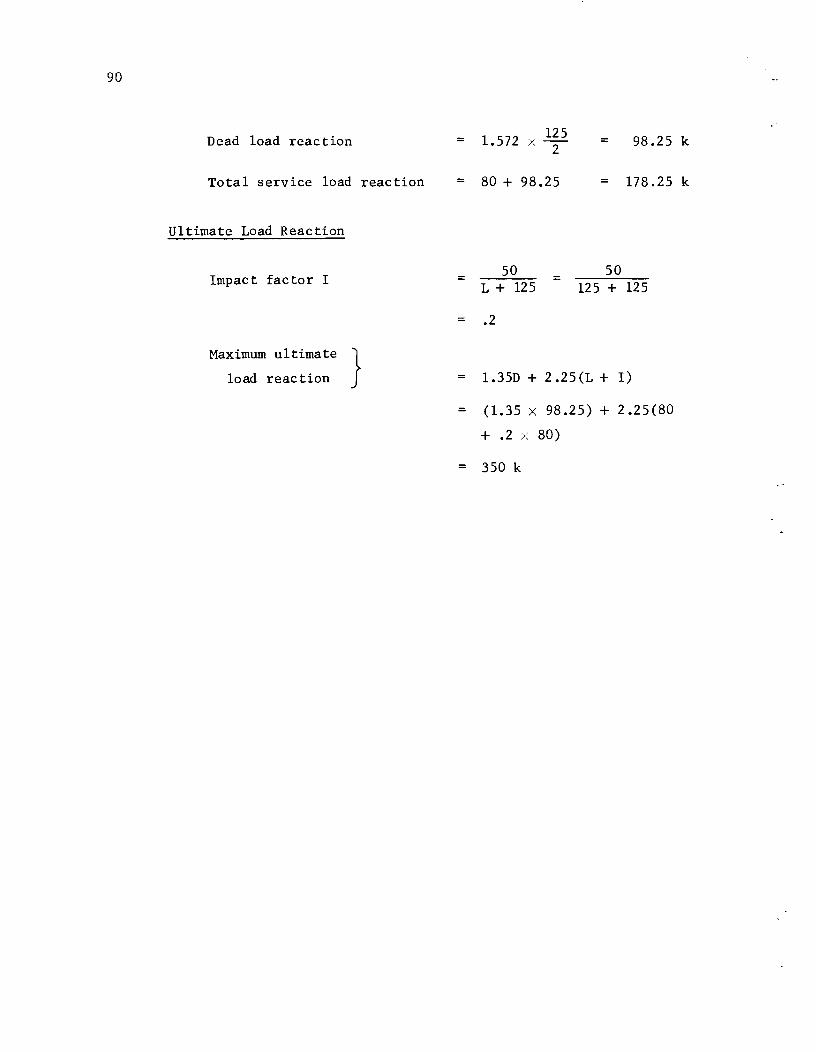
90
Dead load reaction
Total service load reaction
Ultimate Load Reaction
Impact factor I
Maximum ultimate } load reac tion
= 1.572 125 x-2
= 98.25 k
= 80 + 98.25 178.25 k
50 50 = =
L+ 125 125 + 125
.2
1.35D + 2.25(L + I)
= (1.35 x 98.25) + 2.25(80
+ .2 x 80)
= 350 k

APPENDIX B

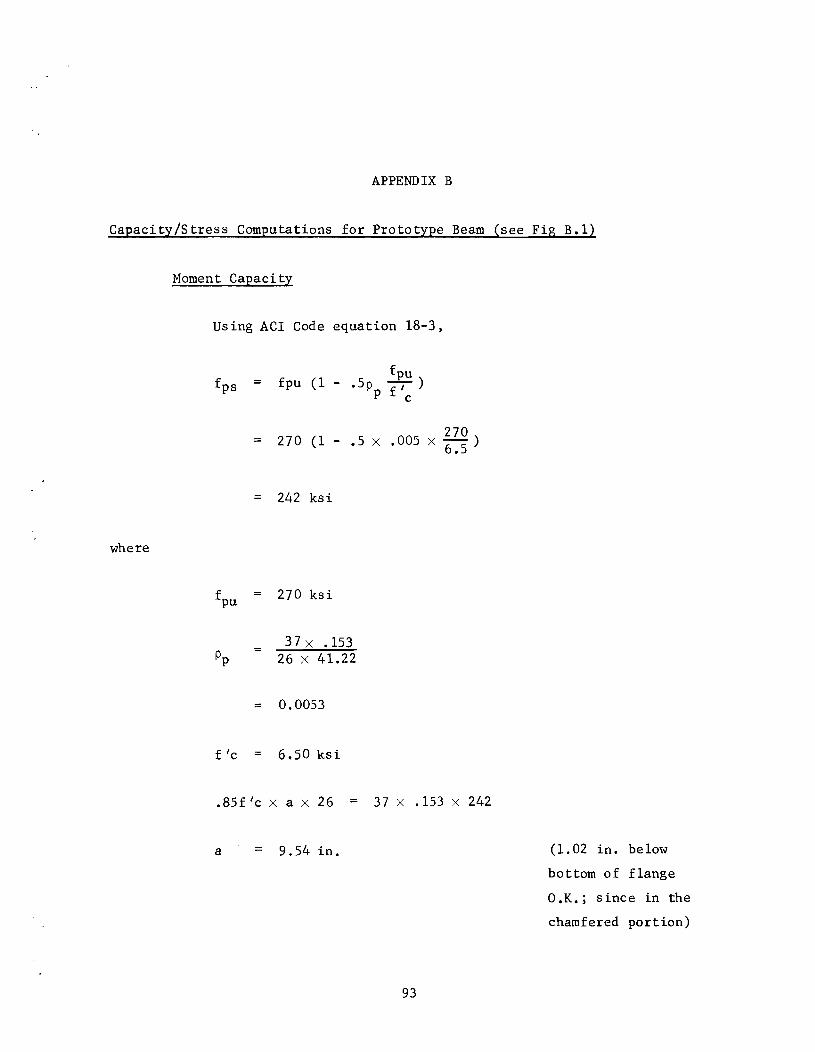
APPENDIX B
Capacity/Stress Computations for Prototype Beam (see Fig B.1)
where
Moment Capacity
Using ACI Code equation 18-3,
=
==
==
fpu fpu (1- .5p -fl )
P c
270 270 (1 - .5 x .005 x 6.5 )
242 ksi
fpu 270 ksi
37 x .153 Pp 26 x 41.22
== 0.0053
f 'c 6.50 ksi
.85f ' c x a x 26 = 37 x .153 x 242
a 9.54 in.
93
(1.02 in. below
bottom of flange
O.K.; since in the
chamfered portion)

94
C\I C\I . ~
, ....... . • • • • • • • • •
••••• ••• • • •
Ceo • ... -.~.~'
-0)
CD • •
J.
A 789 in. 2
Yb
24.73 in.
Yt 29.27 in.
I = 258330 in.
e = 16.49 in.
37 strands
• •
2611
4
-I
'It cO 1\ ~
,... C\I
en C\I
" '->.
Fig B.1. Cross section of prototype beam.
CGC

95
M = (37 x .153 X 242) (41.22 _ 9.02) u 2
= 50300 in-kips
Stresses at Service Load
Beam weight
Moment
Moment due to applied load
Prestressing force after
all losses have occurred
(25 percent losses)
Top fibre stress, ft
150 = 789 x 144 = .82 k/ft
= 142 .82 x --2-- x 12 =: 966 in-kips
= 178 x 163 = 29014 in-kips
Total M = 30000 in-kips
= (189 x .75) x (37 x .153)
= 802 k
= (802) + ( 802 x 16.49 ,>( 29.27 ) 789 258330
_ (30000 x 29.27 ) 258330
= -0.884 ksi
Allowable (ACI Code)
-6J6500 = - .484
ksi
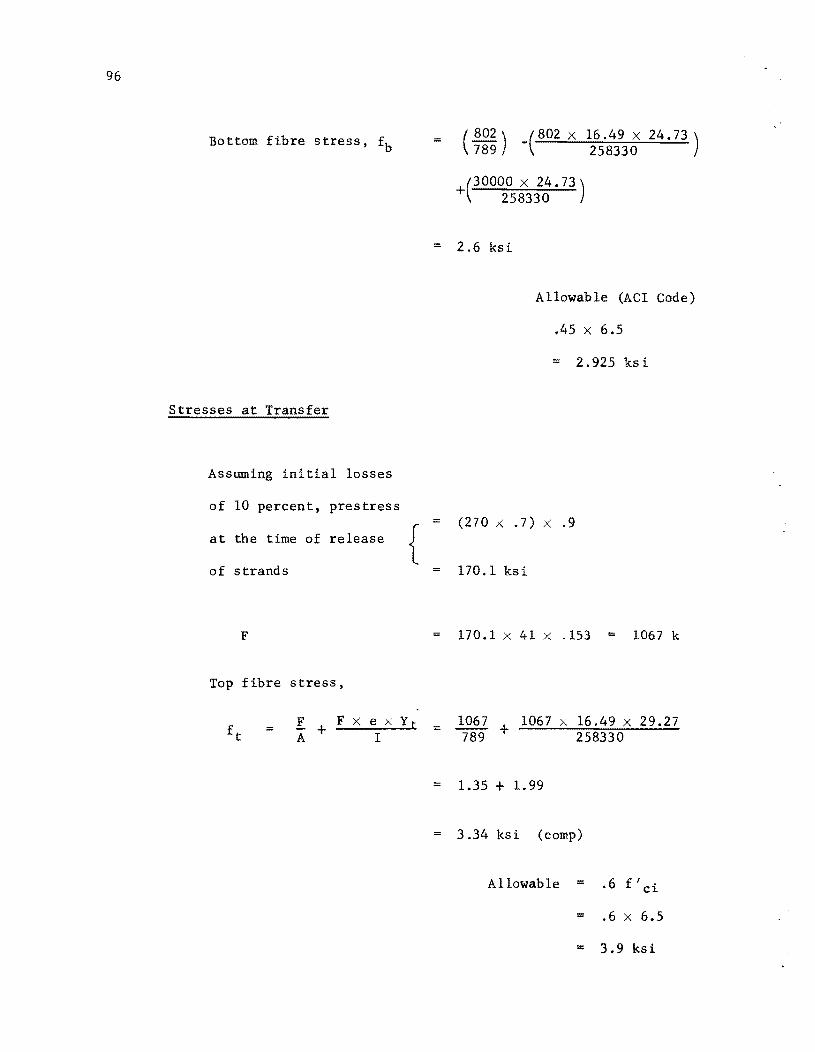
96
Bottom fibre stress, fb
Stresses at Transfer
Assuming initial losses
of 10 percent, prestress
at the time of release { of strands
F
Top fibre stress,
= F Fxe>--Y t A + I
= ( 802) _( 802 X 16.49 x 24.73 ) 789 258330
+(30000 X 24.73) 258330
= 2.6 ksi
Allowable (ACI Code)
.45 X 6.5
= 2.925 ksi
= (270;< .7) x .9
170.1 ksi
170.1 x 41 x .153 = 1067 k
= 1067 + 1067 x 16.49 X 29.27 789 258330
= 1.35 + 1.99
3.34 ksi (comp)
Allowable = .6 f/ci
= .6 x 6.5
= 3.9 ksi
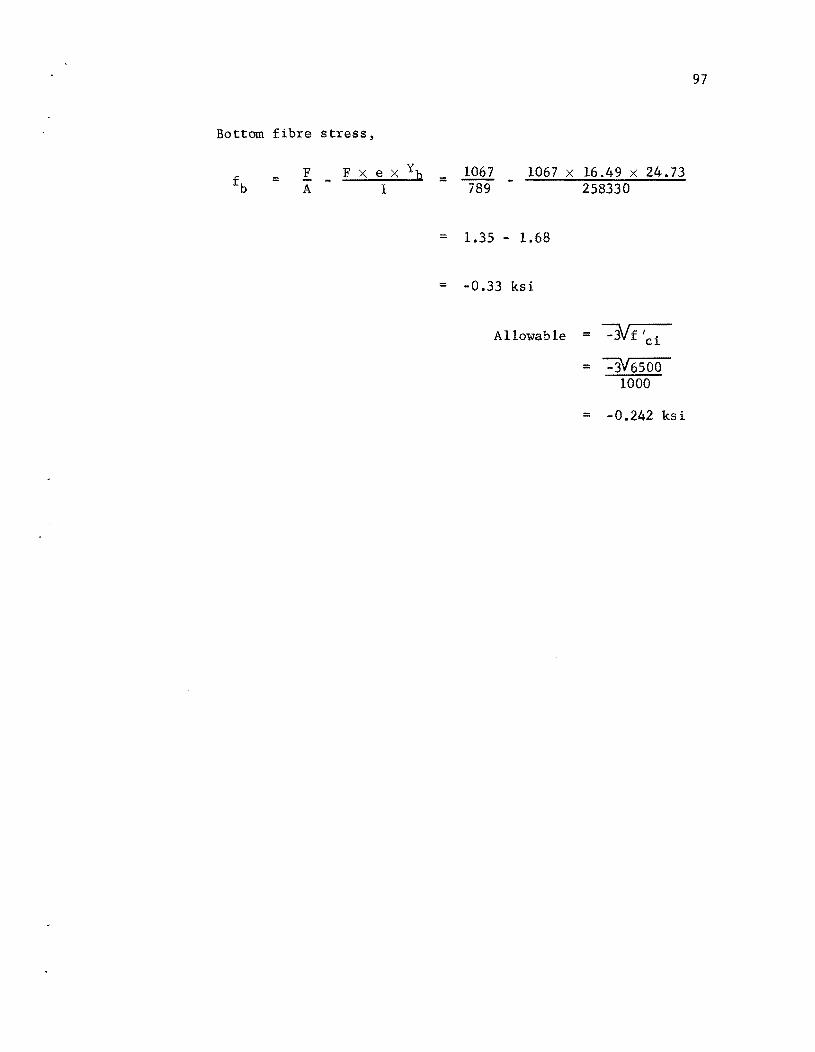
Bottom fibre stress,
= F A
F x e X Yb = 1067 1067 x 16.49 x 24.73 I 789 - 258330
= 1.35 - 1.68
= -0.33 ksi
Allowable = ~ C~
= ~ 1000
= -0.242 ksi
97


APPENDIX C

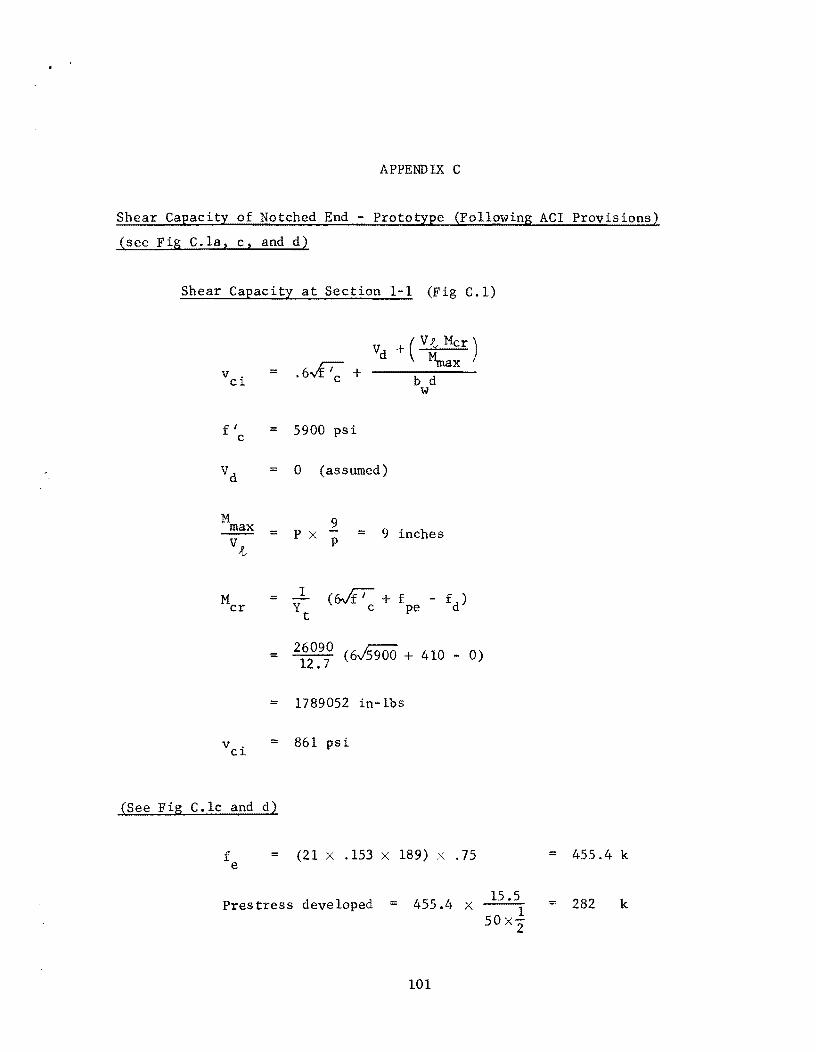
APPENDIX C
Shear Capacity of Notched End - Prototype (Following ACI Provisions)
(see Fig C.la, c, and d)
Shear Capacity at Section 1-1 (Fig C.l)
v . = Cl.
.6vf1; +
Vd + (Vt Mcr) ~ax
b d w
flc = 5900 psi
Vd 0 (assumed)
M cr =
9 P X P = 9 inches
(~ + f - fd
) c pe
26090 (6vf5900 + 410 - 0) 12.7
1789052 in-lbs
v. = 861 psi Cl.
(See Fig C.lc and d)
f e = (21 x .153 x 189) x .75
Prestress developed 455.4 x
101
50x-2
= 455.4 k
= 282 k
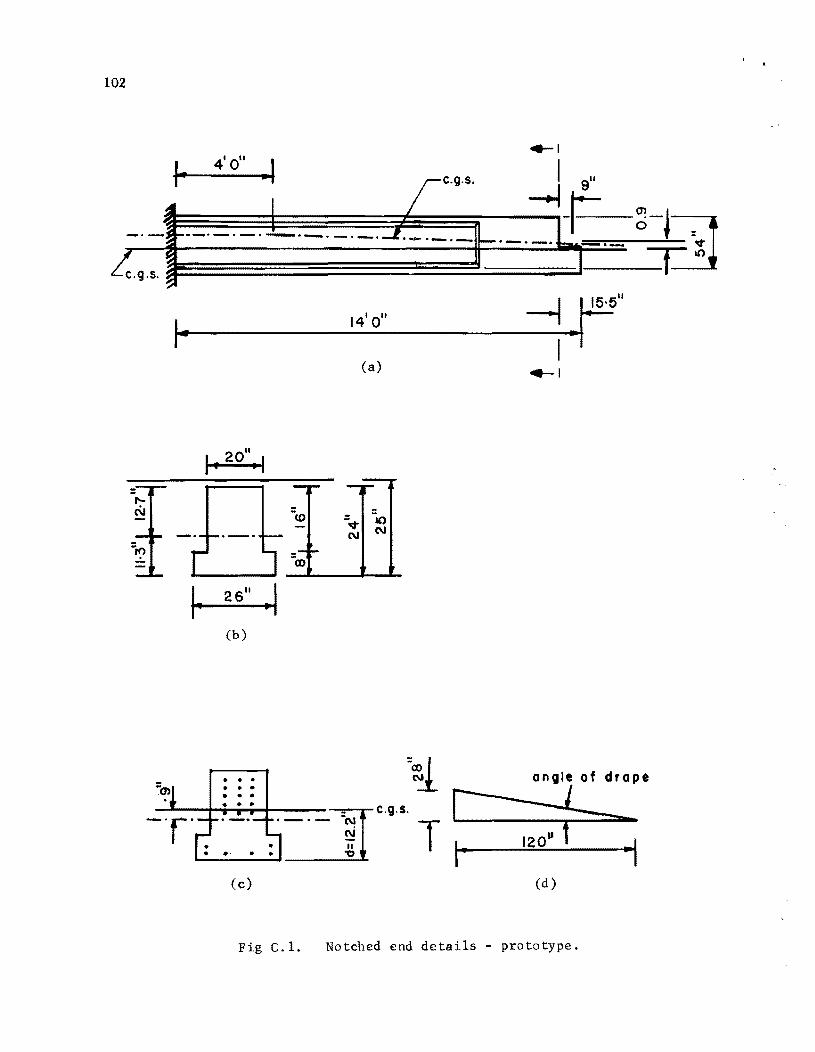
102
c.g.s.
4-1
4' 0" .. I I- I i e.g
.•• -J 9"
>---'-'-' -._. _._.-1._._._ ..... -._.r~._ 6i: '~l
I· 26" I .. (b)
. . . • • •
-l·F" I
14'0"
(a) 4-1
=~l anQle of drape
=-:-::..-~rg·s ~ L..;...--:,..---";----";::...,f' -~-. - i T ~I
(c) (d)
Fig C.l. Notched end details - prototype.

f = ( 282 282 x .9 x 12.7 ) pe 528 26090
f = 282 1000 x pc 528
Vertical component of strand force V p
V P
= (15 x .153 x 189 x .8) x 1~~ x
.410 ksi
= 534 psi
15.5 25 = 50 k
103
v cw 3.5j5900+.3 x 534 + 50 X 1000 = 634 psi
20 x 12.2
Estimate total reaction capacity R by trial:
Try R = 500 k
= 500 x 1000 = 2049 psi v u 20x 12.2
v - v ::: 2049 - 634 = 1415 psi u c
A ::: (vu - vc) bwS s F y
Taking fy = 36000 psi for hanger strap,
a space of 12 in. ,
A 1415 x 20 x 12
9.43 in. 2 = = s 36000
Steel provided,
Straps = 4 x 4 x i 8 . 2 l.n.
No. of vertical stirrups in 12 in.
= (3 x .4) 60000 36000
= 2.0 in.2
Shear capacity can be taken as 500 k •
A required for s


APPENDIX D

1 1 1 1 1
... 1 1 1 1 1 1 1 1 1 1 1 1 1 1 1 1 1 1 1 1 1 1 1 1 1 1 1 1 1 1 1 1 1 1 1 1 1 1 1 1 1 1 1 1 1 1 1 1 1 1 1 1 1 1 1 1 1 1 1 1 1 1 1 1 1 1 1 1 1 1
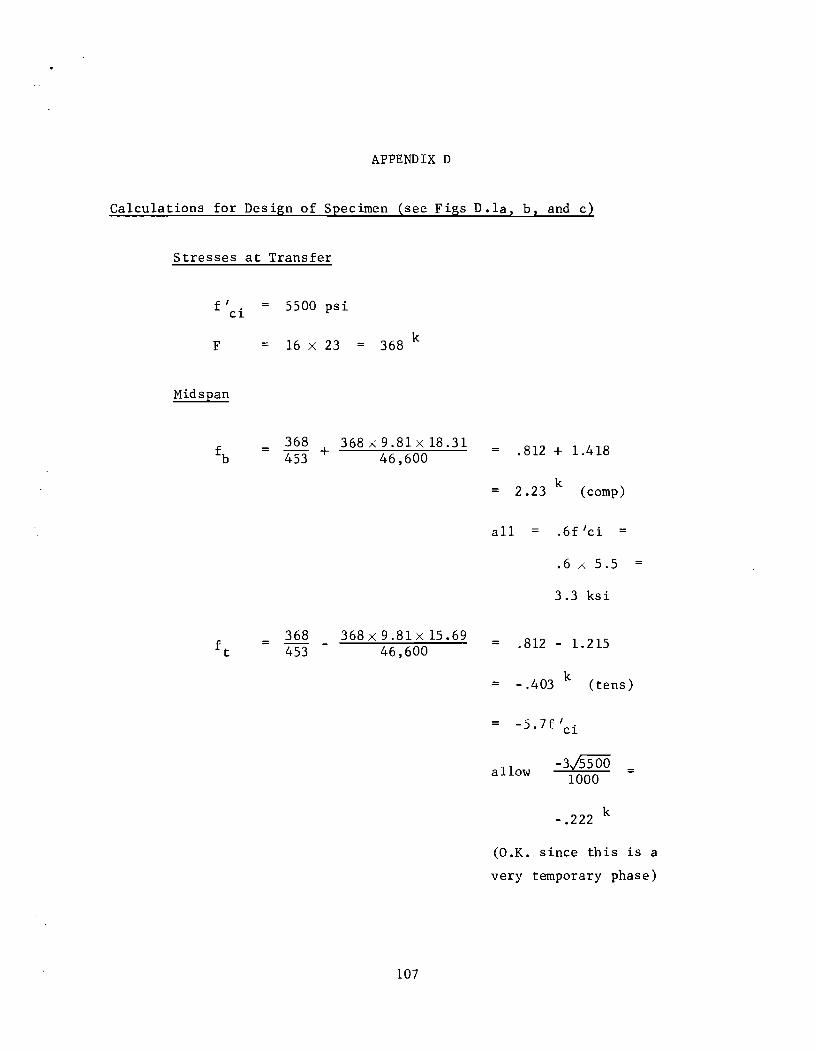
APPENDIX D
Calculations for Design of Specimen (see Figs D.la, b, and c)
Stresses at Transfer
f'. 5500 psi C1
F ==
Midspan
==
16 X 23 == 368 k
368 453
368 453
368 x 9 .81 X 18.31 + 46,600
368 X 9.81 X 15.69 46,600
107
.812 + 1.418
k = 2.23 (comp)
all .6f'ci =
.6 ;<. 5.5
3.3 ksi
= . 812 - 1. 2 15
= _ .403 k (tens)
-5.7f'ci
allow -3j5500 = 1000
_ .222 k
(O.K. since th is is a
very temporary phase)

108
-co 0)
- !-CO -It) III --'-
-= ~ It)
= -It) IX) -
J. 18"
·1 18" , .. "I
• • 0 0
CO
• • -C· '1 IX) :
=10 IX) ..... 0 • c· ..... r-1--'-,-,-!---- •
"'" = -00 oi r 1211 ./
• • c·g· • 0 (b). Ends •
'i;f' 0 • -
It) • • 0 0 A 453 in. 2
0 0 • • Yt
= 15.69 in.
12" Y
b 18.31 in.
I 46600 in. 4
(8). Midspan
17'6" f
5 ~ 5'0
11 1 I. I+~ -1---'6'-10""""11 ......... 1 ..
Fig D.1.
(c) •
Prestressing:
2 t 1/2" strands at top
14, 1/2" strands (6 draped) at bottom
All strands 270 ksi
Section properties of specimen.

f~
.5f~
Moment Capacity
Compute €o
E 57.5./6500 = 4636 ksi c
4636 3250 €3250 x. 1000
= 3250 .000701 €3250 = 1000 A 4636
3250 2
65000 [ 2( -f) - (1-) ] o 0
€ .00239 o
For top fibre strain .003, try c
2 6500 (2a - a )
6.5 in.
109
¢ = .003 6.5
= 461 X 10- 6
C c
€ s
[1 - (¢}t (c) J o
= 18 X 6.52 x. 6.5 X 461xlO-6
[1 _ 461Al0-6
X6.5] .00239 3", . 00239
= 555 kps
= .003 (28.86 - 6.5) 6.5 = 10320 X 10- 6
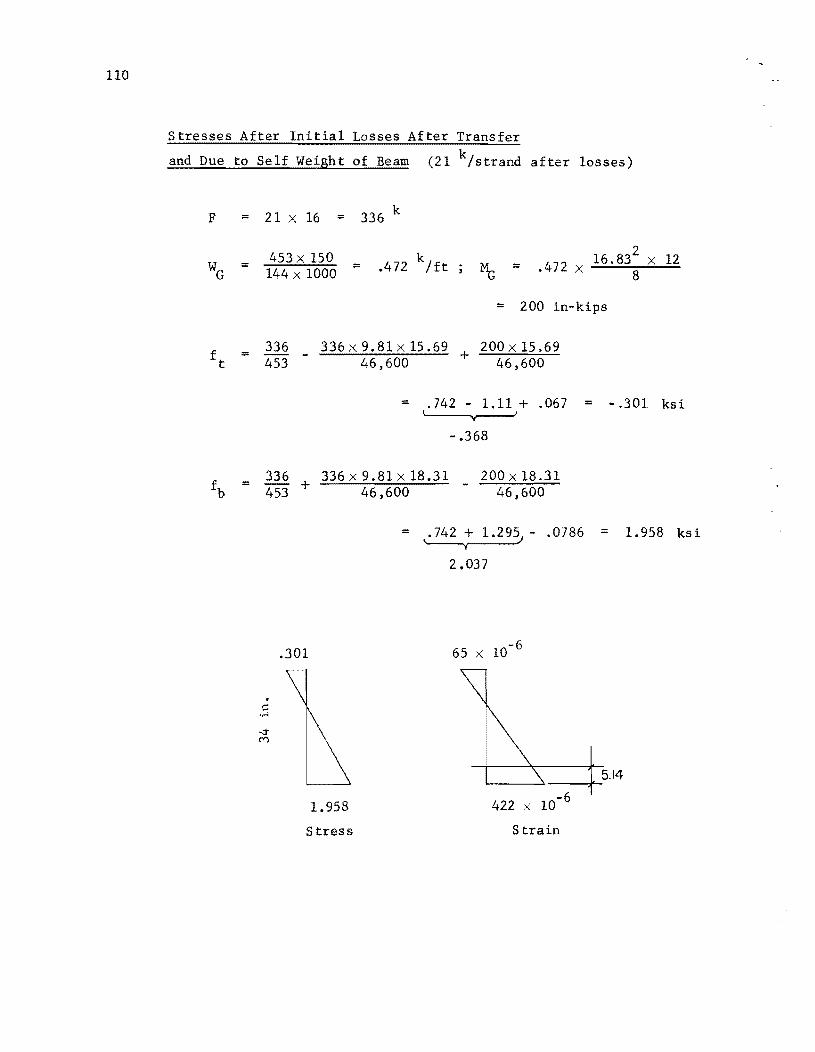
110
Stresses After Initial Losses After Transfer
and Due to Self Weight of Beam (21 k/strand after losses)
F = 21 x 16 = 336 k
= 453 x 150 144 x 1000
= k
.472 1ft 2
.472 x 16.838
x 12 =
= 200 in-kips
336x 9.81x 15.69 200x 15.69 46,600 + 46,600
= .742 - 1.11 + .067 ::: - .301 ksi ~
-.368
336 336x9.81x18.31 fb = 453 + 46,600
200 x 18.31 46,600
=
.301
. c .....
1.958
Stress
- .0786
2.037
65 x 10- 6
5.14 ---;f-
422 x 10- 6
Strain
1.958 ksi
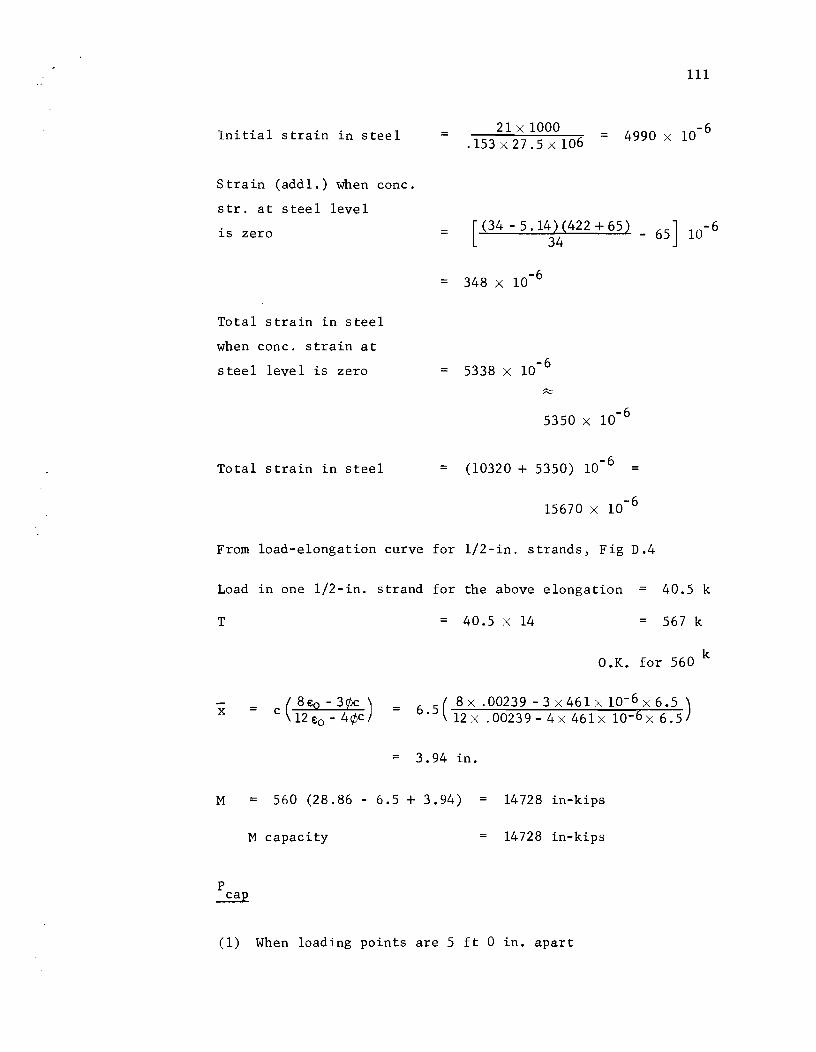
Initial strain in steel
Strain (addl.) when conc.
str. at steel level
is zero
Total strain in steel
when conc. strain at
steel level is zero
Total strain in steel
=
=
111
21 X 1000 4990 X 10-6 .153 X 27.5 X 106
[(34 - 5 .14j4(422 + 65) _ 65] 10- 6
348 X 10-6
5338 X 10- 6
5350 X 10-6
(10320 + 5350) 10- 6
15670 X 10-6
From load-elongation curve for 1/2-in. strands, Fig D.4
Load in one 1/2-in. strand for the above elongation 40.5 k
T
-x = c ( 8 eo - 3¢c ) 12 eo - 4¢c
=
40.5 X 14 567 k
k O.K. for 560
6 5( 8x .00239 -3x46lx 10-6 X 6 •5 ) . l2x .00239- 4x 461x 1O-6 x 6.5
= 3.94 in.
M = 560 (28.86 - 6.5 + 3.94) 14728 in-kips
M capacity
p ~
14728 in-kips
(1) When loading points are 5 ft 0 in. apart
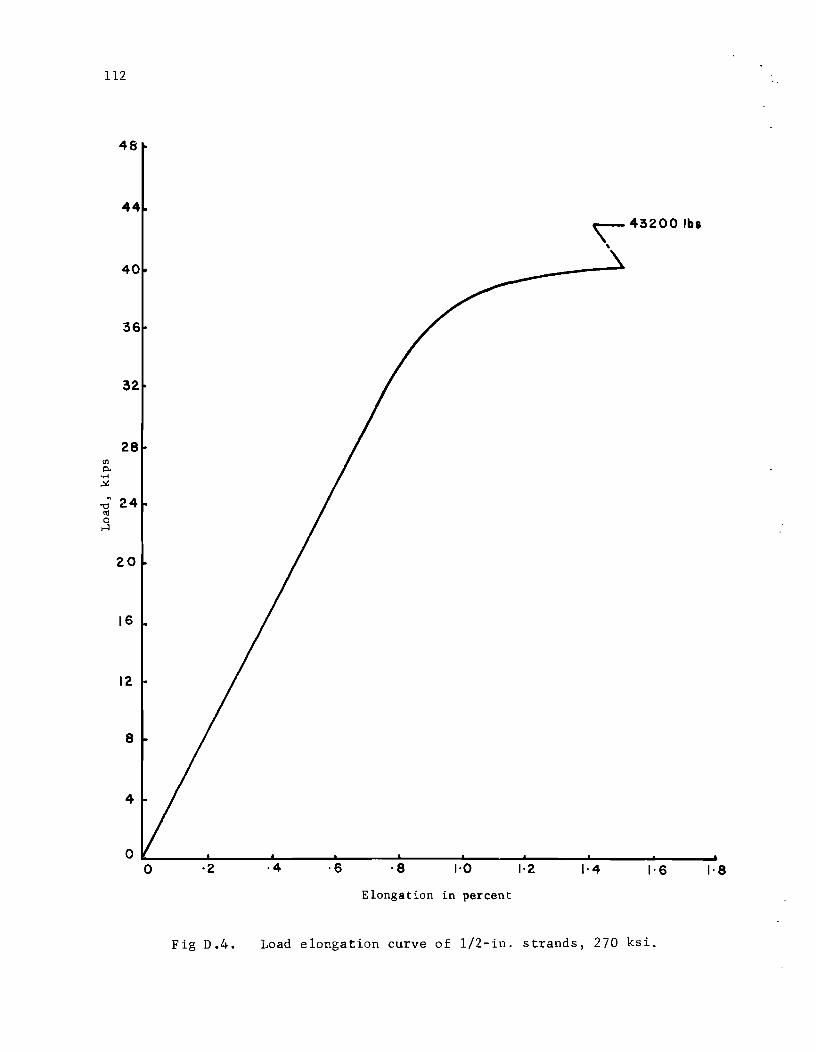
112
48
44 ~43200 lb.
,
40
20
16
12
8
4
o ~ ____ ~ ____ ~ ____ ~ ____ ~ __ ~~ __________ ~ ____ ~ __ ___ o ·2 ·4 ·6 ·8 1·0 1·2 1·4 1·6 1·8
Elongation in percent
Fig D.4. Load elongation curve of 1/2-in. strands, 270 ksi.

1 5 '-11" ~
AI' _
p cap
= 14728 5.917 x 12
p
- 5'-0"
IS' 10"
= 207.4 k
113
P
5'-11" ---1 - -•
~j I
(2) When loading points are 5 ft 9-1/2 in. apart
p = cap
p
~ -
14728 5.52 A 12
= 222 k
p
5~9r --1_-"+, ... _11--5'-6 r ----j
P total load on one side

114
Moment Capacity Using ACI Equation
f ps = fpu (l - .5 P ~ ) p f 'C
= 270 (1 - .5 X .00412 X 270) 6.5
f pu
= 247 ksi
= 270 ksi
14 strands in flexural tension
p p
f I C
14 X .153 l8x28.86
6.5 ks i
.00412
.85 (f IC) X a X 18 14 X .153 X 247
14 X • 153 X 247 a .85 X 6.5 X 18
= 529 (28.86 - 5.32 ) 2
M
Stresses at Service Load for the Model
529
5.32
= 13860 in-kips
Though there is no service load condition for a laboratory test,
for comparison with the prototype a scaled service load is assumed.
Service load for prototype = 178 k
Scale of the model 0.4
Service load for the model 178 x 0.4

ll5
TABLE D.l
Distance from
Midspan, M, ¢ , Section ft Stages in-kips 10-6 in./in.
1 0 Zero Moment 0 - 15.0
Cracking 6724 15.9
€c = .001 10693 98.0
€c .002 14105 267.0
€c = .003 14728 461.0
2 5 Zero Moment 0 - ll.5
Cracking 5917 15.9
€c = .001 9104 100.0
€c .002 12386 267.0
€c .003 13260 448.0
3 8.34 Zero Moment 0 1.3
(Notch) Cracking 1703 9.2
€e .001 5223 172 .0
€e .002 8624 345.0
€e .003 10537 500.0
The M - ¢ relationship is plotted in Fig D.5.
Using the M - ¢ relations at different sections of the beam,
load-deflection calculations were carried out using the area-moment method
of the ¢-diagram. The load-deflection relationship for the two types of
loading used for the specimen test, as analytically computed, are plotted,
along with test values, in Fig 5.1.
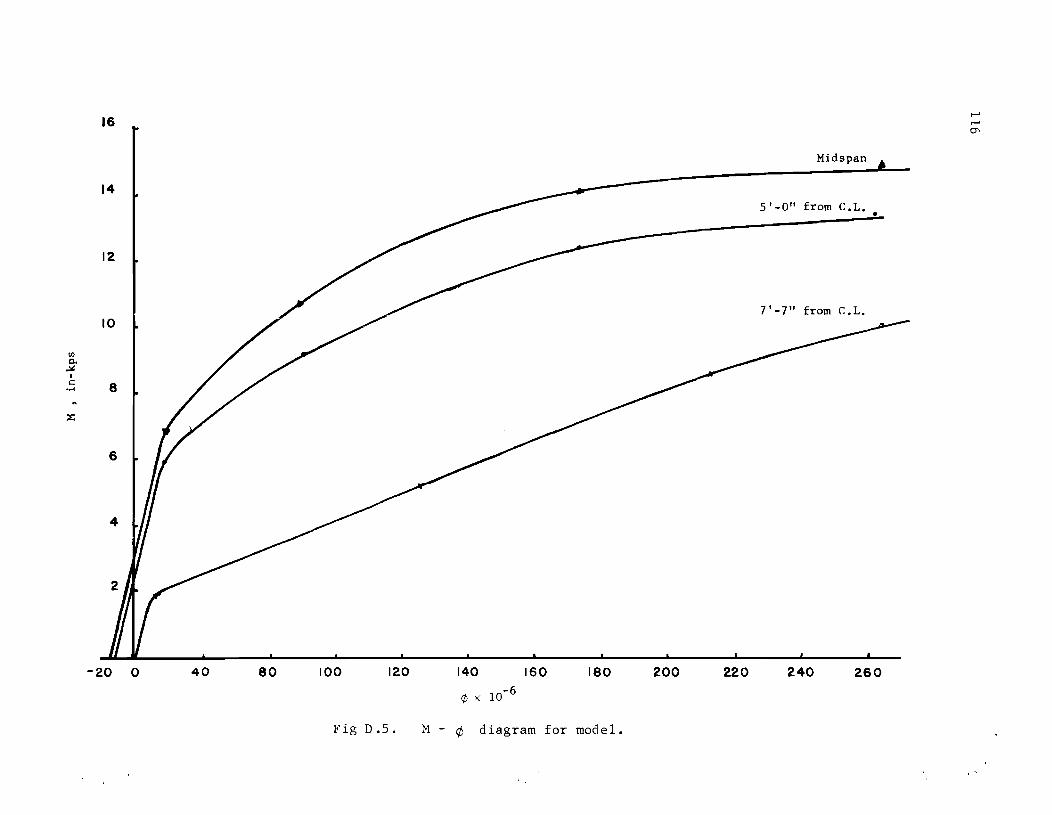
til p..
,!oI: , .::
.,4
~
16
14
12
-20 0 40 80 100 120
Fig D. 5.
140 160 180 200 220
¢ x 10- 6
M - ¢ diagram for model.
Midspan
5'-0" from C.L • •
7'-7" from C.L.
240 260
'-' '-' 0'

APPENDIX E

j
j
j
j
j
j
j
j
j
j
j
j
j
j
j
j
j
j
j
j
j
j
j
j
j
j
j
j
j
j
j
j
j
j
j
j
j
j
j
j
j
-- j
j
j
j
j
j
j
j
j
j
j
j
j
j
j
j
j
j
j
j
j
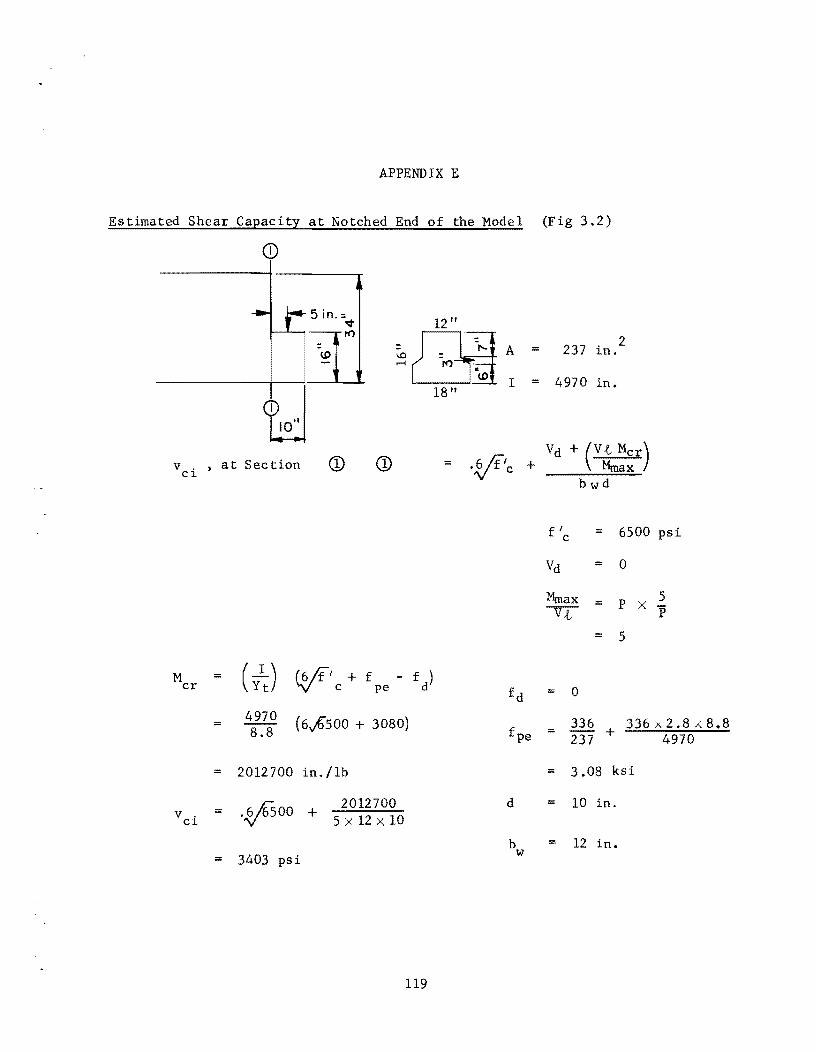
APPENDIX E
Estimated Shear Capacity at Notched End of the Model (Fig 3.2)
v . C1
M cr
v ci
CD
ID
td
12 "
~~_ = ...... A = r-i rr>
-ID I = IS II
• at Sec tion CD CD = .!;./f/C +
= ( yIJ ~' + f - f ) c pe d fd
4970 (6,..£500 + 30S0) =
S.S fpe
= 2012700 in. /lb
.tf6s00 2012700 d
= + 5 X 12 X 10
b 3403 psi w
=
119
237 in. 2
4970 in.
Vd + (V~;r) bwd
f I = 6500 psi c
Vd = 0
Mmax = P 5 X -P
= 5
0
336 336x2.S;<S.S = + 237 4970
= 3.08 ksi
= 10 in.
= 12 in.
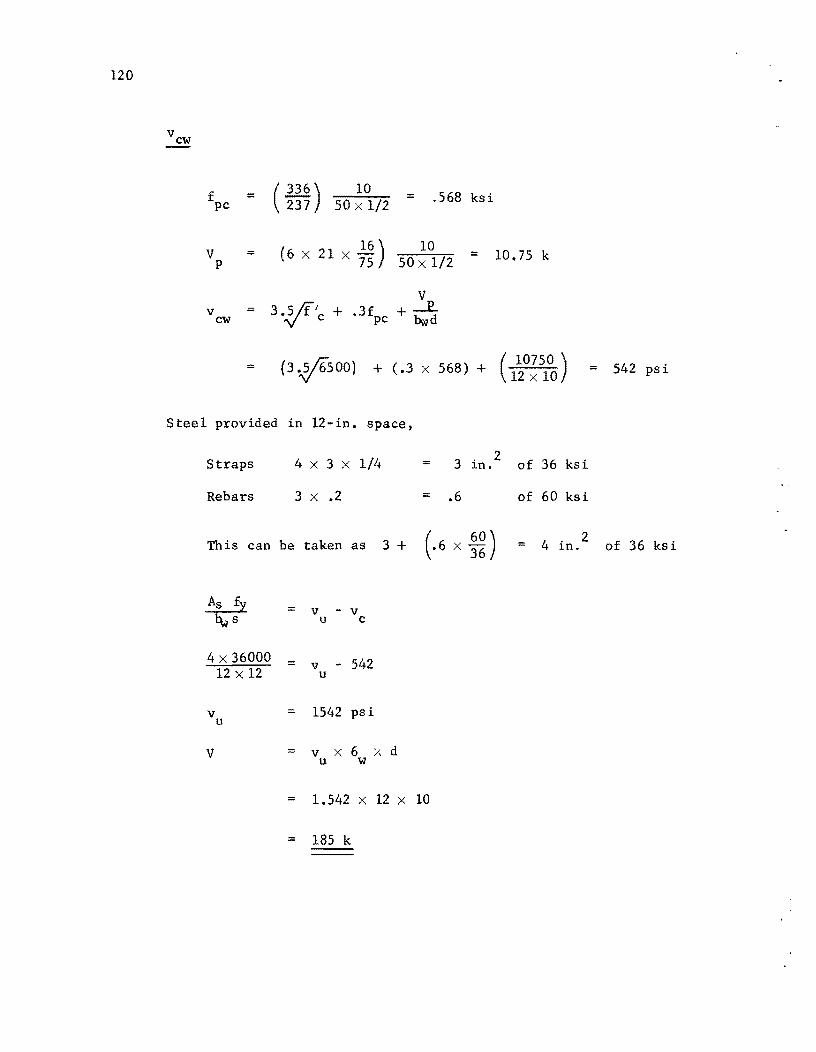
120
vcw
f = ( 336) 10 = .568 ksi pc 237 50 x 1/2
16 ) 10 V ;; (6 x 21 x 75 = 10.75 k p 50 x 1/2
V v 3·.ijf'C + .3fpc
-E.. cw + bwd
= (30"6500 ) + (.3 x 568) + ( 10750 ) 12 x 10
Steel provided in 12-in. space,
Straps 4 x 3 x 1/4 3 . 2 1.n. of 36 ksi
Rebars 3 x .2
This can be taken as 3 +
As fy = v - v ~s u c
4 x 36000 v - 542 12 x 12 u
v = 1542 psi u
V = v x 6 x d u w
= 1.542 x 12 x
= 185 k
= .6
(.6 x ~~)
10
of 60 ksi
= 4' 2 1.n.
= 542 psi
of 36 ksi
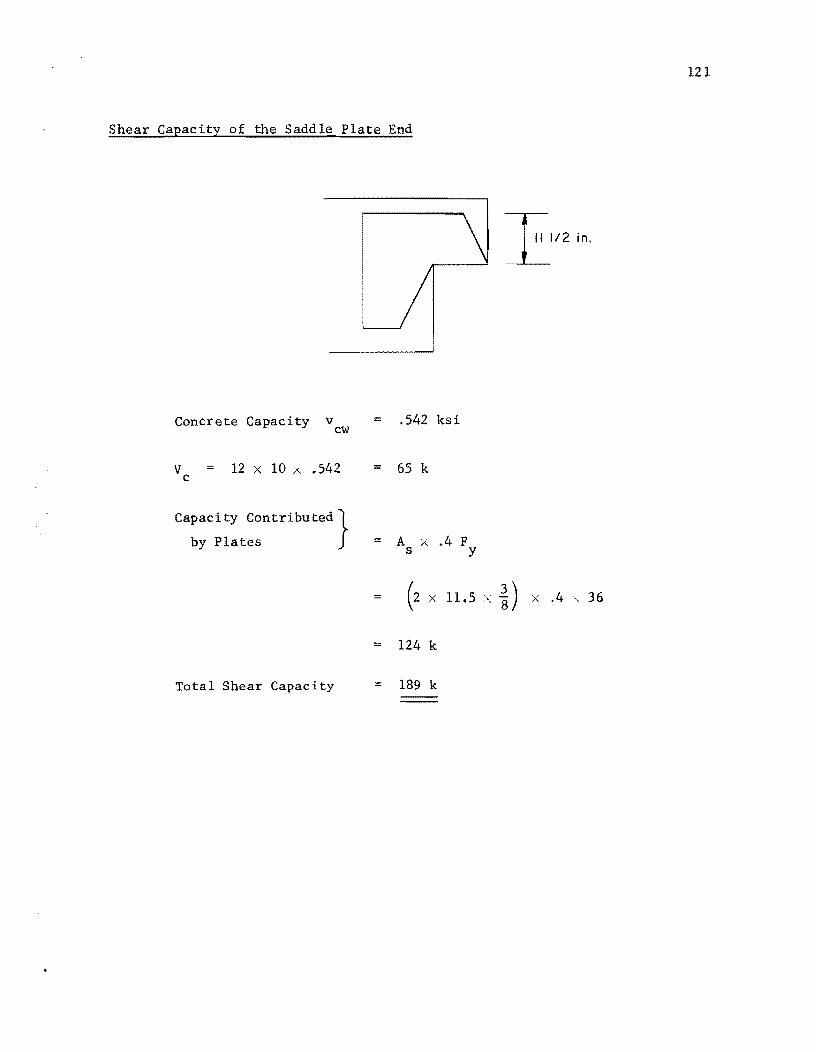
121
Shear Capacity of the Saddle Plate End
Concrete Capacity v = .542 ksi cw
V 12 X 10 X .542 65 k c
Capacity Contributed}
by Plates = A X .4 F s y
(2 x 11.5 x ~) x .4 " 36
= 124 k
Total Shear Capacity = 189 k


APPENDIX F

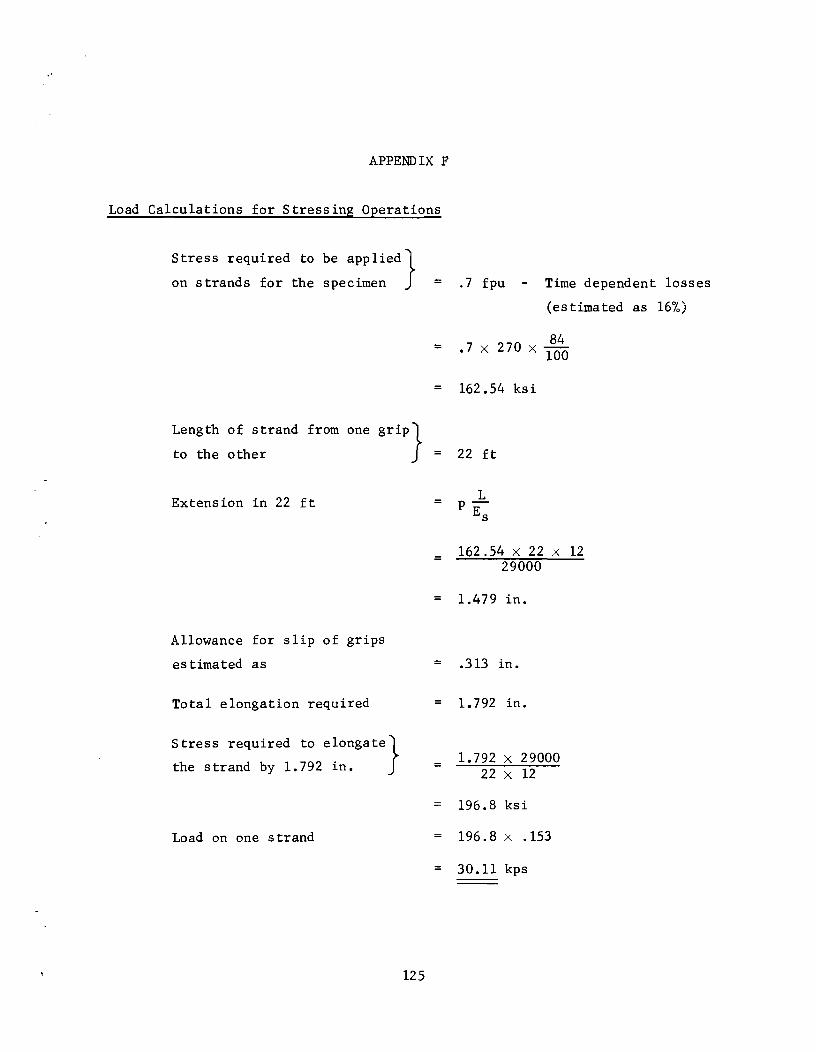
APPENDIX F
Load Calculations for Stressing Operations
Stress required to be app lied}
on strands for the specimen
Length of strand from one griP}
to the other
Extension in 22 ft
Allowance for slip of grips
estimated as
Total elongation required
Stress required to elOngate}
the strand by 1.792 in.
Load on one strand
125
=
=
=
=
=
=
.7 fpu Time dependent losses
(estimated as 16%)
.7 x 84 270 x 100
162.54 ksi
22 ft
L p-Es
162.54 x 22 x 12 29000
1.479 in.
= .313 in.
= 1.792 in.
=
1. 792 X 29000 22 X 12
196.8 ksi
= 196 . 8 x . 153
30.11 kps


APPENDIX G

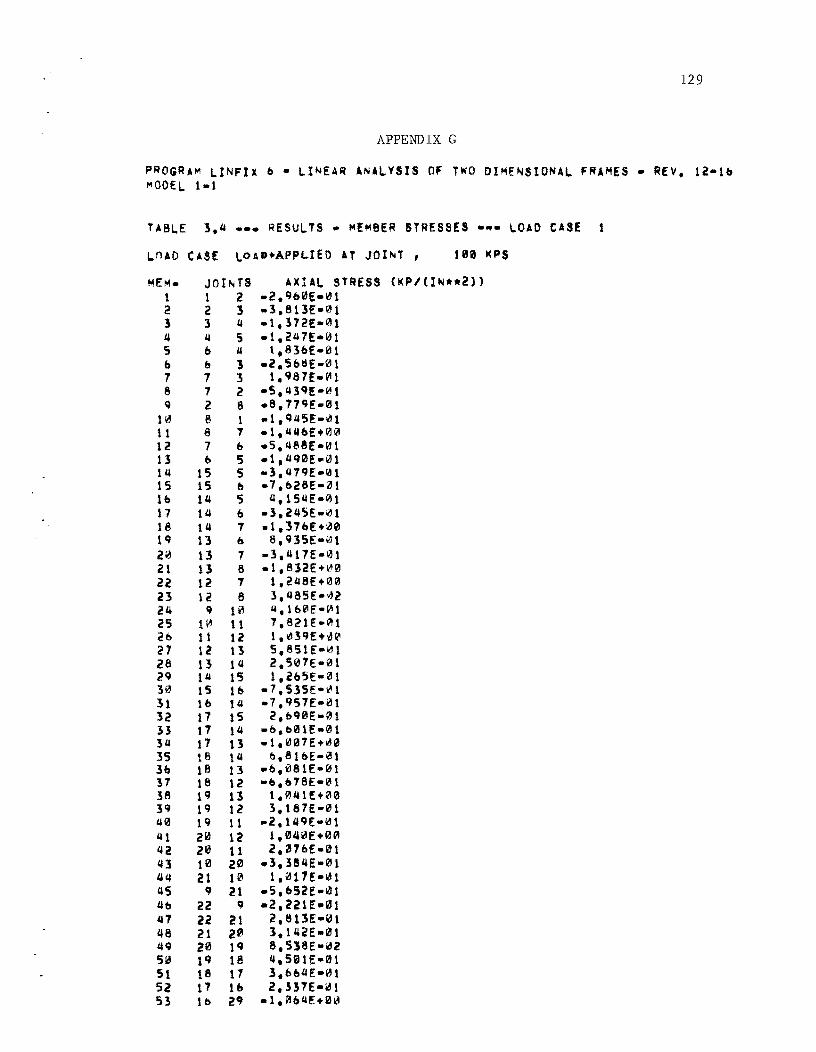
129
APPENDIX G
PROGRAM UNFIX b - I..INEU ANAl.. VSIS OF TWO DIMENSIONAL FRAMES .. REV, 12-10 MODEL 1-1
TABL.E 3,4 ••• RESULTS .. ~!MeER STRESSES -.- LOAD CASE t
LnAD CAS! LOAD+APP~IED AT JOINT , 100 I(PS
ME~_ JOINTS AXIAL STRESS (I(PI 0", .. 2») 1 1 2 -2,Q00E·ItH 2 2 1 -3.811£-01 3 3 1.1 -l,372E-11I1 4 1.1 S .1,21.17E-101 5 & /.I 1,83&£-01 & b 3 _2.5&tjE-01 7 7 3 I,Q87E.~1
8 .., 2 -5,4!qE-~t q 2 8 .B,77e;£-01
10 e 1 .. I,q45E-~1 11 8 .., -I,1.I40E+0111 12 7 & .5,488£-01 13 b 5 _1.4e;0E_01 14 15 5 .. 3.1.17e;e:-\H 15 15 b -7,&28E-~1 1& 14 5 1.1, 151.1E-01 17 11.1 & -l.i45E-""1 18 11.1 7 .1,37&£+1210 Ie; 13 b S,nSE-kll 20 13 "I -l./Un-01 21 13 8 -I,812E+1£'0 U 12 .., 1.2I.1BE+0m 23 12 8 3,4B5E-~2
24 q 1ft" 1.I.1bilE-141 25 1~ 11 "I,SinE-AI 2& 11 Ii 1,~HE+~~ 27 12 13 S,8S1E-~1 28 13 11.1 2,501e:-01 2Q 14 15 1,2&5E-01 313 15 1& -"'.S35E-vll 31 1b t4 -7,e;S7E-01 32 17 15 2,&1:10£-01 H 17 14 -0,001£-01 31.1 17 13 -1.007E ... ..," 35 \8 11.1 o,810E-01 3& 18 13 .. 6,081E-01 37 18 12 -b.07SE-liIt 38 lQ 13 1.0/U!:+00 lq lQ 12 3,181E-01 1.10 tI~ 11 .2,11.11;[-01 1.11 20 12 1.04li1E+00 42 20 11 2.07&E-01 1.13 10 20 .3.384E-01 4tI 21 10 1.017E-161 q5 q 21 -5.&52E-01 1.1& 22 q .2.221E·"1 47 2c 21 2.81lE-01 48 21 20 1.14U:-01 1.49 20 tq 8.S:5SE-1c!2 50 Ie; 18 4.SiUE-01 51 18 11 3.b6I.1E-01 52 17 16 2,137E-1:!1 53 Ib 2CJ _1.IiH,4F.+0~
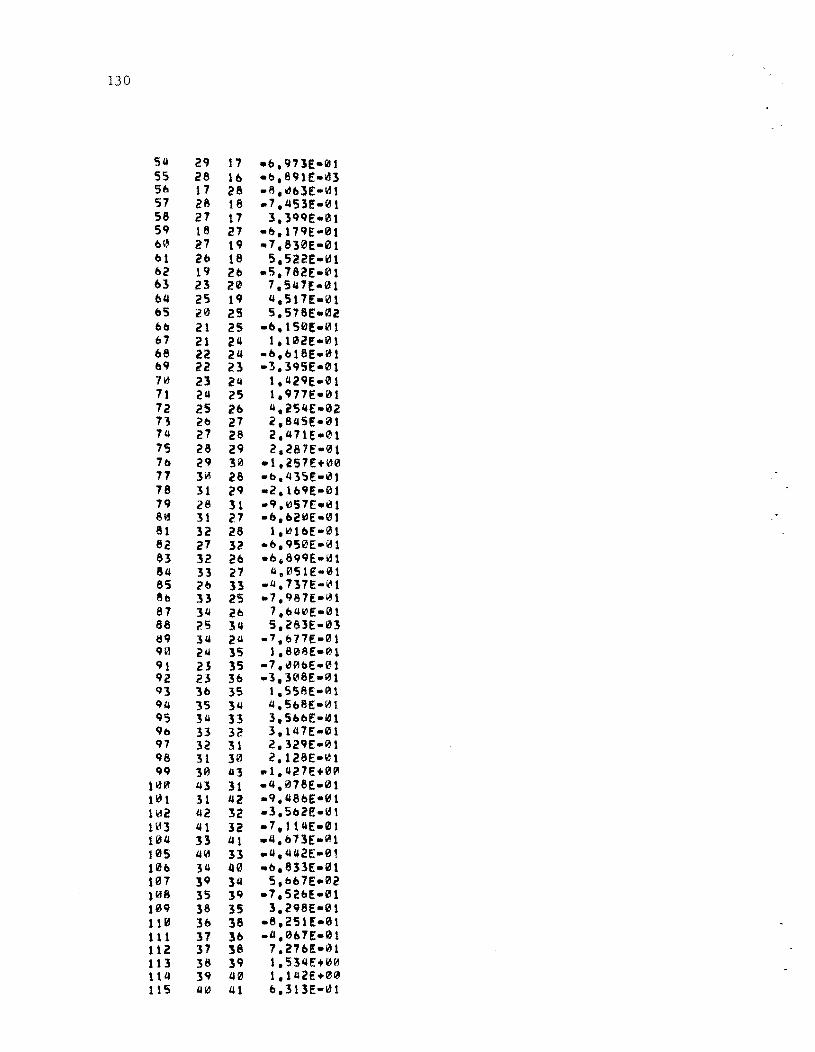
130
5'4 29 17 .b.971E-ru SS 28 10 -~.8qlE·~3 5& 17 28 -8. -'o3E-lt'l 57 28 18 .7.4S3!'-01 58 27 17 ]. JqqE-01 59 18 27 -b.179E-01 ~" 27 19 .7.830E-01 ~1 26 18 5,522E-1t)1 b2 19 20 -5.782[-01 OJ 23 20 7.5447E-01 644 25 lq ".517!-01 05 20 25 5.578[.02 Ob 21 25 -b.150[_01 67 21 24 I.UZE-"! 68 22 24 -b,bI8!.01 0'1 22 23 .3,]95E-01 710 23 2'1 1,42ge-0! 71 2'4 25 1,971e:-0t 72 25 20 11,254£-02 n 20 27 2.845E-01 74 27 28 2,471E-12!1 7S 28 Z9 2,287[-01 7b 29 30 .1.i57E+00 77 ]iIJ 28 -b.43SE-~1 78 31 29 -2,109[-01 79 28 31 -q.1057[el,31 8~ 31 27 -O.02iSE-0! 81 32 28 1, ltl lbE-0t 82 27 32 -b.qS0E-01 83 32 20 -b.8qcn-01 8'4 33 27 4.051E-01 85 2b 33 -1I.717E-it:'! 80 33 25 .1,987E-\H 87 ]4 2b 1,ou"E-01 88 25 3toI S.283E-03 ';'1 1'1 21.1 -7.&77E-01 '10 211 35 1,808E-01 91 21 35 -7.~~oE-0t 'Ii! 23 30 .3.308E-0 1 Q] 3b 35 l,558E-01 94 35 3'1 4.508[-"'1 'IS 34 33 3,5boE-1Il1 'Ie 33 32 3,1U7!-01 '17 32 31 2,32qE-01 '18 31 ]0 2,128E-~1 '1'1 30 43 _1.42 7E+0(11
100 '43 31 .4.078E-01 101 31 42 .q,48bE-01 1~2 42 32 .. 3.Sb2e:-01 1l.13 'II li _1.114E-01 104 31 41 .".b73E- lol l 105 1.Ir.i :n -",""2E-01 100 ]11 40 .. &,633E-01 107 ]9 34 5,bb7E-02 10 8 35 39 .7,52&E-01 10q 38 35 3,2q8E-01 110 36 38 .8,251[-01 111 37 3b _tl.061E-01 112 37 38 7.270£-01 113 38 3'1 1.534!:+00 114 ]'1 40 l,142E+00 115 14k' 41 &.313E-I;H
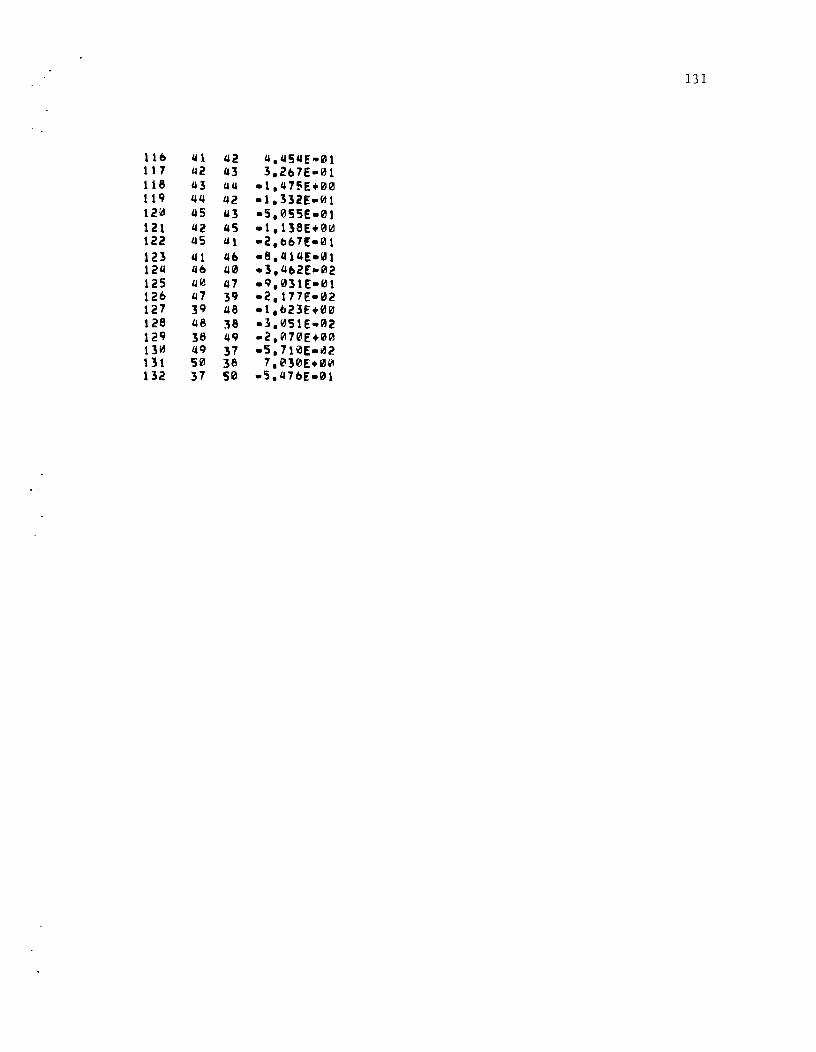
131
l1b '11 '12 4.'154E .. 01 117 1.12 '13 3.2t17E-"'1 118 1.13 1.11.1 -1.475E+00 11'i 1.11.1 42 -1.332E-01 12fd 45 43 -S.055E-01 121 42 '15 -1.138E+IH' 122 45 41 -2.bb7E- 0 1 123 1.11 4t1 -S.41U!-01 12'1 4b 40 -3.4t12E-02 125 1.116 1.17 -Q.031E-01 12b 1.17 39 -2,177E-02 127 39 1.18 -1,b23E+00 128 48 38 -3.~51E.02 129 38 49 -2.Ql70E+00 13~ 4Q 37 -5.710E_ilJ2 111 50 38 7,i2'30E+00 132 37 50 -5.47b£-01

132
PROGRA~ LINFIx b • LINEAR A~ALYSIS O~ T~O DJM~NSIONAL FRAMES _ REV, 1i-lt MODEL 1-1
TABLE 3. u --- RESULTS - MEMBER STRESSES ••• LOAD CASE 1
LOAO CASE _~OADt~PPLIEO AT JOINT , 100 KPS
MEM- JOINTS nUL STRESS (KP/(INui) ) 1 1 2 -l.719E.-01 2 2 "3 .2,:nI:lE-~1 l ! i.I .5,loHSE-PJC\ iI iI 5 .3.820£-\:12 5 0 LI 8,lcHf-"'2 0 0 3 -2.751E-1Il1 7 7 3 1.021£-01 8 7 2 -b.7Q8E-1iI1 if 2 8 -0,903£-01
U 8 1 -1,557£-01 1 t 8 7 -1,1.I78!"+00 12 7 0 .7,11&E-01 13 0 5 -2,oioE-kH 1L1 15 $ .l,00bE-01 15 15 0 -",S23f-1tl1 Ib 1L1 I) b,V'3bE-01 17 Iii 0 -I,770E-01 18 HI 7 -l,799E+00 19 13 0 9,071E+~1i'!
20 l.S 7 -2,873E-0 1 21 Il 8 -2,OIOE+00 22 12 7 2,"'91E+131 23 1i! II LI, ificlile:-liH iii Ii 1" 1."llE-~t 25 1'" 11 1,bLli!JE+1Il1 20 1 1 12 3.5'12£+01 27 12 13 t.:U1E+~t 28 11 14 8,2i1Se:-\:12 29 li.1 15 -1.120E-\:12 30 15 16 ..,9,792£-01 31 Ib 14 -l,322E+"0 32 17 15 7,747E-"1 H 17 14 -S,512U'E-ltll lil 17 13 -1.7fiH~E+"0 3S 18 14 1,417E+01 3b 18 13 -I'I,202E-03 17 l~ 12 -1."loE+00 38 19 11 2.48bE+01 39 19 12 8,lb"E-01 "Ii! 19 11 .2.1fd0e:-01 'II 20 12 2.5214£+01 42 2'" 11 &,185E-02 43 10 2~ 1,0<;10£-01 44 21 10 -7,90<;1E-02 45 q 21 .2,l.i38E-01 4b 22 9 .4.931E-01 47 22 21 3.34U-01 48 21 20 b,:U7E-01 49 20 19 7.18l,\E-~1
5~ 19 18 1,lo2E+0111 51 ,8 J7 9.IHI2E-e 1 52 17 10 ".4SbE-01 51 10 29 -1.518e+~0
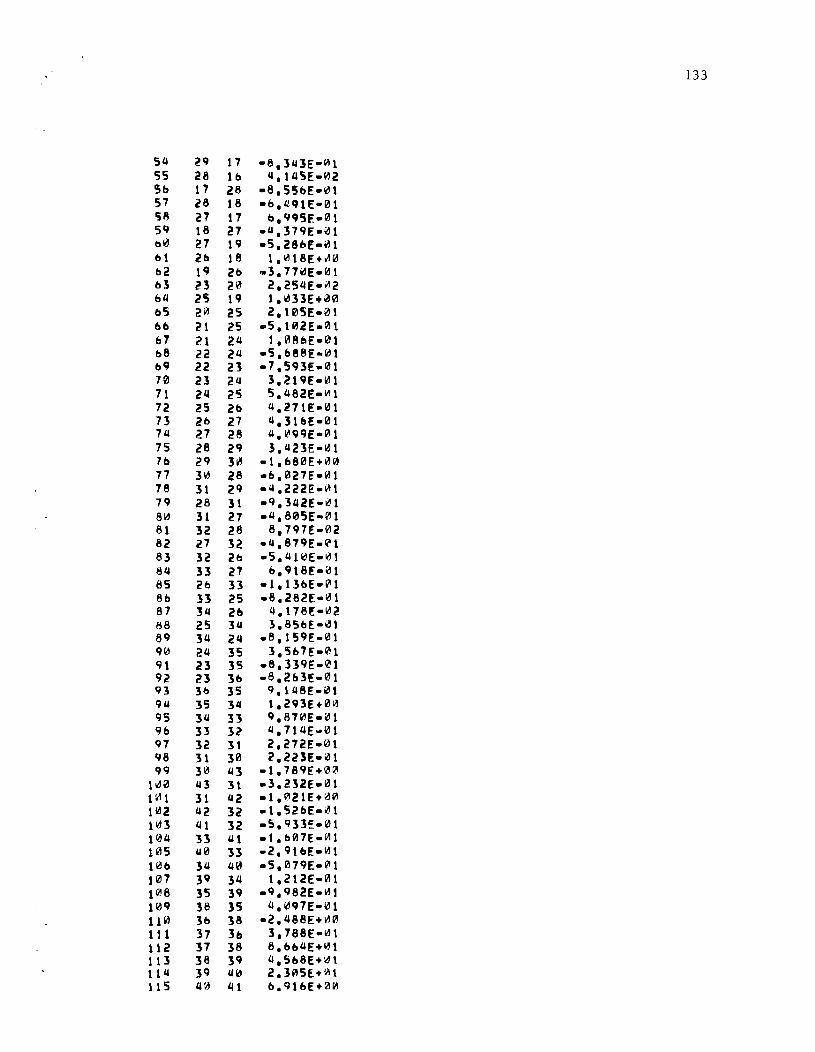
133
514 21'1 17 -8.1Q3E-~1 55 28 lb 4.145E-"'2 5b 17 28 -8.55bE-icll 57 is 18 -b.llQ1F.-01 158 27 !7 &.1'11'1511:- 0 1 51'1 18 27 -Q.37qE-"'1 b~ 27 11'1 -5.28bE-I,H &1 2b 18 1.\'H8E+~0 b2 11'1 2b .. 3.77115£-01 &1 23 2~ 2.25~E-"2 b~ 25 11'1 1. iI:lB£+0111 &5 2r.:l 25 2.105£-01 6b 21 25 .5.U2E.21t b7 21 24 1.11I8bE-01 b8 22 214 .S.b8BE-fIll bq 22 21 -7.5q3E-01 70 21 214 3.21qE-1IJ1 71 24 25 5.1482£-1<''1 72 25 2b Q.271E-01 73 2& 27 4.31b£-01 714 27 28 '1.i!lqq£-12I1 75 28 21'1 3.'123E-IjH 7& 21'1 3~ -1.b80E+~0 77 3icl 28 -b.11I27£-01 78 31 21'1 -".222E-~1 7C'I 28 31 -q.142E-~1 8~ 31 27 -Q.805E-01 81 32 28 8, H7E-02 82 27 32 -Q.87qE-~1
83 32 2& -5.Ql\i!E-~1 84 B 27 b.qt8e:-~1 85 2& 13 -1. 13bE-k'll Bb 13 25 -8.282E-01 87 3~ 2b 4.t78f- 1IJ 2 68 25 314 1.85b£-01 81'1 34 24 _8.151'1£-01 1'10 214 35 3.5b7e:- 01 en 23 35 _8. 33q£-li!Il q2 23 3b -8.2b3E-01 en 30 35 Q.U8f-l/ll 1'114 35 34 1.2q3E+0~ QS 34 3J q.870E-i/J1 qb 31 J2 4.7114£ ... 01 1'17 32 31 2.272£-01 1'18 31 30 2.223E-131 1'11'1 30 43 -1.78I'1E+00
h,0 143 3\ -3.232E-01 lk11 31 142 .1.021E+IIJfi! Ifd2 142 32 -t.52bE-il!1 1 III 3 41 32 -5. qB~-01 101.l B Qt _1.b~7E_~1
105 140 13 -2.qlb£-"'1 10b 3'1 140 -5.07qe:-01 107 31'1 3~ 1.212E-11I1 1121 8 35 31'1 -q.Q82E-1Il1 101'1 38 35 4.lIJq7E-01 110 3& 38 .2.~8eE+1il0
111 37 3b 3.788E-lIll 112 37 38 8.bb'lE+~1
III 38 31'1 4.5b8E+ldt 11~ 31'1 '10 2.305E+ fA l 115 40 ~1 b.QlbE+f/lfi!
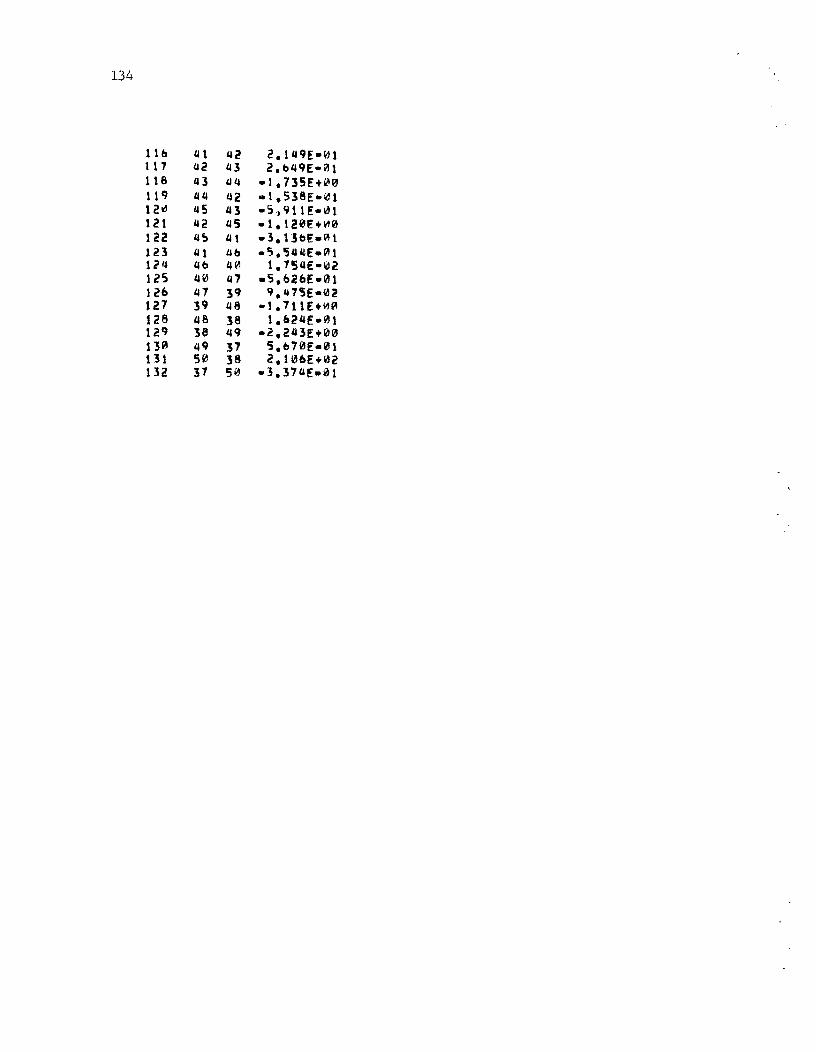
134
lib lit 42 2.149E-~1 1 1 7 lI2 il3 2.049E-l1Jl 118 ill "4 -1.735E+00 119 il4 il2 .1.538E-1(l1 12itl 45 43 -S,911E-ldl 121 42 45 -1.120EH'0 122 41) 41 -l.130E-0t 123 ill 4b -5.S4I.1E-l1Jl 124 40 4~ 1.754E-02 125 4~ 47 .S.b2bE-01 12b 47 39 Q.t.l7SE-(lJ2 121 39 48 -1.711E+I'l(ll 128 48 38 l.b24£-01 129 38 49 -2.243E+00 130 49 37 5.070£-01 131 50 38 2.10bE+02 112 37 S0 -3.374E-01
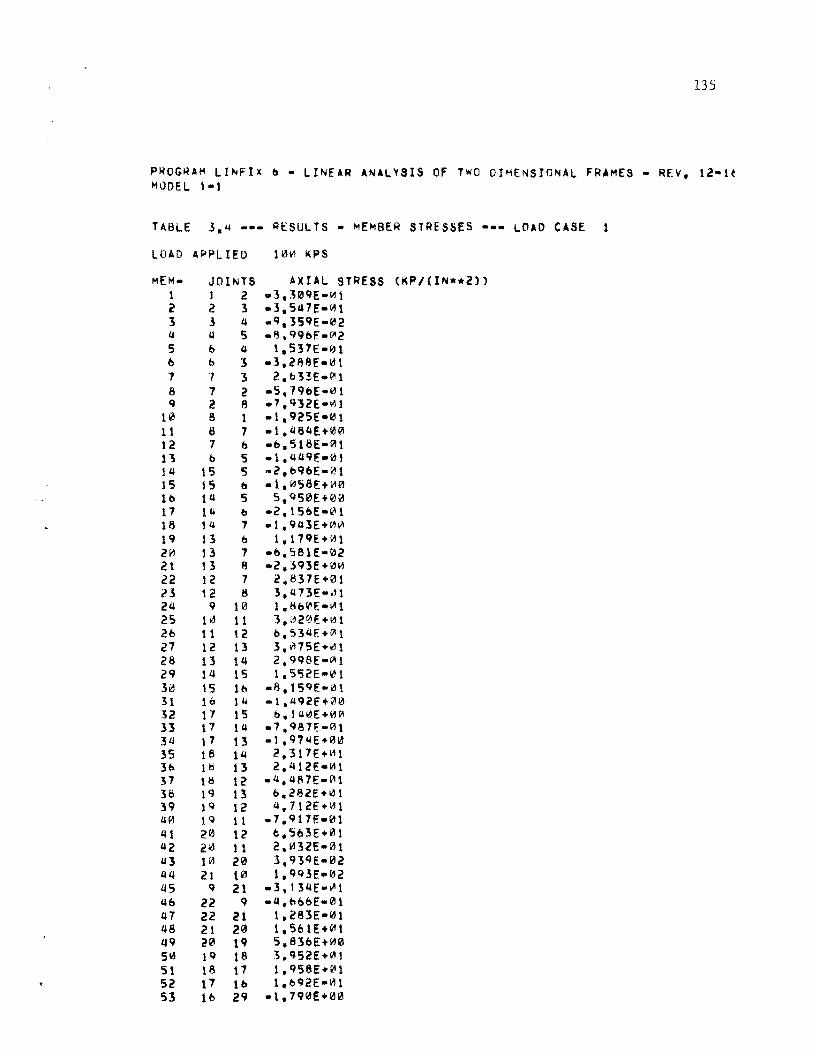
135
P~OG~AM LINFlx b • LINEAR ANALYSIS OF Twa DI~ENSIONAL FRAMES - REV. 12-1t MODEL 1-1
TABLE 3.4 ... - ~ESULTS - MEMBER STRESSES --- LOAD CASE 1
LOAD APPLIED 10Vl KPS
MEM- JOINTS AXUL STREss (KP/ (H04**2» 1 1 2 .3.311l9E-"'1 C 2 3 .3.547E-'''1 3 3 " .. 9.3S9E-e2 1.1 1.1 5 -6,Q9bE- 1il 2 5 b " 1.5HE-"1 b b 3 .3.268E-'H 7 " 3 2.b'53E.r.:'11 8 7 2 .S.19bE-Io'!1 9 2 8 .7'.C;J2E·~1
10 8 1 -1.925E-f<'1 11 8 7 -1.U84E+0~
12 7 b -b.516E- Vl 1 1'5 b 5 .1.4"9E'-'" 14 15 5 .. Z.69bE-01 15 15 b .1."'58E+i'I", 16 14 5 5. QS0EHl0 17 114 b .2.1SbE-k'1 18 11.1 7 .. 1 • 9" 3 E + th~ 19 13 b 1.179E+Vll 2~ 13 7 -b.581E-02 21 \3 f! .. 2.JQ3E+~Vl 22 12 7 2.837E+~1 23 12 (; 3,tl73E-~1 24 9 10 1.8b0E .. Vll 25 1~ 11 3, l~2!!)E+1<11 2b 1 1 12 b.S3I.1E+ ill t 27 12 13 3.1il75E+~1
28 13 14 2.C;QSE-"'1 29 lt1 15 1.S';2E-W:'I1 3~ t5 lb .8.159E-i.11 31 10 1'1 -1.Ll9c.>F+~0 32 17 15 b.IU'dE+0Q1 33 17 14 -7.q8H-~1
3" 17' 13 -lt97UE+0~
35 18 14 2,317E+ 1il 1 3b 18 13 2.412E-IH 37 18 12 .1.I.1.I87E .. Pl l 38 19 l! 0.282E+~1 39 19 12 4. 712E+~1 40 19 11 -7,917E-~1 41 2~ 12 e.5b3E+01 tl2 2\11 11 2.V132E-01 '13 1'" 20 3.93QE-02 '14 21 10 1,Q93E.1t12 145 9 21 .3~13IiE·yll
lib 22 9 .".f:lbl:>E.01 47 22 21 \,283E-'11 48 21 20 1.5t11E+"t tl9 20 19 5,83bE+Vl0 50 tc~ 18 3.952E+~1
51 18 17 1.Q5SE+01 52 17 lb 1.b92E-1i'I1 53 1b 29 .1.7Q0E+00
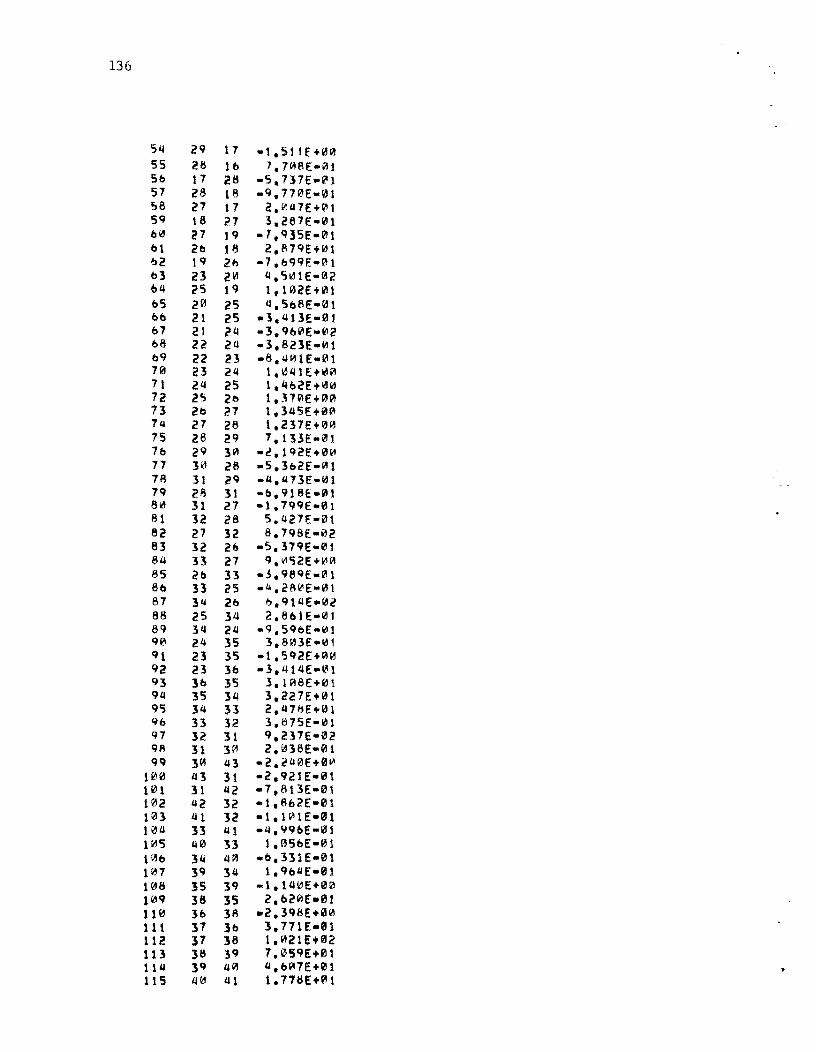
136
54 21t 17 -1."'E+12l0 55 28 10 7.7"l8E-0t 50 17 28 -5.717E"~1 57 28 18 -9,170E-01 ~8 27 17 2."'IHE+~t 59 \8 n l.287E-1II1 0" 27 ,9 -1.Q35E-0t 01 20 18 2.f\79E+~1 ~2 19 2h .7,&QqF.:-01 03 23 2111 4.5tr:ltE-02 b4 25 19 1.102E+01 05 2" 25 I.I.Sb8E-01 bb 21 25 -3. tl13E-0 1 1:>7 21 24 -3.9b0E-02 08 22 2u -1.823£-1'11 bq 22 23 -8. 41V1 1E-01 70 23 24 1.041E+0fl 71 21.1 25 1,41:>2E+III", 72 2S 2t!! 1.,HQlE+00 73 2b 27 1.145f+00 74 27 28 1.237E+0" 75 28 29 7 .133E-01 7b 29 30 -~.lC~2E+0k'1 77 3k' 28 -S.la2E-AI 7A 31 29 .4.u71£-IU 79 28 31 -b.918E-0t 811'1 31 27 -t.79QE-01 81 32 28 5.427~-0t 82 27 32 8.798E-02 83 12 2t! -5.319e:-0' 84 B 27 Q.1(11)2E+~PI
85 2b n -3.989£-1111 8f,) H 25 -4,2fH1E-01 87 31.1 2f,) ~,914e:-"2 88 25 31.1 2,801E-01 89 3'" 24 -9,590£-(01 90 24 35 1.B"'3!-"1 91 23 35 -1.SQ2E+0~ 92 23 30 -3.1.114E-(/I1 ql 3& 35 3,lflBE+01 94 35 34 1.227E+01 QI) 3'1 33 2.U7/jE"'''1 90 33 32 3,1:175£-01 'H 32 31 9.217E-02 qA 31 314 2."'36E-01 qq 3111 43 .2,24"'E+0 1J1
100 43 31 -2.921E·01 1101 31 42 -7.8tlE-01 102 '12 32 .l,8b2E-01 103 41 32 ·1,l~lE-!lJl 104 33 41 -4.YQbE-01 1Vl5 40 33 l,0SoE-01 1"0 341 4~ .o,331E-01 1~7 3q 3" 1.9t>UE-01 1{1)6 35 3Q -1.14I1E+00 109 38 35 2.b2~E-e! 11 {I) 3b 3/\ -2,198E.Ii!I~
11 t 37 3b 3.171 E-01 112 37 38 1,021£+02 113 38 39 7.0S9E+'111 11" :sq 411'1 4,o~7E+01
115 """ 41 1.718E+"1
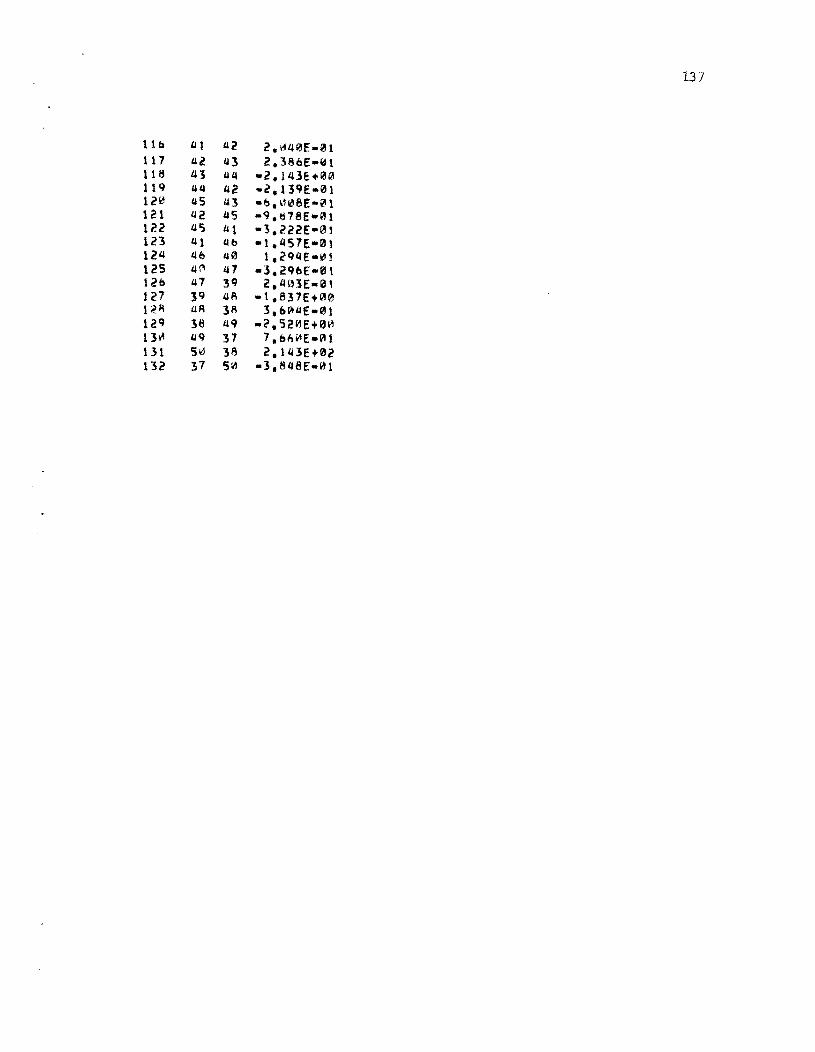
137
lIb Lll £12 2.11£10E-01 117 42 43 2.38bE-'H 118 43 4L1 -2.143E+00 119 44 42 -Z.139E-01 12~ 1.i5 1.13 -0. ~H~8E -01 121 1.i2 1.15 -9.tH8E-Al 122 1.15 41 -l.222E-01 123 til LIb -t.457E-0t 124 4b £10 1.294E-kl1 125 4" 47 -3.29&E-0\ 12b 41 39 2.403E-01 127 }9 4~ .. 1.837E+1I10 l~" lIR 3A 3.&I'4t1E-01 129 18 49 .2.52"'E+~t1 13~ £19 37 7. o/, it' E-11J 1 131 510 38 2.141E+02 132 ;s7 Sid -3.848E-01

l38
PROGRAM UNFIx b • LINEAR ANALYSIS OF TwO DIMENSIONAL FRAMES. REV. 12-it MODEL 1-1
TABLE 3.4 -.- RESULTS - MEMBER STRESSES --- LOAD CASE
LOAD APPLIED 1i:1~ KPS
"'EM- JOINTS AX UL STRESS CKF'/CIN**2» 1 1 2 -3.4HE-1/I1 2 2 3 -3.111&E-~11 3 3 4 .1.1'5oE-01 4 4 '5 -1.13ZE-01 5 0 /J 1.82~E-ldl & b 3 -3.180E-01 7 7 :3 2.bQl'5E-ft\1 8 7 2 -5.b24E-IH q 2 8 .S.I'50E-1!l1
1kl 8 1 .2.~04E-"'1 11 8 7 -1.458E+1!l0 12 7 0 -b.IJIII3E-1lI1 13 b '5 -1.4Q8E-"'1 14 15 5 -3.1~bE.-"l1 15 15 & -1.104E+00 10 14 '5 b.314E+I!l~ 17 1/J b .1.~8,:jE-01
18 14 7 -1.887E+0"l tr~ 13 0 1.182E+0\ 213 13 7 .b.870E-02 21 13 8 .2.343E+\iJ~
22 12 7 2.Q27E+011 23 12 8 3. 13I1!E-"11 24 Ii 1'" 1.7QZE-c,lJl 25 1~ 11 2. nqE+1!l1 2& 11 12 b.S81E+"'1 27 12 13 3.337E+1II1 28 13 14 3.737E-1!I1 2q 14 15 1.53IOE-11I1 30 15 lb -8.8~lE-1II1 31 ttl 14 -1.424E+"'0 32 17 15 b.8q~E+lH<1
B 17 14 .7. 423t::-1r'l1 34 17 13 -1.851E+1!l0 35 18 14 2.5bbE+~1 30 18 13 2.v\4~E·(d1
37 18 12 -5.17 4E-ell 38 1Q 13 b.5b2E+~1 3Q 1q 12 4.737E+'-11 413 lq 1 1 ·q.l1~E-'H 41 20 12 b.bUE+01" 42 2 ill 11 2.328E-01 43 111' 20 5.blll:.-1I'2 44 21 10 5.232E-iIl3 45 q 21 .Z.Q89E- 0 1 Ub 22 q -4.743E-~1 /J7 22 21 1.341E-01 48 21 21/1 1.407E+ldl 4q lq 4. n5E+id'" -2~
51!l , q 18 4.lt:lboE+01 51 18 17 2.507E+V'1 52 17 10 5.21bE-01 53 10 2Q -1.708E+00
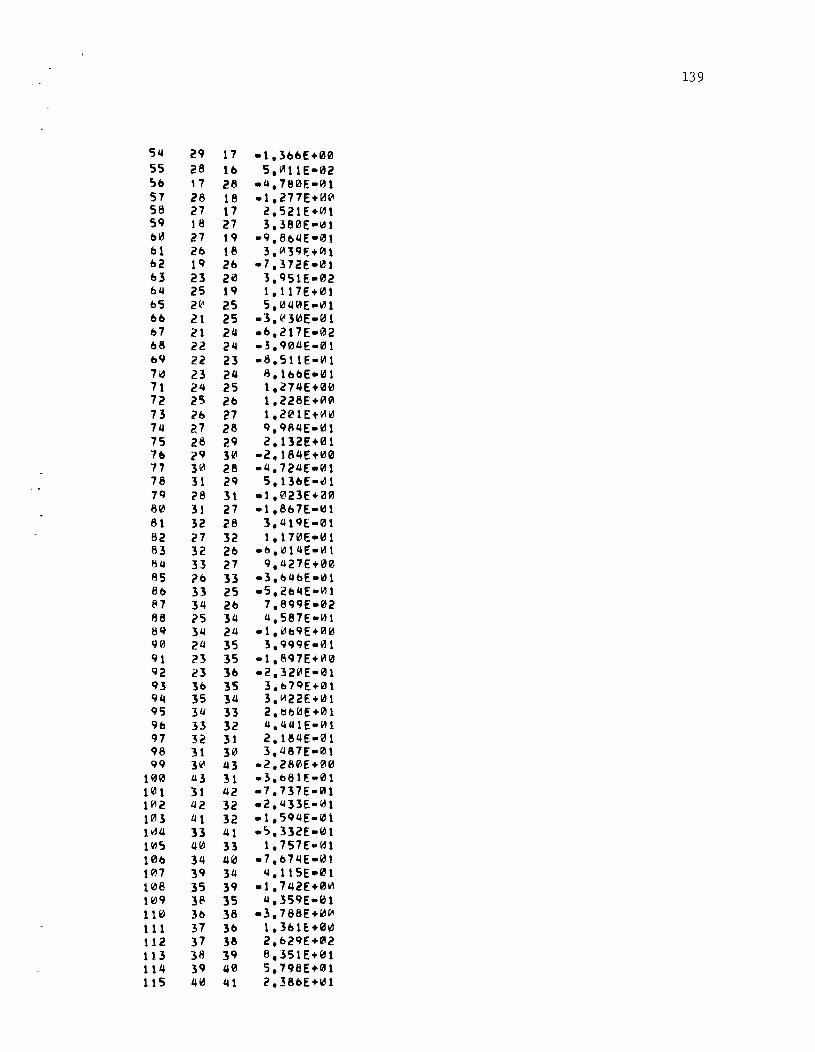
139
51.1 29 17 -1,3bbE+00 55 28 ib 5.~11E-02 ~b 17 28 -1.I,780F.-01 57 28 18 _1,277E+"i~
58 27 17 2,521E+Vl\ 59 18 27 3,380E"~1 b~ 27 19 -9,804E-01 01 20 18 3,"'3qF.+&11 b2 19 2b -7,372E-1I!1 b3 23 20 3,Q51E-02 b4 25 19 1.117E+01 b5 2k' 25 5.1r:l40E .. ldl bb 21 25 -3,WS0E-01 1,7 21 21.1 -b,217E-02 b8 U 21.1 .. ~.901.1E.-rIll b<i 22 23 -8,511E-01 7l<J 23 21.1 8,1 bbE .. IcH 71 21.1 25 1.27I.1E+liH:I 72 25 2b 1.228E+~0 73 i!b n 1.2et1Et~id 74 27 28 Q.QflI.lE-01 75 28 29 2,132E+01 7b 211 31!l -2~18I.1E+00 77 3(/1 28 -4,72I.1E-~1 78 31 29 5,13H-"'1 7Q ?8 3\ _1,023E+~1'!
80 31 27 -1,8b7E.-01 81 32 28 3.1.119E-01 82 27 32 1,170E·01 83 32 2b .. o,1£I14E·It!\ 84 33 27 9.427E+00 85 1'0 33 -3,b4bE·ltll 80 B 25 -5,2b4E·"'1 e.7 34 2b 7,8QQE·02 88 25 34 4,587E·~1 89 34 24 .1.it1b9E+00 110 21J 35 3,Q9QE·'l1 91 23 35 .. 1.897E+~(d 92 23 3b -2.32f1lE·01 QJ 3b 35 3,b7QE+0\ 94 35 31J 3."'22E+ld1 95 3/J 33 2,1jb(.1E+01 I1b 33 32 1.I,41.11E-01 IH 32 31 2,184E-01 98 31 30 3,1J87E-01 99 3 III 1.13 -2.280E+1iI0
100 1.13 31 -3,b81e:-01 101 31 1.12 -7,737E-01 11-12 1J2 32 _2.I.I!3E-01 1~1 41 32 .. 1.SQl.lf-01 !.IIlIJ 33 1J1 .5, 332E-~H lrtl5 41-1 33 1,757E-01 leo 34 4O -7,o74E-01 107 39 34 1.I,115E .. rIl1 108 35 39 _1,7'12E+0'" 111)9 3P 35 4.359E .. f61 110 30 38 .. 3.788E+Ir:l~ 111 37 3b 1.3blE+01tl 112 37 38 2.b29E+f1I2 113 36 39 8.351E+01 114 39 40 5.7Q8E..,01 115 40 41 2,38bE+1d1
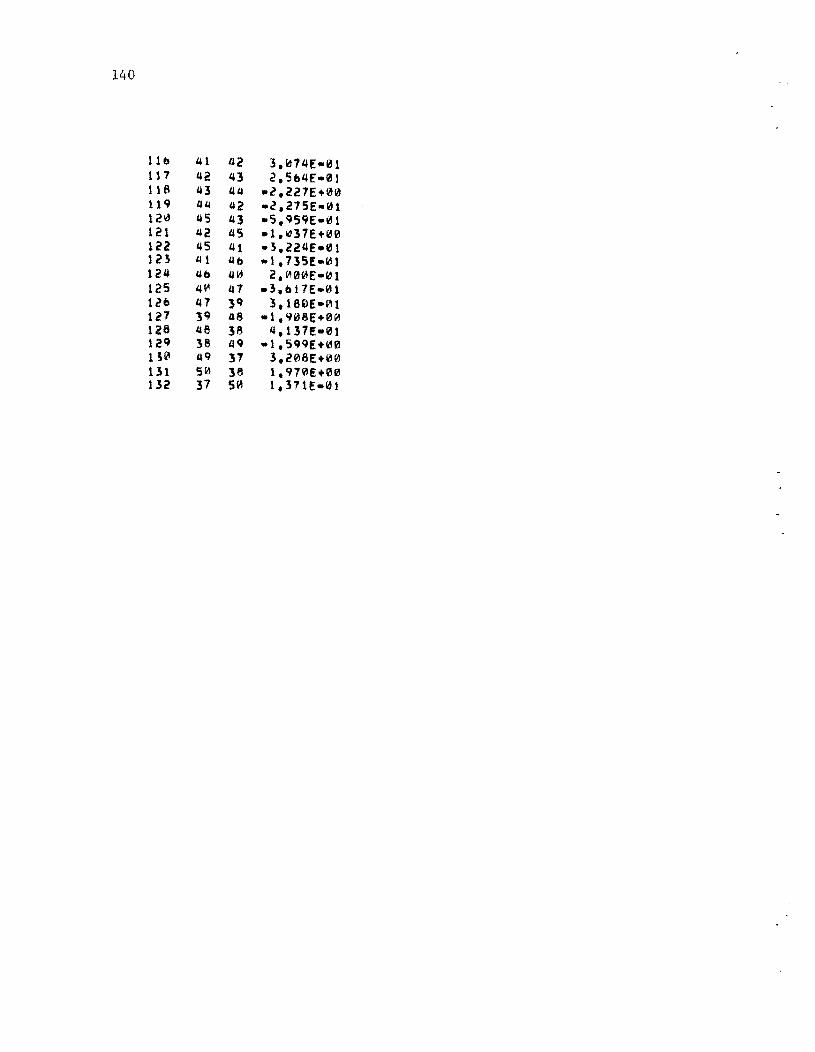
140
110 41 42 !. 1i11I.iE-IiH 117 42 43 2.5b4E-01 US '13 41.1 .2.227E+00 t 19 41.1 42 -C!,275E-ru t21i.! '15 43 .5.9SC;E·~H 121 '12 45 .1.~HE+~0 122 45 41 .1.224E-01 121 41 1.10 .1.13Se:-01 124 1.10 'Iv.! 2, ~0ftiE.01 125 4~ 47 .3.017E-01 li?b 47 19 3.180E·~1 127 39 48 .1.Y08E+0~ 128 48 38 4.tHE-01 129 38 49 -1.S99E+00 151(1 49 37 3.208E+00 111 50 38 1.970E+00 132 37 50 t,371E-ldt

APPENDIX H


143
APPENDIX H
PROGIUM LIN'I)( b - LIN!AR ANAL VUS 0' TWO DI~ENaIONAL 'RAHE! • REV, U-1b MODEL lZlII
TABLE 3,4 .-~ RESULTS - ~!M8!R 'TR[SS!S -~- LOAD CAS! 1
LOAD CUE TOTAL LOAD ]49 KPI
MEM- JOINTS AXIAl. STRESS CKP/ClN**I) ) 1 1 l .8,U4!·'1 2 2 1 -1 0 U5!+10 3 1 4 -I. ~4i!+10 4 1 5 -4,861[-11 5 2 5 .',195[ell b l 6 ".33b!ellJl 7 3 • _',IU!-1II1 8 J ., 1.8811'1!-ll
" 4 5 .l,34l!~ll U 5 b .7.2451-11 11 b 7 -l,l17hlUI lZ 4 8 -1.132!+l0 13 " " ".i!80E+f10 14 5 " .1.6b4E+9111 15 5 10 -7. 115e:-01 lb b 10 -1.032E+1I10 17 6 11 2,5n!-ll 18 7 11 -b.420E-01 19 7 12 3,50'J!-CU 29 8 9 5.ueE-"1 il 9 10 7,358!:+U 22 HI 11 5.461!+"0 23 11 12 -1.0l1!+"0 Z" 8 14 -1.223E+"0 25 " 14 -1,001(+"" 2b 13 1" .1.592E-01 27 " 13 7, "34[+"0 28 10 13 -1.591[+.,,, 21f 13 15 -3.08'!+"" JII1 17 13 5.629[_"2 31 13 16 1,"73[+01 32 11 13 2.098e:-"1 33 u. 11 -1.0b8E-01 34 11 lb 4.355E-U 35 Ib 18 3.012!+1IJ1 3b 12 10 -1.1b4E+e0 31 12 18 1.111J2E+Wl 38 14 15 4. 28tt!-"1 3" 15 17 2. "6"E+01 4(/.1 17 18 3,526E+1II1 "1 18 1" 3,8UE+01 42 l' 2B 3.7Z8E+ru 43 20 21 3.1.195[-1111 "4 1" 2" -1.S97E+11Il "5 i5 14 1."63E-"1 46 15 25 -2,278[+00 47 15 26 5.428[-02 "8 17 2b -8.8S5!-Gll 49 Z7 17 2,8UE-ll 59 18 27 1,89tE-at 51 22 27 4,S6SE-1II2 sz 18 22 1,3UE."1 53 22 28 2.'51E-"1
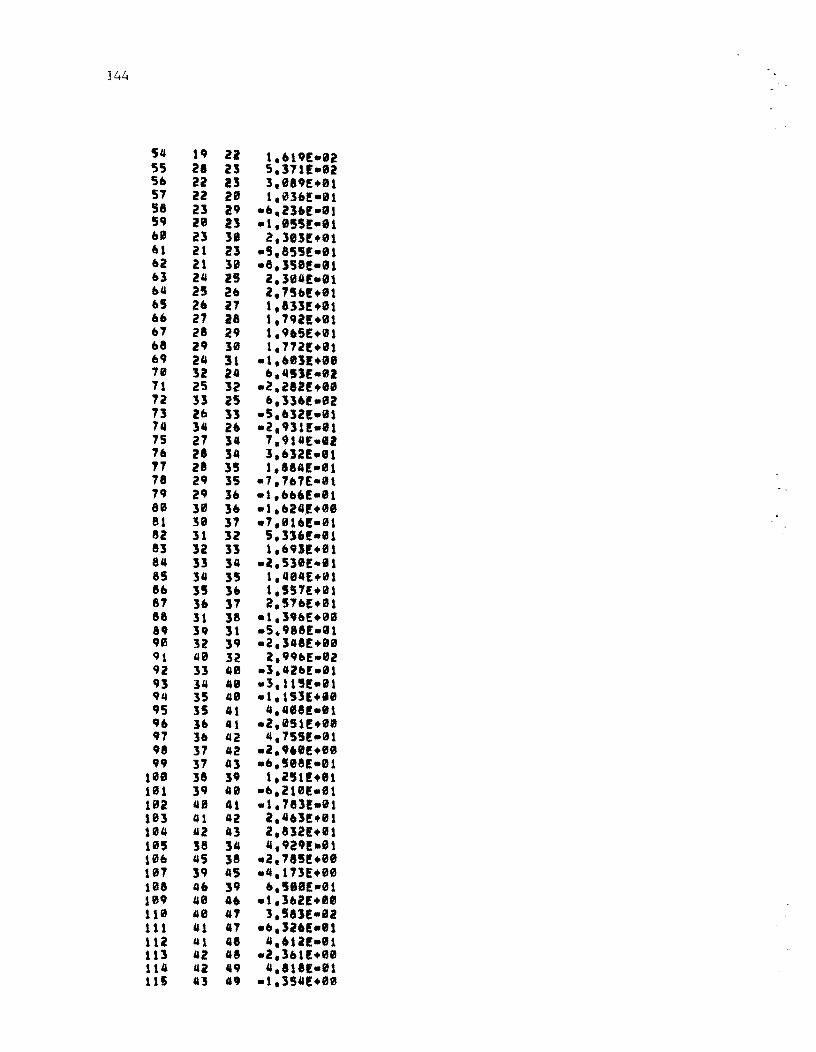
144
SII l' 21 1,01'£-"2 S5 21 23 5,31U-82 So 22 23 3,II'!+Il 51 Z2 28 I, 03o!-I 1 58 23 2' -0.210E-tU S, 20 U -1.1551-el OIl 23 31 2,3entll 61 21 23 -5,aSS!-11 u 21 38 -e,3SI!-8, 03 24 25 2.314[all Oil 25 20 Z,750!+Il oS 20 27 l,13U+ll 00 27 28 1, nU+ll 01 28 2' 1,'65£+01 U 2' 31 1. HU+ll 6' 2" 31 -1,ol3!+el 70 32 20 0,IIS'E-I2 71 25 32 -2,282£:+18 72 33 25 0,33or-1II2 n 26 33 -5,"32l-ll 711 3" 20 -2.'31E-liJl 75 27 3" 7,914E-12 70 28 311 3,&32!-81 17 28 35 l,884£-liIl 78 2' 35 -7,7&7E-Il 7' 2' 30 -1,0,,6!-Il 80 30 3" -1,"24.!+08 81 30 37 .7,lur-Il 82 31 32 5.3,.!.ll 83 32 33 t,o')!+01 84 33 34 -Z,53IE-I, 85 34 35 1, IIBIIEtll 86 35 3. 1,557!t01 87 30 37 2,51ohBt 88 31 38 -I,noE+liH1 n 3' 31 -5.'88!-"'1 'Ill 32 3' -2,348E+10 '1 40 32 2,',"!-02 '2 33 4IIJ -3,lfZ"!:-"1 U 34 40 -3,IU!-ll
'" 35 48 -I,lS3E+80 '5 35 01 4,4881-81 '6 3" 41 -2,051hll en 30 42 ",7S5£-01 ,. 37 42 .2."'£+£18
" 37 U -",S",8E-01 liS 38 3' 1.251!+1I1 101 3' 41 -",218E-01 102 41 '11 -I, ?llE-lt U3 41 42 i t "6]!t01 114 42 113 2,8321+111 105 38 34 4,'in:.et 106 45 38 -a,785!+0e 107 3' 45 -4,173[+00 108 40 3' o,58U-01 10' 40 .6 _t ,3U!+11l 110 48 4' ',5lu-el 111 41 .., d,326!"1 112 41 '" 4,6ur-Il 113 42 48 -2,3"IE+10 114 42 n 4,lu!-el US u It -t,35"Etl8
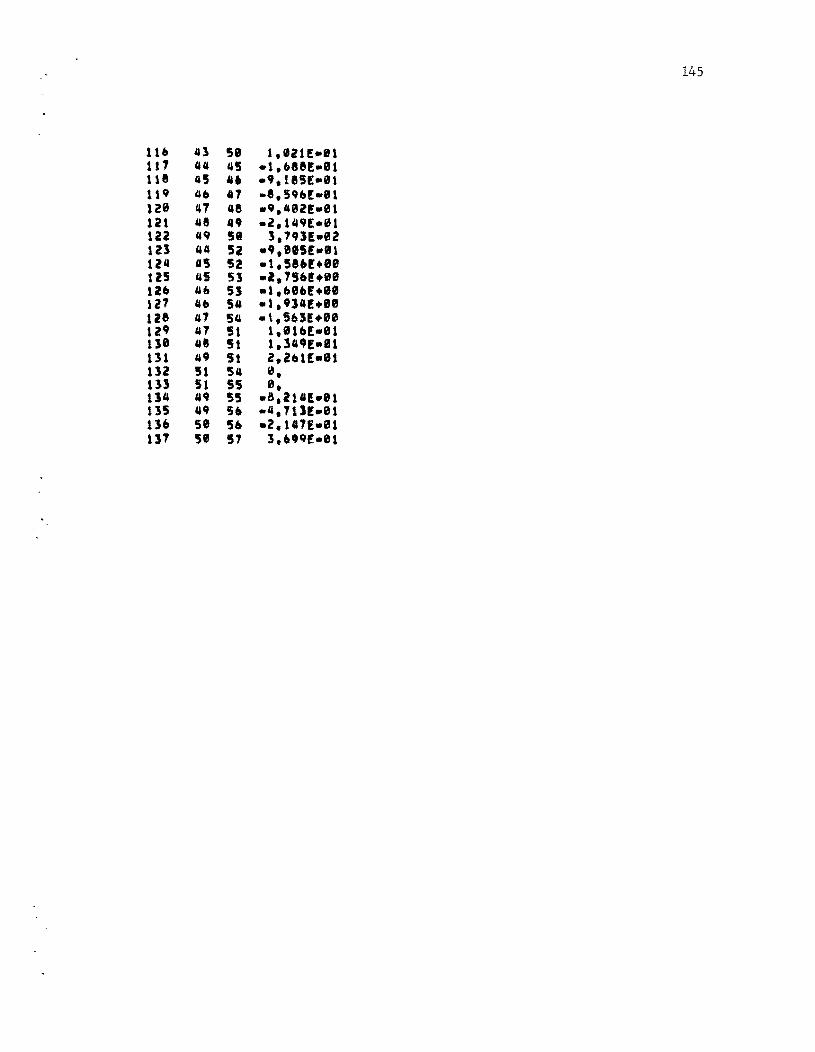
145
lU U 50 1,121[ .. 81 111 u 45 .l,oe'l·l51 11e 45 4t .9, U5E .. 01 uq Ott 11 .8,54"£:.''1 ue 41 48 .9.402!.01 121 48 n .2, 149E.01 122 49 51 3,793[."2 123 41.1 52 .9,"15E .. 81 124 45 52 .1,5'.!+10 125 45 53 .2,15U+18 U6 lUI 53 .. 1,tth!+1I1 127 46 54 .1,934!+11 128 41 54 .\,SUEtII u· 41 '51 1,0UE-01 111 41 5t l.lUE ... l 131 ... 5t 2,2"U:-1I1 132 11 54 ". 133 51 55 e. ll4 &lit 55 .8,21IE.81 135 4" 5. .4, un .. al 136 58 '56 .2,U1!-"1 131 50 !7 3.'''!1''01


APPENDIX I

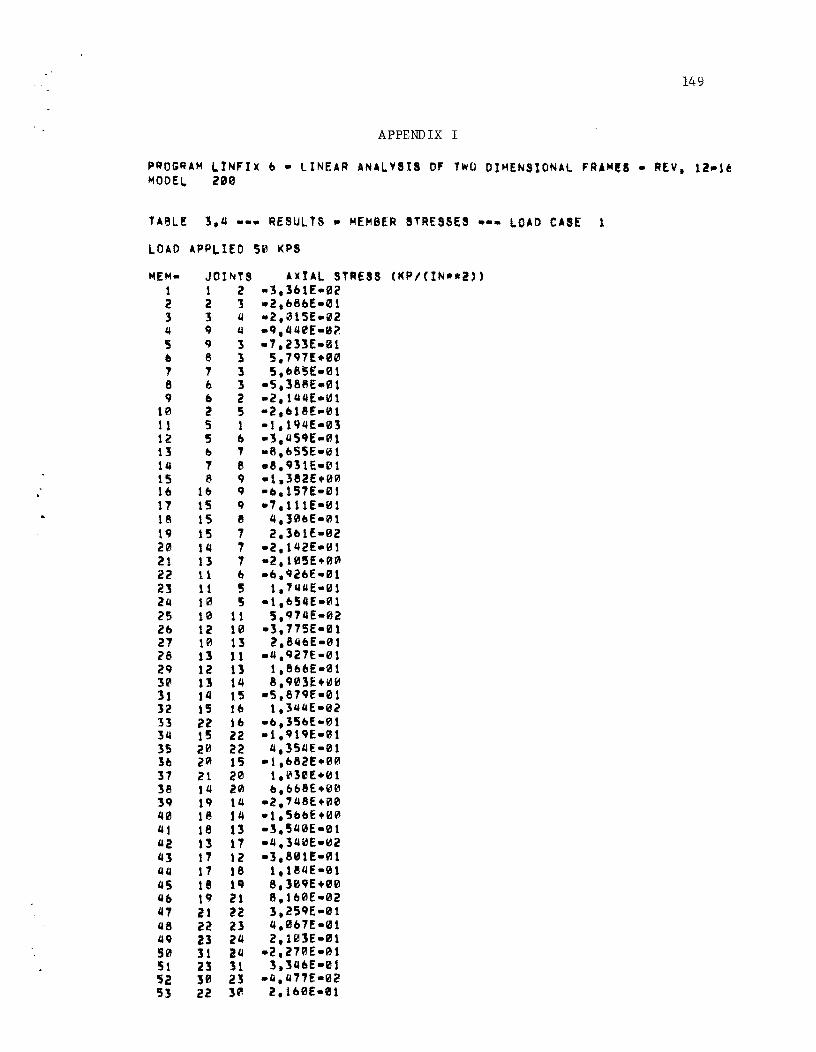
149
APPENDIX I
P~OGRAM LINFIX & • LINEAR ANALYSIS OF Twa DIMENSlONAL FRAMES. REV, 12 ... 16 MODEl. 200
HeLl!: 3,4 •• - RESULTS • MEMBER STRESSES .-. LOAD CASE 1
LOAD APPLIED 511l I(PS
"'EM- JOlhlTS Ale!AL STRESS (KP/CIN**Z») 1 1 2 .3,3blE-ez 2 Z 3 -2,b8bE-01 3 3 4 -2,015E.(lZ 4 q 4 .q,tl40E-0? 5 Q 3 -7,i33E-al & 8 3 5,7Q7E:+B0 7 7 3 5,b65E-01 8 b 3 -5,388E.01 q ° 2 .2,1 44[ • .,1
10 2 5 -Z,oI8E.01 11 5 1 -l,IQ4E.03 12 5 & -3,45CJE-01 13 0 , -e,055E-01 14 7 8 _e,cJ31E-01 15 8 q -1.382E+01ll 16 1& CJ -o.!57E-i'l1 17 15 CJ .7,111E-01 18 15 8 tI,]0&E-01 tq 15 7 2,3&lE-02 20 ttl 7 -2,142E-01 21 11 7 -2,10!E+0" 22 \l 0 -&,1I26E-01 23 11 5 l,""'E-01 24 10 5 -1,&54E-l1Il 25 10 11 5,CJ74E-02 2& 12 10 -3,775E-01 27 \0 13 2,84&E-01 28 13 11 -4,Q27E-01 2CJ 12 11 1,8&6E-~1
31/1 13 14 8,CJ03E+vHI 31 14 15 -5.87CJE-01 12 15 16 1,344E-02 33 22 1& -b,35b£-01 34 15 22 -t,qtCJE-IiH 35 20 22 tI,3511£-01 36 20 15 -1.082E+00 37 21 20 l,031!1E+01 38 14 20 0,1:I1:I8E+00 ]q lCJ 1U -2.'48E+00 tl0 1 e I tI -I,5boE+00 tit 18 13 -3.1540E-01 42 13 17 -4.340E-02 tl3 17 12 -1,801E-PI1 44 17 18 1.1e4£-01 tl5 Ie U 8. ]0CJE+B0 4b lCJ 21 8,100E-02 47 21 22 3,25CJE-(ll 48 22 23 tI,l!Ib7E-!111 4CJ 23 2t1 2,103E-1IJ1 50 31 24 .2.270E-01 51 23 31 3.346E-01 52 3" 23 .li.477E-02 53 2Z 3Q! 2,1 fJ0E-01
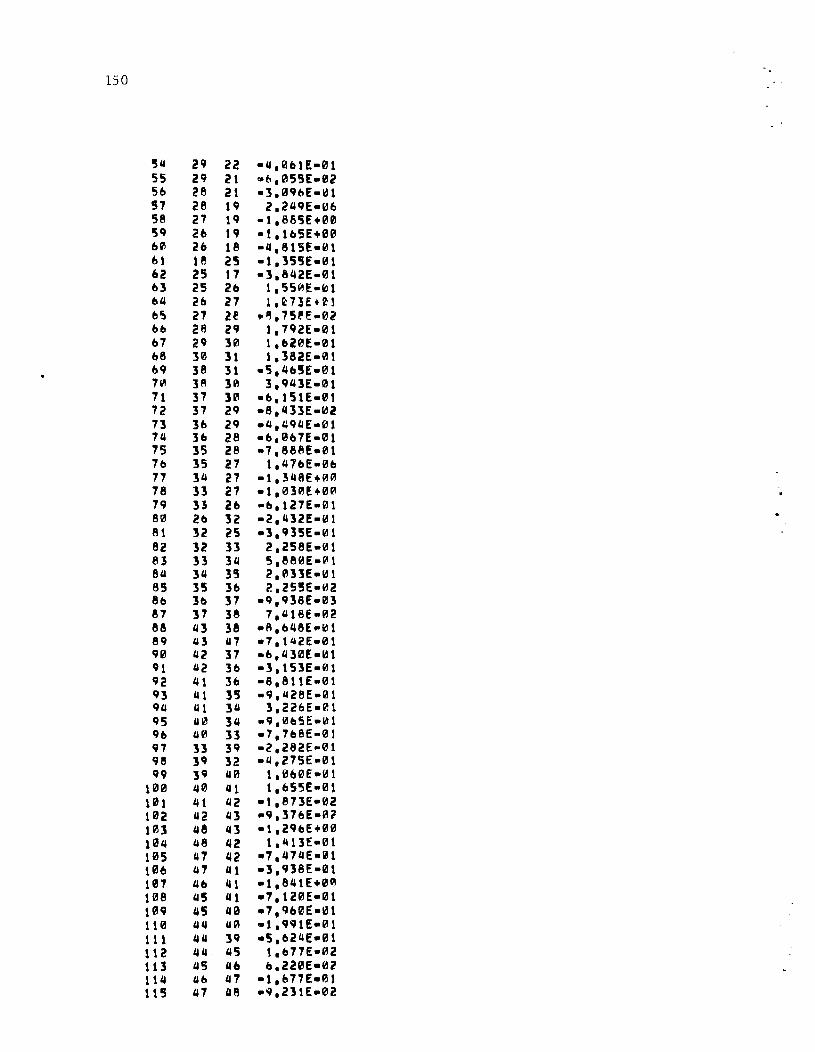
150
54 2q 22 -4.0blE-01 55 2q 21 caf,.055E-02 5b 28 21 -3.IIICJbE-161 57 28 lq 2.24CJE-~b 58 27 lq -1.88'5E+I2I121 I)CJ 26 lCJ -1.11:15E+00 60 2b 18 -4.815E-01 b1 le 25 -1.355E-12I1 62 25 17 -3.842E-QJl 63 25 26 1.55~E-1/J1 b4 26 27 1.~73E+21 b~ 27 2l! .'1.75~E-02 bb 28 2CJ 1.7Q2E-01 67 2q 30 1.620E-I2I1 68 30 31 1.382E-I2I1 bq 38 31 -'5.4b5E-01 7111 38 30 3.CJ43E-QJ1 71 37 30 -b.1SIE-0' 72 37 2CJ -8.433E-~Z 73 36 2CJ _4.~CJ4E-01 74 3b 28 -b.0b7E-QJl 75 35 28 -7.88SE-01 7b 3S 27 1.476E-0b 77 34 27 -1.348E+~/II 78 33 27 -1.03111E+01!l H 33 26 -b.127E-01 80 26 32 -2.1432E-{dt 81 32 25 -3.CJ35E-lt:ll 82 32 33 2.258E-1!l1 83 33 314 5.8MlE-filt 84 314 35 2.033E-161 85 35 3b ?.255E-~2 8b 36 37 .q.q36E-03 67 37 38 7. 418E-1I!2 88 143 38 -A.b48E .. lt:ll eq Q3 147 .7.1"2E-01 qlll 142 37 -6,1430E-161 ql 42 3b -3.153E-01 q2 41 Jb -6.811E-I2I1 q3 141 35 -q.Q28E-01 q4 141 34 3.22bE-01 q5 14O 34 -q.lIlb5E-1D1 qb 40 33 -7.7bBE-QJI q7 33 3q -2,282E-IIII q8 3q 32 -4,275E-01 qq 3q 14O 1.1660E-01
11110 40 41 l.b55E-01 101 1.11 142 -1.873E-02 102 142 143 .. q.37bE-IIIi' 11113 48 43 -1.2qbE+00 104 48 42 1.413E-01 105 141 42 .1.474E-01 106 41 41 -3. q38E-U 107 46 41 -1.841E+0!11 108 145 41 -1.120E.01 10q 45 40 .7.QbeE-i61 110 41.1 4111 ·1.QQ1E-III1 111 414 3Q .5.6214E-01 112 414 4'5 1. b77E-Pl2 113 45 46 &.220E.02 114 146 41 -1.b77E.0! 115 47 48 -Q.231E-1II2
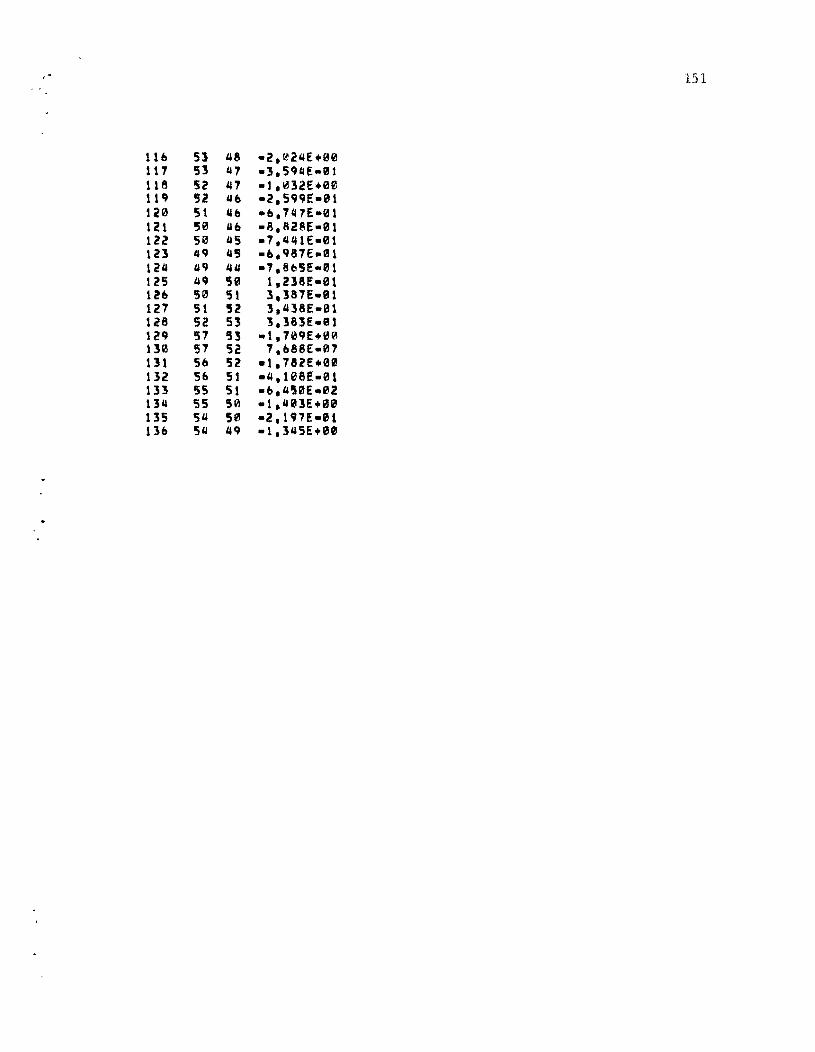
151
116 51 48 -2.f.lJ24E+0" 117 53 q7 -3.5'UE.mt 118 52 447 -1.~32E+00 l1q 52 U .2.5QQE-01 120 51 46 .6.H7E.el 12t 50 46 .e.828E.01 122 50 45 .7,Q'I1E.et t23 Qq 45 -6.lf87E.mt 124 41f 444 -7.8flSe:.el t25 41:1 50 1.UeE.at 126 50 51 3.387E-01 127 51 52 3.4]8E""1 128 S2 53 3.383E.Sl 12q 57 151 .. 1.70qE+00 130 57 52 7.688E."7 131 56 52 -1.782E.00 132 56 51 -44,USE.at 133 55 51 .6.450E.02 13u 55 5~ -1.401E+110 135 54 51!! -2. U7f;·U 136 544 4q .1.345E+00
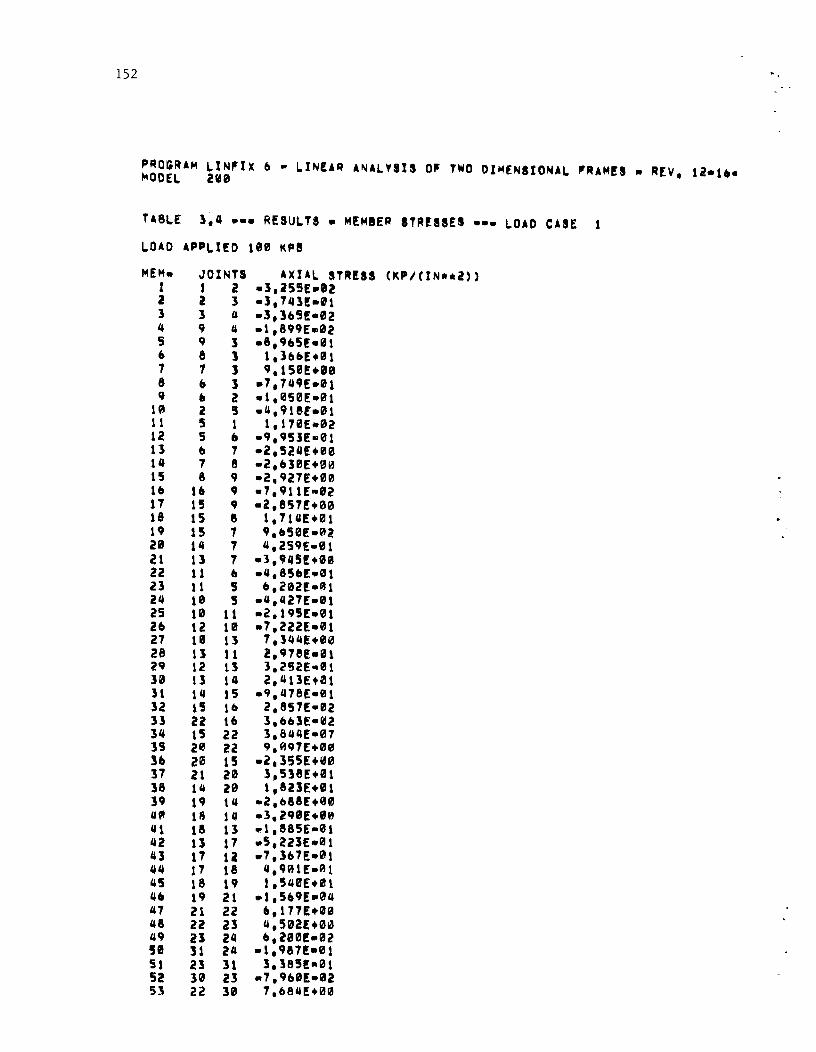
152
PROGRAM lIN~IX ~ • ~INEAR A~ALVSIS 0' TWO DIMENSIONAL 'RAM!I _ A[V, 12-1&~ODEL 2"0
TABLE ]~4 ... RESULTS • M~MeE~ STIIt!!SEI _ •• LOAD CASE
~OAD AP'LI!D te0 KPS
M!M_ JOINTS AXIAL aTRIIS (KIil/CINUl) ) 1 1 2 .],l55E.eZ 2 2 3 .],74]E·'t 3 3 a -3,H5!.02
" 9 4 -1,899E-02 5 9 1 _8,905(-fU 6 e J 1,hoE.01 7 7 1 9.15B!+U 8 ~ 1 .7.749!.01 q .. 2 -1.BS0E-"1
UI l 5 _4.9UE.01 11 5 1 l,l7iE-02 12 5 & -9,95U .. Sl 13 tI 7 .2,524(+00 14 7 8 .2,610!+00 15 8 9 -2,927(+00 10 16 CJ -7,911E1W02 17 15 CJ -l,eS7!+"0 18 15 8 1.714!+01 19 15 7 9.&50E-0l 211 14 7 4,2S9E-01 II 13 7 .}, "'5£+00 22 11 0 _4,8!5e.f.01 23 11 5 o,i"l!·~l 24 10 5 .4,427!.01 25 10 11 .2,195£-01 U \2 lI!l .7,21lE-1I1 27 1f11 13 7,344E+01/J 28 U 11 l,978Edl 2~ 12 13 3,2!12£-01 n 13 14 2,413Et01 31 14 15 .CJ,478E-S1 32 15 10 2,857[-812 31 2l 10 1.hU·ill 34 15 22 l,844!-07 15 20 22 Q,0CJ7£+IiHI 3~ 20 15 -2.355EU0 37 21 20 3.5]8[.81 ]8 14 20 1,8l1E+1il1 39 19 14 .2,088£+00 4" 18 1C! .3.l90!.0" 41 18 13 .1,S85E-S1 "2 13 17 .5,221E-01 43 17 12 .7,307!-"1 44 17 18 4,981!_01 45 18 19 1,5UE.!!!1 4& 19 21 .l,569E·04 47 21 22 6,l77E+U 48 22 23 4,502(+00 49 2J 24 6,200£-02 51 31 24 -1,9S?!.Sl 51 21 31 3,385!,,01 52 30 23 .7,90e!-,,,! 53 22 30 7,684E+00

.- 153
54 1,IJ ZZ -',9UE-n 55 2" 21 8,512E-i41 5b 28 21 18 853!-01 57 28 l' 8,453E-0b 58 17 19 -1,7"'£+00 59 21.1 19 -Z,b55E+P,f\ MIl 2f) 18 .4.3~HE .. 01 U 18 25 -3,f:S7E·cH U i!!l 11 -?,bZZE-at &3 25 2. ",7UE-el 64 2b 27 2.Z71f+el &5 27 Z8 .3.227E-01 U 28 Z9 1,503£-01 b7 29 10 1,108E-rat .8 30 31 -1.317!-01 &09 38 ]1 -5. 10ZE.01 U 38 30 4,8i8E+0i1 11 31 30 .8.1IJ78E-Bl 1Z 37 2" 1f,4SIJe:-01 13 le 29 1. 709E .. 1112 14 3b 28 t.Ul!:-01 75 15 a8 -Z,2'1eE-01 7b 35 21 b,'52U-0b 17 34 27 -1,7lSE+1!I1'I n 3] 21 .2 t 30e[ +Ii! 0
" :.n 26 -& .. 851£-01 U 2. 32 .7.IoIUE-0t 81 32 21) -7~888E.""1 82 32 33 3.894!E-01 83 33 34 2, t 11E+01 au 34 35 ·",12eE-~l as 35 30 .J,5e0E-az 8. 36 31 .4.1"le-iH 81 31 38 .1.48'E-1/I1 88 43 38 -1.10S£+00 n 43 41 -I. U5E+U '0 42 31 -3. Cl 0"E-02 91 U 3ft IJ,754E-01 IJ2 'II 3& -l.ZlfSE ... '" 91 II 35 -4,101E-01 IJ4 II 31 4.714!-07 IJ5 40 34 -l,&Z3!+IUJ 9. 40 l3 .b.541E-01 CJ7 33 3IJ -8.591E-01 IJ8 39 3l .9,08n·01 99 3CJ 40 4,llUI! .. 01
100 40 41 I.I,U1[ .. 01 101 41 42 .4,598[ .. 01 10l 42 43 .S.1ftU-01 103 48 43 -1.453[+08 U4 48 42 .. 9, 130E-02 US 41 42 1.I6SqE-~1 10b 41 41 1.8B1Edl 181 4ft 41 .1 (l0ftlE+0f1 108 45 41 -l,lUE+00 10q 45 40 -9.1CJn.01 1111 44 40 -4,402[-01 111 U 39 -I,212E+00 112 44 45 9. 18.n:-01 113 a5 4& 2.U'7Ea0t 114 4. 47 8,891E-02 115 41 48 .7.l]4E-01
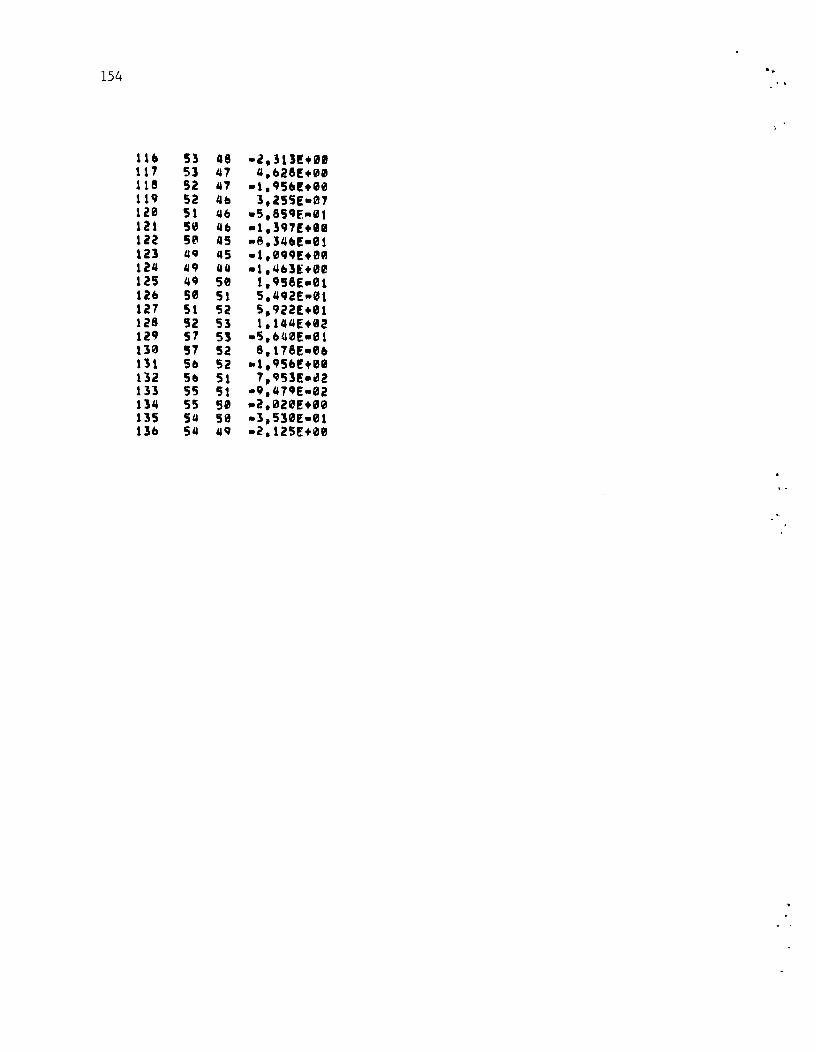
154 '.
11~ 53 48 .I,3U!+U 117 53 ~7 4,U8!+00 1115 52 4'? -1.q5~!+1lI0 119 52 4b 1,255e-07 liB 51 40 -5,8-S9f. ... 0t 121 513 40 .1,39'f+U 122 50 45 .e,]4~f-01 til 4Q 45 .1,099!+1!I1 U4 I.Iq 44 -1,4&3£+00 125 4~ 50 1, ~58E.el 12& 50 51 5,492[-01 127 51 52 5,922E+01 128 52 53 1,144E+II12 119 57 5' .S,b'l"!-"l 130 57 52 8,178Ed' 131 5b 52 -1, C;5f>!+U 132 50 51 7, CJ 53E.1II2 In 55 5t .Q,47'E-02 134 55 50 .2.020E+00 135 54 50 -1,53I!E."1 136 54 4' .2,125£+00