Embed Size (px)
Citation preview
Design of the Battery Restraint System and Battery Safety System for the REV Jet Ski.
Samuel Gribble
20501509
School of Mechanical and Chemical Engineering,
University of Western Australia
Supervisor: Professor Thomas Bräunl
School of Electrical and Electronic Computer Engineering
University of Western Australia
Final Year Project Thesis
School of Mechanical and Chemical Engineering
University of Western Australia
Submitted: October 27th, 2014

ii | P a g e
Abstract
The UWA REV Project is a staff and student body working together to design and construct
zero emission vehicles In support of the development of renewable alternatives to the
combustion engine. The project to convert a Jet Ski to electric drive was initiated in 2012
with the goal of establishing a proto type for direct comparison to a petrol engine driven Jet
Ski.
The progress of this project has been stalled due to complications with the design and safety
of the battery box. The battery box has been through numerous designs and now has one that
will safely house and monitor the temperature and charge of the batteries. Aspects from the
previous works have been used in the design as well as a more effective configuration to
minimise the weight and space used within the hull of the Jet Ski.
Safety system components have also been redesigned in this thesis to allow for a more space
efficient system. The temperature sensors and BMS chips have been changed in this thesis
due to the changes of the battery enclosure.
The completed design and construction allowed for the initial testing to commence although
the Jet Ski is yet to enter the water.
The main body of the report holds a word count of 8075.

iv | P a g e
Acknowledgements
I would like to acknowledge and thank the following people for their support and input into
this project.
x Professor Thomas Braunl, Project supervisor and director of the Renewable Energy
Vehicle (REV) teams for the support and knowledge input into this project and
allowing me the opportunity to take part in the REV program
x Brett Manners from Total Marine Technologies (TMT) for his advice and input on
this project
x Gary Light from the UWA physics department workshop for the support he and his
workshop have given this project
x REV Jet Ski team members both past and present for their informative contributions
and a great experience in collaboration and team work to achieve the project
objectives. My friends and family for their continual support through this last year of
the project, making note of my girlfriend Gabrielle Kee and my parents who have
encouraged and kept me on track all year.

v | P a g e
Contents Abstract ...................................................................................................................................... ii
Letter of transmittal.................................................................................................................. iii
Acknowledgements ................................................................................................................... iv
Introduction ................................................................................................................................ 2
Background ............................................................................................................................ 2
Project Objective .................................................................................................................... 3
Literature Review................................................................................................................... 4
Jet Ski ................................................................................................................................. 4
Safety System..................................................................................................................... 4
Batteries ............................................................................................................................. 6
Battery Box ........................................................................................................................ 7
Battery Box ................................................................................................................................ 9
Design Criteria ..................................................................................................................... 10
Battery Tubes ....................................................................................................................... 10
Battery Configuration .......................................................................................................... 13
Temperature calculations ..................................................................................................... 18
Battery Cap .......................................................................................................................... 23
Battery Restraint System...................................................................................................... 24
Safety System........................................................................................................................... 27
Temperature Sensor ............................................................................................................. 27
BMS Sensors ........................................................................................................................ 30
Pressure Release Valve ........................................................................................................ 32
Conclusions and Future Work ................................................................................................. 33
References ................................................................................................................................ 35
Appendices ............................................................................................................................... 38
Appendix A - Battery Cap ................................................................................................... 38

vi | P a g e
Appendix B - Battery Test ................................................................................................... 39
Results: ............................................................................................................................. 40
Appendix C - Battery Installation ........................................................................................ 42
Appendix D - Battery Bracket Design ................................................................................. 44
Moment of Inertia ............................................................................................................ 47
Appendix E - Overall Design Schematics ........................................................................... 50
Appendix F - Waterproof test .............................................................................................. 54
Appendix G – Jet Ski ........................................................................................................... 55
Appendix H - Fittings .......................................................................................................... 59

2 | P a g e
Introduction
The common mode of transport today is predominantly dependent on the combustion engine
and fossil fuels. This current practice is not sustainable as fossil fuels are a limited resource
and account for a large amount of carbon emissions. The current awareness of the footprint
left behind from these emissions is encouraging development in alternative renewable energy
transportation. Currently the focus is on development with land based vehicles, leaving water
crafts over looked, however, if emissions are to be reduced all sources must be considered.
Upon the success of this project there will be test data proving the credibility of an electric
powered PWC and its performance compared to a conventional jet ski. The designs,
standards and technologies used will also serve as solutions to future prospects in the
investigation into feasible renewable energy water craft.
Background The University of Western Australia (UWA) REV Project is a staff and student body working
together to design and construct zero emission vehicles due to the need for a renewable
alternative to the combustion engine. The REV team started in 2008 completing their first
land based vehicle powered by electricity (The REV Project 2014). Since 2008 have seen the
development of several REV‟s and the commercial industry has since introduced electronic
vehicles into the market such as the Nissan Leaf or the Tesla Roadster. In 2012 a proposal for
a water based REV established this Jet Ski project. This project looks to reduce the emissions
of not only land based vehicles but also water based as the water systems are also effected
from the use of water craft.
A jet ski has been chosen to be the vehicle that will be converted and tested to analyse the
feasibility of a PWC REV with the current electronic technology. The chosen jet ski for
modification is a 2008 Sea-Doo GTI 130 (Figure 1). The project is formally known as
REVjet. The REV Jet Ski is in its third year of design and construction. Several iterations in
the design of several major components during this time which highlights the contrast
between the terrestrial REV projects and this water based craft.

3 | P a g e
Figure 1: Picture of 2008 Sea-Doo GTI 130 (The REV Project 2014).
Project Objective The objective of this project is to design, construct and test the REVjet for comparison with
the performance of a conventional jet-ski. For this objective to be met the project must be
planned and researched in stages before the construction and testing begin.
At the start of 2014 the construction phase had not started as the project was still in the design
stage. For construction the correct standards must be followed and the reports on the designs
must be understood. If designs are incomplete or do not meet the standards as expected, then
the component must be modified to ensure that the critical design requirements are not
compromised.
Two types of testing will be used to confirm that the REVjet will comply with design
standards. The first being the performance testing and the limits, such as run time and
acceleration. The second will be the testing of the components to ensure they are all working
properly, such as the safety system and the motor.
The objective of this thesis is to prove a safe and efficient design for the battery box to
successfully fit into the hull. The design requirements of the box are listed below;
1. Waterproof to 2 meters
2. Secure inside the box and inside the hull without altering the hull
3. Hold 240 battery cells
4. Withstand operating temperature
5. Ensure power is delivered safely to the motor and auxiliary systems
4 | P a g e
Literature Review
Jet Ski
A background study on the various alternative PWC‟s has been undertaken and is discussed
in Appendix F. The study has found that there are now alternatives coming onto the market
and allowing people a choice. Appendix F also covers a brief background on the Jet Ski that
is being converted for future testing and comparison.
Safety System
The system will be controlled through a 12 volt DC auxiliary supply running a relay
switching the 96 volt line to power the motor if a fault is detected (White 2013). The present
design has another relay for each system switching on and off, supplying the 12 volt load for
the main relay. The system is a modular design to allow future work to be added easily and to
reduce the complexity so the chance of an error occurring is reduced (White 2013). This
design is large and uses a lot of space where it is not needed so a new system will be required
saving space by pulling away from the reliance on relays.
Temperature Sensor
The temperature sensors suggested in the previous design were the Kemo Electronic
Temperature Switch. These are 12 volt sensors with an accuracy of approximately ±10°C
(White 2013). The cut off temperature for these sensors was to be set at 75°C but the ambient
operating temperature for the batteries is set at 60°C and so the temperature cut off should be
revised to this figure (Headway 2014). The configuration and the design of the temperature
sensors will also need to be revised as the battery box has changed. Since the box has been
split up into different chambers independent of one another it is desired to measure the
temperature of each box. These Sensors are a kit that has to be built up. During the
presentation they were also scrutinised as being a “child‟s kit” and there for an alternative is
desired to be sourced.
A simple temperature circuit uses the principal of the voltage divider using a temperature
sensor and a resistor. As the temperature rises, the resistance of the temperature sensor drops
leading to a rise in the output voltage. This voltage can be used to represent the temperature
of the surroundings using the behaviour of the resistance of the temperature sensor.
5 | P a g e
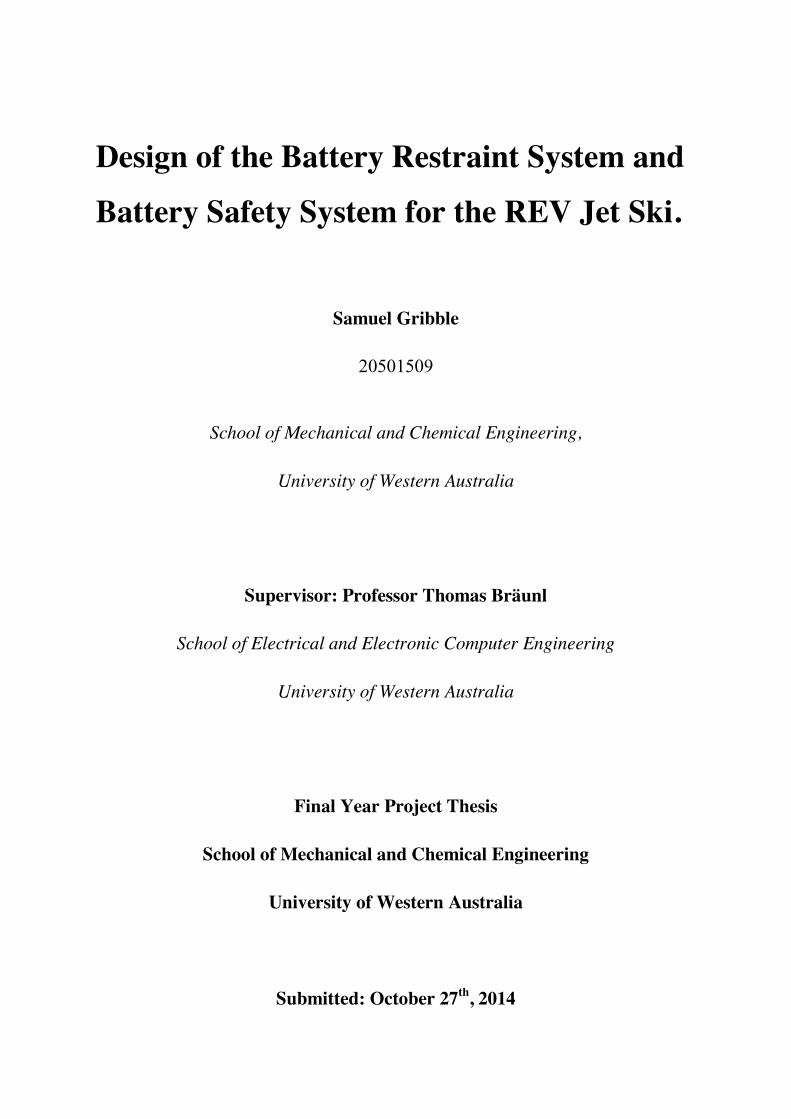
Figure 5: Simple Temperature sensor
Figure 5 shows how a temperature sensor can be used to represent temperature using the
following equation.
As temperature increases the resistance of the sensor (Z1) decreases which raises the output
voltage. This follows the behaviour of the temperature and so a value can be found using the
relationship of the change in resistance with respect to temperature.
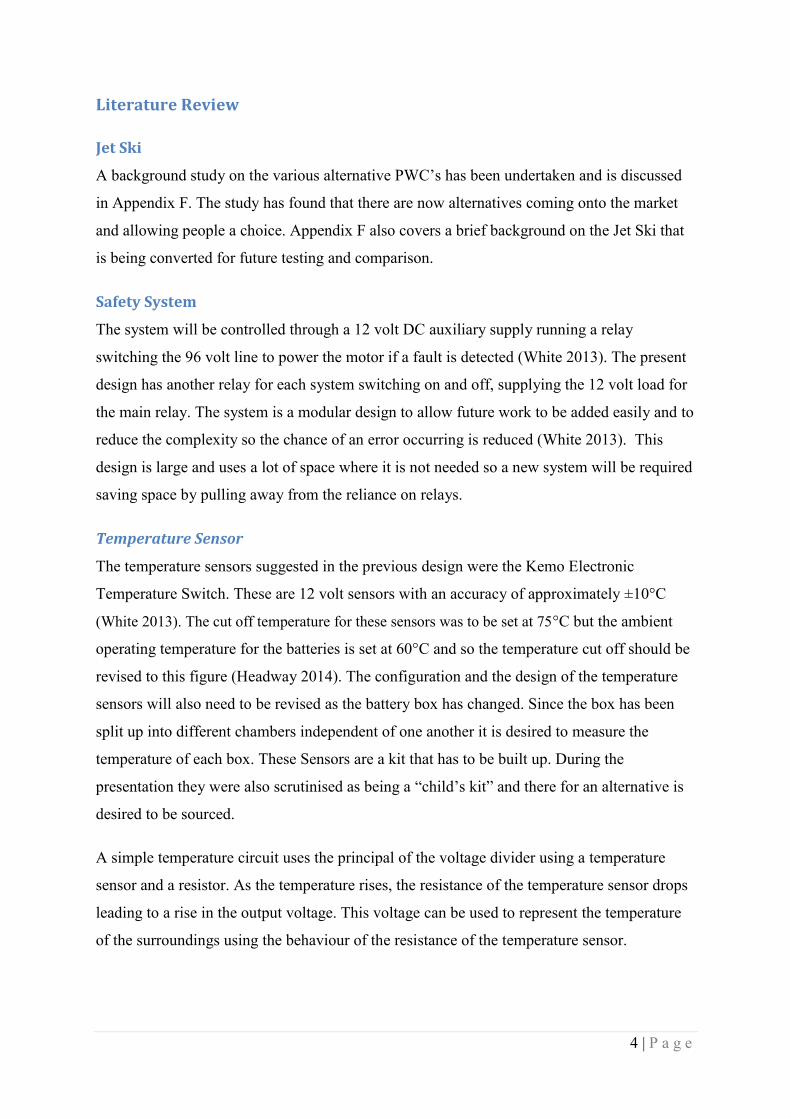
For an increased linear range and reduced error a two wire circuit can be used. This uses a
Wheatstone bridge configuration seen in Figure 6 to help eliminate resistances observed in
wires connecting them together. This allows for an increased accuracy over the simple
temperature circuit (Fraden 2010)
6 | P a g e
Figure 6: Two wire Circuit (Fraden 2010)
Battery Management System (BMS) Sensors
The BMS has an input from each voltage level in the battery pack which will mean at least 31
levels will need to be measured. This system reads whether the batteries are operating within
the specified limits. The limit for safe operation of the LiFePo4 batteries set on the chip is to
cut off at 2.5V under-voltage and 3.8V over-voltage (Zeva 2014). Once the BMS analyses the
signals from the batteries it outputs a 12 volt signal high (12V) or low (0V). To ensure the
batteries get their optimum life the batteries must operate within these limits so when the
cells charge is running low or being over charged a relay driven by the output of the BMS
will shut off preserving that battery. A relay card will be used much the same as with the
water sensors (White 2013).
Batteries
The batteries chosen to use for this project are the Headway 38120 single cell LiFePO4
battery. These were chosen as they were favourable over the other batteries on offer due to
the fact they have a better shelf life and they are safer to operate but do have a lower power
performance (Beckley 2013). These batteries are rated at 10Ah and are capable of producing
a continuous current of 30 Amps at 3.2 volts (Headway Headquarters 2014). The maximum
operating temperature of the batteries is 60oC as shown in Figure 7.

7 | P a g e
Figure 7: Table of figures for the batteries (Headway Headquarters 2014).
Since the motor is 96 volts there needs to be 30 cells wired up into series and to increase the
power 8 of these configurations (30 in series) will be connected in parallel giving the system
7.68kWh or 80Ah (Beckley 2013).
Battery Box
The battery box has been through 3 iterations of design with two project bodies already
outlining two designs that have failed to meet the requirements one of which was to fit inside
the hull.
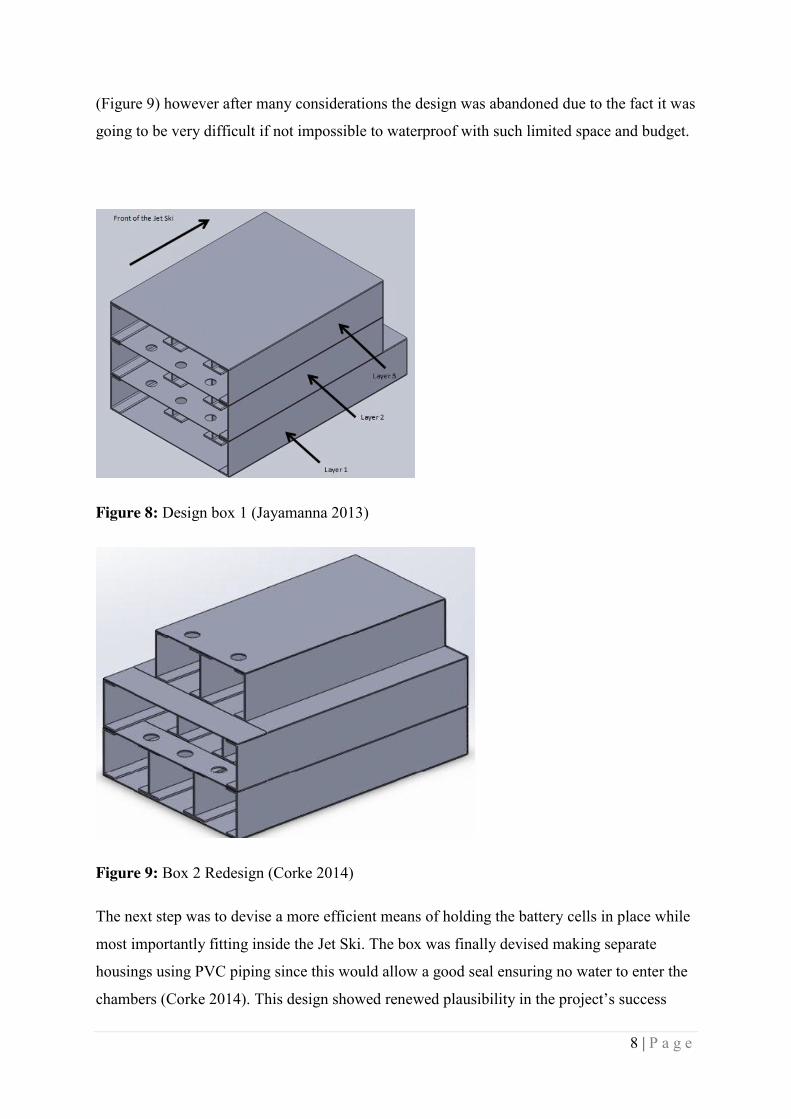
The original concept for the battery box was to create a housing to securely hold the batteries
shown in Figure 8. This then evolved to being a completely waterproof box that will hold the
batteries and sit in the hull securely without physically altering the inside of the hull. After
the parts for the battery box were sourced it was apparent that the current design would not fit
however since the components had already been purchased it was desired to keep using the
same materials to ensure the project had little waste and remained within the allocated
budget. A large amount of time was spent attempting to reinvent the water proof box from the
original aluminium. The second design proposal for the box saw a redesign saving space
8 | P a g e
(Figure 9) however after many considerations the design was abandoned due to the fact it was
going to be very difficult if not impossible to waterproof with such limited space and budget.
Figure 8: Design box 1 (Jayamanna 2013)
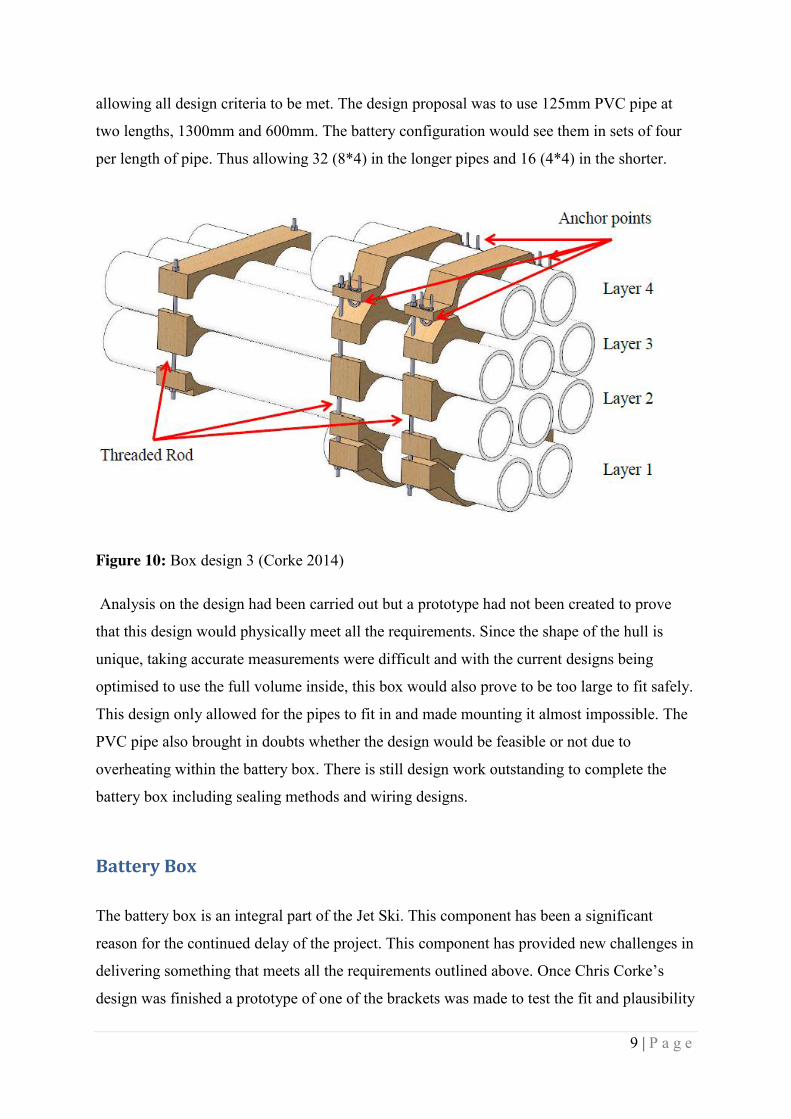
Figure 9: Box 2 Redesign (Corke 2014)
The next step was to devise a more efficient means of holding the battery cells in place while
most importantly fitting inside the Jet Ski. The box was finally devised making separate
housings using PVC piping since this would allow a good seal ensuring no water to enter the
chambers (Corke 2014). This design showed renewed plausibility in the project‟s success
9 | P a g e
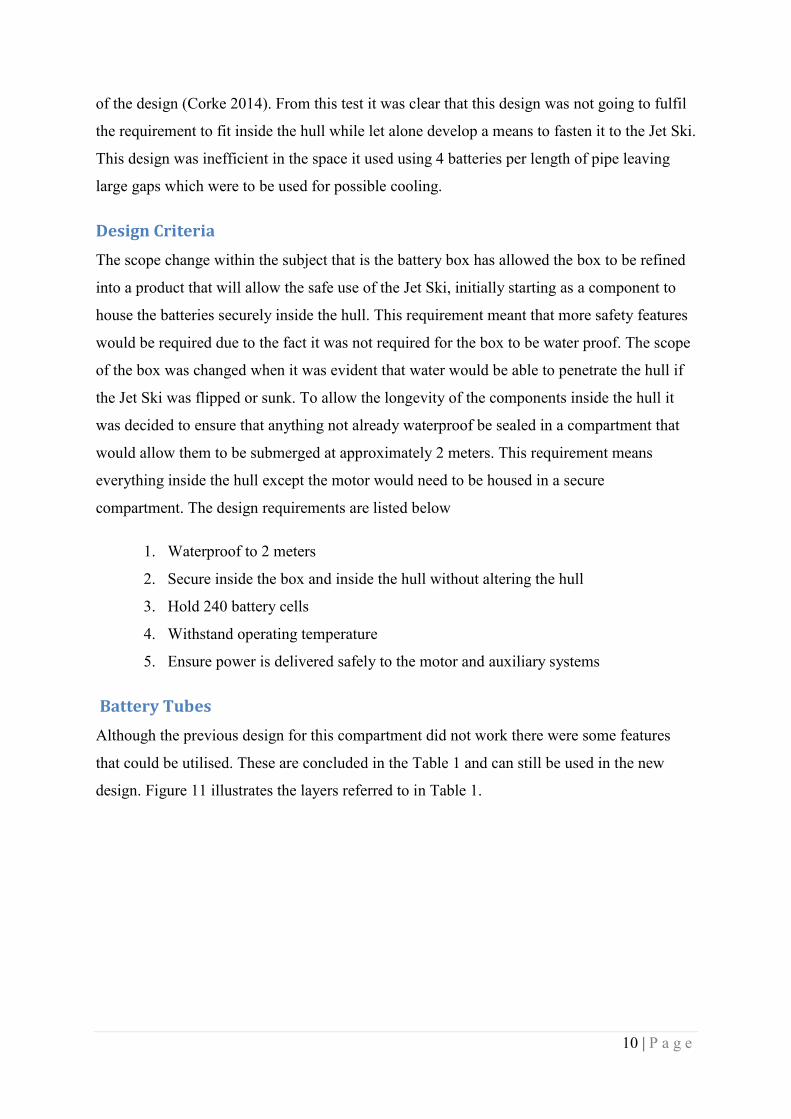
allowing all design criteria to be met. The design proposal was to use 125mm PVC pipe at
two lengths, 1300mm and 600mm. The battery configuration would see them in sets of four
per length of pipe. Thus allowing 32 (8*4) in the longer pipes and 16 (4*4) in the shorter.
Figure 10: Box design 3 (Corke 2014)
Analysis on the design had been carried out but a prototype had not been created to prove
that this design would physically meet all the requirements. Since the shape of the hull is
unique, taking accurate measurements were difficult and with the current designs being
optimised to use the full volume inside, this box would also prove to be too large to fit safely.
This design only allowed for the pipes to fit in and made mounting it almost impossible. The
PVC pipe also brought in doubts whether the design would be feasible or not due to
overheating within the battery box. There is still design work outstanding to complete the
battery box including sealing methods and wiring designs.
Battery Box
The battery box is an integral part of the Jet Ski. This component has been a significant
reason for the continued delay of the project. This component has provided new challenges in
delivering something that meets all the requirements outlined above. Once Chris Corke‟s
design was finished a prototype of one of the brackets was made to test the fit and plausibility
10 | P a g e
of the design (Corke 2014). From this test it was clear that this design was not going to fulfil
the requirement to fit inside the hull while let alone develop a means to fasten it to the Jet Ski.
This design was inefficient in the space it used using 4 batteries per length of pipe leaving
large gaps which were to be used for possible cooling.
Design Criteria The scope change within the subject that is the battery box has allowed the box to be refined
into a product that will allow the safe use of the Jet Ski, initially starting as a component to
house the batteries securely inside the hull. This requirement meant that more safety features
would be required due to the fact it was not required for the box to be water proof. The scope
of the box was changed when it was evident that water would be able to penetrate the hull if
the Jet Ski was flipped or sunk. To allow the longevity of the components inside the hull it
was decided to ensure that anything not already waterproof be sealed in a compartment that
would allow them to be submerged at approximately 2 meters. This requirement means
everything inside the hull except the motor would need to be housed in a secure
compartment. The design requirements are listed below
1. Waterproof to 2 meters
2. Secure inside the box and inside the hull without altering the hull
3. Hold 240 battery cells
4. Withstand operating temperature
5. Ensure power is delivered safely to the motor and auxiliary systems
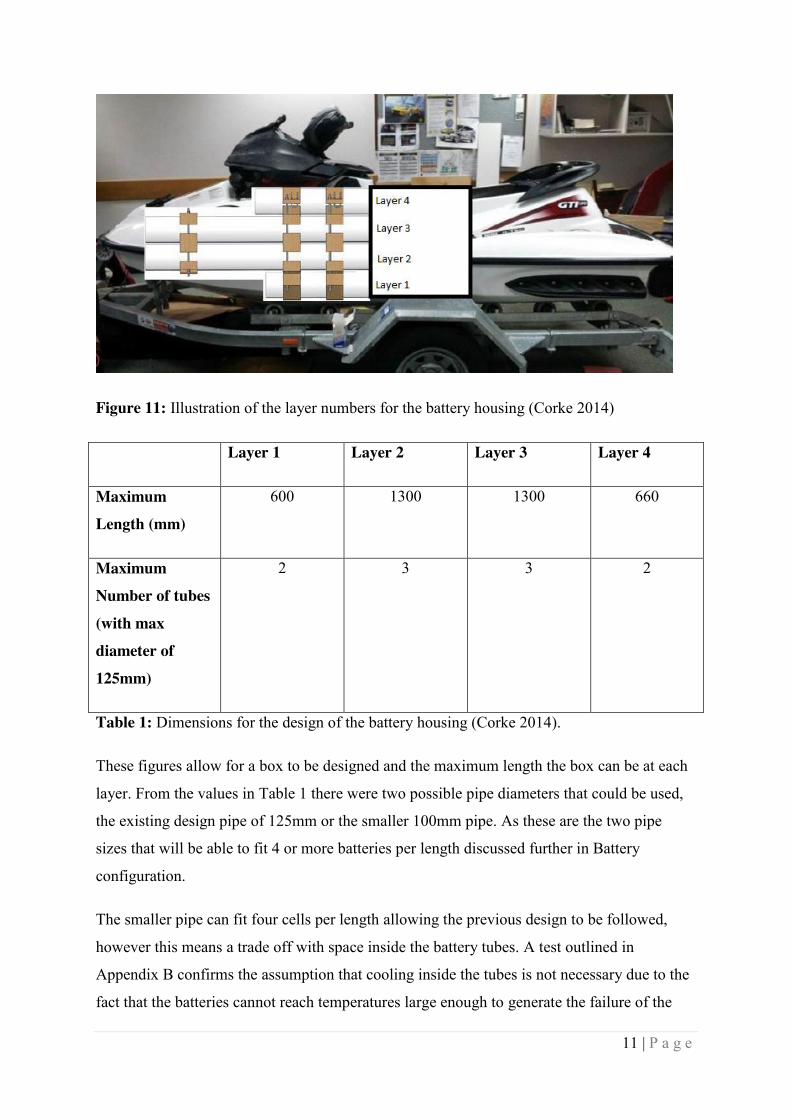
Battery Tubes Although the previous design for this compartment did not work there were some features
that could be utilised. These are concluded in the Table 1 and can still be used in the new
design. Figure 11 illustrates the layers referred to in Table 1.
11 | P a g e
Figure 11: Illustration of the layer numbers for the battery housing (Corke 2014)
Layer 1 Layer 2 Layer 3 Layer 4
Maximum Length (mm)
600 1300 1300 660
Maximum Number of tubes (with max diameter of 125mm)
2 3 3 2
Table 1: Dimensions for the design of the battery housing (Corke 2014).
These figures allow for a box to be designed and the maximum length the box can be at each
layer. From the values in Table 1 there were two possible pipe diameters that could be used,
the existing design pipe of 125mm or the smaller 100mm pipe. As these are the two pipe
sizes that will be able to fit 4 or more batteries per length discussed further in Battery
configuration.
The smaller pipe can fit four cells per length allowing the previous design to be followed,
however this means a trade off with space inside the battery tubes. A test outlined in
Appendix B confirms the assumption that cooling inside the tubes is not necessary due to the
fact that the batteries cannot reach temperatures large enough to generate the failure of the

12 | P a g e
tubes via melting. A precaution has been taken to ensure that the batteries stay healthy by
fitting each tube with a temperature sensor, which is further explained in the safety system
section. As shown in Appendix B the maximum temperature reached was 40 degrees with a
cut off voltage of 2.75 Volts per cell. This is higher than the cut off that the BMS (2.5 Volts)
will allow and so the expectation is that the battery temperature will be able to exceed the
temperatures encountered in the test as well as the operation time but not to levels high
enough due to power available in the batteries.
The advantage of using the smaller pipe allows for an increased area to allow for space to
clamp the tubes down where the larger pipes failed in doing so. This allowed the mounts to
be made thicker to ensure the National Code of Practice for the Construction and
Modification of Light Vehicles, Guidelines for the Installation of Electric Drives in Road
Vehicles (NCOP14) (Department of Infrastructure, Roads 2011) were followed as the
previous designs did not account for these standards, instead used the data received from
testing (Jayamanna 2013). Although to achieve the requirements of the National Standard of
Commercial Vessels (Australian Transport Council 2011) all that is needed is to ensure the
batteries are arranged to prevent movement due to the motion of the Jet Ski. The exact
requirements followed in this project are outlined in the battery restraining system section.
The selection criteria of the pipes was dependent on the configuration of the batteries. The
redesign of this component needed to ensure that the pipes would fit inside the hull while
allowing sufficient space for the restraining system and to allow for this to be tightened. This
requirement requires the configuration to be stated as this determines the number of tubes
needed. With the optimised length of 1300mm and the two sizes selected (100 or 125mm) the
options were to use the smaller pipe with the same number of housings (10) or redesign the
configuration mentioned below. From this a new configuration was chosen and the 125mm
pipe was used. Since the length of the batteries is only 145mm (including busbars) a
calculation was done to see how many batteries would fit into the length. It was found that 8
was the maximum possible but a lot of room was left inside the pipe. It was decided to
shorten the pipes to 1250mm to allow for more working space in the back of the Jet Ski.
The tubes will also need to be able to support the batteries in sections between the mounting
points. This requirement was addressed in Chris Corke‟s thesis using only 3 mounts. It was
found that the pipe was able to with stand the force supporting the batteries (Corke 2014).
The new design made by Alex Hildebrand has 4 mounts reducing the gap between to only

13 | P a g e
two batteries maximum between them or one join through the middle (Hildebrand 2014).
From this, the assumption can be made that the weight distributed across this length of
approximately 218mm will not affect the small or large tubes, even though the 125mm tubes
will be used for the final design.
Battery Configuration In the previous design the batteries were to use the existing plastic mounts to hold the set of 4
together. This configuration allowed for numerous designs, all dependent on how many cells
would be connected, in parallel, internally. All of the options were considered and analysed
shown in table 2.
Cells in Parallel (in the tube)
Number of Individual voltage levels
Number of BMS modules needed
1 240 30 (=240/8)
2 120 15
4 60 8
8 30 4
Table 2: shows the number of BMS modules needed for the corresponding design
The BMS chips sourced previously are capable of measuring 8 voltage levels. Having 30 or
15 modules is excessive and would require a new model of chip to be sourced. This option
was not considered due to budget constraints and better possibilities with other designs. That
leaves the 4 or 8 configuration. The original design only required 4 BMS as the blocks were
connected together with 8 cells in parallel so the pack only had 31 voltage levels. There is a
sacrifice made when choosing from 8 or 4, that is that 8 will require internal wiring between
two packs if the configuration was to fit and 4 required double the amount of BMS chips.
The other consideration to be made is the size of the pipes that will be used as stated before
either pipe would be suitable however if the larger pipe were to be used a totally new
configuration must be devised.

14 | P a g e
The configurations of the batteries have always used the battery mounts supplied by
Headway Headquarters (Headway Headquarters 2014). These limit the configuration to
square or rectangular shapes leaving the model very constrained. From previous work with
these tubes it was found that 100mm pipe would not successfully house 4 cells per length due
to the battery mounts. However they did fit inside the tubes. Upon reviewing this and
working with the batteries without the mounts a test was carried out to see the maximum
number of cells per length that would fit into the 125mm pipe.
The test consisted of a short length of 125mm pipe standing up and placing the batteries
inside. From this test it was found that exactly 8 cells would be able to fit in the tube. This
configuration satisfies the requirement of having a number divisible by 8 connecting in
parallel inside the tube. Increasing the number of cells per length from 4 to 8 doubles the
number of batteries in the tube which means only 4 would be required. This also allows for
only 4 BMS and no internal wiring connections.
That means that there are 3 designs to be considered however from Table 3 the 125mm
design is a clearly the most efficient.
Pipe Diameter (mm)
Number of cells per length
Number of pipes
Number of BMS
Internal wiring
100 4 10 8 No
100 8 10 4 Yes
125 8 4 4 No
Table 3: Battery configurations to be considered
Shown in Table 3 the clear choice is the new design using the 125mm pipe. This
configuration does not have an efficient method of ensuring the batteries are held together
securely.
To design this component the requirements were as follows;
1. The plate must be able to electrically connect the cells together
15 | P a g e
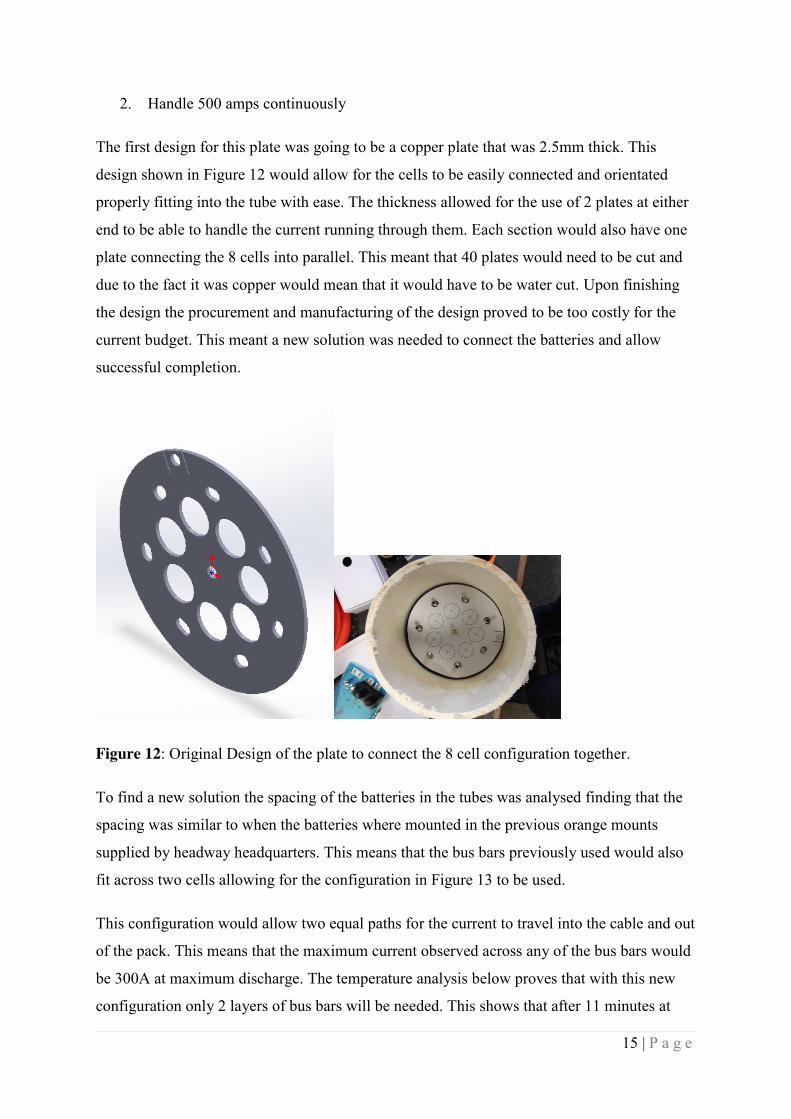
2. Handle 500 amps continuously
The first design for this plate was going to be a copper plate that was 2.5mm thick. This
design shown in Figure 12 would allow for the cells to be easily connected and orientated
properly fitting into the tube with ease. The thickness allowed for the use of 2 plates at either
end to be able to handle the current running through them. Each section would also have one
plate connecting the 8 cells into parallel. This meant that 40 plates would need to be cut and
due to the fact it was copper would mean that it would have to be water cut. Upon finishing
the design the procurement and manufacturing of the design proved to be too costly for the
current budget. This meant a new solution was needed to connect the batteries and allow
successful completion.
Figure 12: Original Design of the plate to connect the 8 cell configuration together.
To find a new solution the spacing of the batteries in the tubes was analysed finding that the
spacing was similar to when the batteries where mounted in the previous orange mounts
supplied by headway headquarters. This means that the bus bars previously used would also
fit across two cells allowing for the configuration in Figure 13 to be used.
This configuration would allow two equal paths for the current to travel into the cable and out
of the pack. This means that the maximum current observed across any of the bus bars would
be 300A at maximum discharge. The temperature analysis below proves that with this new
configuration only 2 layers of bus bars will be needed. This shows that after 11 minutes at
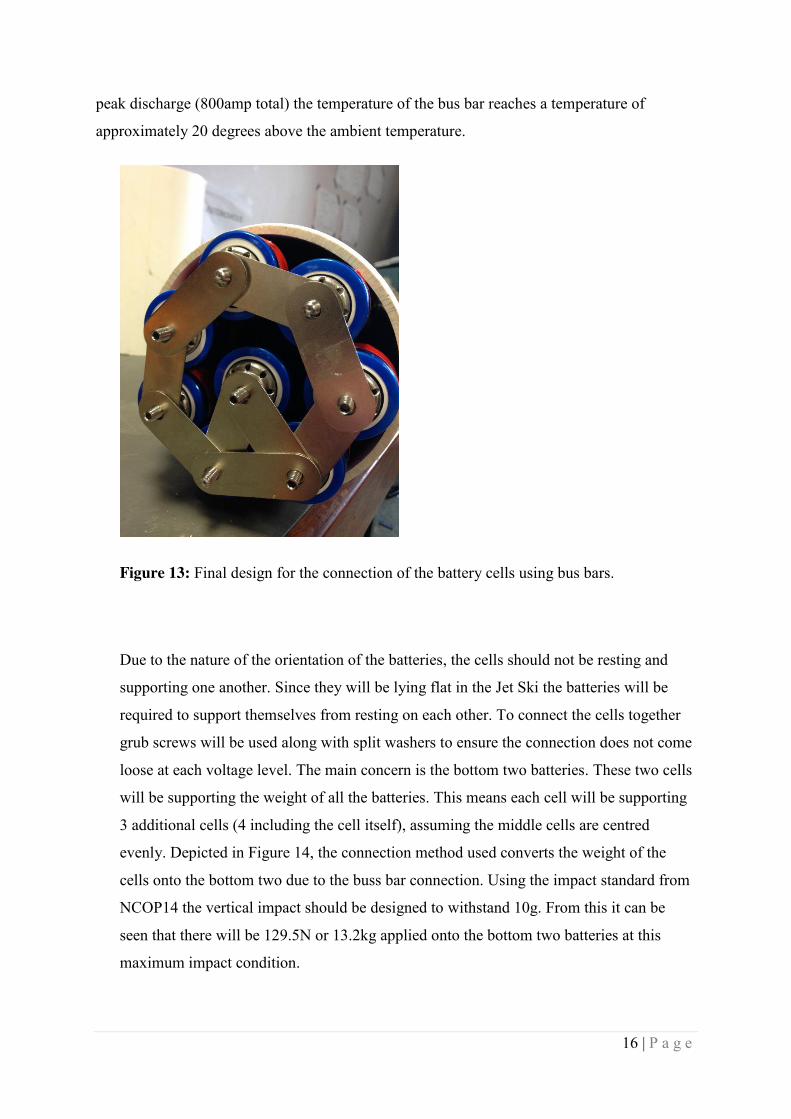
16 | P a g e
peak discharge (800amp total) the temperature of the bus bar reaches a temperature of
approximately 20 degrees above the ambient temperature.
Figure 13: Final design for the connection of the battery cells using bus bars.
Due to the nature of the orientation of the batteries, the cells should not be resting and
supporting one another. Since they will be lying flat in the Jet Ski the batteries will be
required to support themselves from resting on each other. To connect the cells together
grub screws will be used along with split washers to ensure the connection does not come
loose at each voltage level. The main concern is the bottom two batteries. These two cells
will be supporting the weight of all the batteries. This means each cell will be supporting
3 additional cells (4 including the cell itself), assuming the middle cells are centred
evenly. Depicted in Figure 14, the connection method used converts the weight of the
cells onto the bottom two due to the buss bar connection. Using the impact standard from
NCOP14 the vertical impact should be designed to withstand 10g. From this it can be
seen that there will be 129.5N or 13.2kg applied onto the bottom two batteries at this
maximum impact condition.

17 | P a g e
∑
∑
Figure 14: Diagram depicting the configuration of the batteries and force exerted on the
bottom.
This force is large and although the batteries have proven to be able to withstand such a force
when placed in storage, monitoring will need to be done when in the early stages of testing.
Since the tightening torque is only 3Nm the bolts at the ends of the batteries will require
some added resistance to vibration and loosening under work. This is a problem since the
batteries are not accessible and sparking at the terminals, due to loose connections, could
potentially cause fires.
To account for this a number of options have been investigated listed below.
1. Nalco bolts
2. Loctite
3. Wire locking
From the list above the inlock bolts were disregarded due to the fact they could not be
sourced and conductivity area would have been lost. The Loctite was also looked past as this
is a messy process and the conductivity would have been lost at the threads. This left wire

18 | P a g e
locking for the only practise suitable for this application. Wire locking is used in aeronautics
to ensure a bolt does not come loose. The method used was a double twist method suitable for
industry application. A single wire method can be used in areas with a small distance between
bolts however the distance was too far for this application (ECI 2010). Figure 16 illustrates
the technique followed twisting the wire around one another. Wire locking works by ensuring
that if a bolt is to come loose it is configured in such a way that will ensure the wire between
the bolts tightens thereby tightening the bolt next to it. This process ensures the entire battery
pack remains whole and reduces the need to constantly access and service the battery packs.
Temperature calculations In the previous design, temperature calculations where undertaken to determine the safe
number of bus bars to be used to connect the cells. This design saw a maximum of 650A
flowing between one of the connections. For a current of 650A this design was calculated to
need 3 bus bars at this connection to keep the temperature rise below a difference of 60
degrees (Beckley 2013). In the new design the maximum current flowing through a bus bar is
300A.
To make this model the heat transfer from the surroundings must be taken into consideration.
The two factors that will take heat away from the bus bar are conduction and radiation, as
there is not enough space for convection to occur. Since the volume of air inside the tube is
small it was assumed that the heat loss due to radiation was also not a factor as the ambient
temperature would be close the operating temperature. This means the effects would be
negligible. (Sukhatme 2005).
Since this is just a model, the reduction of loss means the calculated temperature of the bus
bar will be higher. From previous years there have been different calculations on the
temperature of the bus bars. The formulas below are the ones used to define the overall
equation used (Beckley 2014).
( ) ( )

19 | P a g e
( )
Where,
Qc: Heat lost to conductivity
For the other parameters refer to Table 4,
The bottom differential equation for temperature is then integrated, to give the difference in
temperature between the bus bar and ambient temperature. The equation is stated below
(Beckley 2013).
( ) ( )
Where,
T0: Temperature difference of the bus bar and ambient temperature at t = 0
Table 4 illustrates the parameter values used for this model.
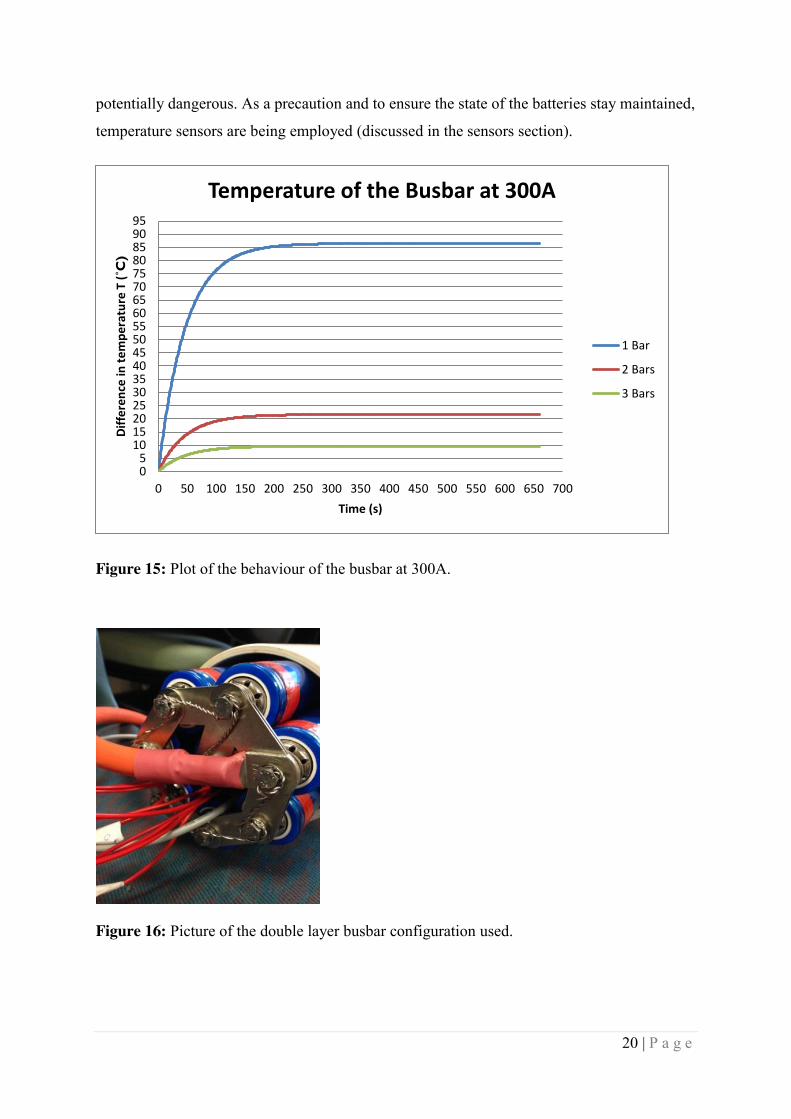
Figure 15 shows the temperature predictions of the bus bar calculated when discharging with
different numbers of plates. As illustrated 1 bar raises the bus bar temperature to
approximately 90˚C above ambient temperature, after 11 minutes of operation. Obviously
this is not desired and so the modelling of 2 and 3 bars have also been analysed. The results
show that 2 bars will raise the bus bar temperature to approximately 20˚C above ambient
temperature of the tubes. This value is acceptable and so two layers have been used as shown
in Figure 16. Figure 15 also illustrates the behaviour of 3 bars, however the size of this
configuration becomes too large and is deemed unnecessary for this case.
The temperature of the batteries was also taken into consideration (Appendix B) as these
could potentially generate a substantial heat source as well. The test shows that the batteries will only rise to 40˚C, before they are operating under the safe voltage level. Although this
test was below the nominal discharge level that the Jet Ski would be operating at, the
discharge time of the batteries would not be sufficient to reach the levels that would be
20 | P a g e
potentially dangerous. As a precaution and to ensure the state of the batteries stay maintained,
temperature sensors are being employed (discussed in the sensors section).
Figure 15: Plot of the behaviour of the busbar at 300A.
Figure 16: Picture of the double layer busbar configuration used.
05
101520253035404550556065707580859095
0 50 100 150 200 250 300 350 400 450 500 550 600 650 700
Dif
fere
nce
in t
em
pe
ratu
re T
(˚C
)
Time (s)
Temperature of the Busbar at 300A
1 Bar
2 Bars
3 Bars

21 | P a g e
Parameter Unit Value
Power generated as heat from
discharge (P) Watts (W) -
Current through the bus bar
(I)
Ampere (A) 300A
Resistance of the bus bar (R) Resistance (Ω) -
Mass of the bus bar (m) Kilogram (kg) -
Length of the bus bar (l) Meters (m) 0.04
Width of the bus bar (w) Meters (m) 0.015
Height or thickness of the
bus bar (h) Meters (m) 0.001
Cross sectional area (w.h)
(Ac) m2 0.000015
Surface area per unit length
(2.l.h+2.w.h) (As) m2 0.00275
Density of copper (Ud) kg.m-3 8940
Resistivity of copper (Ur) Ω.m 1.59*10-8
Thermal conductivity (k) W.(m.K)-1 401
Specific heat of copper
(c)
J.(kg.K)-1 385
Heat of the bus bar (Q) J.s-1 -
Temperature (T) Degrees (˚C) -

22 | P a g e
Initial temperature (T0) Degrees (˚C) 0
Time (t) Seconds (s) -
Table 4: List of figures used in the temperature model

23 | P a g e
Battery Cap Due to the fact the batteries were going to be inside a PVC tube a removable battery cap is
needed and must still meet the requirement to be waterproof to two meters. The end cap
which would always be on the negative side would never be accessible and so a cap would be
glued on with a cable gland fitted on to it for the negative line of that tube. This sides‟
waterproofness is not an issue as the gland has been tested (outlined in Appendix F) and the
cap will be glued on. This leaves the Positive end cap which is required to be removable and
still provide a seal.
Brett Manners stated his companies‟ (TMT) solution for this application is to use a flange
seal and a plate. This seal is effective to large depths as proven via TMT and so would be a
feasible design for this application. The design did not move forward due to the budget of the
project and an alternative was needed to be designed.
The new design used the idea of the plate compressing an O-ring into the flange creating a
face seal in the old design to create a cheaper alternative. This design uses a gland seal
created via the cap and the pipe. Since the type of groove has changed from a face, which is a
stronger seal, to a gland seal the number of O-rings is needed to be determined. In the
Transeals O-ring handbook it states that when experiencing pressure under 1500psi only one
is needed. Since the requirement for waterproofness is only 2 meters the pressure experienced
is only approximately 3psi and there for only 1 O-ring is required (Transeals 2012).
From the handbook there is also a chart for designing the groove size required for a correct
seal. Since the thickness of the cap is approximately 5mm it was chosen to use the 2.62mm
O-ring. Figure 17 shows the parameters used to design the groove to be cut into the cap. The
only parameter that was not followed was the F value, this is the chamfer or lead-in value
however this is a minimum value and so the chamfer cut onto the pipe had an F value of
2mm.
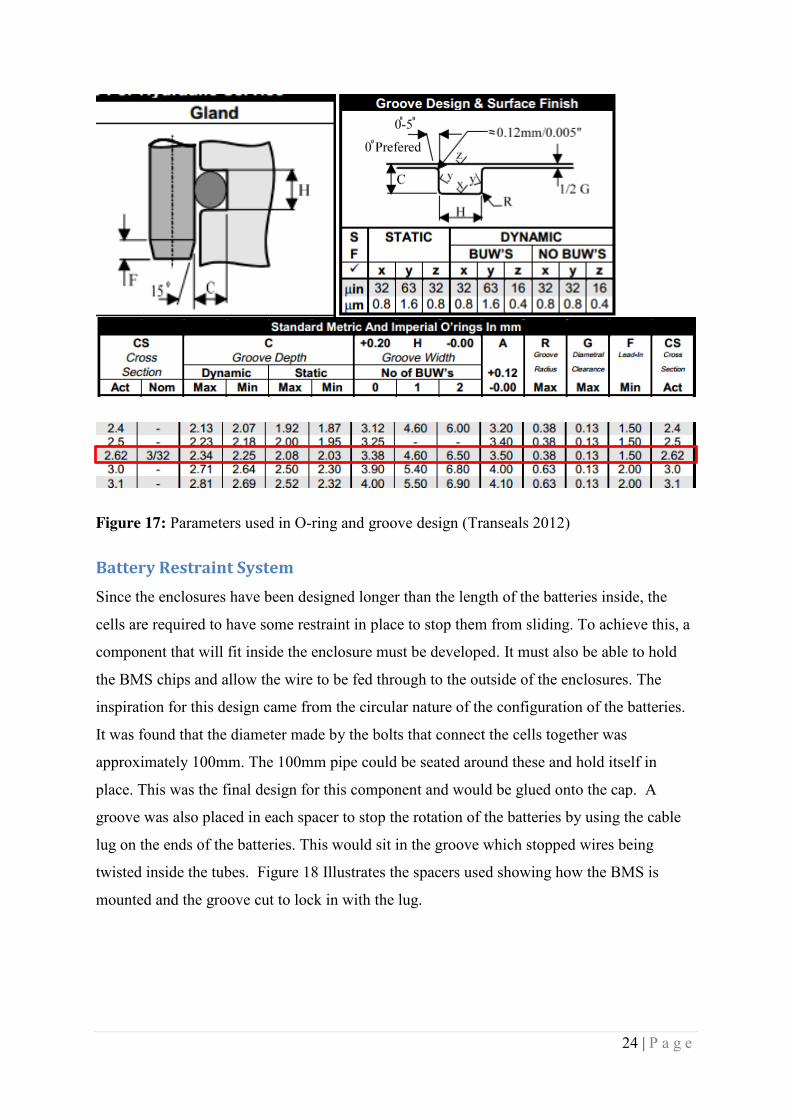
24 | P a g e
Figure 17: Parameters used in O-ring and groove design (Transeals 2012)
Battery Restraint System Since the enclosures have been designed longer than the length of the batteries inside, the
cells are required to have some restraint in place to stop them from sliding. To achieve this, a
component that will fit inside the enclosure must be developed. It must also be able to hold
the BMS chips and allow the wire to be fed through to the outside of the enclosures. The
inspiration for this design came from the circular nature of the configuration of the batteries.
It was found that the diameter made by the bolts that connect the cells together was
approximately 100mm. The 100mm pipe could be seated around these and hold itself in
place. This was the final design for this component and would be glued onto the cap. A
groove was also placed in each spacer to stop the rotation of the batteries by using the cable
lug on the ends of the batteries. This would sit in the groove which stopped wires being
twisted inside the tubes. Figure 18 Illustrates the spacers used showing how the BMS is
mounted and the groove cut to lock in with the lug.

25 | P a g e
Figure 18: Spacer to stop the batteries moving in the enclosures.
To restrain the enclosures from sliding, two measures have been employed; the first is the
mounting brackets designed and explained in Alex Hildebrand‟s thesis, (Hildebrand 2014)
and the second is a bracket that will sit on the end of the cap. The design of this bracket took
its inspiration from the bracket a car uses to fix its batteries to the chassis, such as the one
depicted in Figure 18. This bracket would have to be able to withstand a maximum bending
moment of 403Nm. This value was derived assuming the mounting brackets have completely
failed at clamping and also ignores friction to ensure complete safety. The calculation in
Appendix D shows the derivation used and the profile of the bending moments on the bracket
in Figure D-2.
Figure 19: Car battery bracket (Deal Extreme 2013)

26 | P a g e
Since the Previous battery box‟s materials have already been procured there was a large
amount of aluminium C-channel that was no longer being utilised. This channel had been
specified to fit the batteries inside and so it was approximately the same size as the new
125mm PVC pipe. Since the C-channel was not being used it was decided that this would be
a suitable material for the bracket. The function of the bracket is capable of holding much
more than is required of it that is to be used in this situation however the materials were
already readily available. In appendix D the safety factor of this bracket is found to be
approximately 13 when experiencing an impact and adhering to the requirement stating it
would withstand 20g‟s (Department of Infrastructure, Roads 2011). Appendix E shows the
final design specifications of this plate. The plate‟s holes are to allow the cables, data ports
and pressure valves mounted on the cap to fit through.
In Figure 19 the bracket will also require a rod to fix it. To achieve this, the mounting bracket
will be used as the fixed point once clamped down. The threaded rod needed will also need to
be determined using the same conditions assumed for the calculation of the bracket itself. The
maximum force experienced by one rod will be 4905N (Weight of one battery tube shown in
Appendix D) and using stainless steel means the calculation is shown below.
√ √
Where,
F: Force (4905N)
Yield Strength: Yield Strength of stainless steel (205 MPa) (Atlas Steels 2011)
From this calculation it was decided that 8mm stainless steel rod would be used. To be able to
reach the end of the pipe each rod would have to be 25mm long. A stainless steel plate is then
welded on to the end to clamp in between the two mounting brackets. In Alex Hildebrand‟s
thesis a calculation is done to prove it will hold the mounting brackets which are under more
force than this system so it is assumed to be acceptable for this use (Hildebrand 2014). Figure
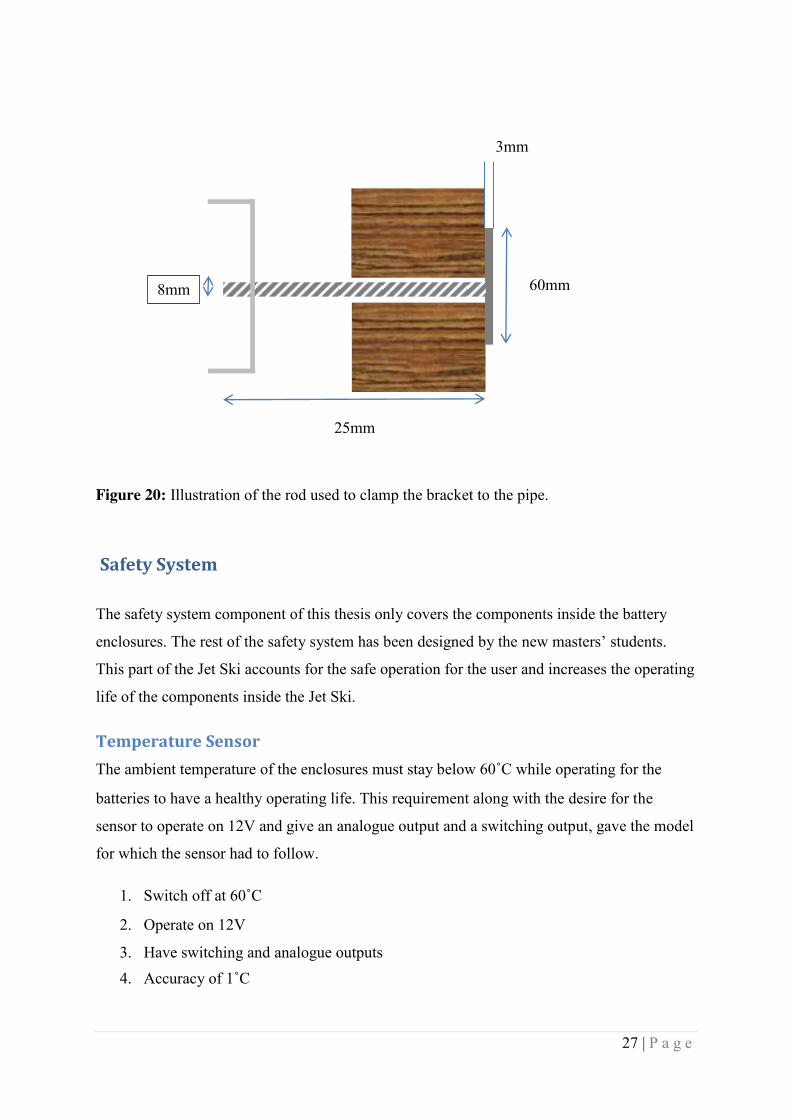
20 illustrates how the rod will work.
The rod will then be tightened at the plate end using M8 niloc stainless steel nuts and a
Teflon washer to separate the aluminium and the stainless steel.
27 | P a g e
Figure 20: Illustration of the rod used to clamp the bracket to the pipe.
Safety System
The safety system component of this thesis only covers the components inside the battery
enclosures. The rest of the safety system has been designed by the new masters‟ students.
This part of the Jet Ski accounts for the safe operation for the user and increases the operating
life of the components inside the Jet Ski.
Temperature Sensor The ambient temperature of the enclosures must stay below 60˚C while operating for the
batteries to have a healthy operating life. This requirement along with the desire for the
sensor to operate on 12V and give an analogue output and a switching output, gave the model
for which the sensor had to follow.
1. Switch off at 60˚C
2. Operate on 12V
3. Have switching and analogue outputs 4. Accuracy of 1˚C
60mm 8mm
25mm
3mm

28 | P a g e
There is a vast range of different types of temperature sensors that would be suitable for
monitoring the temperature inside the enclosures. Table 5 illustrates all the temperature
sensors considered.
Sensor Accuracy (˚C)
Temperature Range (˚C)
Resistance @25˚C (Ω)
Resistance Scale
Output
Thermistor ±0.1 -40 to 150 2k to 100k Logarithmic Analogue
Resistance
Temperature
Detectors
(RTD)
±0.1 -200 to 800 100 to 1000 Linear Analogue
Semiconductor
Temperature
Sensors
±0.5 to ±10 -50 to 150 2k linear Analogue/
switching
Table 5: Temperature sensors considered for design. (Keating 2008)
From Table 5 all of these sensors would be a suitable choice for the monitoring of
temperature. A thermistor is not a desirable choice due to its non-linear behaviour with
respect to temperature changes. This leaves the RTD and the semiconductor. Either one
would be suitable however the RTD would require a comparator due to the fact its output is
analogue. For simplicity and size a semiconductor was chosen.
There were two chips considered,
1. LM335
2. TMP300
The LM335 was an analogue chip that would still require a comparator to switch the input at a defined temperature for this case 60˚C. This chip operates of a maximum of 3V. The
circuits shown above in the literature review can be used to increase the accuracy of the
sensor output due to disturbances. (Texas Instruments 2013)
The TMP300 is a dual output chip that is capable of switching and producing an analogue
output. This chip was chosen to be used to monitor the temperature as it was able to switch

29 | P a g e
and produce a temperature reading while saving space. It is also able to operate at 12 volts as
per the requirement, as the LM335 cannot. This temperature sensor increases with a linear relationship between temperature and voltage. The analogue output rises at 10mV/˚C and has
an accuracy of 1˚C. Figure 21shows the internal diagram of the chip. The TMP300 uses a
differential op-amp to compare the calibrated temperature Tset to the observed temperature
Vtemp. When these two are equal the transistor switches and the output is cut off. (Texas
Instruments 2011)
Figure 21 also illustrates the pin numbers for the wiring of the chip. Caitlyn Mitchell from the
masters group designed and etched the Printed Circuit Boards (PCB) that will hold the chip.
The wiring for this chip uses a 6 core that runs to the end of the tubes.
Figure 21: TMP300 Chip diagram (Texas Instruments 2011)
The set point for the TMP300 is calibrated with the equation supplied on the datasheet and
shown below,
( ) ( )
Where,
Tset is in ˚C. (Texas Instruments 2011)
From this and the decision to set the trip point at 68˚C to allow for interference and the
batteries to reach the full potential as there is only one sensor per tube, the resistance can be
calculated. Using the equation above the resistance used is calculated to be 390kΩ (rounding
down).

30 | P a g e
The testing of the now calibrated chip consisted of raising the ambient temperature using a
heat gun and monitoring the temperature using a multimeter. It was found that half of the
chips were damaged during installation or faulty as they did not operate as specified. Each chip was tested 3 times and it was found that each one would switch at 68˚C as specified
when the chips performed correctly. The output from the switching line was found to range
from 0.8-1.2V and so to be compatible with the new safety system, the line would have to be
sent through an op-amp.
A non-inverting op-amp with a gain of 9 will increase the voltage so the signal is significant
enough to act as an input into the safety system. The analogue output will also need amplifying as most sensors do. Since the voltage output is approximately 1.2V at 25˚C the
op-amp configuration will be used on this output as well. This line is not currently used as the
Jet Ski is still in the testing phase and was installed for future monitoring and display.
Due to the fact the batteries will be very inaccessible and understanding that the sensors
could fail a backup circuit breaker has also been built into the system. This is a bimetal circuit
breaker that acts as a switch breaking the line when the temperature is above 60˚C. This is
also used as a backup if any sensors do fail and it is desired to continue testing while ensuring
the batteries operate at a safe temperature (Altronics 2014).
In each tube two temperature sensors will be mounted in the middle of the batteries. To
achieve this they will have to be attached when the pack is being constructed. The sensors
will be lying in the large area above the middle cell.
BMS Sensors The BMS chips use the same configuration as previously designed. There will be 1 chip per
enclosure and one healthy line that connects to the master chip. Figure 22 illustrates the
wiring connections from the battery pack to the chip. This operates using pin 0 as the ground
and pin 8 as the supply. For example, if there were 4 batteries that needed to be monitored the
lowest or 0V would be connected to pin 0 and the highest would be connected to pin 4 and 8
to supply power to the chip. This design will have two chips that monitor 8 cells and two that
monitor 7 to make up the 30 in series (Zeva 2014).
The difference to the previous design lies with the mounting of the BMS, the last design had
these externally mounted whereas this current design will see them mounted internally inside
the enclosures. This decision was made to protect the chip from potential short circuits

31 | P a g e
through wire failure of the lines running from the batteries to the chips. The previous design
used fuses to protect the chips from this however since the scope changed to incorporate the
occurrence of water the fuses would be inaccessible. The fuses used are also bulky and would
crowd the space inside the enclosure.
To mount the chip on the cylindrical pipe rubber spacers where used to allow the nut and bolt
to be tightened while keeping the chip flat. Figure 23 and Figure 18 illustrate how the chips
will be mounted allowing them to be fastened securely and still keep the chip lying flat.
Appendix A is a procedure to attach the cap to the enclosure including the wiring and testing
of the BMS.
Figure 22: Diagram of 8 cell BMS connections (Madappuli 2013)

32 | P a g e
Figure 23: Mounting method for the BMS chip
Pressure Release Valve Since the enclosures are now sealed and can be considered to be housing a heat generating
source it is assumed that the expansion due to heat could be of some concern. The batteries are switched off if the ambient temperature exceeds 68˚C but the temperature will still
potentially rise. Assuming the volume remains the same and the temperature rises to 120˚C
the pressure rise calculated is found to be 30%. Although this is a somewhat insignificant rise
in terms of potentially dangerous pressures a pressure release valve has been added onto the
cap to ensure the pressure can be released.
The valves have been donated by TMT and they have a minimum cracking pressure of 20psi
(Circle Seal Controls 2014). To calibrate these valves to their minimum value a test rig was
made using an air compressor to apply pressure until the valve cracked. They were all set to
crack at 5psi gauge or 20psi absolute. Appendix A refers to the correct procedure to ensure
the valve behaves as expected.

33 | P a g e
Conclusions and Future Work
The Battery enclosure that this paper addresses has been the driving factor in the continual
delays the project has experienced. There have been numerous designs completed but the key
factor continually overlooked is the simple factor in the ability to install the component
successfully and its ability to fit inside the box.
As engineers the relevance of this project should focus on the fact there has been so many
failures and iterations of what seems like a simple design. The solution came from a design
that pulled away from how the manufacturer envisioned the battery configuration. Changing
the design from a square to circular allowed the 125mm tubes volume to be used more
efficiently.
The pipes themselves have also been shortened to allow more room at the back of the Jet Ski
where the motor is mounted. The length has been taken from 1300mm to 1250mm. This
small change allows maintenance at the back of the Jet Skit to be carried out safely. In the
previous designs, the components would have to be reached for blindly, whereas now they
are visible.
The batteries inside have now increased in number however the temperature sensors are there
to ensure the temperature inside the pipe housing is not high enough to damage the batteries.
The monitoring equipment in the enclosures will ensure the safe operation of the Jet Ski for
future students. The measurement of temperature and voltage will also help study the subject
of cell balancing since this model of BMS does not. The Pressure release valve also makes
sure that the glands and caps are not under any strain and this is further supported from the
clamping brackets designed. The end bracket covers the cap to take the weight of the batteries
sliding back and forth. The calculated safety factor for the bracket is found to be 13 at
complete failure which means under conventional use the force exerted on the clamp due to
the batteries can be assumed negligible. The final design of the battery enclosures can be
found in Appendix E.
With a new design in place and tested fully it was time to test the fit. This design was still
difficult to fit all the tubes in and even more so to fasten the clamps and brackets into place.
When approaching a problem, like the one this thesis addresses, it is often easy to forget that

34 | P a g e
the component being designed is actually going to be installed. Forgetting this, leads to the
problems encountered with the battery box.
The design, manufacture and installation of the batteries and battery safety system are now
complete. This has allowed for the primary internal components of power source and motor
to be properly installed and for operational testing to begin. Initial phases of this have begun
but still require a lot more hours until the controller will be ready to power the motor.
The completions of mounting of the batteries and motor have opened up new avenues for
data collection and analysis. Temperature testing on the enclosures can be carried out to
determine how quickly the batteries will reach peak ambient operating temperature. The
voltage of the batteries in their individual levels can also be analysed to investigate if the cells
will become unbalanced.
Once the motor controller has been calibrated the water testing can begin. This will include
comparison with a petrol powered jet ski as well as performance testing such as acceleration
and top speed.

35 | P a g e
References
Advanced Mechanical Engineering Solutions 2014, Sectional Properties. Available from:
<http://www.amesweb.info/SectionalPropertiesTabs/SectionalPropertiesCbeam.aspx#.VEQ6j
vldVwt > [11 September 2014].
Altronics 2014, Products. Available from: < http://www.altronics.com.au/ > [30 July 2014].
ASAP Watercrafts 2014, ASAP Watercrafts. Available from:
<http://www.asapwatercrafts.com/> [10 May 2014].
Atlas Steels 2011, Grade Data Sheet 316 316L 316H. Available from:
<http://www.atlassteels.com.au/documents/Atlas_Grade_datasheet_316_rev_Jan_2011.pdf > [12
August 2014]
Australian Transport Council 2011, National Standard for Commercial Vessels: Part C
Design and Construction, Government of Australia. Available from: <
http://www.amsa.gov.au/forms-and-
publications/domestic/publications/documents/NRIP00077.pdf > [25 August 2014].
Beckley, A 2013, Drive Train for an Electric Jet Ski Conversion. Final Year Project,
University of Western Australia.
Circle Seal Controls 2014, 500 Series Relief Valves. Available from: < http://www.circle-
seal.com/products/relief_valves/500/index.html > [10 September 2014].
Corke, C 2014, Conversion of Petrol Powered Watercraft to Electric Featuring an
Investigation into the Battery Mounting System And Its Compatibility. Final Year Project,
University of Western Australia.
Deal Extreme, 2013. Available from: < http://www.dx.com/p/sl-266-iron-car-battery-bracket-
black-236905#.VEn2b_nF9wt > [20 August 2014].
Department of Infrastructure, Roads 2011, Vehicle Standards Bulletin 14: National Code of
Practice for Installation of Electric Drives in Motor Vehicles, Government of Australia.
Available from:
<http://www.infrastructure.gov.au/roads/vehicle_regulation/bulletin/pdf/NCOP14_Guidelines
_Electric_Drive_01Jan2011.pdf> [25 August 2014].

36 | P a g e
ECI 2010, Safety Lockwire Practices, ECI. Available from: <http://www.eci.aero/pdf/10-
3.pdf> [15 August 2014].
Exoconcept 2014, Exoconcept. Available from: < http://www.exo-concept.com/us/index.html
> [10 May 2014].
Fraden, J, 2010 Handbook of Modern Sensors: Physics, Designs, and Applications, Springer.
Headway Headquarters 2014, LiFePO4 38120s. Available from: < http://headway-
headquarters.com/headway-38120s-10ah-energy-cell/>. [13 May 2014].
Hildebrand, A 2014, Conversion of a Personal Watercraft from an Internal Combustion
Engine to an Electric Drive System. Final Year Project, University of Western Australia.
Jayamanna, R 2013, Design of the Battery Restraining System and the Motor Mounting
System for the REV Jet Ski. Final Year Project, University of Western Australia.
Keating, A 2008, „Temperature Sensors‟, p.24-30, MCTX3420 Mechatronics Design Coarse
Reader, Semester 2, 2012, University of Western Australia.
Kymera Electric Jet Board 2014, Kymera Electric Jet Board. Available from:
<https://www.kickstarter.com/projects/kymerajet/kymera-electric-jet-board>. [10 May 2014].
Madappuli, D 2013, Design and Implementation of a Battery Management System REV (Jet-
Ski). Final Year Project, University of Western Australia.
Meriam, J. L. and L. G. Kraige 2008, Engineering Mechanics, Wiley.
OneSteel 2014, OneSteel Aluminium National Catalogue.
Sea-Doo 2008, 2008 Shop Manual 4-Tec Series, Bombardier Recreational Products.
Texas Instruments 2011, 1.8V, Resistor-Programmable TEMPERATURE SWITCH and
ANALOG OUT TEMPERATURE SENSOR in SC70. Available from: <
http://www.ti.com.cn/cn/lit/ds/symlink/tmp300.pdf > [21 July 2014].
Texas Instruments 2013, LM135/LM235/LM335, LM135A/LM235A/LM335A Precision
Temperature Sensors. Available from: <http://www.ti.com.cn/cn/lit/ds/symlink/lm335.pdf>
[20 July 2014].

37 | P a g e
The REV Project 2014, REV Project. Available from <http://therevproject.com>. [1 May
2014].
Transeals 2012. O-ring Handbook. Available from:
<http://www.transeals.com.au/catalogues/files/Transeals_O-Ring_Handbook.pdf >.
[15/8/2014].
White, R 2013, REV Electric Jet Ski Safety Systems. Final Year Project, University of
Western Australia.
Sukhatme, S. P, 2005 A Textbook on Heat Transfer, Universities Press.
Zeva, 2014, 8-cell Battery Monitor Module, Zeva. Available from:
<http://zeva.com.au/Products/datasheets/BMM8%20v1-6%20Manual.pdf > [15 June 2014].

38 | P a g e
Appendices
Appendix A - Battery Cap Procedure (Battery cap Placement)
1. Inspect the PVC pipe for abrasions or rough edges where the lid will sit
a. These could potentially act as failure points ruining the seal made with the O-
ring
2. Inspect the O-ring for cuts or splitting
3. Inspect pressure release valve to ensure the surface is clean (i.e. no dirt)
a. Clean out if anything is found
4. Check the nuts on the gland, 8-pin connector and the pressure release valve to ensure
a tight seal.
5. Feed power cable through the main gland
6. Connect BMS wires to the BMM
7. Match the numbers on the wire to the number on the chip (i.e. 0-0, 1-1)
8. Check the Status light on the BMM and count the flashes
a. Number of flashes indicates number of voltage levels or cells monitored
b. Indicates the status of the connection
c. If it doesn‟t show a blue light recheck connection
9. Connect output wires from the 8 pin connector to the BMM
10. Connect a piece of string onto the 8 pin connector and guide it through the hole
11. Place the O-ring and nut for the 8 pin connector and ensure it is tight
12. Place the cap onto the pipe evenly so the o ring is not pinched
13. Used a rubber mallet to make sure the cap is down as far as it can go

39 | P a g e
Appendix B - Battery Test A battery test was carried out to determine the run time of the batteries and the temperature
generation when discharging. The run time of the batteries was of interest to determine how
long the peak discharge could be held and to find how long the continuous discharge rate
could operate. It was found that the peak discharge could not be held for long during a test
where no data was recorded. This test then connected another 150 watt light, but could only
run for a few seconds. The temperature test was needed to give evidence that the new battery
box (PVC) would not need a cooling loop to ensure the box remained intact.
The battery test was carried out using 4 Headway 38120 batteries wired in series (Headway
Headquarters 2014). This gives a 12 volt battery cell with 120 watt hours of power
(10Ah*12V). The cell was connected to an 800 watt inverter which output 230 volts
powering one 500 watt light. The light was then switched on until the charge in the batteries
could not supply the power needed to run the system. An alarm was present on the inverter
indicating when the power was falling below or above the operating limits.
Two tests where carried out; the first was to ensure everything was working and accurate
readings were being taken and the second was for the actual run with a fully charged battery.
It should also be noted that the operating limits set on the inverter have a higher shut off
voltage per cell than the motor. This inverter would shut off when the voltage hit 2.75 volts,
however the specifications of the motor states that it can operate until the voltage per cell
drops to 2.5 volts (Beckley 2013). Since this is the case the batteries will be able to offer a
longer operation time than is presented in this test at the same power levels.
40 | P a g e
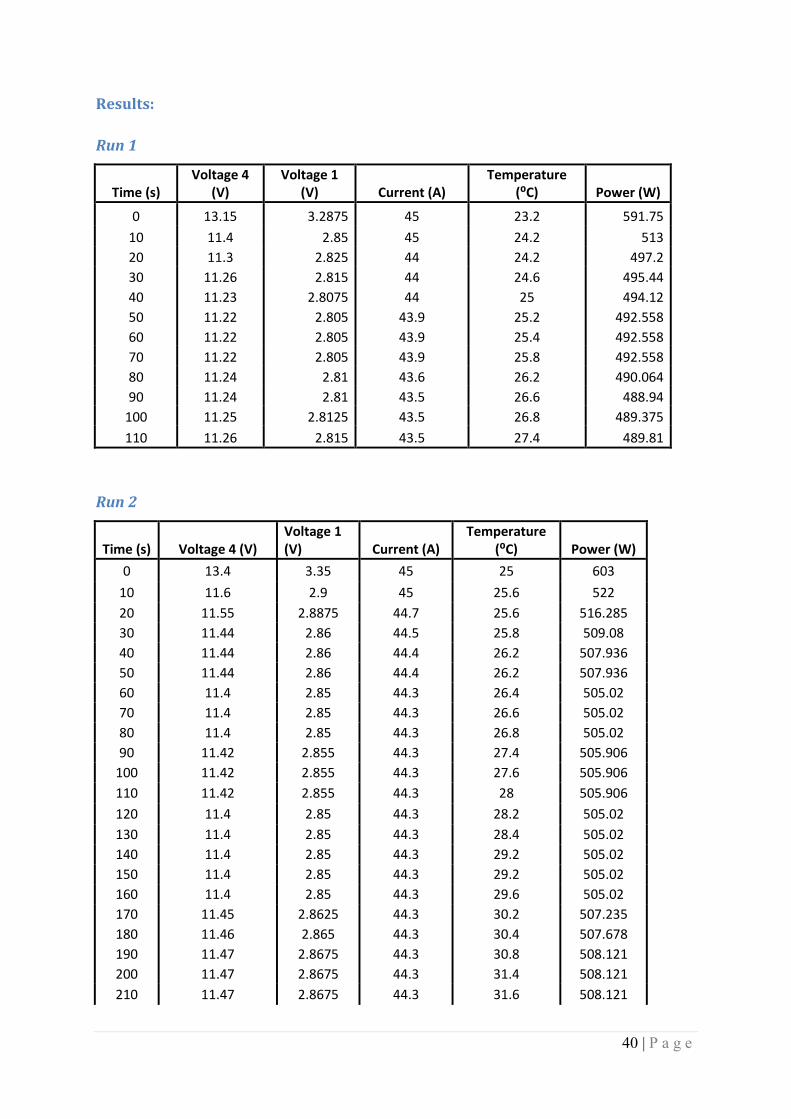
Results:
Run 1
Time (s) Voltage 4
(V) Voltage 1
(V) Current (A) Temperature
(⁰C) Power (W)
0 13.15 3.2875 45 23.2 591.75 10 11.4 2.85 45 24.2 513 20 11.3 2.825 44 24.2 497.2 30 11.26 2.815 44 24.6 495.44 40 11.23 2.8075 44 25 494.12 50 11.22 2.805 43.9 25.2 492.558 60 11.22 2.805 43.9 25.4 492.558 70 11.22 2.805 43.9 25.8 492.558 80 11.24 2.81 43.6 26.2 490.064 90 11.24 2.81 43.5 26.6 488.94
100 11.25 2.8125 43.5 26.8 489.375 110 11.26 2.815 43.5 27.4 489.81
Run 2
Time (s) Voltage 4 (V) Voltage 1 (V) Current (A)
Temperature (⁰C) Power (W)
0 13.4 3.35 45 25 603 10 11.6 2.9 45 25.6 522 20 11.55 2.8875 44.7 25.6 516.285 30 11.44 2.86 44.5 25.8 509.08 40 11.44 2.86 44.4 26.2 507.936 50 11.44 2.86 44.4 26.2 507.936 60 11.4 2.85 44.3 26.4 505.02 70 11.4 2.85 44.3 26.6 505.02 80 11.4 2.85 44.3 26.8 505.02 90 11.42 2.855 44.3 27.4 505.906
100 11.42 2.855 44.3 27.6 505.906 110 11.42 2.855 44.3 28 505.906 120 11.4 2.85 44.3 28.2 505.02 130 11.4 2.85 44.3 28.4 505.02 140 11.4 2.85 44.3 29.2 505.02 150 11.4 2.85 44.3 29.2 505.02 160 11.4 2.85 44.3 29.6 505.02 170 11.45 2.8625 44.3 30.2 507.235 180 11.46 2.865 44.3 30.4 507.678 190 11.47 2.8675 44.3 30.8 508.121 200 11.47 2.8675 44.3 31.4 508.121 210 11.47 2.8675 44.3 31.6 508.121

41 | P a g e
220 11.47 2.8675 44.3 31.8 508.121 230 11.47 2.8675 44.3 32.2 508.121 240 11.47 2.8675 44.3 32.4 508.121 250 11.47 2.8675 44.3 32.8 508.121 260 11.45 2.8625 44.3 33.2 507.235 270 11.45 2.8625 44.1 33.6 504.945 280 11.45 2.8625 44.1 33.6 504.945 290 11.45 2.8625 44.1 34.2 504.945 300 11.45 2.8625 44.1 34.6 504.945 310 11.45 2.8625 44.1 35.6 504.945 320 11.24 2.81 44 35.6 494.56 330 11.29 2.8225 44 35.8 496.76 340 11.27 2.8175 44 36.2 495.88 350 11.25 2.8125 43.7 36.8 491.625 360 11.2 2.8 43.7 37.6 489.44 370 11.11 2.7775 43.7 38.2 485.507 380 11.11 2.7775 43.7 38.4 485.507 390 11.09 2.7725 43.7 39 484.633 400 11.02 2.755 43.02 39.2 474.0804 410 11 2.75 43 40.2 473

42 | P a g e
Appendix C - Battery Installation Procedure
Each voltage level will consist of 8 battery cells connected in parallel. To create a connection
between the 8 cells a series of bus bars will be used as shown in the figure below. The grub
screws will be used to connect the 8 parallel cells in series with the next voltage level.
Step 1
Screw the grub screws into the 8 battery cells
Step 2
Place all level 1 bus bars onto the configuration depicted in Figure C-1.
Step 3
Place all level 2 bus bars onto the configuration depicted in Figure C-1.
Step 4
Place the level 3 bus bar onto the configuration depicted in Figure C-1.
Step 5
To ensure the batteries remain the same height, all grubscrews that hold two bus bars must be
raised as there are two that hold 3. To achieve this place a washer onto all but one of the
grubscrews with two busbars leaving one of them to hold the BMS cable instead.
Place this crimp instead of a washer
(Note: The BMS crimp should be placed on a different cell each level. i.e. if a BMS wire was
place on the middle cell the next level would see the BMS wire on an outside cell.)
Step 6
For vibration resistance also place a split washer on each grub screw.
Step 7
Screw the next level of batteries onto the grub screws until the tube has been filled.

43 | P a g e
For the ends of the batteries two layers of bus bars must be placed and will use bolts in place
of the grub screws. Follow steps 1-7 twice using screws instead of bus bars and make sure the
lug is placed on one of the bolts that hold 3 bus bars. Once this is completed the pack will
need to be wire locked.
Wire locking requires training and should not be done without an understanding of how it is
done or correct supervision.
Figure C-1: Diagram of bus bar levels.
1 1
2
1
1
2
2
2
3
44 | P a g e
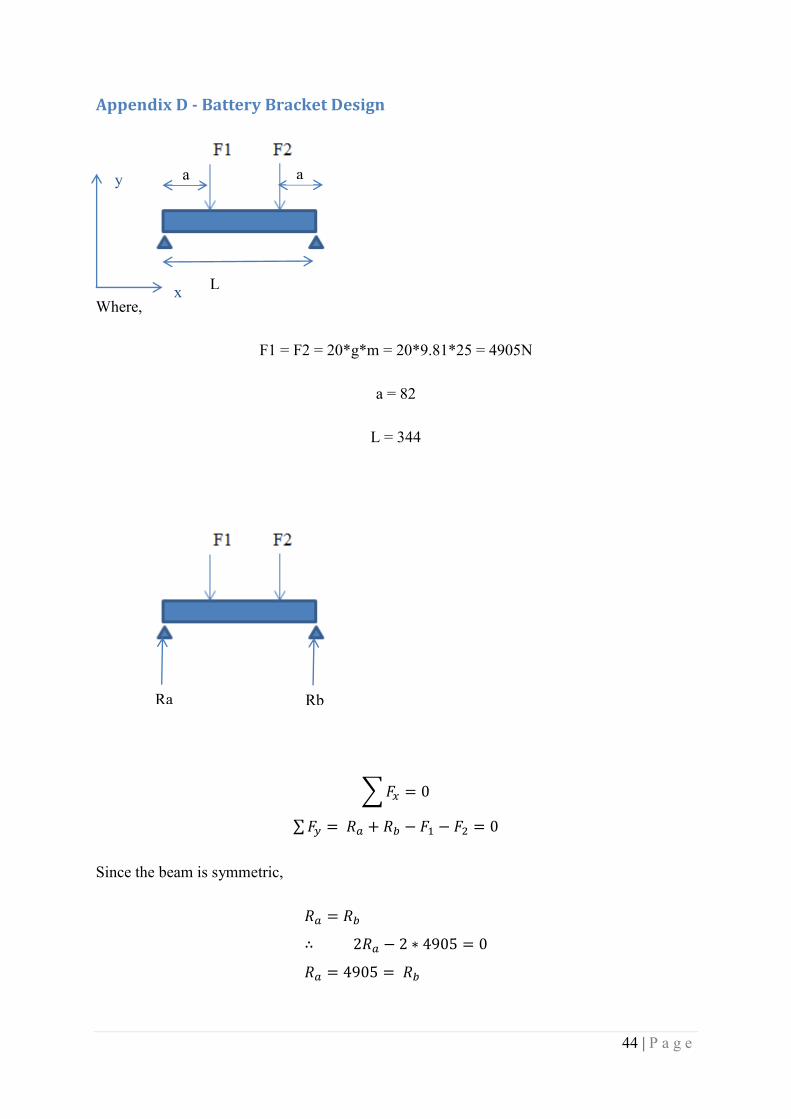
Appendix D - Battery Bracket Design
Where,
F1 = F2 = 20*g*m = 20*9.81*25 = 4905N
a = 82
L = 344
∑
∑
Since the beam is symmetric,
a a
L
Ra Rb
x
y
45 | P a g e
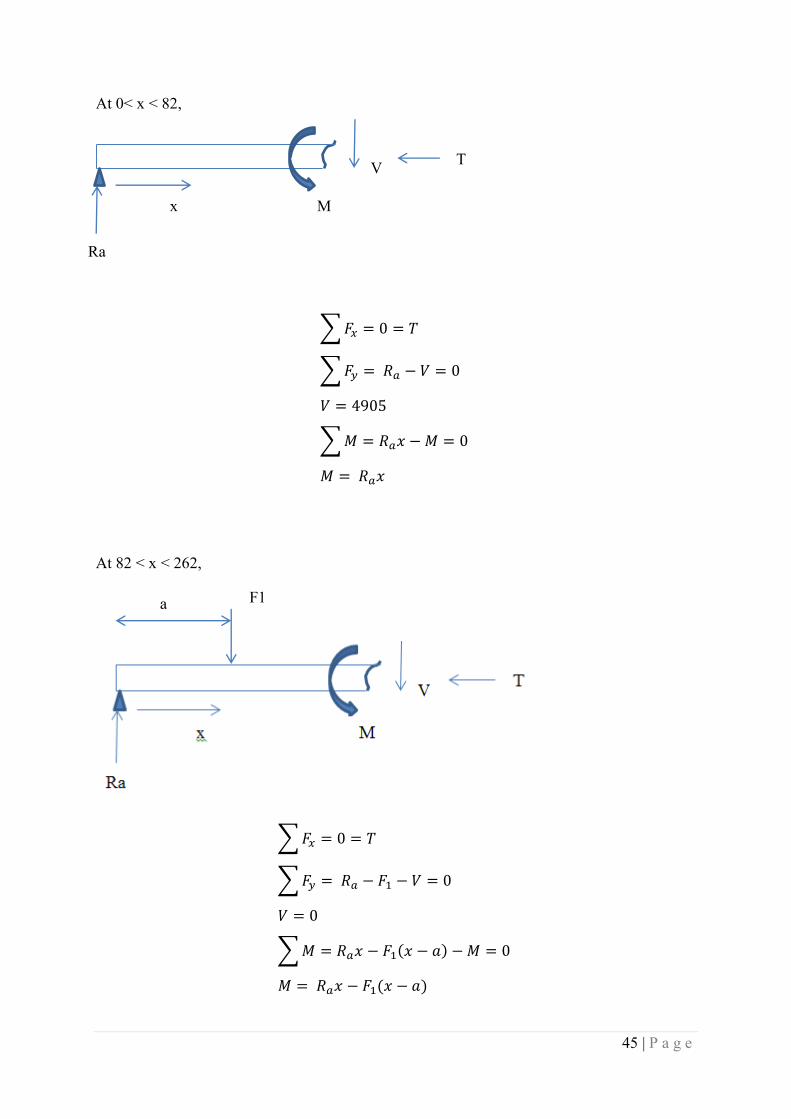
At 0< x < 82,
∑
∑
∑
At 82 < x < 262,
∑
∑
∑ ( )
( )
x
Ra
M
V T
F1 a

46 | P a g e
At 262 < x < L,
∑
∑
∑ ( ) ( )
( ) ( ) (Meriam and Kraige 2008)
Figure D-1: Gradient profile of the bending moments M
-6000
-4000
-2000
0
2000
4000
6000
0 100 200 300 400V (
N)
x (mm)
Gradients of Bending Moments
v
F1 a b F2
47 | P a g e
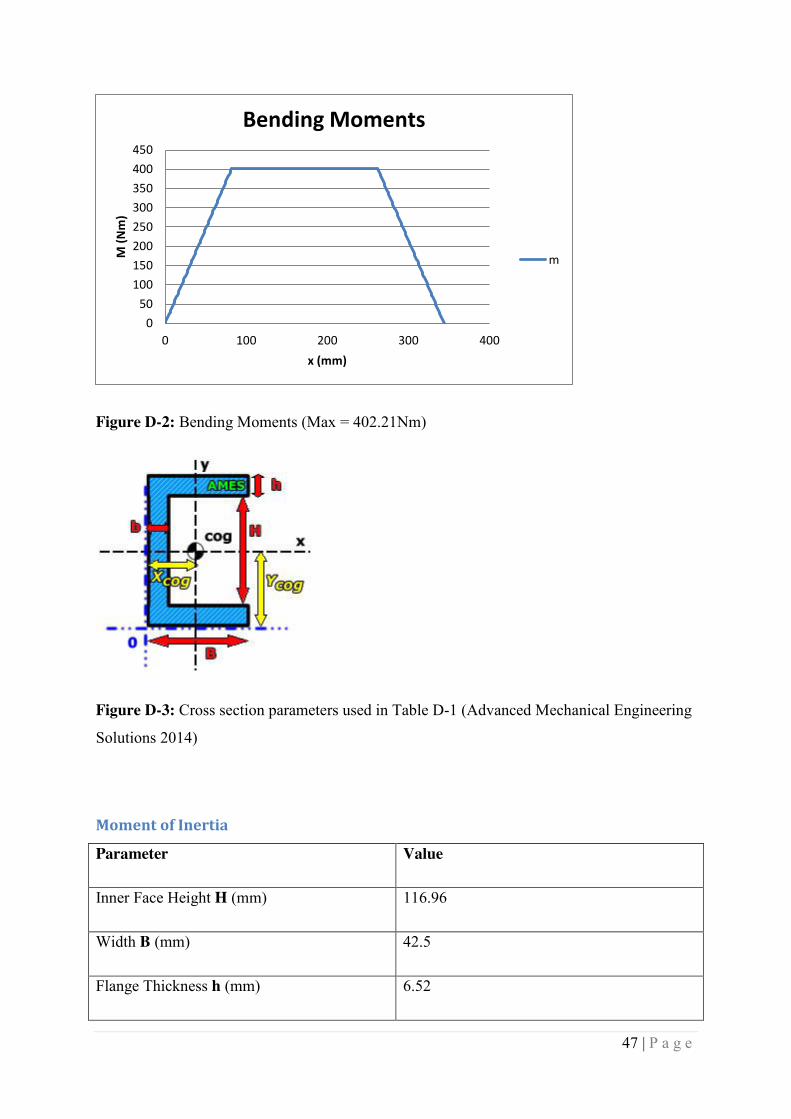
Figure D-2: Bending Moments (Max = 402.21Nm)
Figure D-3: Cross section parameters used in Table D-1 (Advanced Mechanical Engineering
Solutions 2014)
Moment of Inertia
Parameter Value
Inner Face Height H (mm) 116.96
Width B (mm) 42.5
Flange Thickness h (mm) 6.52
050
100150200250300350400450
0 100 200 300 400
M (
Nm
)
x (mm)
Bending Moments
m

48 | P a g e
Web Thickness b (mm) 5
Table D-1: Parameters of C-channel used
Parameter Equation
Cross Section Area A
Centre of Gravity xcog
Area Moment of Inertia Iyy (
) (
)
Table D-2: Equations used to calculate Moment of Inertia (Meriam and Kraige 2008)
Parameter Value
Cross Section Area A (mm2) 1139
Centre of Gravity xcog (mm) 11.623
Area Moment of Inertia Iyy (mm4) 184672
Table D-3: Figures for area moment of inertia
Where,

49 | P a g e
Yield Strength Aluminium: 76 MPa (OneSteel 2014)
M: Maximum bending moment
y: Distance to the furthest fibre
50 | P a g e
Appendix E - Overall Design Schematics
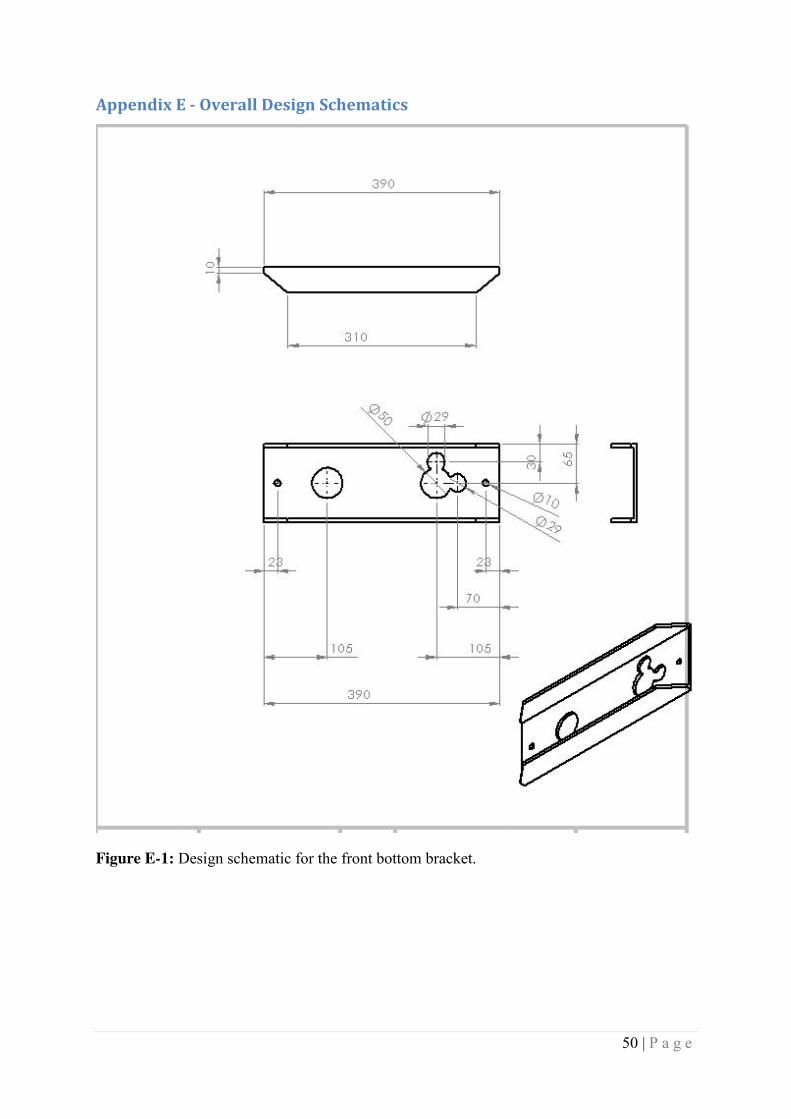
Figure E-1: Design schematic for the front bottom bracket.
51 | P a g e
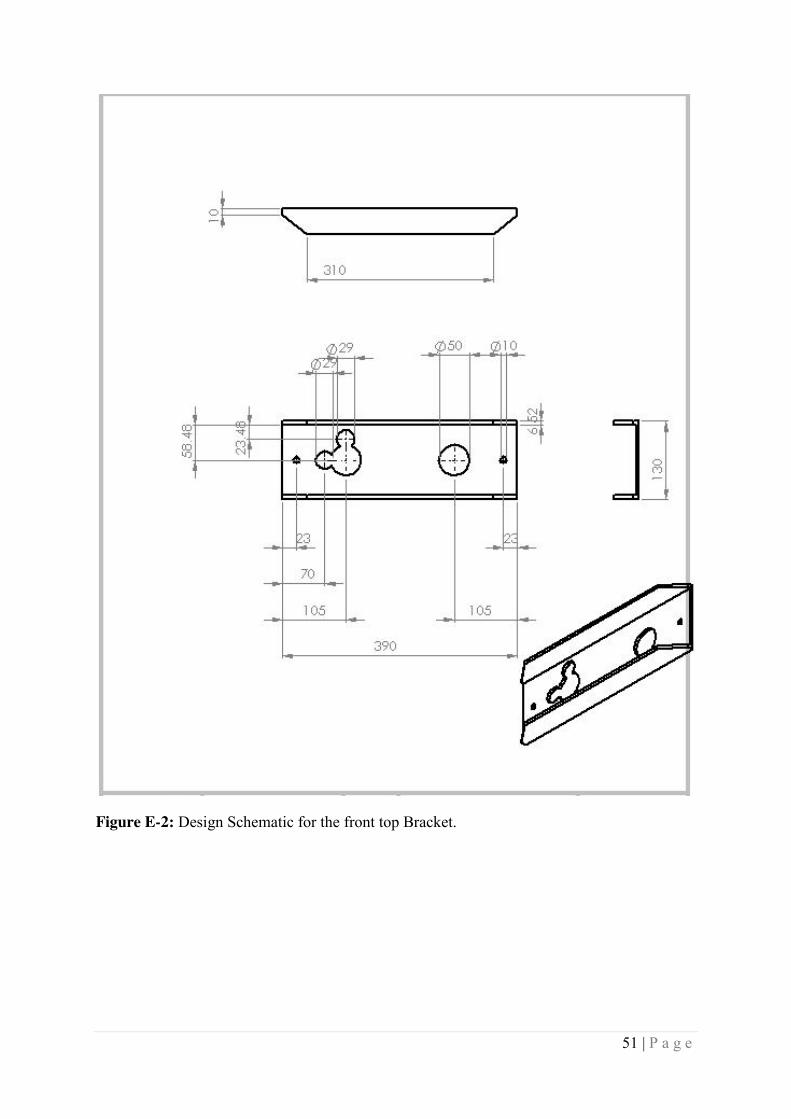
Figure E-2: Design Schematic for the front top Bracket.

52 | P a g e
Figure E-3: Complete configuration from the back of the Jet Ski.
Figure E-4: Complete configuration from the front of the Jet Ski.
53 | P a g e
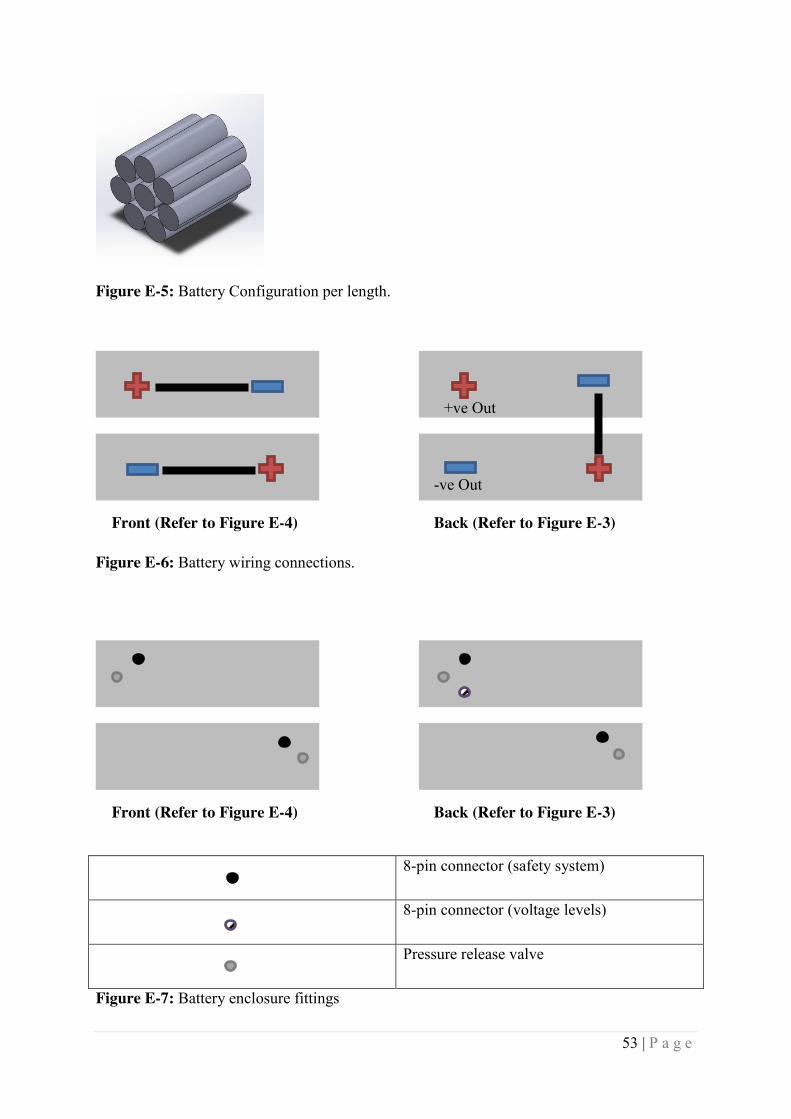
Figure E-5: Battery Configuration per length.
Figure E-6: Battery wiring connections.
8-pin connector (safety system)
8-pin connector (voltage levels)
Pressure release valve
Figure E-7: Battery enclosure fittings
Front (Refer to Figure E-4) Back (Refer to Figure E-3)
-ve Out
+ve Out
Front (Refer to Figure E-4) Back (Refer to Figure E-3)

54 | P a g e
Appendix F - Waterproof test This test was carried out to determine if the fittings and cap design used was going to be
suitable for the purpose of safely housing the batteries inside the Jet Ski. To carry out this test
a length of pipe was made up with the fittings that would be used placed onto the caps. All
the fittings have a rating of IP67 or above sourced from Altronics (see Appendix H).
The cap at the Negative end is glued on with one large cable gland so the only component
that will need testing is the gland. At the positive end there is the 8-pin connector, the large
cable gland and the pressure release valve. The pressure release valve and the 8-pin connector
are already sealed and do not require any connections for testing. The large gland would
usually be holding the cable and so a stopper around the same size was used for the test.
The test would consist of testing the tube at 3 depths; surface, 1 meter and 2 meters. Each
depth would be left for an hour submerged at each depth and was run 3 times. To check if any
water had broken the seal the enclosure was left until completely dry before opening as even
the slightest drop was not acceptable. If water managed to fall in the enclosure when opening
the test would have to be redone to verify where the water came from.
The results from this test found that the enclosures could remain submerged at 2 meters for 1
hour with no ingress of water.
Figure F-1: Diagram showing the test intervals used.

55 | P a g e
Appendix G – Jet Ski
Electric
As the awareness for pollution and carbon footprint, left as a result from the combustion of
fuels rise, the desire for alternatives also increases. The adaptation from petrol to electric is
being seen in the automotive industry already and there is now prototypes and electric option
available for watercraft.
The Jet Ski being a recreational vehicle still has very little focus when it comes to making the
change from petrol to electricity. There has been a push recently in the supply of electric
PWC‟s although not jet skis, as these are one man water craft, powered by electric drive
systems.
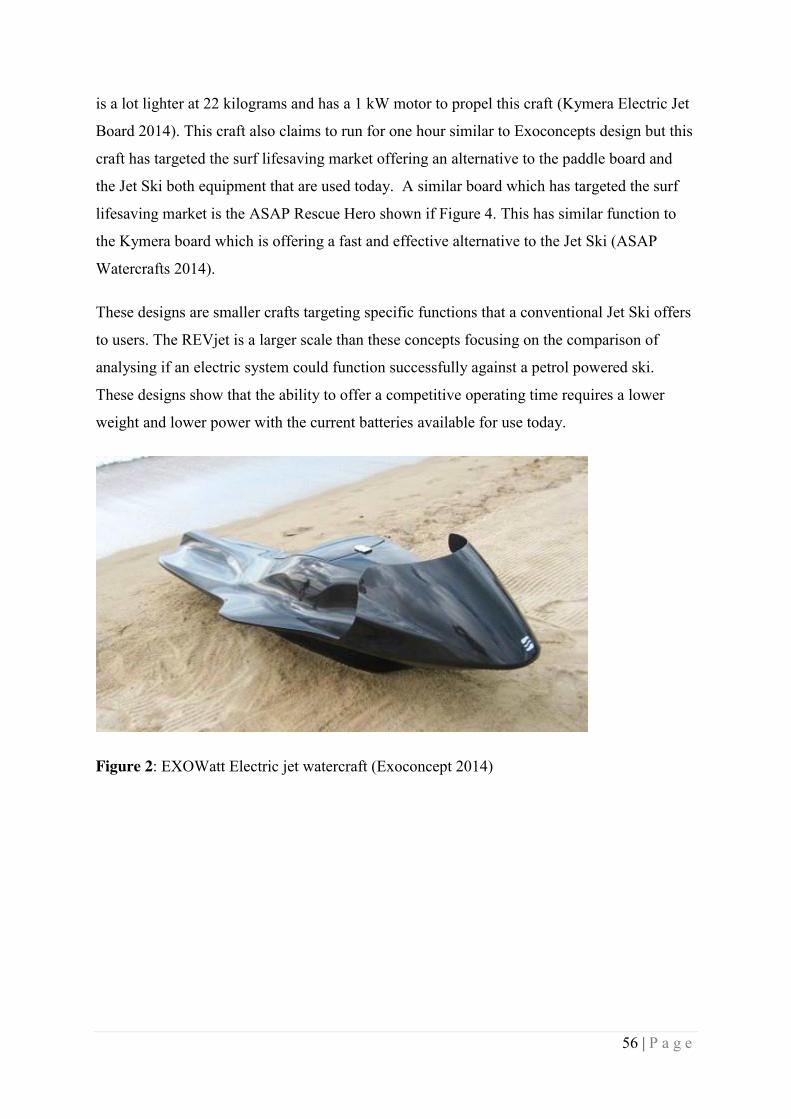
A French company Exoconcept have developed a PWC that embraces the idea behind a jet
ski. Figure 2 shows how the EXOWatt mirrors the image of a jet ski but has the rider laying
down instead of sitting up. Designing the PWC with this seating orientation allows the user to
feel like they are travelling at high speeds without using a high powered system allowing an
operating time competitive with a petrol powered craft. The craft is available on the market
but the look is the only thing that can be compared to a jet ski. Exoconcept have chosen to
develop this craft with a 3kW or 7kW electric motor and claims to run for an hour achieving
speeds of 15 knots (cruising) and top speeds of 30 Knots. This product is advertised as an
alternative to the Jet Ski but has not been too successful due to the price tag that comes with
the water craft (Exoconcept 2014). Like all electric powered vehicles there are trade-offs
from the functionality of petrol powered vehicles. The running time of the EXOWatt is
considerably less and has a lower top speed but there are positives taken away as well. The
craft is quiet and has zero emissions as well as lower vibrations. This craft has managed to
devise a design where the batteries can be quickly interchanged which is a positive since the
running life is so low (Exoconcept 2014).
Small electric watercrafts have made a large push since the REVjet project started with the
development of the EXOWatt and two other concepts which function more as a body board
or powered raft. These concepts follow the EXOWatt with a low powered light weight craft
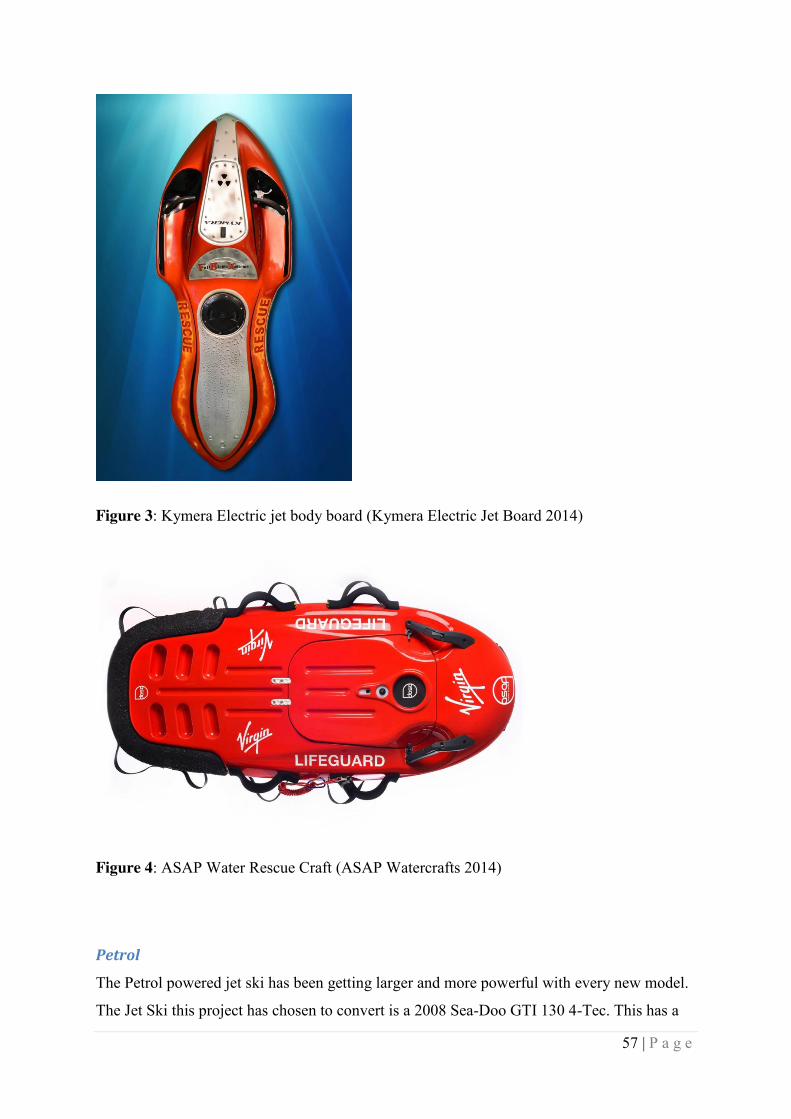
where the user is lying flat and have relatively low speeds. The Kymera Body Board is not
registered as a PWC but as a self-propelled PFD. This board shown in Figure 3 is similar to
the design of the EXOWatt and both are controlled via leaning from either side. The Kymera
56 | P a g e
is a lot lighter at 22 kilograms and has a 1 kW motor to propel this craft (Kymera Electric Jet
Board 2014). This craft also claims to run for one hour similar to Exoconcepts design but this
craft has targeted the surf lifesaving market offering an alternative to the paddle board and
the Jet Ski both equipment that are used today. A similar board which has targeted the surf
lifesaving market is the ASAP Rescue Hero shown if Figure 4. This has similar function to
the Kymera board which is offering a fast and effective alternative to the Jet Ski (ASAP
Watercrafts 2014).
These designs are smaller crafts targeting specific functions that a conventional Jet Ski offers
to users. The REVjet is a larger scale than these concepts focusing on the comparison of
analysing if an electric system could function successfully against a petrol powered ski.
These designs show that the ability to offer a competitive operating time requires a lower
weight and lower power with the current batteries available for use today.
Figure 2: EXOWatt Electric jet watercraft (Exoconcept 2014)
57 | P a g e
Figure 3: Kymera Electric jet body board (Kymera Electric Jet Board 2014)
Figure 4: ASAP Water Rescue Craft (ASAP Watercrafts 2014)
Petrol
The Petrol powered jet ski has been getting larger and more powerful with every new model.
The Jet Ski this project has chosen to convert is a 2008 Sea-Doo GTI 130 4-Tec. This has a

58 | P a g e
97 kW engine driving the impeller with a 60 litre tank (Sea-Doo 2008). This is the Jet Ski
that will be used to compare the results of the REVjet.
The instruments on this machine are digital and it is desired to have these wired up for the
REVjet as well. In the petrol system the data was processed via the ECU and then sent to the
instrument display. In the 2008 model each gauge cluster (instrument display) would have to
be paired with the machines ECU using the software Sea-Doo supplies known as the B.U.D.S
software (Sea-Doo 2008). The ski would not function without this being done. Since an
electrical motor does not need an ECU a microcontroller will need to be installed and
programmed as a replacement. This will require knowledge into the technology known as
CAN Bus (Controller Area Network). The speed sensor will be the same as before however
the RPM gauge will now be read from a digital encoder (Beckley 2013).
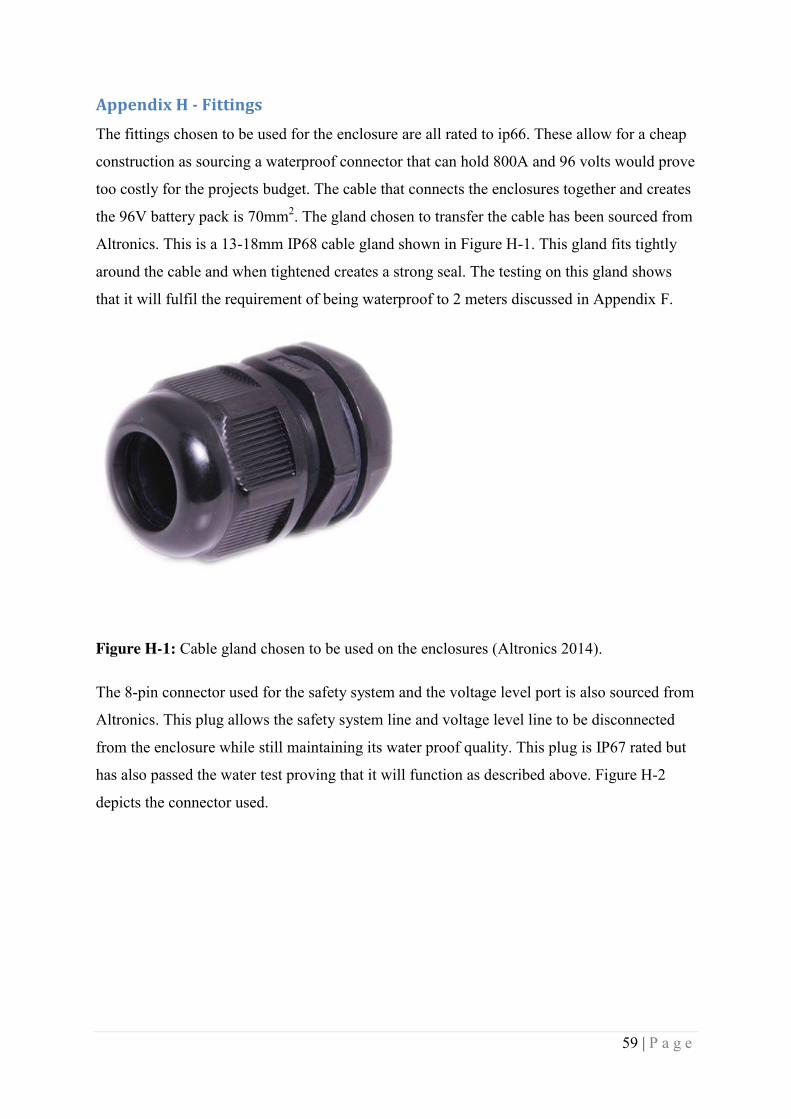
59 | P a g e
Appendix H - Fittings The fittings chosen to be used for the enclosure are all rated to ip66. These allow for a cheap
construction as sourcing a waterproof connector that can hold 800A and 96 volts would prove
too costly for the projects budget. The cable that connects the enclosures together and creates
the 96V battery pack is 70mm2. The gland chosen to transfer the cable has been sourced from
Altronics. This is a 13-18mm IP68 cable gland shown in Figure H-1. This gland fits tightly
around the cable and when tightened creates a strong seal. The testing on this gland shows
that it will fulfil the requirement of being waterproof to 2 meters discussed in Appendix F.
Figure H-1: Cable gland chosen to be used on the enclosures (Altronics 2014).
The 8-pin connector used for the safety system and the voltage level port is also sourced from
Altronics. This plug allows the safety system line and voltage level line to be disconnected
from the enclosure while still maintaining its water proof quality. This plug is IP67 rated but
has also passed the water test proving that it will function as described above. Figure H-2
depicts the connector used.

60 | P a g e
Figure H-2: 8-pin connector used on the enclosures (Altronics 2014).