Embed Size (px)
Citation preview

Contents lists available at ScienceDirect
Cryogenics
journal homepage: www.elsevier.com/locate/cryogenics
Research paper
Design optimization of single mixed refrigerant LNG process using a hybridmodified coordinate descent algorithm
Muhammad Abdul Qyyum, Nguyen Van Duc Long, Le Quang Minh, Moonyong Lee⁎
School of Chemical Engineering, Yeungnam University, Gyeongsan 712-749, Republic of Korea
A R T I C L E I N F O
Keywords:LNGNatural gas liquefactionSingle-mixed refrigerantHybrid modified coordinate descentoptimizationDesign optimizationExergy loss analysis
A B S T R A C T
Design optimization of the single mixed refrigerant (SMR) natural gas liquefaction (LNG) process involves highlynon-linear interactions between decision variables, constraints, and the objective function. These non-linearinteractions lead to an irreversibility, which deteriorates the energy efficiency of the LNG process. In this study, asimple and highly efficient hybrid modified coordinate descent (HMCD) algorithm was proposed to cope withthe optimization of the natural gas liquefaction process. The single mixed refrigerant process was modeled inAspen Hysys® and then connected to a Microsoft Visual Studio environment. The proposed optimization algo-rithm provided an improved result compared to the other existing methodologies to find the optimal condition ofthe complex mixed refrigerant natural gas liquefaction process. By applying the proposed optimization algo-rithm, the SMR process can be designed with the 0.2555 kW specific compression power which is equivalent to44.3% energy saving as compared to the base case. Furthermore, in terms of coefficient of performance (COP), itcan be enhanced up to 34.7% as compared to the base case. The proposed optimization algorithm provides adeep understanding of the optimization of the liquefaction process in both technical and numerical perspectives.In addition, the HMCD algorithm can be employed to any mixed refrigerant based liquefaction process in thenatural gas industry.
1. Introduction
Liquefied natural gas (LNG) has emerged as a green and more cost-effective energy source in comparison with other energy sources such asfuel oil, diesel, and liquefied petroleum gas (LPG). Natural gas (NG) isconverted into LNG at a cryogenic temperature of −160 °C and atmo-spheric pressure by shrinking its volume by a factor of approximately600. Due to this, the transportation of NG in the form of LNG is mostpreferable and economical over long distances for several reasons suchas economical, technical, political, and safety related issues [1,2].Therefore, in 2016, global LNG trade has reached a record value of258million tonnes (MT) which is 5% higher than 2015 LNG trade value[3]. Although, still high typical cost involved in LNG production is themajor issue associated with the growth rate of LNG trading. If this highcost reduced to somehow, it can be expected that the growth rate ofglobal LNG trade will be increased dramatically.
However, LNG production is considered as an energy and cost-in-tensive process owing to the tremendous amount of energy consump-tion; approximately 1188 kJ of energy [4] is required to liquefy 1 kg ofnatural gas. The liquefaction utilizes approximately 30–35% of the re-quired total energy for the LNG production. However, the energy
consumption for the natural gas liquefaction strongly depends on theenvironmental conditions (ambient temperature [5], relative humidity[6] etc.) and the involved liquefaction technology such as SMR, DMR,and C3MR etc.
There are several LNG processes available for the base-load pro-duction of LNG, consisting of such as propane precooled mixed re-frigerant (C3MR), cascade, dual mixed refrigerant (DMR), and singlemixed refrigerant (SMR) cycles for natural gas (NG) liquefaction. TheseLNG processes can be differentiate on the basis of degree of complexity,liquefaction capacity, safety concerns and performance [7]. Amongthese processes, an SMR-based LNG plant has been reported to be sui-table for small-scale [8] and offshore applications, owing to its simpledesign, compactness, ease of operation, and small footprint. In addition,the SMR-LNG is known as the stranded natural gas plant [9].
Nevertheless, still a tremendous amount of energy is used for theLNG production through the SMR process. This energy consumption ismostly contributed by the shaft work to increase the pressure of re-frigerant in the refrigeration loop. It has been investigated that therequired shaft work (compression power) depends on the temperaturedifferences in the main LNG cryogenic heat exchangers [10]. Thetemperature gradient in the LNG cryogenic temperature can be reduced
https://doi.org/10.1016/j.cryogenics.2017.12.005Received 20 September 2017; Received in revised form 9 November 2017; Accepted 13 December 2017
⁎ Corresponding author.E-mail address: [email protected] (M. Lee).
Cryogenics 89 (2018) 131–140
Available online 18 December 20170011-2275/ © 2017 Elsevier Ltd. All rights reserved.
T

by adjusting the optimal values of design variables, which ultimatelyenhance the performance of the LNG production processes. An en-hancement in the liquefaction processes gives high economic benefits interms of low energy consumption. The energy efficiency of the LNGplant can be improved by modifying liquefaction cycle units like ex-pansion devices, compressors, and heat exchangers [11]. Fahmy et al.,[12] have enhanced the energy efficiency of the open cycle Phillipsoptimized Cascade natural gas liquefaction process. They improved thestructure of the LNG process by replacing the Joule-Thompson valvewith expanders. On the other hand, Vatani et al., [13] analyzed fiveLNG processes using advanced exergy analysis. They reported thatstructural optimization alone cannot be useful enough to increase theoverall performance of LNG processes.
Among the several ways to enhance the performance of the SMRprocess, design optimization is an essential and important task.However, the design optimization of SMR process is one of the chal-lenging issue due to the involvement of complicated and nonlinearthermodynamic relations among the design variables and constrainedobjective function. Several methods in previous studies [14–17] havebeen used to optimize the SMR process. As commercial simulators(Aspen Hysys®, Aspen Plus®, and Pro-II® etc.) have been matured forrigorous simulation, therefore simulation-optimization environmenthas been also used for the design optimization of the SMR process bydeveloping a link between an external optimization technique (e.g.,MATLAB) and commercial simulators. Venkatarathnam [18] optimizedvarious LNG processes using the sequential quadratic programming(SQP) optimizer in Aspen Plus®. Lee et al., [19] used a graphical tar-geting approach, which was the combination of thermodynamics andnon-linear programming, to search the optimal solution of the SMRprocess. Aspelund et al., [20] improved the energy efficiency of theSMR process by using a gradient-free approach. Mokarizadeh et al.,[21] optimized the SMR process using genetic algorithm (GA) by fa-cilitating the shaft work as an objective function in MATLAB. Khanet al., [15] connected MATLAB with a Unisim simulator through anActiveX/COM server and then increased the energy performance of theSMR by using nonlinear programming. Remeljej and Hoadley [22]analyzed four different small-scale LNG processes using exergy analysis.They reported that the SMR process has the highest energy efficiencyamong all studied processes. Khan and Lee [14] minimized the energyrequirement of the SMR process by applying a particle swarm paradigmwith non-linear constraints in the MATLAB environment connectedwith Honeywell Unisim Design™.
Moreover, the energy efficiency of the SMR process was improvedusing a sequential quadratic programming [23,24] and generic algo-rithms [21,25]. The sequential coordinate randomization algorithm isused to minimize the energy consumption of the SMR process. Thisoptimization approach works on a basis when the multivariable func-tion can be reduced by considering one variable at a time [26]. Parket al., [5] used the particle swarm optimization (PSO) to optimize theSMR process and proposed an investigation about the performance of
the SMR process under varying ambient air temperature. Most recently,Qyyum et al. [6] investigated the thermodynamic effects of environ-mental relative humidity on the overall performance of the SMR pro-cess. They used modified coordinate descent (MCD) methodology tooptimize the SMR process. Pham et al. [27] enhanced the efficiency ofthe SMR process using the knowledge-based optimization (KBO) tech-nique. Although the KBO algorithm is simple and effective, it ignoresthe importance and benefits of the numerical optimization algorithms.
The present study proposes an optimization algorithm, which can beused to optimize the process in both perspectives, by using processknowledge and mathematical programming. Meanwhile, the effective-ness of the proposed algorithm is presented in the simulation-optimi-zation structural problems, considering an SMR process as a case study.Accordingly, a hybrid modified coordinate descent (HMCD) methodwas proposed for the optimization of the SMR process in terms of therequired energy. The SMR process was modeled rigorously in AspenHysys® and then linked to Microsoft Visio Studio (MVS) by using COMfunctionality. The SMR process optimized by the HMCD method wascompared with those by other existing methods such as GA and PSO.
2. Hybrid modified coordinate descent algorithm
The stochastic search approaches such as GA and PSO have pre-sented promising potentials in LNG processes as mentioned in the in-troductory part. However, these algorithms often reveal limitations inthe design optimization of a highly non-linear and complex system suchas the SMR process owing to the termination in the infeasible region(negative MITA value) before achieving an optimal and/or meaningfulsolution. To avoid these infeasibilities, Khan et al., [7] introduced KBO.They successfully optimized the natural gas liquefaction process byanalyzing the composite curves of TDCC. The KBO approach is simpleand reliable, and works based on process knowledge when all numer-ical optimization algorithms cannot solve issues such as the processlimitations and technicalities. For instance, the concerns are the pre-sence of liquid at the inlet of the compressor or the presence of vapor atthe inlet of the pump. Without including any process knowledge, nu-merical optimization algorithms often produce a less robust result[7,27]. The efficiency and robustness of the numerical optimizationalgorithms depend on the interactions between the key decision vari-ables, constraints, and the objective function in the process associatedwith the search area and the initial values. Meanwhile, the efficiency ofthe KBO algorithm totally depends on the deep understanding of theprocess and the influential parameters (decision variables). In this al-gorithm, initially flow rates of mixed refrigerant (MR) for an efficientand robust LNG process optimization are chosen using the thermo-dynamics knowledge the temperature distribution (with respect to in-dividual boiling points) of MR components along the main cryogenicexchanger. However, the KBO approach may have a major issue toovercome a local optimum point.
The MCD algorithm facilitates the multivariable function by
Nomenclature
N2 nitrogenC1 methaneC2 ethaneC3 propaneiC5 iso-pentaneMITA minimum internal temperature approachC3MR propane precooled mixed refrigerantDMR dual mixed refrigerantMVS Microsoft Visio StudioKBO knowledge based optimizationGA genetic algorithm
PSO particle swarm optimizationMCD modified coordinate descentHMCD hybrid modified coordinate descentLNG liquefied natural gasMR mixed refrigerantNG natural gasSMR single mixed refrigerantTDCC temperature difference between composite curvesTHCC temperature-heat flow composite curvesLMTD log mean temperature differenceCOP coefficient of performanceFOM figure of merit
M.A. Qyyum et al. Cryogenics 89 (2018) 131–140
132

minimizing the objective function along one coordinate [28]. The sig-nificant advantages of MCD over the conventional coordinate descent(CD) algorithm are the simplicity of each iteration, easy implementa-tion, and high efficiency [29]. Accordingly, this algorithm is one of thebest candidates to solve the nonlinear interaction optimization
problems through programming with a short time interval in compar-ison with any KBO technique. As mentioned in the Introduction, theproposed HMCD was motivated to provide reliable and robust optimalvariables by taking advantage of both numerical and technical knowl-edge-based approaches. The working flowchart of HMCD is shown in
Fig. 1. The working flowchart of HMCD.
M.A. Qyyum et al. Cryogenics 89 (2018) 131–140
133
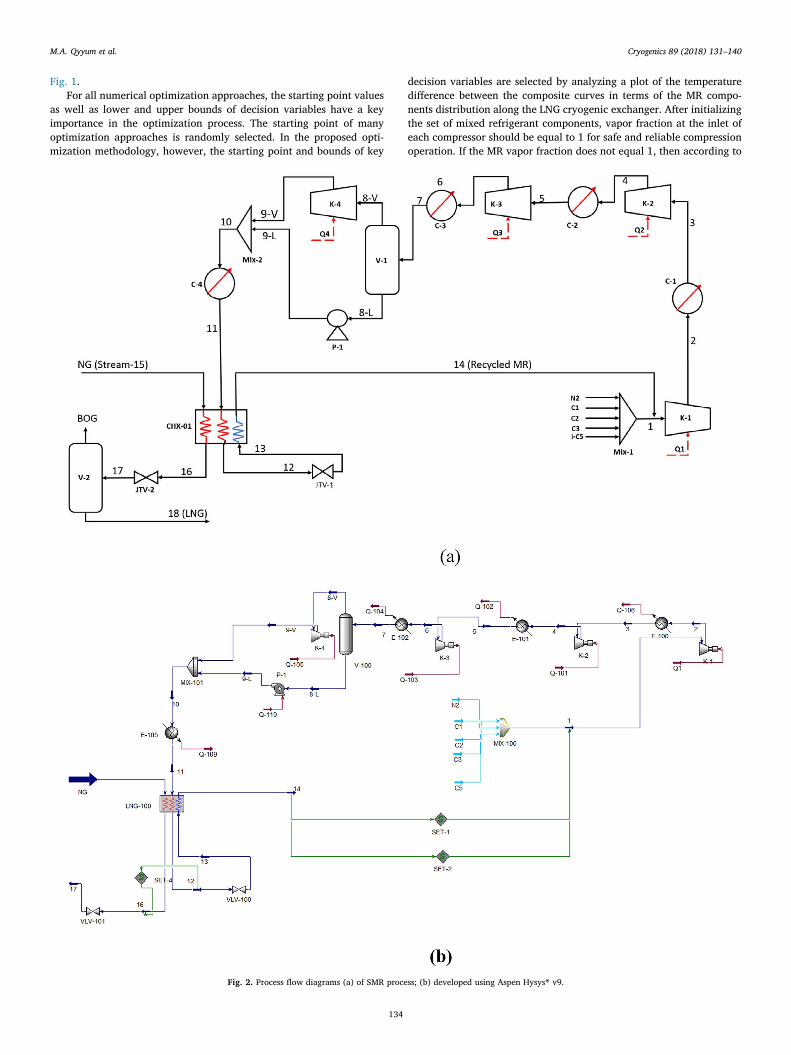
Fig. 1.For all numerical optimization approaches, the starting point values
as well as lower and upper bounds of decision variables have a keyimportance in the optimization process. The starting point of manyoptimization approaches is randomly selected. In the proposed opti-mization methodology, however, the starting point and bounds of key
decision variables are selected by analyzing a plot of the temperaturedifference between the composite curves in terms of the MR compo-nents distribution along the LNG cryogenic exchanger. After initializingthe set of mixed refrigerant components, vapor fraction at the inlet ofeach compressor should be equal to 1 for safe and reliable compressionoperation. If the MR vapor fraction does not equal 1, then according to
Fig. 2. Process flow diagrams (a) of SMR process; (b) developed using Aspen Hysys® v9.
M.A. Qyyum et al. Cryogenics 89 (2018) 131–140
134
the HMCD approach this can be achieved by decreasing the heavy re-frigerant flow rate such as iso-pentane and propane. Reducing theevaporation pressure of MR can also be another option to remove anyliquid fraction at the inlet of each compressor. The SMR process willconnect to MVS optimizer for numerical optimization at the values ofdecision variables corresponding to the MITA constraint value of 1 °C,which is considered as the lower bound of the feasible range (i.e., 1 °Cto 3 °C). The lower boiling components of MR such as nitrogen andmethane have a major effect to increase the MITA value.
At the values of key decision variables corresponding to the MITAvalue of 1 °C, the numerical part of HMCD which is coded in an MVSenvironment will initiate. This numerical part of HMCD, which is basedon MCD algorithm, is constrained at the MITA value of 3 °C. Any valueof MITA between 1 °C and 3 °C can be used; however, 3 °C is moreflexible, which increases the viability of optimization results in terms ofpractical implementation. Searching a loop will start in the ith direc-tion. On each iteration, it will check if the constraint value is satisfiedand the objective function f(x) value is lower than previous “a,” andupdate and save those values of the decision variables. As the numericalpart of HMCD does not deal with any process knowledge, after termi-nation at the MITA value of 3 °C, it is again important to check if thereis any liquid fraction at the inlet of each compressor. After numericaloptimization, there is greater sensitivity to a change in the flow rate ofheavy refrigerant or evaporation pressure because the objective func-tion (overall compression power) is now at its minimum value. If adecrease in heavy refrigerant flow or evaporation pressure has causedan increase in the required compression power, then adjusting the after-cooler temperature is the most feasible way to remove any liquidfraction of MR at the inlet of each compressor. After numerical opti-mization, a vapor fraction equal to 1 leads to further reduction of theobjective function value by decreasing the MR component flow ratesequentially from the lowest to the highest boiling points. Reducingcondensation pressure or increasing evaporation pressure can also beconsidered another option to further decrease the objective functionvalue.
3. SMR process description and simulation
The process flow diagram of the SMR process is shown in Fig. 2a.The presented SMR process is not a conventional process, it has been
enhanced by Pham et al. [27]. They added the iC5 (iso-pentane) in theconventional mixed refrigerant (usually consists of methane, ethane,propane, and nitrogen), resulting mixed refrigerant (MR) had highcritical temperature due to the presence of iC5. Therefore, they addedphase separator and pump to handle liquid phase MR-stream. Thisenhanced SMR process was chosen as a base case for design optimiza-tion. Aspen Hysys® v9 was used to simulate the presented SMR process.The simulated SMR process is shown in Fig. 2b. As shown inFig. 2a and 2b, the MR stream-1 was compressed to a 39.0 bar (opti-mized value) through a four-stage compression units which were fa-cilitated with inter-stage cooling systems. In the result of compression,the MR-stream absorbed some amount of heat, which leads to increasein temperature that was reduced to a 40 °C through air-cooled coolers.It has also been investigated that the cooling medium in the inter-stagecooling systems can be either water or air, depends on environmentalsite conditions [6]. Finally, the MR was then entered in the main LNGcryogenic heat exchanger (CHX-01) where MR and NG exchange theirheat. In the main cryogenic LNG exchanger, MR (stream-11) and NG(steam-15) were condensed completely. Subsequently, the high-pres-sure liquid MR (stream-12) goes through a Joule-Thomson (JT) valveand expanded to a pressure of 2.5 bar (optimized value). The expandedMR which has a very low temperature (approximately −155 °C) wasevaporated by taking the latent heat of the vaporization from NG(stream-15) and MR (stream-11). Finally, from the main cryogenic heatexchanger, the MR stream (stream-14) was obtained as a superheatedvapor. This superheated vapor (stream-14) then introduced to thecompressor (K-1) for recycling and refrigeration loop completes.
Recently, Pham et al. [27] enhanced and optimized the SMR pro-cess. They modeled the SMR process using the assumptions and con-ditions which are listed in Table 1. This study also follows the sameconditions and assumptions used in [27] for the simulation of the baseSMR process. The binary interactions were calculated using well-knownPeng-Robinson equation of state; whereas, the Lee-Kesler equation waschosen to determine the enthalpies and entropies. Furthermore, it wasassumed that heat losses to the environment are negligible.
4. SMR process optimization
4.1. Objective function, decision variables, and constraints
In terms of design optimization, the SMR process is taken as non-linear optimization problem due to the complex thermodynamics in-volvement between design variables and constrained objective func-tion. Khan et al. [7] and Pham et al. [27] presented a knowledge-in-spired based procedure for the selection of lower and upper bounds ofkey decision variables for the design optimization of LNG processesespecially for the SMR process. In this study, the lower and upperbounds of design variables were also chosen with deep processknowledge approach and care because any small changes in the designvariables can lead to process infeasibility. Generally, this process in-feasibility takes place in terms of negative MITA value, which causesthe termination of optimization without reaching at optimum condi-tions. The key design variables with their lower and upper bounds arelisted in Table 2.
Table 1Simulation basis and feed conditions of the SMR process studied [27].
Property Condition
NG feed conditionTemperature 32 °CPressure 80 barFlow rate 1.0 kg/h
NG feed composition Mole fractionNitrogen 0.0022Methane 0.9133Ethane 0.0536Propane 0.0214i-Butane 0.0046n-Butane 0.0047i-Pentane 0.001n-Pentane 0.001Intercooler outlet temperature 40 °CVapor fraction boil-off-gas 8.0%Compressor isentropic efficiency 0.75Pump isentropic efficiency 0.75Thermodynamic property package Peng-RobinsonEnthalpy calculation Lee Kesler
Pressure drops across LNG heat exchanger“Stream-15″ to “Stream-16″ 1.0 bar (hot stream)“Stream-11″ to “Stream-12″ 1.0 bar (hot stream)“Stream-13″ to “Stream-14″ 0.1 bar (cold stream)
Table 2Key decision variables with lower and upper bounds.
Decision variables Lower bound Upper bound
High pressure of MR (stream-10), P10 (bar) 35.0 70.0Evaporation pressure of MR (stream-13), P13 (bar) 1.1 4.0Flow rate of nitrogen, mN2 (kg/h) 0.1 0.75Flow rate of methane, mC1 (kg/h) 0.15 0.85Flow rate of ethane, mC2 (kg/h) 0.45 1.15Flow rate of propane, mC3 (kg/h) 0.55 1.40Flow rate of iso-pentane, miC5 (kg/h) 0.65 1.85
M.A. Qyyum et al. Cryogenics 89 (2018) 131–140
135
The energy efficiency is reported as an important factor with respectto the capital investment and operating cost [17], which is consideredas an objective function in recent studies [6,16,27,28,30,31]. The op-timization problem for unit compression power as an objective func-tion, can then be written as:
∑= ⎛
⎝⎜
⎞
⎠⎟
=
f X W mMin ( ) Min /i
n
i LNG1 (1)
subject to
⩾T XΔ ( ) 3min( ) (2)
>T X T X( ) ( )Dew3 3, (3)
>T X T X( ) ( )Dew5 5, (4)
>T X T X( ) ( )Dew14 14, (5)
where “X” is the vector of decision variables,=X P P m m m m m( , , , , , , ),N C C C iC10 13 2 1 2 3 5 and T3, T5, and T14 are representing
the temperature of stream-3, stream-5, and stream-14, respectively.The flow rates of the individual components of mixed refrigerant,
condensation pressure, and evaporation pressure were chosen as thekey decision (design) variables. The total required compression powerfor 1 kg NG liquefaction was taken as an objective function, which wasconstrained by the MITA value of 3 °C in the main cryogenic LNG ex-changer as well as and the 100% vapor fraction at the inlet of eachcompressor.
4.2. Optimization procedure
The optimization procedure was started by initializing the MRcomponents with the mean values of their lower and upper bounds.Because of the presence of higher critical temperature components suchas propane and iso-pentane, there was the possibility of the liquidfraction being at the suction point of the compressors. Typically, toavoid the liquid fraction at the inlet of any compressor, a form of phaseseparator installation is needed. Otherwise, decreasing the heavy re-frigerant flow rate or evaporation pressure is another economical andsimple solution available to remove the liquid fraction, as shown inFig. 1. Usually, the efficiency of the numerical optimization algorithmsstrongly depends on the initial values of the decision variables.Therefore, before invoking the codes of the proposed algorithm, theMITA value should be in the feasible range (i.e., 1 °C to 3 °C [32]). Afterobserving and removing the liquid fraction at the inlet of each com-pressor, moving the forward to achieve the minimum feasible MITAvalue, i.e., 1 °C. According to Table 3, the lowest boiling componentshave pronounced effects on the MITA value within the main cryogenicexchanger.
Therefore, by increasing the flow rate of N2 and CH4 sequentiallywithin the defined boundary, the MITA value was achieved at 1 °C(minimum value of feasible MITA). This observation was completelybased on the KBO strategy. Remaining part of the optimization wasbased on numerical optimization approach that was linked with thesimulation model of the SMR process through the COM functionality.
The numerical search part of the HMCD is totally based on the MCDapproach. Repeatedly, this part is started by choosing the lower andupper bounds corresponding to the present values of key decisionvariables. The search area becomes smaller in comparison with theinitially defined search area (see Table 2). This smaller search arealeads to the higher efficiency of the coded algorithm in a short timeinterval. However, a newly developed MVS-based optimizer providesthe facility to change the lower and upper bounds during the optimi-zation. Optimization through the MCD algorithm is started from theinitial objective value “a” at the MITA constraint value of 1 °C. To de-termine the search direction in the area of the starting point, a verysmall step size (Δxi) is imposed in each coordinate direction. Using this
small step size and starting point, similar steps of a pattern search areused to find the base point. Once the base point is obtained, cyclicaliterations are performed through each coordinate individually tominimize the objective function. Iteration of different directions/co-ordinates is then performed cyclically to find a descent direction that isequivalent to the gradient descent. A new solution update from X0 toX1, m(X0)≥m(X1) is obtained by performing a line search in all di-rections.
Then, by adopting X1 as the new starting point, a coordinate descentsearch is performed over a narrow space around X1 to find more pro-mising solutions. After obtaining a locally optimized solution, e.g.,
′f X( )1 as an update from f(X1), the first coordinate of ′X 1 (rand, 2,3,… , n) is randomized while the others remain fixed at their previousvalues. The coordinate descent search is then performed using ′X 1
(rand, 2, 3… , n) as the new starting point, and the optimal spacearound X2 is further explored to obtain a new optimal solution, ′X 2. Forthis iteration, the second coordinate of ′X 2 (1, rand, 2, 3… n) is ran-domized and subsequent search moves made in its vicinity. In this way,many locally optimal solutions are obtained. Searching toward theminimal value of the objective function in comparison with the value of“a” is started by selecting the initial values of the decision variables.The number of generations and local optimum points can also be ad-justed by the user. Finally, the termination of the coded algorithm ismade with respect to the minimum objective function (smaller than the“a”) which is constrained at the 3 °C MITA value. This procedure wasexplained in more detail by Park et al. [28].”
For optimization, it is critical to follow other constraints based onthe deep process knowledge. After termination, the liquid fraction waspresent at the inlet of compressor K-2 and K-3. Even though this liquidfraction was less than 10%, there is a zero tolerance for the liquidfraction in consideration of the safety and efficiency of compressors,according to standard operating procedures. Therefore, to eliminate theliquid fraction at the inlet of K-2 and K-3, the heavy refrigerant iC5 flowrate or the evaporation pressure should be reduced to maintain theconstraint MITA value of 3 °C corresponding to the minimum objectivefunction. As a result, there is no liquid at the inlet of compressor K-2,while the outlet temperature of after-cooler C-2 was adjusted from 40 °Cto 48 °C higher than the stream dew point in the case of compressor K-3.
5. Results and discussions
5.1. Process analysis and optimization results
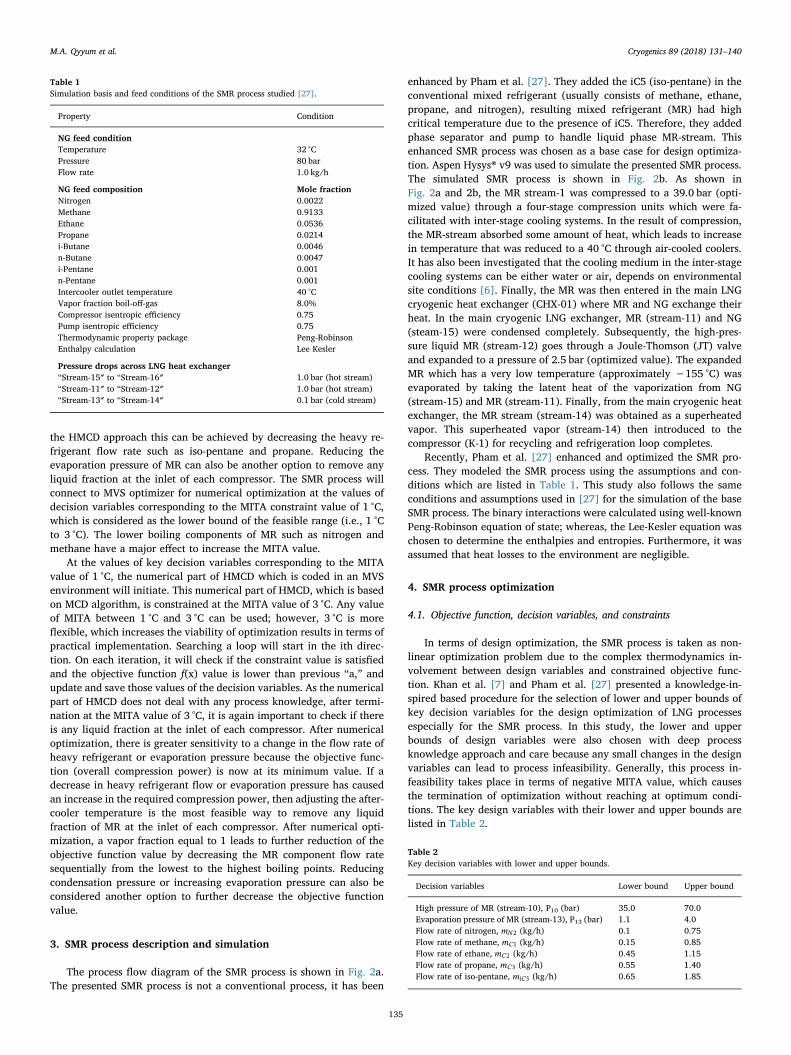
Figures 3a and 3b presents the thermodynamic efficiency in terms ofthe composite curves of TDCC and THCC inside the main LNG cryogenicheat exchanger for the base SMR case [27], respectively. Pham et al.[27], used the SMR process as a base that was produced the LNG withspecific compression power of 0.4584 kW/(kg/h)-LNG.
The impact of each MR component on the performance of the LNGprocess in terms of energy efficiency can be observed using the tem-perature difference between hot and cold composite curves (TDCC)[16], whereas the performance of the LNG process in terms of the ex-ergy efficiency can be analyzed by observing the gap between thetemperature-heat flow composite curves matching technique. The spacebetween the temperature-heat flow hot and cold composite curves are
Table 3Temperature distribution range of the refrigerant components along the mainLNG cryogenic exchanger [33].
Refrigerant component Distribution range (°C)
Nitrogen −160 to −75Methane −120 to −30Ethane −70 to 10Propane, iso-pentane − 40 to 40
M.A. Qyyum et al. Cryogenics 89 (2018) 131–140
136
presented the exergy loss. The region in the temperature interval from−160 °C to −140 °C, which is shown under the black circled area inFig. 3a (TDCC plot) has a small gap between the TDCC compositecurves. In this region, the energy efficiency enhancement by mini-mizing the exergy losses is a difficult task. However, to reduce the gapbetween TDCC curves in the black circled area of Fig. 3a, there is needto adjust the optimal flow rates of the low boiling point components ofmixed refrigerant, such as nitrogen and methane. Whereas, the regionfor the temperature interval from −95 °C to −25 °C that is circled bygreen color, this region has an opportunity for the significant im-provement in energy efficiency by finding the optimal flow rates ofmethane, ethane, and propane. Similarly, high boiling components ofthe MR such as propane and iso-pentane can be used to minimize theexergy losses in the region of the temperature interval from −25 °C to40 °C. These all improvements in the TDCC plot will ultimately lead tothe overall energy enhancement of the SMR process.
Firstly, the well-proven optimization approach for LNG processes,such as GA, KBO, and PSO were employed for the design optimizationof the SMR process. Design optimization of SMR process using the GA,resulted specific compression power of 0.3187 kW/(kg/h)-LNG, whichwas equivalent to 30.4% energy savings as compared to the base case.Similarly, KBO and PSO approaches were also applied for the designoptimization of the SMR process, which resulted 0.3183, and0.2865 kW/(kg/h)-LNG, respectively. By employing the KBO and PSO,the required energy can be saved about 30.6% and 37.5%, respectively,in comparison with the base case. Finally, the proposed HMCD algo-rithm was applied for the design optimization of the SMR process. Theresulting optimum design variables executed the most dominant im-provement over the existing well-proven optimization techniques (GA,KBO, and PSO): by applying HMCD, the design of SMR process wasobtained with the required compression power of 0.2555 kW/(kg/h)-LNG. Hence, in the case of HMCD-based design of SMR, the requiredenergy can be saved up to 44.3% in comparison with the base case.Table 4 compares the optimization result by the HMCD method with thebase, GA-optimized, KBO-optimized, and PSO-optimized cases.
Fig. 4a and 4b present the hot and cold composite curves of TDCCand THCC inside the main LNG cryogenic heat exchanger for theHMCD-optimized case.
Nevertheless, in the temperature range from −5 °C to 40 °C(Fig. 4a), there is still a high driving force (high temperature approach)i.e., > 20 °C is present inside the main cryogenic heat exchanger. Thishigh-temperature approach is mainly due to the presence of highboiling point components of MR such as of propane and iso-pentane.This high temperature can be further reduced by applying the
precooling refrigeration cycle for the natural gas feed as well as the MRbefore they introduce in the main LNG heat exchanger. This precoolingrefrigeration cycle will ultimately improve the energy efficiency of theprocess for example C3MR process, which has propane precooling re-frigeration cycle. Generally, entropy is generated inside the main LNGcryogenic exchanger due to the high-temperature approach at themiddle section of the composite curves [7]. By increasing the flow ratesof high boiling components such propane and iso-pentane, high-tem-perature approach can be moved to the warmer end of the cryogenicexchanger, which leads to high energy efficiency. Although, the highflow rates of propane and iso-pentane can cause to produce some liquidfraction at the inlet of 2nd or 3rd compression stage. Therefore, in theproposed study, the heavy refrigerant flow rates was increased corre-sponding to zero-liquid fraction at the entrance of each compressor.Nevertheless, to achieve minimum required compression power asmuch as possible, less than 10% liquid fraction still was present at theinlet of compressor K-2. To make 100% vapor fraction at the inlet of K-2, the outlet temperature of after-cooler was adjusted. However, theafter-cooler temperature has also pronounced effect on the overall en-ergy requirement, as shown in Fig. 5.
In addition, the optimal design and operational parameters for theSMR process strongly depends on the feed NG composition with respectto methane as well as conditions. In the proposed study, feed compo-sition was taken with> 90% (by mole) methane contents. With thisfeed NG composition and conditions, the efficiency of the proposedHMCD algorithm is apparently superior to other well-proven optimi-zation algorithms for LNG processes. This superior efficiency of HMCDin terms of the optimized composite curves can be clearly seen in Fig. 6,which shows that the peak of the composite curve for the HMCD-op-timized SMR process is lower than all other optimized curves.
5.2. Thermodynamic evaluation and design analysis
A dimensionless term (valued between 0 and 1) known as figure ofmerit (FOM), which is defined by a ratio of the required minimum workto actual supplied work to liquefy unit mass of natural gas, was used forthe thermodynamic evaluation of liquefaction cycle [34,35].
Mathematically, it can be formulated as:
=FOM WW
min
actual (6)
The required minimum work or power (Wmin) for liquefaction is
= − − −W m h h T s s[( ) ( )]min NG o o o (7)
(a) (b) Fig. 3. Composite curves of: (a) TDCC; (b) THCC for the base case [27].
M.A. Qyyum et al. Cryogenics 89 (2018) 131–140
137

which is the absolute minimum provided by the thermodynamic limit.The bracket in Eq. (7) presents the exergy of LNG or flow availability[34,35]. The FOM for the HMCD optimized SMR in comparison withthe base case, KBO-optimized, GA-optimized, and PSO-optimized, isgiven in Table 5. It is clearly seen from the table that the FOM of theHMCD-optimized case is significantly improved, i.e., 39.4% whereas,the base case has 22.3%.
The duty of an LNG cryogenic exchanger presents the MR capacityfor exchanging cold energy with the NG feed to make LNG. Assumingconstant log-mean temperature difference (LMTD) and heat transferarea, the duty of a cryogenic exchanger has a direct relation with anoverall heat transfer coefficient, U, as shown in the general energybalance in Eq. (8).
=Q UA F LMTD. . ( )t (8)
Aspen Hysys® does not provide the value of heat transfer area “A”and heat transfer coefficient “U” separately. Therefore, the requiredheat transfer area, A, as a design parameter of the exchanger, is ex-amined in terms of the product of the area and the heat transfer coef-ficient (UA).
As shown in Table 5, the cooling duty of the main LNG cryogenicexchanger for the HMCD-optimized case is lower than the base case, buthigher than other optimized cases. More cold energy is transferred from
MR to NG when the LMTD value is higher, as can be seen from the basecase in Table 5; however, at the same time it leads to more entropygeneration due to the large temperature gradient.
Table 4Summary of HMCD optimization results in comparison with several well-known optimization algorithms.
Base case [27] GA optimized KBO optimized [27] PSO optimized HMCD optimized
Decision variablesHigh pressure of MR, P10 (bar) 46.1 68.0 48.75 59.0 39.0Evaporation Pressure of MR, P13 (bar) 1.3 2.0 2.22 3.4 2.5Flow rate of nitrogen, mN2 (kg/h) 0.2690 0.3588 0.2660 0.2980 0.2024Flow rate of methane, mC1 (kg/h) 0.5290 0.4310 0.4850 0.5400 0.4820Flow rate of ethane, mC2 (kg/h) 0.6190 0.5910 0.7950 0.7000 0.7365Flow rate of propane, mC3 (kg/h) 2.847 0.7560 0.7100 1.1000 0.8925Flow rate of iso-pentane, miC5 (kg/h) 0.0 1.433 1.500 1.260 1.455
ConstraintsMITA (°C) 3.0 3.0 3.0 3.0 3.0T3 (°C) 40.0 40.0 40.0 40.0 40.0T5 (°C) 40.0 53.20 54.20 53.0 48.0T14 (°C) 36.93 28.15 36.80 26.22 36.98
Specific compression power (kWkg−1 h−1) 0.4584 0.3187 0.3183 0.2865 0.2555Relative energy saving (%) – 30.4 30.6 37.5 44.3
(a) (b)Fig. 4. Composite curves of: (a) TDCC; (b) THCC for the HMCD-optimized case.
Fig. 5. Effect of the after-cooler outlet temperature on the compression power.
M.A. Qyyum et al. Cryogenics 89 (2018) 131–140
138

As shown in Table 5, the LMTD value for the HMCD-optimized SMRprocess is lower than that of the base case, which is presented for thehigher cost of the main cryogenic exchanger at a constant value heattransfer coefficient. This higher investment of the main cryogenic ex-changer has an inverse relation with energy cost in terms of compres-sion power. As shown in Table 4, the HMCD-optimized case has sig-nificantly higher energy efficiency in comparison with the base caseand other optimized cases. Therefore, the LMTD can also be consideredas another important design parameter, which should be at an optimalvalue corresponding to a higher coefficient of performance (COP) at themost economical and feasible value of UA. The lower heat transfer area(A) value leads to a decrease in capital investment. The LMTD is di-rectly related to the required exchanger area. According to the generalenergy balance equation (Eq. (8)), there is the inverse relation betweenthe LMTD value and exchanger area. The improvement in the exergyefficiency of the process can also be analyzed through the COP of therefrigeration cycle. The COP is defined as the ratio of useful coolingprovided to the work input in the form of the compression energy [7].The COP can be formulated as
= =COP Heat absorbed by the MRCompression power
QWrev (9)
Furthermore, at the same power source and operating parameters, ahigher COP refrigeration cycle usually provides a lower value of thepurchased energy in comparison with the lower COP refrigerationcycle. As seen in Table 5, the refrigeration cycle of the HMCD-optimizedSMR process brought the highest value of COP among all candidatesand was 34.74% higher than the base SMR process.
6. Exergy analysis
The exergy analysis gives a common denominator to compare theperformance of different refrigeration systems. It also informs theamount of irreversibility associated with any heat transfer process op-erating across finite temperature difference. Exergy is not conserveddue to irreversibilities. Exergy is the potential of a system to cause a
change as it achieves equilibrium with its environment through a hy-pothetical reversible process [36]. It can be expressed as:
= − − −h h T s sΔ E ( ) ( )o o o (10)
Generally, exergy analysis of the process is presented in terms ofexergy loss in each equipment associated with that process. In thisstudy, exergy losses were calculated in each equipment involved in theproposed HMCD-optimized SMR process. The expressions for exergyloss calculation in different equipment of the HMCD-optimized SMRwere adopted from [33] as summarized in Table 6.
Based on the exergy loss calculation expressions in Table 6, theexergy loss in each equipment of the HMCD-optimized SMR process wasanalyzed in Table 7. It can be seen that the compressors and after-coolers have the highest exergy loss, i.e., 30.4% and 27. 5%, respec-tively. Subsequently, the main LNG heat exchanger has 19.2% exergyloss. These values of exergy losses in the HMCD-optimized SMR processimply that the energy efficiency of the SMR process can be furtherimproved either by optimization solely or by improving refrigerationcycle units.
7. Conclusions
An HMCD optimization algorithm was proposed to present an op-timal design of the SMR process for the LNG production with minimumenergy consumption. The proposed algorithm have shown the superiorperformance over other available well-proven optimization algorithmsfor finding the optimum condition of a complex SMR process. In par-ticular, the required compression power can be saved up to 44.3% incomparison with the base case. The exergy loss analysis for final HMCD-optimized SMR process were also conducted. It was found that, com-pression units with after-coolers have highest exergy losses. The exergyefficiency or COP of the refrigeration cycle can be further improvedusing a robust metaheuristic optimization algorithm with a deep pro-cess knowledge. Besides the optimization, the proposed HMCD algo-rithm can be helpful to understand the technical perspectives of theprocess, which are essential to engineers. Because the algorithm issimple and efficient, it can be applied widely to other mixed refrigerantbased LNG processes such as DMR, cascade, and C3MR.
Acknowledgments
This work was supported by the 2016 Yeungnam University re-search Grant.
Fig. 6. Comparison of composite curves from various optimization methods.
Table 5Design analysis of the SMR process.
Parameters Base case [27] GA optimized KBO Optimized[27] PSO optimized HMCD optimized
Duty of main cryogenic exchanger (kJ/h) 3277.0 2506.0 2767.0 2793.0 2803.0Log mean temperature difference (°C) 14.56 5.82 4.50 4.97 4.70UA (kJ/C-h) 225.0 431.1 614.4 562.6 597.4Coefficient of performance (COP) 1.987 2.187 2.415 2.710 3.045Figure of merit (FOM) 0.223 0.314 0.315 0.3503 0.394
Table 6Expressions for exergy loss calculation in equipment associated with SMR process [33].
Equipment Exergy loss (kJ/h)
Compressor = − −Ex m Ex Ex W( )( )loss in outPump = − −Ex m Ex Ex W( )( )loss in outAfter-cooler exchanging heat with ambient = −Ex m Ex Ex( )( )loss in outPhase separator = − −Ex Ex Ex Exloss in Liq Vap
Throttle valve (JT valve) = −Ex m Ex Ex( )( )loss in outMulti-stream LNG heat exchanger = ∑ − ∑Ex m Ex m Ex( ) ( )loss in out
M.A. Qyyum et al. Cryogenics 89 (2018) 131–140
139

Appendix A. Supplementary material
Supplementary data associated with this article can be found, in theonline version, at http://dx.doi.org/10.1016/j.cryogenics.2017.12.005.
References
[1] Kumar S, Kwon H-T, Choi K-H, Lim W, Cho JH, Tak K, et al. LNG: an eco-friendlycryogenic fuel for sustainable development. Appl Energy 2011;88(12):4264–73.
[2] Li QY, Ju YL. Design and analysis of liquefaction process for offshore associated gasresources. Appl Therm Eng 2010;30(16):2518–25.
[3] IGU. International Gas Union World LNG Report 2017; 2017.[4] Finn A, Johnson G, Tomlinson T. Developments in natural gas liquefaction.
Hydrocarb Process 1999;78(4):47–56.[5] Park K, Won W, Shin D. Effects of varying the ambient temperature on the per-
formance of a single mixed refrigerant liquefaction process. J Nat Gas Sci Eng2016;34:958–68.
[6] Qyyum MA, Minh LQ, Ali W, Hussain A, Bahadori A, Lee M. Feasibility study ofenvironmental relative humidity through the thermodynamic effects on the per-formance of natural gas liquefaction process. Appl Therm Eng 2018;128:51–63.
[7] Khan MS, Lee S, Rangaiah GP, Lee M. Knowledge based decision making method forthe selection of mixed refrigerant systems for energy efficient LNG processes. ApplEnergy 2013;111:1018–31.
[8] Cao L, Liu J, Xu X. Robustness analysis of the mixed refrigerant composition em-ployed in the single mixed refrigerant (SMR) liquefied natural gas (LNG) process.Appl Therm Eng 2016;93:1155–63.
[9] Khalilpour R, Karimi I. Evaluation of utilization alternatives for stranded naturalgas. Energy 2012;40(1):317–28.
[10] Wang M, Khalilpour R, Abbas A. Thermodynamic and economic optimization ofLNG mixed refrigerant processes. Energy Convers Manage 2014;88:947–61.
[11] Mortazavi A, Somers C, Alabdulkarem A, Hwang Y, Radermacher R. Enhancementof APCI cycle efficiency with absorption chillers. Energy 2010;35(9):3877–82.
[12] Fahmy MFM, Nabih HI, El-Nigeily M. Enhancement of the efficiency of the OpenCycle Phillips Optimized Cascade LNG process. Energy Convers Manage2016;112:308–18.
[13] Vatani A, Mehrpooya M, Palizdar A. Advanced exergetic analysis of five natural gasliquefaction processes. Energy Convers Manage 2014;78:720–37.
[14] Khan MS, Lee M. Design optimization of single mixed refrigerant natural gas li-quefaction process using the particle swarm paradigm with nonlinear constraints.
Energy 2013;49:146–55.[15] Khan MS, Lee S, Lee M. Optimization of single mixed refrigerant natural gas li-
quefaction plant with nonlinear programming. Asia-Pac J Chem Eng2012;7:S62–70.
[16] Pham TN, Khan MS, Minh LQ, Husmil YA, Bahadori A, Lee S, et al. Optimization ofmodified single mixed refrigerant process of natural gas liquefaction using multi-variate Coggin’s algorithm combined with process knowledge. J Nat Gas Sci Eng2016;33:731–41.
[17] Austbø B. Use of optimization in evaluation and design of liquefaction processes fornatural gas; 2015.
[18] Venkataraman P. Applied optimization with MATLAB programming. Wiley; 2009.[19] Lee GC, Smith R, Zhu XX. Optimal synthesis of mixed-refrigerant systems for low-
temperature processes. Ind Eng Chem Res 2002;41(20):5016–28.[20] Aspelund A, Gundersen T, Myklebust J, Nowak MP, Tomasgard A. An optimization-
simulation model for a simple LNG process. Comput Chem Eng2010;34(10):1606–17.
[21] Mokarizadeh Haghighi Shirazi M, Mowla D. Energy optimization for liquefactionprocess of natural gas in peak shaving plant. Energy 2010;35(7):2878–85.
[22] Remeljej CW, Hoadley AFA. An exergy analysis of small-scale liquefied natural gas(LNG) liquefaction processes. Energy 2006;31(12):2005–19.
[23] Morin A, Wahl PE, Mølnvik M. Using evolutionary search to optimise the energyconsumption for natural gas liquefaction. Chem Eng Res Des 2011;89(11):2428–41.
[24] Skaugen G, Gjøvåg GA, Nekså P, Wahl PE. Use of sophisticated heat exchangersimulation models for investigation of possible design and operational pitfalls inLNG processes. J Nat Gas Sci Eng 2010;2(5):235–43.
[25] Moein P, Sarmad M, Ebrahimi H, Zare M, Pakseresht S, Vakili SZ. APCI- LNG singlemixed refrigerant process for natural gas liquefaction cycle: analysis and optimi-zation. J Nat Gas Sci Eng 2015;26:470–9.
[26] Khan MS, Karimi IA, Bahadori A, Lee M. Sequential coordinate random search foroptimal operation of LNG (liquefied natural gas) plant. Energy 2015;89:757–67.
[27] Pham TN, Long NVD, Lee S, Lee M. Enhancement of single mixed refrigerant naturalgas liquefaction process through process knowledge inspired optimization andmodification. Appl Therm Eng 2017;110:1230–9.
[28] Park JH, Khan MS, Lee M. Modified coordinate descent methodology for solvingprocess design optimization problems: application to natural gas plant. J Nat GasSci Eng 2015;Part 27:132–41.
[29] Long NVD, Minh LQ, Pham TN, Bahadori A, Lee M. Novel retrofit designs using amodified coordinate descent methodology for improving energy efficiency of nat-ural gas liquid fractionation process. J Nat Gas Sci Eng 2016;33:458–68.
[30] Khan MS, Lee S, Hasan M, Lee M. Process knowledge based opportunistic optimi-zation of the N2–CO2 expander cycle for the economic development of strandedoffshore fields. J Nat Gas Sci Eng 2014;18:263–73.
[31] Khan MS, Lee S, Getu M, Lee M. Knowledge inspired investigation of selectedparameters on energy consumption in nitrogen single and dual expander processesof natural gas liquefaction. J Nat Gas Sci Eng 2015;23:324–37.
[32] Hasan MMF, Karimi IA, Alfadala HE, Grootjans H. Operational modeling of multi-stream heat exchangers with phase changes. AIChE J 2009;55(1):150–71.
[33] Venkatarathnam G, Timmerhaus KD. Cryogenic mixed refrigerant processes. NewYork: Springer; 2008.
[34] Chang H-M. A thermodynamic review of cryogenic refrigeration cycles for lique-faction of natural gas. Cryogenics 2015;72(Part 2):127–47.
[35] Chang H-M, Lim HS, Choe KH. Thermodynamic design of natural gas liquefactioncycles for offshore application. Cryogenics 2014;63(Supplement C):114–21.
[36] Sato N. Chemical energy and exergy: an introduction to chemical thermodynamicsfor engineers. Elsevier; 2004.
Table 7Exergy losses associated with equipment in the HMCD-optimized SMR process.
Equipment Exergy loss (kJ/h) Exergy losses (%)
Compressors 194.2 30.4Pump 1.6 0.2After-coolers 175.5 27.5Phase separator 43.0 6.7Throttle valve (JT valve) 102.3 16.0LNG heat exchanger 122.8 19.2Whole process 639.4 –
M.A. Qyyum et al. Cryogenics 89 (2018) 131–140
140


![Dual mixed refrigerant LNG process Uncertainty ...psdc.yu.ac.kr/images/Publications/International Journal...Uncertainty factor Xn Uncertainty factor X2 Uncertainty factor X1 W } ]uµo](https://img.pdfslide.net/doc/110x75/5f64147d1c7e351a7b79abd3/dual-mixed-refrigerant-lng-process-uncertainty-psdcyuackrimagespublicationsinternational.jpg)