Embed Size (px)
Citation preview
2/13/12
1
Laboratory for Manufacturing and Sustainability © 2012
Design principles for sustainable materials & manufacturing processes, I
David Dornfeld UC Berkeley
02/13/12
Laboratory for Manufacturing and Sustainability © 2012 Class 2 Class 4
Outline • Topics:
– first … dimensions of impact! – operation and control of manufacturing processes – optimizing energy use – supply chain management – OECD framework
Readings • “Greening the Industrial Facility,” TE Graedel and JA Howard-Grenville,
Springer, 2005 • “Materials and the Environment: Eco-Informed Materials Choices,” MF
Ashby, Elsevier, 2009 • OECD, Eco-Innovation in Industry: Enabling Green Growth, OECD
Publishing, 2010 (download at no charge at http://www.oecd-ilibrary.org/content/book/9789264077225-en)

2/13/12
2
Laboratory for Manufacturing and Sustainability © 2012 Class 2
Manufacturing Sustainability Footprint Social
Economic
Environmental
Materials
Energy
Greenhouse Gases
Water
Recycle/reuse
Existing Design
New Design better
Laboratory for Manufacturing and Sustainability © 2012 Slide 4 /53
Dimensions of impact and influence
Lecture 8
The typology of eco-innovation*
**Source: “Sustainable Manufacturing and Eco-innovation: Towards a Green Economy,” OECD Policy Brief, June 2009.
Use vs manufacturing
*Source: http://info.industry.siemens.com/press/Details.aspx?pressArticleId=2028, accessed 3 Oct. 2011
Environment vs Economic Benefit** Spatial vs temporal

2/13/12
3
Laboratory for Manufacturing and Sustainability © 2012 Slide 5 /53
Dimensions of impact and influence
Lecture 8
The typology of eco-innovation*
**Source: “Sustainable Manufacturing and Eco-innovation: Towards a Green Economy,” OECD Policy Brief, June 2009.
Use vs manufacturing
*Source: http://info.industry.siemens.com/press/Details.aspx?pressArticleId=2028, accessed 3 Oct. 2011
Environment vs Economic Benefit** Spatial vs temporal
Laboratory for Manufacturing and Sustainability © 2012 Slide 6 /53
Dimensions of impact and influence
Lecture 8
The typology of eco-innovation*
**Source: “Sustainable Manufacturing and Eco-innovation: Towards a Green Economy,” OECD Policy Brief, June 2009.
Use vs manufacturing
*Source: http://info.industry.siemens.com/press/Details.aspx?pressArticleId=2028, accessed 3 Oct. 2011
Environment vs Economic Benefit** Spatial vs temporal
Use vs manufacturing

2/13/12
4
Laboratory for Manufacturing and Sustainability © 2012 Slide 7 /53
Dimensions of impact and influence
Lecture 8
The typology of eco-innovation*
**Source: “Sustainable Manufacturing and Eco-innovation: Towards a Green Economy,” OECD Policy Brief, June 2009.
Use vs manufacturing
*Source: http://info.industry.siemens.com/press/Details.aspx?pressArticleId=2028, accessed 3 Oct. 2011
Environment vs Economic Benefit** Spatial vs temporal
Spatial vs temporal
Laboratory for Manufacturing and Sustainability © 2012 Slide 8 /53
Dimensions of impact and influence
Lecture 8
The typology of eco-innovation*
**Source: “Sustainable Manufacturing and Eco-innovation: Towards a Green Economy,” OECD Policy Brief, June 2009.
Use vs manufacturing
*Source: http://info.industry.siemens.com/press/Details.aspx?pressArticleId=2028, accessed 3 Oct. 2011
Environment vs Economic Benefit** Spatial vs temporal

2/13/12
5
Laboratory for Manufacturing and Sustainability © 2012 Slide 9 /53
One more! BASF SEEbalance
Lecture 8
Source: www.prosa.org/fileadmin/user.../SEE_Balance_Kicherer_BASF.ppt and http://www.basf.com/group/corporate/en/sustainability/eco-efficiency-analysis/seebalance
BASF SEEbalance®
Laboratory for Manufacturing and Sustainability © 2012 Slide 10 /53
Dimensions of impact and influence – one more!
Lecture 8
Source: www.prosa.org/fileadmin/user.../SEE_Balance_Kicherer_BASF.ppt and http://www.basf.com/group/corporate/en/sustainability/eco-efficiency-analysis/seebalance
BASF SEEbalance®
3-d version of Eco-care matrix

2/13/12
6
Laboratory for Manufacturing and Sustainability © 2012 Class 2
The product life-cycle
11 Source: Ashby, et al, “The CES Eco-selector - background reading,” Univ. of Cambridge White Paper, Feb. 2005.
Laboratory for Manufacturing and Sustainability © 2012 Class 2
How do things get made?
Process1 Process2 Process3 ProcessN …
• Macro planning • Micro planning
• Precedence • Availability • Balance • Yield
• BOM • Tasks
Detailed decisions
Lecture 8

2/13/12
7
Laboratory for Manufacturing and Sustainability © 2012 Class 2
Material problems for starters…
Source: http://www.activedisassembly.com/guidelines/ADR_050202_DFD-guidelines.pdf
Lecture 8
Rule of Thumb:
You want to take the shortest path for material recycling
Laboratory for Manufacturing and Sustainability © 2012 Class 2
Sustainable design
Source: The Designer’s Field Guide to Sustainability, 2011, www.lunar.com
Design guides usually:
• Propose a methodology • Offer examples/do’s/don’ts • Ask questions
Example – Designer’s Field Guide
What is it trying to accomplish? How is it brought to life? How is it used? Where does it end up?
2/13/12
8
Laboratory for Manufacturing and Sustainability © 2012 Slide 15 /53
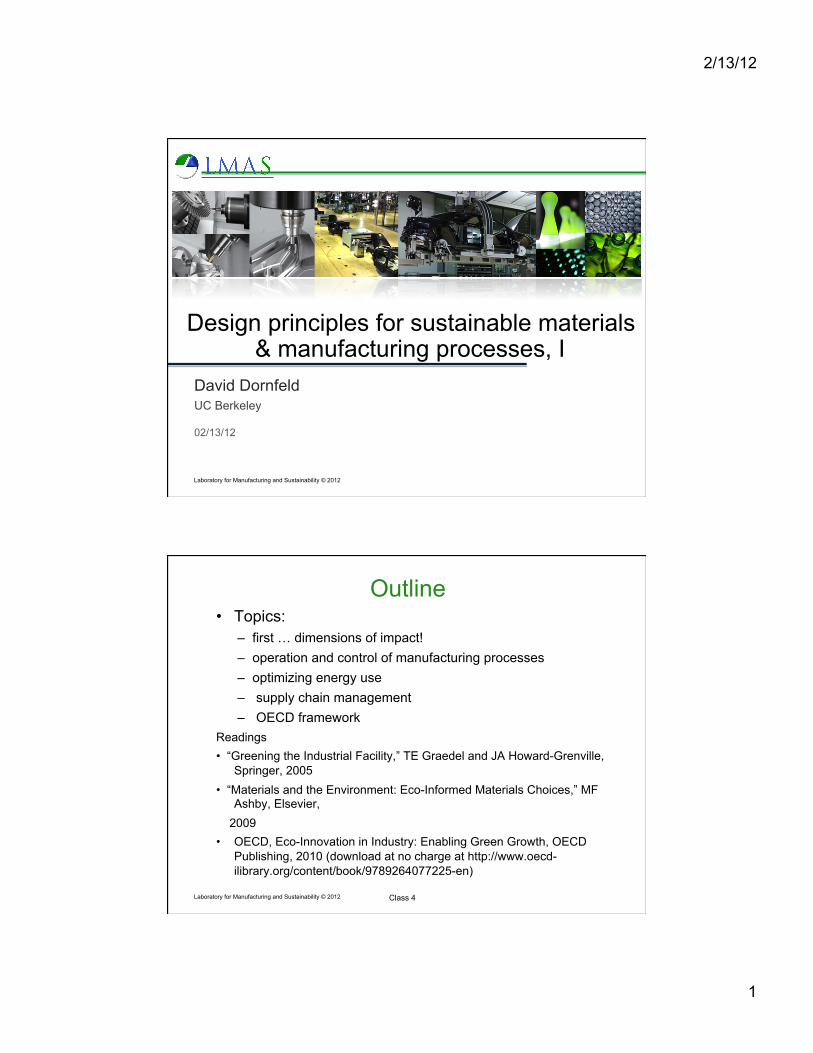
■ Design for Short Time to market ■ Design for reliability ■ Design For Test ■ Design for safety ■ Design for quality ■ Design Against Corrosion Damage ■ Design for Minimum Risk ■ Design to cost ■ Design to standards ■ Design for assembly ■ Design for manufacturability ■ Design for logistics ■ Design for Electronic Assemblies ■ Design for Low-Quantity Production ■ Design for user-Friendliness ■ Design for Ergonomics ■ Design for Aesthetics ■ Design for Serviceability ■ Design for Maintainability ■ Design for Environment ■ Design for Sustainability ■ Design for Reuse ■ Design for Remanufacturing ■ Design for Recycling ■ Design for Disassembly
Lists and more lists … DfX
Lecture 8
Usually centered on the stage of life – design, production, distribution, use, disposal, re-use…
Laboratory for Manufacturing and Sustainability © 2012
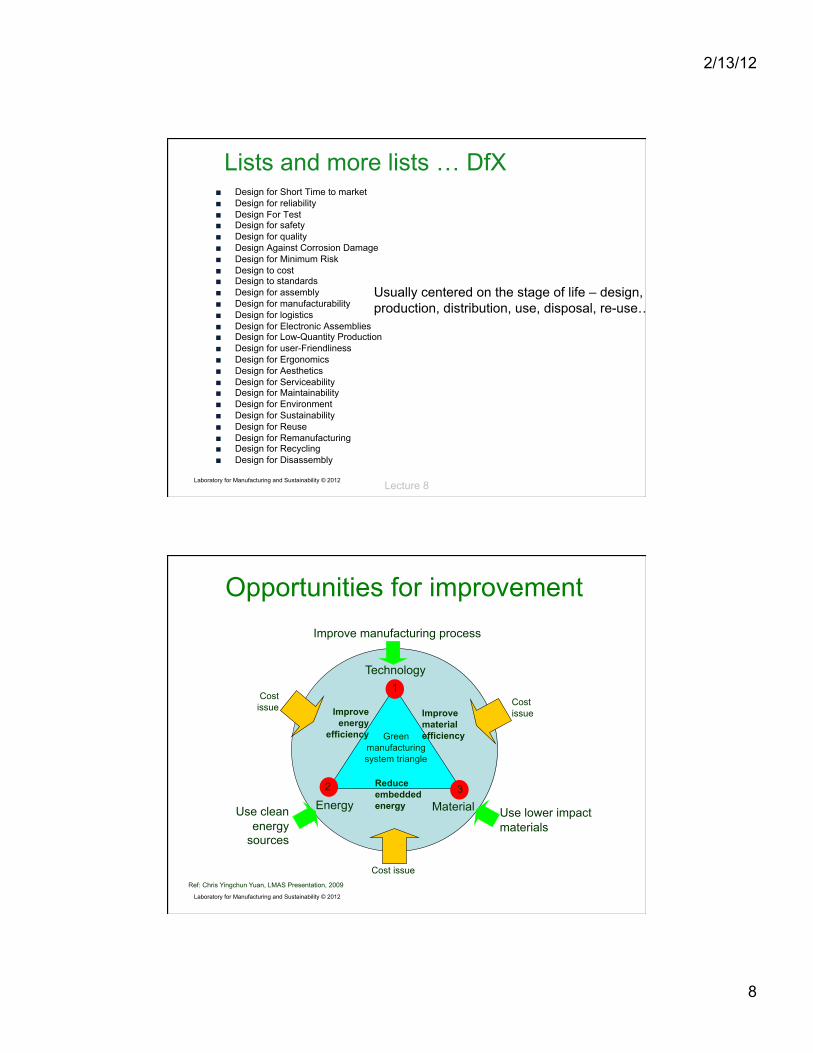
Opportunities for improvement
Technology
Material Energy
Green manufacturing system triangle
Improve energy
efficiency
Improve material efficiency
Reduce embedded energy
Improve manufacturing process
Use lower impact materials
Use clean energy
sources
Cost issue
Cost issue
Cost issue
1
2 3
Ref: Chris Yingchun Yuan, LMAS Presentation, 2009

2/13/12
9
Laboratory for Manufacturing and Sustainability © 2012 Class 2
www.remmele.com/flash/contractManu/pca.html www.caranddriver.com/features/7207/virtual-tour-of-vws-transparent-factory.html
And across
the supply c
hain…
Effects at different scales Enterprise
Process
Tooling/setup
Machine
Line/system
Facility
Laboratory for Manufacturing and Sustainability © 2012
The “drivers” Manufacturing - plant/HVAC - cafeteria, HR,
mgmt - packaging - shipping - other waste
Processes & Systems - energy - water - materials - consumables - compressed
air - other waste
Machinery & Tooling - design - setup - operation - maintenance - other waste
Repeat
Across the supply chain
Customer
Gov’t/Regs
Society
Competitor

2/13/12
10
Laboratory for Manufacturing and Sustainability © 2012 Class 2
Social - Quality of Life - Pay Rates - Working Conditions - Health Care
Economic - Part Quality - Resource Availability - Lead Times & Inventory - Risk
Environmental - Electricity Mix - Resource Availability - Electricity Demand - Emissions Fate - Regulations
TRANSPORTATION SUPPLIER - Location Economic
- Accessibility - Availability - Lead Times - Risk
Environmental - Emissions - Resource Use - Distance
Supply chain considerations
Laboratory for Manufacturing and Sustainability © 2012
Supply Chain Impacts (Depends on the product/process!)
Materials Energy Water GHG
Impa
ct/C
onsu
mpt
ion
Big variation depending on mfg supply chain(s)
Reductions if recycling/reuse
“upstream” impact
2/13/12
11
Laboratory for Manufacturing and Sustainability © 2012 Class 2
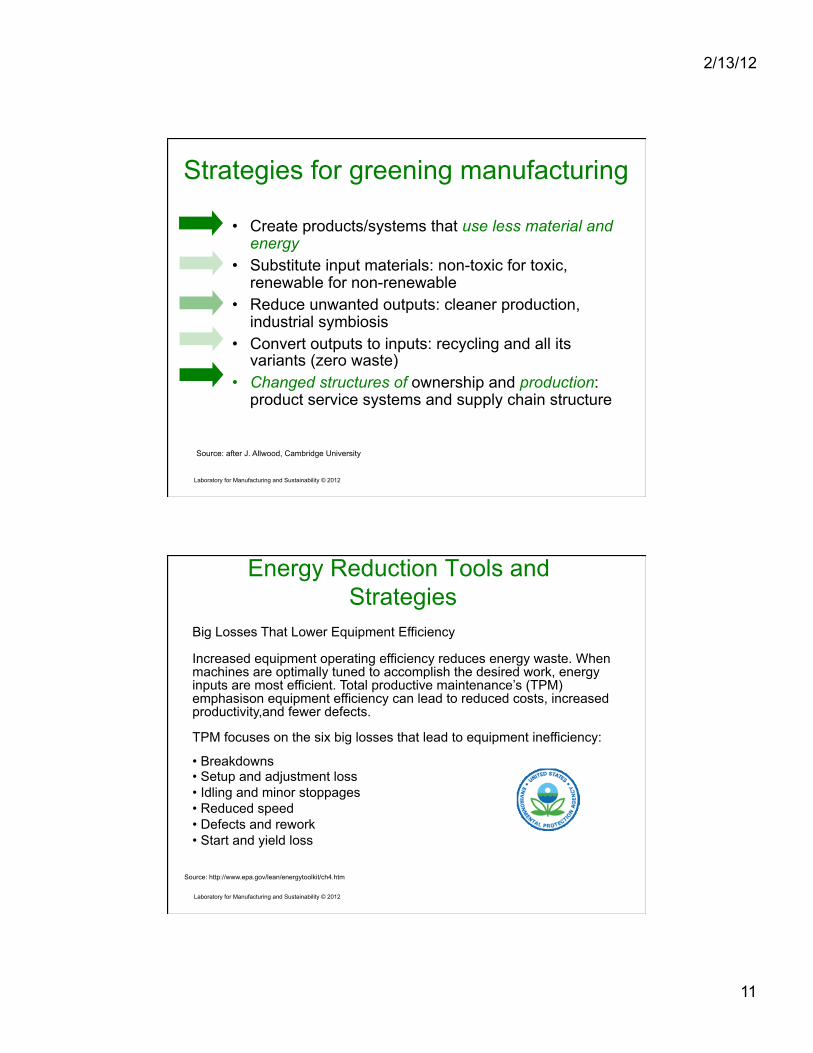
Strategies for greening manufacturing
• Create products/systems that use less material and energy
• Substitute input materials: non-toxic for toxic, renewable for non-renewable
• Reduce unwanted outputs: cleaner production, industrial symbiosis
• Convert outputs to inputs: recycling and all its variants (zero waste)
• Changed structures of ownership and production: product service systems and supply chain structure
Source: after J. Allwood, Cambridge University
Laboratory for Manufacturing and Sustainability © 2012 Class 2
Energy Reduction Tools and Strategies
Big Losses That Lower Equipment Efficiency
Increased equipment operating efficiency reduces energy waste. When machines are optimally tuned to accomplish the desired work, energy inputs are most efficient. Total productive maintenance’s (TPM) emphasison equipment efficiency can lead to reduced costs, increased productivity,and fewer defects.
TPM focuses on the six big losses that lead to equipment inefficiency:
• Breakdowns • Setup and adjustment loss • Idling and minor stoppages • Reduced speed • Defects and rework • Start and yield loss
Source: http://www.epa.gov/lean/energytoolkit/ch4.htm

2/13/12
12
Laboratory for Manufacturing and Sustainability © 2012
Embedded
Process
Machine Tare
Embedded Embedded
Process or
Machine
Process or
Machine
In In Out Out
Time Time
Ene
rgy
Ene
rgy
Machine or process “tare” consumption
Machine or process “tare” consumption
Production/ operation
consumption
Pro
duct
ion/
oper
atio
n co
nsum
ptio
n
ET
ET
EP EP
Energy use in manufacturing
Energy modes
Laboratory for Manufacturing and Sustainability © 2012
Energy reduction strategies
Operation (with process)
Operation (w/o process)
Embedded (no operation)
EP >> ET EP << ET
EP >> ET EP << ET EP ~ ET
Highest MRR Shortest tc
Power/unit product? or Power/unit time?
Optimize process (tooling, path, f, v)
Highest MRR or Optimize process
Idle/sleep or Reduce tare
Reduce tare? Idle/sleep or Reduce tare
Reduce embedded energy: material, fabrication, transport and installation, maintenance, removal and recycle/reman
Mod
e
Embedded Embedded
Time Time
Ene
rgy
Ene
rgy
Machine or process “tare” consumption
Machine or process “tare” consumption
Production/ operation
consumption
Pro
duct
ion/
oper
atio
n co
nsum
ptio
n ET
ET
EP EP

2/13/12
13
Laboratory for Manufacturing and Sustainability © 2012
60% of electricity consumption is coolant-related.
in automotive parts machining systems
Components of electricity consumption
Source: M. Mori, EERE Presentation, CIRP, Pisa, 2010
Laboratory for Manufacturing and Sustainability © 2012
• Backlight of in-machine lighting and display hibernates when machine is idle
• Power of spindle, servo motor, cutting oil, and chip conveyor shuts off, when machine is idle
• Power state resumes on keyboard input
Automatic power off
Illumination
Spindle
Servo drive
Coolant Chip conveyor
Source: M. Mori, EERE Presentation, CIRP, Pisa, 2010

2/13/12
14
Laboratory for Manufacturing and Sustainability © 2012 Class 2
Use matrix for manufacturing
What if we looked at manufacturing in the same manner...that is a “use matrix of manufacturing classes”?
High load factor Modest load factor Low load factor
Primary power-consuming
Secondary power-consuming
Non power-consuming
Energy intensive
Material intensive
High impact Low impact
How would this look for manufacturing?
Laboratory for Manufacturing and Sustainability © 2012 Class 2
Ashby- matrix for energy/impact

2/13/12
15
Laboratory for Manufacturing and Sustainability © 2012 Class 2
Draft use matrix for manufacturing
Energy intensive
Material intensive
High impact Low impact
High load factor Modest load factor Low load factor
Primary power-consuming
Process energy: furnaces, rolling mills (electric motors), smelting, refining ore, semiconductor mfg
Process energy: machine tools, inj. mold presses, server farm (electric motors), welding
Process energy: converting machinery, conveyors, ASR(electric motors), food processing
Secondary power-consuming
Hi tech factory heat + a/c, light, compressed air, de-i water, etc., traditional farming
Service center (server) with HVAC, sewing
Warehouse, office, service center (non server), non-organic farming, recycling ctrs.
Non power-consuming Buildings, foundations (incl. machine tool), logging
Furniture, workstations, tooling (drills, mills), hand crafts
Landscaping, composting
Laboratory for Manufacturing and Sustainability © 2012 Class 2
High load factor Modest load factor Low load factor
Primary power-consuming
Process energy: furnaces, rolling mills (electric motors)
Process energy: machine tools, inj. mold presses, server farm (electric motors)
Process energy: converting machinery, conveyors, ASR(electric motors)
Secondary power-consuming
Hi tech factory heat + a/c, light, compressed air, de-i water,etc.
Service center (server) with HVAC
Warehouse, office, service center (non server)
Non power-consuming
Buildings, foundations
Furniture, workstations
Landscaping
Back to the matrix
Energy intensive
Material intensive
High impact Low impact
Consider: material production manufacture use disposal

2/13/12
16
Laboratory for Manufacturing and Sustainability © 2012 Class 2
Example: 1500 ton Verson
CAPACITY..............................: 1500 TONS"(CENTER CYL 900 TONS @ 2,500 PSI"2 x OUTER CYLS 600 TONS @ 2,500 PSI)"BED (RL/FB)...........................: 144" x 96""STROKE................................: 48""ADJUSTMENT............................:"SHUT HEIGHT...........................: 32""KNOCKOUT CAP..........................: 100 TONS @ 2,500 PSI"KNOCKOUT STROKE.......................: 36""KNOCKOUT EJECTION SPEED...............: 318 IPM"PRESSING SPEED........................: 62.5 IPM"FAST ADVANCE SPEED....................: 632 IPM"FAST RETURN SPEED.....................: 550 IPM"CUSHIONS CAP..........................: 200 TON"CUSHIONS STROKE.......................: 24""
EQUIPPED WITH:"
200 HP MOTOR & CONTROLS"4 POINT EJECTOR SYSTEM"
Laboratory for Manufacturing and Sustainability © 2012 Class 2
Press design What do we design for?
- tonnage (pressure/power) - stiffness - speed/strokes per minute - ease of load/unload - die changing/handling/setup
And, don’t forget other efficiencies/savings: • Breakdowns • Setup and adjustment loss • Idling and minor stoppages • Reduced speed • Defects and rework • Start and yield loss

2/13/12
17
Laboratory for Manufacturing and Sustainability © 2012 Class 2
But it moves ... a lot!
so material density matters also...
Laboratory for Manufacturing and Sustainability © 2012 Class 2
Tradeoffs
What is best for the press?

2/13/12
18
Laboratory for Manufacturing and Sustainability © 2012
Production Planning
Source: Machsources.com; accessed 3/2011
GWP
Waste
Water use
Energy use
Investment cost
Operating cost Quality Efficiency
Laboratory for Manufacturing and Sustainability © 2012
■ Assess resource consumption for multi-station operations using life cycle assessment methodology
■ Develop/apply tool to provide decision support for manufacturing process and process chain selection
■ This tool can be used to better understand resource consumption and environmental and financial impacts of manufacturing process chains used to make a product
Goals & Approach
Energy use Water use Waste

2/13/12
19
Laboratory for Manufacturing and Sustainability © 2012
Process Analysis
other
material
energy
water
product
waste
other
water
Process A
Process B
Process C Product Raw
Material
■ Each manufacturing process of the process chain must be analyzed individually
■ For each process multiple inputs and outputs need to be assessed
Source: Institute for Machine tools and Industrial Management (G. Reinhart, S. Reinhardt)
Laboratory for Manufacturing and Sustainability © 2012
■ Associated impacts ■ Operating Cost ■ GWP
■ LCA tools (e.g. GaBi, Umberto, etc. can assist)
Impact Analysis
Process Chain 1
Process Chain 2
Product

2/13/12
20
Laboratory for Manufacturing and Sustainability © 2012
■ Comparing different manufacturing processes and process chains can be used to inform trade-off decisions that influence operating costs, resource consumption, and impacts on the environment.
■ These comparisons could also inform additional production decisions including: ■ Production location ■ Production floor and line layout ■ Future factory planning
■ Production location considerations ■ Local cost of resources (energy, water, etc.) ■ Carbon intensity of energy mix at production location
Decision Making
This requires link to CAD/CAM tools
Laboratory for Manufacturing and Sustainability © 2012 40
OECD Toolkit
Source: OECD, Eco-Innovation in Industry: Enabling Green Growth, OECD Publishing, 2010 (http://www.oecd-ilibrary.org/content/book/9789264077225-en)

2/13/12
21
Laboratory for Manufacturing and Sustainability © 2012
OECD Sustainable Manufacturing
Laboratory for Manufacturing and Sustainability © 2012
OECD Methodology
And see http://green-manufacturing.blogspot.com/2011/10/tools-of-trade-part-1.html, and parts 2, 3 for discussion of OECD Toolkit

2/13/12
22
Laboratory for Manufacturing and Sustainability © 2012 43
Mapping Example
Laboratory for Manufacturing and Sustainability © 2012 44
Assessing impacts

2/13/12
23
Laboratory for Manufacturing and Sustainability © 2012 45
Issue priority matrix
Laboratory for Manufacturing and Sustainability © 2012 46
Normalization factors
Then consider ROI!

2/13/12
24
Laboratory for Manufacturing and Sustainability © 2012 47
Backup Slides
Laboratory for Manufacturing and Sustainability © 2012 Class 2
Leveraging
Source: Georg Fischer, “Competence Brochure – Move more with lightness,” http://www.automotive.georgfischer.com/docs/content1.aspx?id=23976, Accessed 2 October 2011.
What if it seems that manufacturing doesn’t really matter in the long run?!
For example … little impact over product life cycle

2/13/12
25
Laboratory for Manufacturing and Sustainability © 2012
Recall: Use vs Manufacturing Impacts
What if you are here?
Laboratory for Manufacturing and Sustainability © 2012
Impact- Manufacturing vs Use
Source: Volkswagen AG, and Harald Florin, PE Europe/IKP-University of Stuttgart, Germany
Manufacturing phase energy requirements for VW Golf A3 Automobile (circa late 1990’s)
machining
2/13/12
26
Laboratory for Manufacturing and Sustainability © 2012
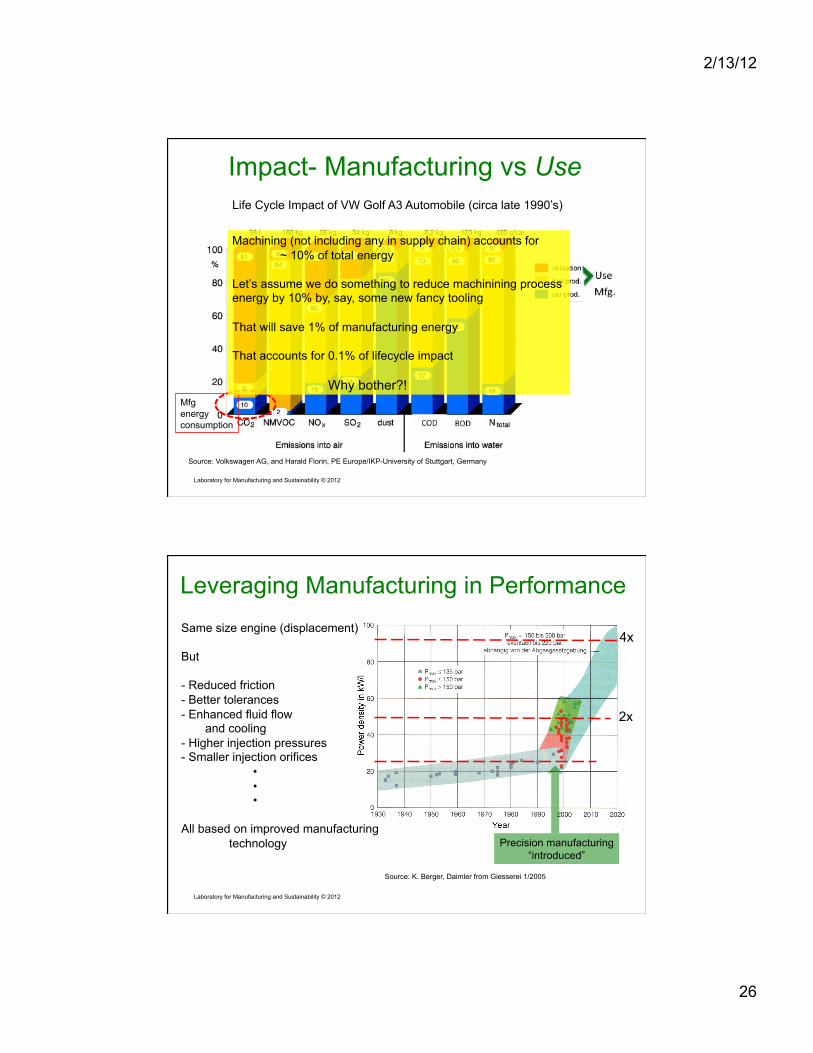
Impact- Manufacturing vs Use
Source: Volkswagen AG, and Harald Florin, PE Europe/IKP-University of Stuttgart, Germany
Life Cycle Impact of VW Golf A3 Automobile (circa late 1990’s)
Mfg energy consumption
Machining (not including any in supply chain) accounts for ~ 10% of total energy
Let’s assume we do something to reduce machinining process energy by 10% by, say, some new fancy tooling
That will save 1% of manufacturing energy
That accounts for 0.1% of lifecycle impact
Why bother?!
Laboratory for Manufacturing and Sustainability © 2012
Leveraging Manufacturing in Performance
Source: K. Berger, Daimler from Giesserei 1/2005
2x
4x
Precision manufacturing “introduced”
Same size engine (displacement)
But
- Reduced friction - Better tolerances - Enhanced fluid flow
and cooling - Higher injection pressures - Smaller injection orifices
• • •
All based on improved manufacturing technology

2/13/12
27
Laboratory for Manufacturing and Sustainability © 2012
Leveraging Manufacturing Mfg process or
System improvement
Product life cycle impact improvement
air pollution reduction
manufacturing improvement
product performance improvement
fuel savings
water use/ pollution reduction
CO2/GHG reduction
this
gets us this!