Embed Size (px)
DESCRIPTION
Design Process. Understand the Problem Develop the underlying issues, constraints (i.e. cost, standards, patents, user needs, physical properties, chemical reactions, ..) - PowerPoint PPT Presentation
Citation preview
Design Process
• Understand the Problem– Develop the underlying issues, constraints (i.e. cost, standards,
patents, user needs, physical properties, chemical reactions, ..)– What is the big picture? – How does the project/process fit in to
the business , social, marketing, strategy of the company and society?
• Generate Alternatives– Employ the action of using synthesis and apply engineering
science – Document with standard engineering documents
• Analyze the Alternatives and choose the best one– Use decision making tools
• Prepare final design and recommendations– Knowing your audience and their needs, presenting the facts
and making a recommendation

An Example
• A local construction company is creating a large pit that keeps filling up with water whenever it rains. This is delaying excavation and construction. Provide a solution.

Understand The Problem
• What’s the issue here?– Water filling a hole, or– The water becoming contaminated and
affecting the health of the workers, or– The cost of construction, or– The schedule delays of construction
impacting the availability and costs of cranes and material being delivered to site, or…
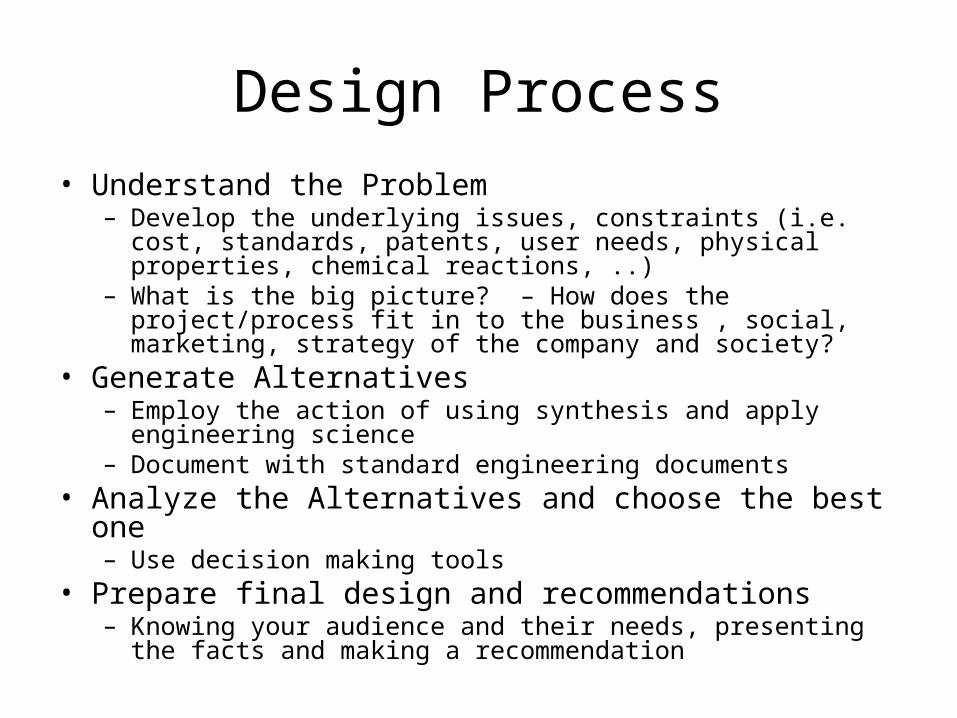
Understand The Problem• Constraints
– Cost– Where can we send the water (environ standards, city municipal
standards)– How long do we have to provide a workable solution
• Design issues– How long do we allow to pump the hole out? – What pump capacity do we need?– How will they be powered?– How much water can we leave behind?– Do we need a spare in case the pump breaks down?
• Background research– Talk to construction company – needs, power, portability (weight,
wheels, ..)– What don’t we know about pumps to provide a workable solution?
• How much time do we have to provide a solution (to what problem?) and how much money is available for the solution?
Background Research
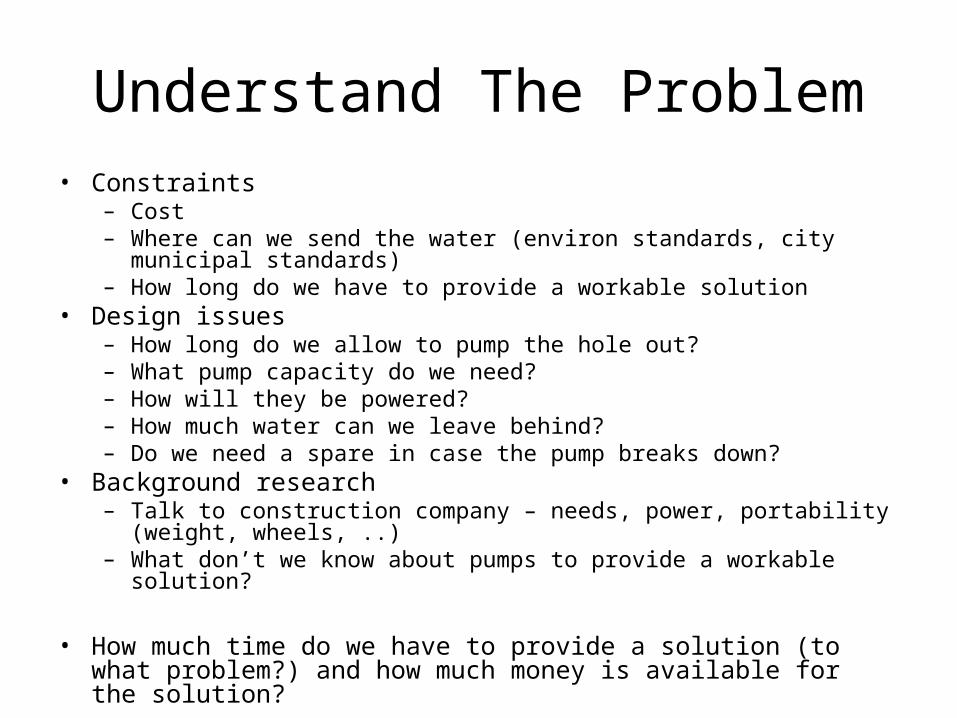
• Design Research / Assumptions :– rainfall is 60 mm / day –
state basis of this• (Link) to weather office
– Drainage basin is:• 200m x 100m
– Volume = 1200 m3– Pump in 1 hr to limit
construction delays
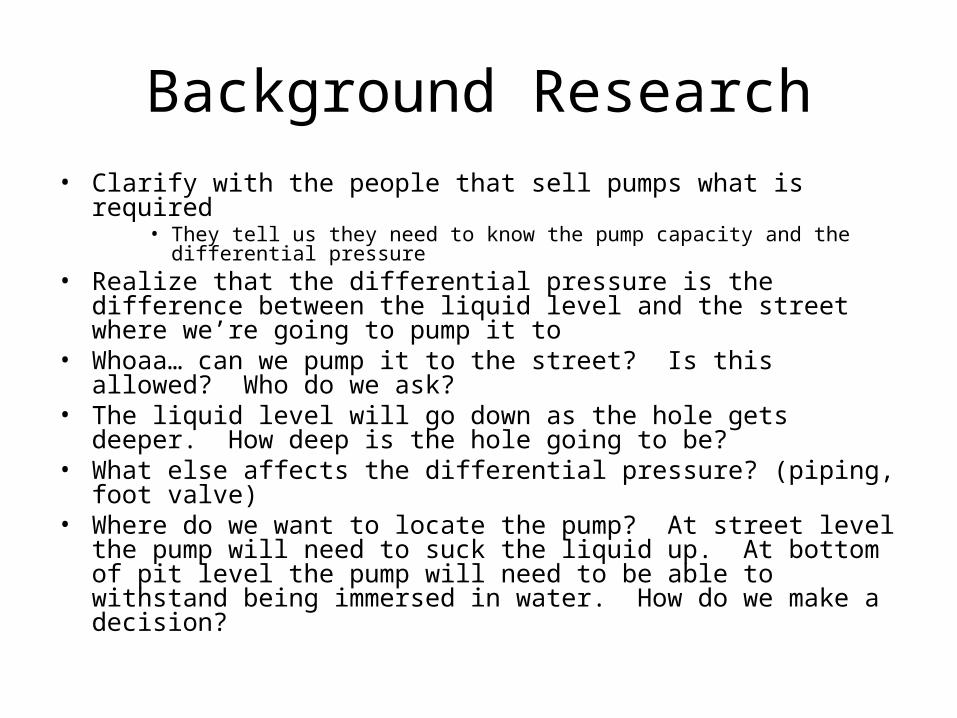
Background Research• Clarify with the people that sell pumps what is required
• They tell us they need to know the pump capacity and the differential pressure
• Realize that the differential pressure is the difference between the liquid level and the street where we’re going to pump it to
• Whoaa… can we pump it to the street? Is this allowed? Who do we ask?
• The liquid level will go down as the hole gets deeper. How deep is the hole going to be?
• What else affects the differential pressure? (piping, foot valve)• Where do we want to locate the pump? At street level the pump will
need to suck the liquid up. At bottom of pit level the pump will need to be able to withstand being immersed in water. How do we make a decision?

Generate Alternatives
• Back to problem statement…– Prevent delays in construction– Alternatives:
• Do nothing – accept the delays• Put a dome over the area• Call a pump rental company whenever we need it
to be pumped out• Design a stationary pump system• Design a portable pump system

Options
• Fishbone Diagram
portable pump system
stationary pump system
Do nothing – accept the delays
Put a dome over the area
Call a pump rental company whenever we need it to be pumped out

Decision Making
• Create a decision making matrix
• Weighted Evaluation MatrixPros / Cons / Costs
Design OptionsWeighted Evaluation Matrix
Weight Option A Option B Option Anone buy rent
Meets all standardscapital costnumber of uses per yearcost per rental useoperating cost (1 year)capital + Op costRating based on Cap+Op 30capacity, m3/hr 10Availability (schedule) 20physical size 10reliability 10need for spare 10elec (1), gas (5) 5maintainable 5
total 100

Process Industry Decisions
• Meets all applicable standards• Safe to Operate• Performs the necessary function• Minimal / Acceptable environmental
impact• Reliable• Cost (Initial and operating)• Meets Schedule Requirements

Design Detail
• Upon knowledge of how you will evaluate the various options now you can begin generating the data required– Engineering calculations– Cost estimates – Equipment quotes– …

Design Documentation
• Option 2 - Design our own pump system– Make a Process Flow Diagram & Material
balance
Pit
City SewerPump
2
1Stream
properties 1 2
Phase L LPressure, kPa (abs) 101 101Temperature, deg C 0 0Flow, m3/hr 1200 1200
PropertiesDensity, kg/m3 998 998Viscosity, cP 1 1

PFD with Controls
Pit
City Sewer
Pump
FC
PFDConstruction Site
Pit Pump
By: D. ModyDate: Sept /08


PFD with Controls

Piping & Instrumentation Diagramaka P&ID
From Pit
City SewerPump
M
HS
Line dia = ? “
Line dia = ? “
----Concept Sketch----
• Thoughts:• - Most pumps have some sort of a shut off when there is no feed (this
prevents overheating and/or damaging the pump)• A lot of pumps have some sort of control on the flow rate. Do we need
something too?– Is it possible to pump water in the sewer so fast that the sewer can’t take it away
(flood someone’s basement)– Preliminary Safety Analysis - Are there other ‘hazards’ we might be causing?

P&ID
Pit
City Sewer
Pump
M
HS
Line dia = ? “
Line dia = ? “
LSL
LSH
I
FIT100
FIC100
FV100
P&IDConstruction Site
Pit Pump
By: D. ModyDate: Sept /08

Other Design Documents
• Pump Data Sheet– Provides a summary of the performance requirements
& the essential mechanical details – • Used as a central document for purchasing the pump
– Requires that we state the pump differential pressure• Thus begins … Engineering Calculations
– To determine the pump pressure differential we must first determine the piping line losses.
– This requires we know the length of lines, elevations and any fittings
• or make assumptions based on engineering judgment

CENTRIFUGAL PUMP RDS-001R-001 DATA SHEET Rev. 1, Dec. 1994
Page 1 of 5
Package No. Doc. No. Rev.
Tag No. Location/Module
Unit No. req'd
Service Inquiry No.
Size & Type Quote No.
Supplier P.O. No.
Manufacturer Job No.
Model Serial No.
1 Motor provided by
2 Motor mounted by
3 No. of turbines required
4 Turbine item no.
5 No. of stages Turbine provided by
6 No. of motors required Turbine mounted by
7 Motor item no. Remarks:
8 Notes: O indicates information to be completed by Purchaser. o indicates information to be completed by Manufacturer.
9
10 OPERATING CONDITIONS (to be completed by purchaser)
11 Liquid
12 Pumping temperature (°C) PT
13 Normal Maximum Minimum
14 Specific gravity @ PT Rated Maximum Minimum Normal
15 Vapor pressure @ PT (bar)
16 Viscosity @ PT
17
18 Site temperature (°C) :
19 Normal Maximum Minimum
20 Electrical area hazard:
21 Zone Temp. class
22 Unusual conditions Location O Indoor O With Roof O Heated
23 O Outdoor O Without Roof O Unheated
24 Corrosion/erosion caused by Remark:
25
26 PERFORMANCE (to be completed by manufacturer)
27 Proposal curve No. Minimum continuous flow (m3/h)
28 Speed (rpm) Thermal Stable
29 NPSH required (m MLC). Driver rating (kW)
30 3 % Head drop at rated flow Shaft thrust (kN) Max.
31 Rated power (kW)
32 Maximum kW with rated impeller Rotation (viewed from coupling end): O CW O CCW
33 Maximum head with rated impeller (m) Suction specific speed
34 Max. continuous flow m3/h Efficiency (%) at rated flow
35 NOTES:
36
37
38
39
40
41
Differential Head @ Flow (barg)
NPSH @ Flow (m)
Hydraulic Power @ Flow (kW)
Differential P @ Flow (barg)
Discharge P @ Flow (barg)
Flow @ PT (m3/h)

Calculations
• To determine the pipe (or flex hose) pressure drop we first size the lines using a heuristic. – Our table of flow vs piping pressure drop heuristics
indicates that should be using about a 18” diameter line.
• This seems excessive. Rethink plan to let the liquid build up over a day
• run the pump whenever it rains. It only has to handle the normal rain rate.
– 60 mm/ 24 hours = 2.5 mm /hr = 50 m3/hr– We only need 4” diameter pipe
• Now ask yourself is this reasonable? What assumptions are you making and would these always be right? How likely/often would you be wrong? What are the implications of being wrong?

Preliminary Line Sizing
• We decide on the 4” pipe and we find the pressure drop is 1.2 psi/100 ft for pipe
• We now need to know how long the piping is. For the more accurate calculation we need a ‘plan’ and ‘elevation’ drawing. For an initial assessment (i.e. we’re tossing around lots of options and we just need a comparison number) we can make an assumption by reviewing the site plan.

20 ft
50 ft
25 ft
75 ft
200 ft
15 ft
Elev Dwg
25 ft
2 ft
Plan and Elevation Drawings
Plan Dwg
Construction Site Pit Pump
Construction Site Pit PumpWater Surface
Ground

Pump Calculations• To Determine the Pump differential Pressure, subtract
the pump discharge pressure from the pump suction pressure
• Pump discharge pressure = destination pressure + line & fitting losses + (or -) static head (elevation) losses– Disch Press = 0 psig + 367 ft * 1.2psi/100 ft * 4 (account for pipe
fittings) – 2 ft = 16.7 psig
• Suction pressure = 0 psig - 27 ft * 4 * 1.2psi/100 – 25 ft * 0.43352 psi/ft = -12.1 psig
• Pump differential pressure is:DP = 16.7 psig – (-12.1 psig) = 28.9 psiDP = 28.9 / 0.43352 psi/ft = 67 ft of liquid head

Calculations
Horsepower = GPM * DP (psi) / 1714 / efficiency
HP = (50 m3/hr *4.4 GPM/ m3/hr) * 15.5 psi / 1714 / 50%
Motor HP = 7.4 hp

Documentation – Pump Data Sheet
We can now start to fill in our equipment data sheet and send it out for quotes to our pump vendors.
Package No. Doc. No. Rev.
Tag No. Location/Module
Unit No. req'd
Service Construction Pit Water Pump Inquiry No.
Size & Type Quote No.
Supplier P.O. No.
Manufacturer Job No.
Model Serial No.
1 Motor provided by
2 Motor mounted by
3 No. of turbines required
4 Turbine item no.
5 No. of stages Turbine provided by
6 No. of motors required Turbine mounted by
7 Motor item no. Remarks:
8 Notes: O indicates information to be completed by Purchaser. o indicates information to be completed by Manufacturer.
9
10 OPERATING CONDITIONS (to be completed by purchaser)
11 Liquid Water
12 Pumping temperature (°C) PT
13 Normal Maximum Minimum 20 / 28 / 0
14 Specific gravity @ PT 1 Design Rated Minimum Normal
15 Vapor pressure @ PT (bar) 0.0172 317 270 225
16 Viscosity @ PT 1 Cp 38.4
17 -11.5
18 Site temperature (°C) : 50
19 Normal Maximum Minimum20/ 28/ 0 115
20 Electrical area hazard: 18.5
21 Zone Temp. class 13.3
22 Unusual conditions Location O Indoor O With Roof O Heated
23 X Outdoor X Without Roof X Unheated
24 Corrosion/erosion caused by Remark:
25 fluid may contain gravel & other foreign material
26 PERFORMANCE (to be completed by manufacturer)
27 Proposal curve No. Minimum continuous flow (m3/h)
28 Speed (rpm) Thermal Stable
29 NPSH required (m MLC). Driver rating (kW)
30 3 % Head drop at rated flow Shaft thrust (kN) Max.
31 Rated power (kW)
32 Maximum kW with rated impeller Rotation (viewed from coupling end): O CW O CCW
33 Maximum head with rated impeller (m) Suction specific speed
34 Max. continuous flow m3/h Efficiency (%) at rated flow
35 NOTES:
36
37
38
39
40
41
Differential Press @ Flow psiDifferential Head @ Flow ( ft)
NPSH @ Flow (ft)
Hydraulic Power @ Flow (hp)
Differential P @ Flow (psig)
Discharge P @ Flow (psig)
Flow @ PT (usgpm)
Whew.. Is that it?
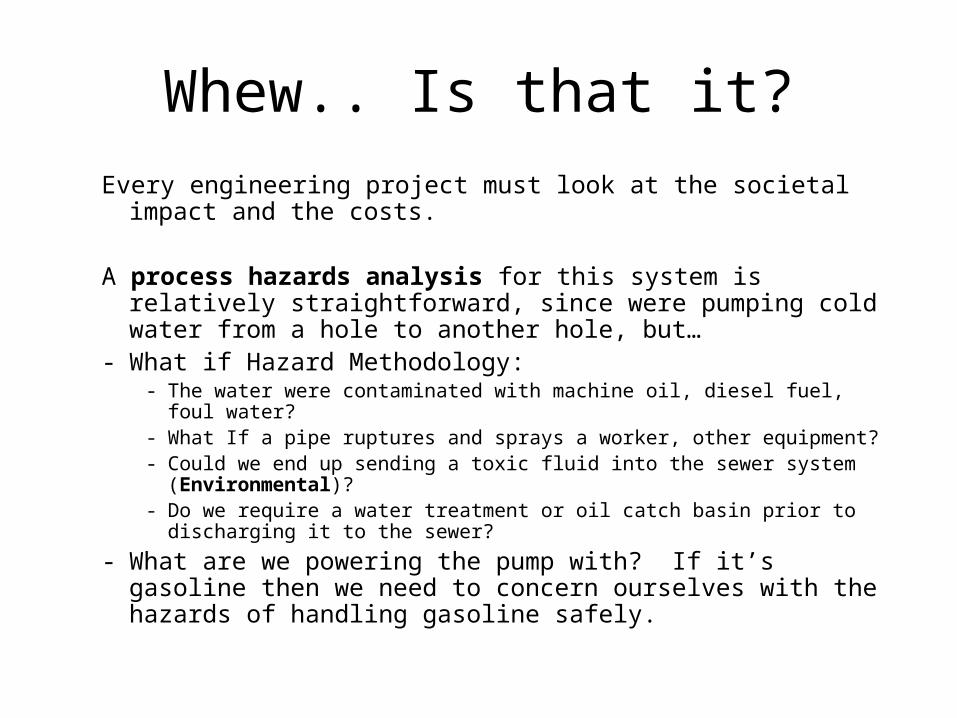
Every engineering project must look at the societal impact and the costs.
A process hazards analysis for this system is relatively straightforward, since were pumping cold water from a hole to another hole, but…
- What if Hazard Methodology:- The water were contaminated with machine oil, diesel fuel, foul water? - What If a pipe ruptures and sprays a worker, other equipment? - Could we end up sending a toxic fluid into the sewer system
(Environmental)? - Do we require a water treatment or oil catch basin prior to discharging it to
the sewer?
- What are we powering the pump with? If it’s gasoline then we need to concern ourselves with the hazards of handling gasoline safely.

Process Economics
• Often we look at the cost of goods sold minus the cost to produce the goods (and include the equipment costs)
• In this case we’re not really selling or buying anything, but we might have the option to rent or buy the unit
Weight Option A Option B Option Anone buy rent
Meets all standards no yes yescapital cost 0 $40K $0number of uses per year 10 10cost per rental use $5Koperating cost (1 year) 0 $2K 50$ capital + Op cost 50 $42K $50Kcap + op - rating 50 40
C

Risk Analysis
• Notice there is some risk in our economics, depending on whether we use the pump more or less the rent/buy decision is affected.
• A risk analysis of the economics is usually a good idea.
• Ultimately a recommendation/decision needs to be made

Decision Making
• Overall Decision making
• And.. We make a recommendation to buy
Design OptionsWeighted Evaluation Matrix
Weight Option A Option B Option Cnone buy rent
Meets all standards no yes yescapital cost 0 $40K $0number of uses per year 10 12cost per rental use $5Koperating cost (1 year) 0 $2K 60$ capital + Op cost $42K $50KRating based on Cap+Op 30 50 40capacity, m3/hr 10 0 2500 2000Availability (schedule) 20 20 10physical size 10 5 5reliability 10 10 1need for spare 10 5 10elec (1), gas (5) 5 1 5maintainable 5 3 5
total 100 94 76
The END!