Embed Size (px)
Citation preview

92
Design Process of a Sandy Convex Shaped Beach Layout
S.Te Slaa1, 2*, G.J. Akkerman1, E.Bijl1, D.Bo3 and J.K.S. Goh3
1CDR International, Rijssen, The Netherlands
2Delft University of Technology, Delft, The Netherlands 3China Harbour Engineering Company LTD, Colombo, Sri Lanka
*E-mail: [email protected]
Abstract:The planned Colombo Port City (CPC) development, shown in Figure 1, comprises 450 acres of reclaimed land, 3 km of offshore breakwater, two additional breakwater revetments and a central canal. In its final
stage, the reclamation will be closed off by a sandy beach at the seaward side. This beach will be partly sheltered by
the offshore breakwater and lagoon in front of it. The beach layout is convex, implying that all beach angles are
offshore directed. This layout with respect to erodibility, poses multiple design complexities. These problems will
be tackled by a converging design approach, focusing on reduction of risks and increasing knowledge (from
measurements and modelling) at the one hand and a highly adaptable design at the other hand. This engineering
management approach is described in the present paper.
Sediment transport along the beach is influenced by the complex hydraulic climate in the lagoon area: the
combination of wave overtopping and transmission through the breakwater, waves diffracting around the
breakwater heads, local waves and residual currents. The anticipated sensitivity to beach erosion should not
negatively affect the development. Therefore, to quantify the beach stability, the hydraulic climate inside the breakwater has been assessed by numerical modelling to form a basis for the spatially distributed sediment transport
computations. To acquire a reliable translation from the offshore wave and current climate to the climate within the
lagoon area, extensive physical and numerical model studies have been performed.
The preliminary beach stability analysis indicates that mitigation measures will most probably be required. This
requirement, as well as assessment of the type of mitigation measures, is key to the adaptive engineering approach
that has been adopted here. The adaptive approach aims at arriving at a practical design for the beach to secure the
functional (public) requirements within economical (maintenance) and practical (constructability) boundaries. A
groyne scheme is a relative simple and adaptive way to stabilize an unstable beach, whilst providing flexibility as it
can be implemented in a phased way and be adapted rather simply when required. Along with the design, we
focused on optimization of the construction strategy and sustainable material usage.
The present paper presents the numerical analysis part of the iterative design process, which has not yet been
completed. As such, this paper is the launching paper regarding the CPC beach stability, providing a baseline for the
design, and will be followed up by further paper(s) at a later stage of the design and construction.
Keywords: Beach Protection, Colombo Port City, Convex layout, Erosion, Sediment transport.
1. Introduction
The Government of Sri Lanka together with the
Project Company has initiated the development of
a high- end urban development on newly reclaimed land near the port of Colombo: the Colombo Port
City (CPC) Project. CPC Project will be
constructed against the existing Colombo South Port in the North and against the Galle Face in the
East. The development comprises 450 acres of
reclaimed land, 3 km of offshore breakwater, two
additional breakwater revetments and a central canal. The primary protection of the development
is a semi-circular shaped offshore breakwater
which obtains a calm wave climate along the
reclaimed area to facilitate amongst others the construction of an ocean facing beach. Between the
offshore breakwater and the beach a 300m wide so
called “lagoon” will be created. The beach layout
is convex-shaped and serves as secondary protection for the development. In principle such a
beach layout is considered morphologically
unfavourable. However, due to the anticipated relatively mild wave and current conditions caused
by the sheltering effect of the offshore breakwater,
as well as by the expected large sediment grain size
on the beaches, the beach stability has been considered as potentially feasibly during the first
design stage.

93
Figure 1: Artist impression of Colombo Port City
This paper elaborates further on the anticipated
beach stability and the adopted engineering management cycle to arrive at a practical beach
design. The emphasis of the design is on
integration of functional and safety requirements. It
is the responsibility of the developer to combine these aspects within an integrated design, which
favors the development and the people of
Colombo. Due to the large number of uncertainties and functional requirements of the beach, the
engineering cycle is a highly iterative process.
The beach design has not yet been finalized and is still continuously subject to progressive insights
from increasing data and information on prevailing
hydraulic conditions. The complexity of the design of the convex-shaped beach demands the use of
state-of-the-art models and latest scientific view-
points and inputs. Therefore, this paper is the launching paper regarding the CPC beach stability,
providing a baseline for the design, and will be
followed up by further paper(s) at a later stage of
the design and construction.
2. Engineering design process
2.1 Requirements
One of the most recent designs of the CPC
development can be seen in Figure 2 with the
beach indicated in yellow. The beach area needs to
fulfil a number of functions:
- The beach is a major landscaping element in
the spatial city environment that connects the
water and urban environment.
- The beach is part of the land revetment,
minimizing wave overtopping and forming the
foundation for the retaining wall / staircase as
land revetment.
- The beach will facilitate leisure activities, such
as: strolling, sun-bathing, swimming, boating
and wind-surfing.
- The beach enhances an attractive water front
development (e.g. restaurants, beach
apartments, sites with attractions), and can be
equipped with an attractive boardwalk.
The convex-shaped beach layout as currently
designed, however, is also a highly challenging
element as regards the vulnerability for sand losses in the anticipated exposed situation with waves
coming from one predominant direction. Major
requirements, connected to the above functions are:
- The beach should sufficiently protect the land
revetment.
- The beach should facilitate leisure activities at
minimum risk.
- The beach in itself should be sufficiently
maintainable to fulfil its safety and recreational
functions at acceptable costs and efforts.
Protective function The beach should maintain a minimum width and
volume to fulfil its function as protection of the
land revetment to prevent overtopping of the revetment crest or flooding of the reclaimed land in
case of extreme events.

94
Figure 2: Layout design Colombo Port City with main beach indicated in yellow
Risk for people
People that are near or in the water at the beach zone should be safe at all times, as far as they
cannot be held responsible for their own safety. A
gentle and relative flat beach profile, to be
maintained over a sufficient area, will reduce the danger considerably. This also increases the safety
for swimmers.
Maintenance
The fully unprotected beach will experience cross-
shore and long-shore adaptation of the beach profile in order to naturally adjust to the prevailing
hydraulic conditions. The degree of protection by
the offshore breakwater and potential additional
beach stabilizing measures will determine the remaining morphological activity. Hence, the sand
volume fluxes should be considered carefully in
relation to the sand volume available within the beach area, to arrive at a feasible and acceptable
maintenance.
2.2 Integrated design Keeping the functional requirements as indicated
above in mind, the risk can mainly be expressed as
function of the anticipated morphological changes,
governed by the wave and current action in the
lagoon. A potentially feasible and flexible solution to improve the stability of the beach, if required, is
by means of a groyne system. For an optimized
design of the arrangement of the groyne system,
the morpho dynamics of the beach has to be known in detail. However, accurate prediction of the
morphological changes in the design stage is
highly challenging because of:
- Uncertainties in the wave transmission /
overtopping parameters of the offshore
breakwater.
- Uncertainties in the 3D hydraulic effects
within the lagoon.
- Uncertainties in the properties of the beach
sand.
- Lack of information and data on the beach
system, or similar systems.
For these reasons 2D and 3D physical modelling as well as numerical wave modelling studies are
performed to obtain more insight in the erosive and
wave propagation processes. This paper only
focusses on the numerical study on the sand stability, in a later stage results of the numerical

95
and physical modelling study will be combined to
obtain a clearer and broader picture of the occurring processes.
As a consequence, a flexible and dynamic design
approach is applied with ‘no regret’ measures where required and flexibility where allowed. A
basic idea is to let nature shape the beach first in
the different seasons during the construction period to obtain more (reliable) knowledge. Subsequently,
in order to meet the functional requirements best,
an optimum design can be obtained with the least amount of stabilizing measures. This approach may
be maintained until progressive insight proves
otherwise.
2.2 Uncertainties
Although a groyne field will significantly improve
the stability of the beach, uncertainties in spatial distribution of the erosion and sedimentation
patterns require intensified monitoring, even when
such a groyne field has been designed properly. The maintenance requirements of the beach are
dependent on the spatially and temporal distributed
sand loss volumes in time. Accurate assessment of
these losses will allow for an optimum beach maintenance program. Improving insight on the
behaviour of the beach system during early stages
of construction will accelerate the iterative design process. The iterative design process is
characterized by the continuous decrease of
uncertainties due to the increasing amount of data
and information on the morphology which will be obtained through (amongst others) surveys. The
best results can therefore be met by ‘learning by
doing’ through observation, monitoring and (re-)calibration of modelling, which is characteristic
for such a unique design.
At this point in time, the sand body of already
reclaimed land is fully exposed to the incoming
wave and current climate (see Figures 3 and 4).
The offshore breakwater has not yet been constructed. The morphological activity around the
reclaimed land is monitored regularly. With the
known information (ref [1]) on the behaviour of the pre-construction conditions and situation
(Figure 5), the changes in the morpho dynamic
system can be identified, which in turn will improve the knowledge base.
Figure 3: Sediment transport around the CPC
development (photo September 2015)
Figure 4: Development of the beach profile of the newly reclaimed land (photo April 2015)
Figure 5: Base scenario along Galle Face
3. Beach design
The design of the beach will be obtained through
the following steps: 1. Hydraulic data analysis and determination of
governing hydraulic conditions (not part of this
paper);
2. Beach stability analysis for the unprotected (=
without groyne field) beach;
3. Design recommendations for the beach area.

96
Figure 6: Average annual wave climate offshore the CPC development. Left: sea waves. Right: swell waves
3.1 Hydraulic conditions Sediment transport along the convex shaped beach
layout is mainly governed by the wave climate
inside the lagoon. The hydraulic conditions inside the lagoon are obtained through numerical model
simulations using the input of wave and wind
statistics and 2D physical model test results,
providing reliable data on wave overtopping and transmission of the offshore breakwater. The wave
climate is a translation of the offshore wave
climate disturbed by:
i) wave penetration through the northern and
southern openings;
ii) wave transmission through the offshore breakwater;
iii) wave overtopping over the offshore
breakwater and; iv) locally generated waves inside the lagoon
due to local winds.
The tidal currents (0.02 – 0.05 m/s), wind-driven
currents (up to 0.2 m/s for normal conditions) and
wave-driven currents (up to 0.2 m/s) are relative
limited in the breaker zone of the beach area.
Moreover, the currents will also be strongly
varying over time and will have opposing
directions. In spite of the moderate currents,
practice shows that they may play a significant role
in the transport of sediment (which is stirred up
mainly by the wave action and transported along
the beach by the currents). Due to the large timely
and spatial variation of the currents and the
moderate intensities, accurate assessment of the
currents and their effect on the sediment transport
is not practically attainable. Hence, this should be
left to practice and monitoring after construction of
the beach.
Figure 6 shows the governing sea wave conditions
(left) and swell wave conditions (right). Sea waves
are dominating from the WSW and W directions whereas swell waves are dominating from SW and
show a more narrow sector of incidence. The
governing overall direction of both sea waves and
swell waves is within the sector W to SSW. The highest occurring waves also come from these
directions. In addition, the NE monsoon from
about October till April induces waves from NW direction with (generally) lower waves.
Upon reaching the offshore breakwater, the
incoming wave energy will partly be absorbed, partly be reflected and partly be transmitted. The
transmitted wave energy will subsequently
propagate through the lagoon and reach the beach and the waves will have a different character there:
the wave energy will be redistributed, resulting e.g.
in a change in significant wave height. The
quantification of the wave redistribution in the lagoon and actual wave transmission was a major
subject of the 2D physical model tests (Figure 8).
In addition to the wave energy deformation, the wave direction will change. For the predominant
SW waves, the offshore breakwater will act as a
“magnifying glass” and will cause the wave energy to converge, see Figure 7. Such a shift in wave
angle has also been identified in literature studies
(ref. [2])
To assess the wave climate in the lagoon in a 3D
environment, the numerical wave model SWAN
has been applied. This wave model enables to

97
compute the wave energy through the openings
into the lagoon with sufficient accuracy and uses the wave transmission relations through the
breakwater as measured in the 2D physical model
tests. Wave energy through the openings was also
computed by a more accurate time-domain model, however such model cannot compute wave
Figure 7: Model results of ‘magnifying glass’principle of waves that overtop the Offshore breakwater.
transmission and computational times are very
high. Although the spatial variation of the wave
penetration was different between both models, the
actual wave energy was very similar and for this reason the SWAN model provides sufficient
accuracy. The computed change of wave direction
follow the available theories in general and is in line with the theoretical expectations (Figure 7).
Using this numerical wave model, the full offshore
time series have been translated to a number of locations (12) along the beach profile within the
lagoon area, which are further used in the beach
stability analyses. The uncertainty within this
modelling approach are known and considered in further analysis of the results, including sensitivity
analysis of the morphological model,
From the 2D physical model tests the wave
transmission – crest height correlation functions of
the breakwater have been determined for the whole range of wave heights and periods (see Figure 9).
These correlation functions have been used as main
input parameters in the numerical modelling to
determine the wave climate inside the lagoon area. For higher water levels (or lower relative crest
levels) the wave transmission through the
breakwater increases significantly, the future
situation with respect to sea level rise should thus
be taken into consideration. A high variability of
the water level (e.g. by seasonal influence and uncertainties in sea level rise) makes it complex to
accurately and reliably predict the wave climate.
By taking different wave climates and different crest heights (i.e. water levels), uncertainties can
be reduced as well as the sensitivity for the height
of the breakwater and climate change effect on the
water level can be accounted for.
In addition to the above, the following interesting
and informative outcomes can be summarized from
these wave transmission results:
- Measured wave transmission coefficients go
up to 0.3 for high wave conditions (low
relative crest height);
- Higher water levels (or lower relative crest
heights) cause significant higher wave
transmission, which will negatively affect
wave disturbance and beach stability for future
situations (including sea level rise or seasonal
variations);

98
- For a relative high crest level the transmission
coefficient is limited, but not negligible. This
means that even for lower wave heights, a
portion of the wave energy will constantly
penetrate into the Lagoon area, always giving
some waves at the beach;
Figure 8: Set up of 2D physical model test to determine the characteristics of the offshore breakwater
For longer wave periods (wave steepness = 0.005)
the transmission is higher. This means that a
minimum of approximately 20% of the swell wave height penetrates into the Lagoon. For sea waves
this minimum is in between 5 to 10%.
3.2 Uncertainties Particle size distribution
The exact sand characteristics of the available sand
for the beach fill are yet uncertain. Also due to spatial variation in the borrow area and during and
after construction of the beach, the particle size
distribution along the beach may vary. Sieve
curves from the currently constructed area of the CPC Project showed particle sizes ranging from
600 µm to 800 µm. To be on the safe side, a
homogeneous particle size distribution with a mean particle diameter of 600 µm has been assumed for
the stability analysis. To determine a band-width
for the expected sediment transport, 300 µm and 900 µm particle size are investigated as well. In
numerical modelling, the roughness factor to be
applied normally is a calibration factor. As no
calibration data is available here, based on similar
studies this parameter is taken as k = 5 m, with a
lower and upper limit of k = 2.5 m and k = 10 m.
Hydraulic Conditions
The beach stability analysis is performed for yearly
average conditions. The impact of extreme storm
conditions is not considered yet and should be included in a final design phase. Based on the
computed annual average wave climate, a
conservative and less conservative wave climate has been applied in the sediment transport
computations.
Also the incoming wave direction at the beach has
uncertainty as the change of wave direction in the
numerical model cannot be affected. Although the results look similar to the available theories (ref.
[2]), the local wave directions cannot be
considered highly accurate. For this reason also the effect of the incoming wave direction on the beach
stability is investigated by a sensitivity analysis.
Cross Shore Profile
In the sediment transport computation a constant
beach slope of 1:20 is applied. This slope is considered stable according to generally accepted

99
empirical slope stability formulae (refs 0, 0 and 0).
Steeper slopes can be applied at depths beyond the depth of closure (refs. 0 and 0)where sediment in
not influenced by waves and currents.
Figure 9: Transmission coefficient a function of the
relative crest height as measured in the 2D physical
model tests
3.3Beach stability
Wave-induced cross-shore redistribution of sediment will tend to shape the beach profile
towards its own ‘natural equilibrium’. Although
the cross-shore beach stability may be important for safety reasons, and the cross-shore profile is
relative stable, this paper focuses on long shore
sediment transport, since the gradients of such
transport are expected to be dominant for beach erosion and hence beach stability. The net
sediment transport along the sand beach is
computed while taking uncertainties in bathymetry, particle size distribution and wave climate into
account. In the first design phase, an initial
assessment is compared to the numerical model results.
The beach stability is done for an unprotected
beach, viz. no additional beach stabilizing measures in addition to the offshore breakwater.
Structural beach erosion is generated by long shore
sediment transport gradients which require quantification to determine potential beach
instability. Numerical modelling of long shore
sediment transport and coastline evolution is
carried out by using the LITPACK module of the MIKE21 software package from DHI (ref. 0).
LITPACK is suitable for quasi-uniform (relative
straight) coastlines or beaches. As the CPC beach-layout is in a strongly curved convex shape, the
model results towards the edges of the beach
(where curvature is strongest) should be considered cautiously. The model results are compared with
generally accepted long shore sediment transport
formulas as CERC (ref. 0) and Kamphuis (ref. 0). Model results are qualitatively in good comparison
with the transport formulas. Sediment transport
rates have been computed at 12 locations along the
convex shaped beach layout.
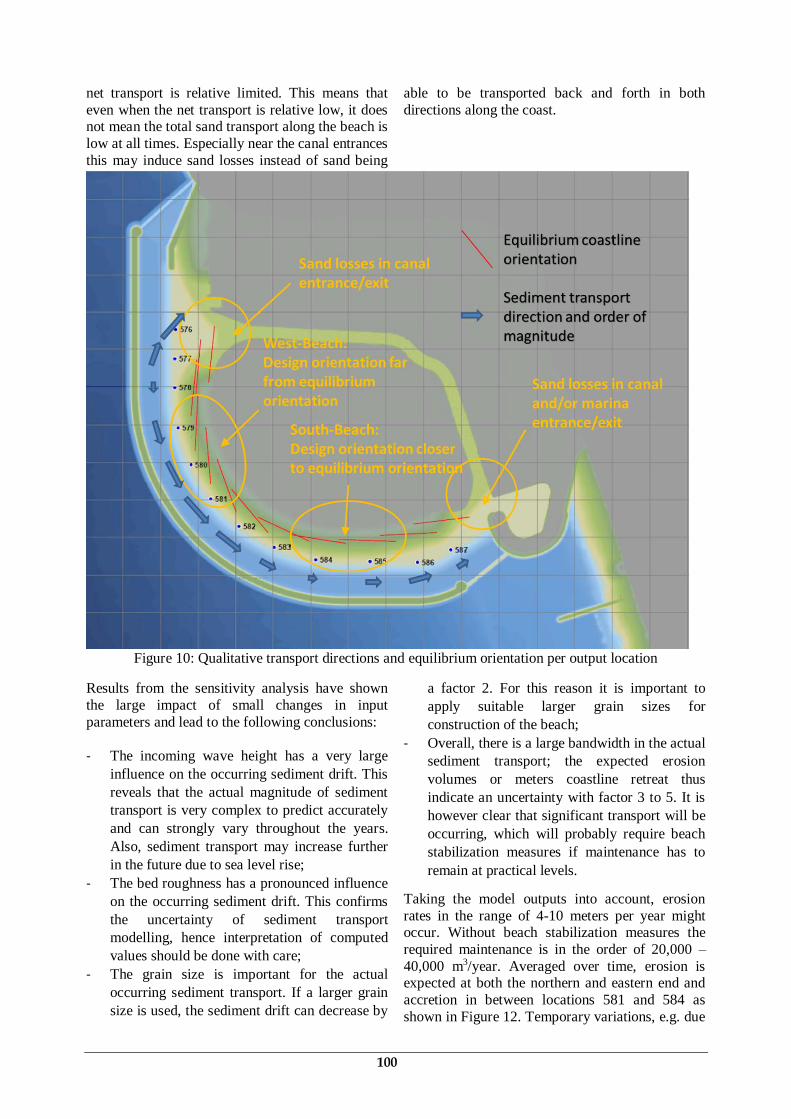
Based on the transport gradient, the qualitative
results of the sediment transport computations are shown in Figure 10 for the unprotected beach. The
following conclusions are obtained:
- Points 578 and 584 are close to their own
equilibrium (best estimate transport around 0),
For the other points the order of magnitude
does not change significantly for varying
incoming wave directions;
- Along the west beach, a significant N directed
sediment transport gradient is present (points
576 and 577). Depending on the detailed
location of the beach end in the west, sediment
transport toward the channel might occur. The
channels are considered as sediment traps
which may suffer from siltation if left
unprotected;
- The overall computed sediment transport over
the beach area is SE to E directed, transporting
sand towards the SE canal/marine
entrance/exit. This will potentially lead to
structural erosion of the S beach and will cause
siltation of the channel;
- The design orientation of the coastline at the W
beach seems to be far from the equilibrium
coastline orientation, which will lead on the
long term to a significant reorientation of the
W beach coastline, the extend of this effect
also depends on the design of the transition
between the beach and the canal boundaries;
- The design orientation of the coastline at the
South beach is closer to its equilibrium
orientation, which may lead on the long term
to a minor reorientation of the S beach
coastline;
- In terms of magnitude, sediment transport rates
[m3/yr] at the S beach are an order of
magnitude smaller than the transport capacities
of the W beach.
An example of the generated output at location 584 of a LITDRIFT (annual sediment drift)
computation is presented in Figure 11. This
location was selected as there was a clear sediment transport in both directions here, despite that the
100
net transport is relative limited. This means that
even when the net transport is relative low, it does not mean the total sand transport along the beach is
low at all times. Especially near the canal entrances
this may induce sand losses instead of sand being
able to be transported back and forth in both
directions along the coast.
Figure 10: Qualitative transport directions and equilibrium orientation per output location
Results from the sensitivity analysis have shown
the large impact of small changes in input
parameters and lead to the following conclusions:
- The incoming wave height has a very large
influence on the occurring sediment drift. This
reveals that the actual magnitude of sediment
transport is very complex to predict accurately
and can strongly vary throughout the years.
Also, sediment transport may increase further
in the future due to sea level rise;
- The bed roughness has a pronounced influence
on the occurring sediment drift. This confirms
the uncertainty of sediment transport
modelling, hence interpretation of computed
values should be done with care;
- The grain size is important for the actual
occurring sediment transport. If a larger grain
size is used, the sediment drift can decrease by
a factor 2. For this reason it is important to
apply suitable larger grain sizes for
construction of the beach;
- Overall, there is a large bandwidth in the actual
sediment transport; the expected erosion
volumes or meters coastline retreat thus
indicate an uncertainty with factor 3 to 5. It is
however clear that significant transport will be
occurring, which will probably require beach
stabilization measures if maintenance has to
remain at practical levels.
Taking the model outputs into account, erosion
rates in the range of 4-10 meters per year might occur. Without beach stabilization measures the
required maintenance is in the order of 20,000 –
40,000 m3/year. Averaged over time, erosion is expected at both the northern and eastern end and
accretion in between locations 581 and 584 as
shown in Figure 12. Temporary variations, e.g. due

101
to storms, may change this pattern of erosion or
accretion
Figure 11: Computed net and gross transport along the south stretch of the beach profile
3.4 Design
Based on the preliminary model outcomes, we
think it is highly advisable to install coastline stabilizing measures in order to reduce the long
shore sediment transport capacity. As a feasible
type of measures this stability can be improved by
the construction of a well-tailored groyne field. The groyne field can be adjusted in such a way that
it regulates or blocks the sediment drift. Per beach
section, the groynes may be different. For adequate detailed design, more information on the
hydrodynamic and morphologic system is required.
Therefore, depending on the overall planning of
the project, monitoring of the sediment transport processes and hydraulic regimes will lead to
progressive insight into the expected beach
stability. Moreover, with this information, the simulation models can be (re-)calibrated and
updated. As an example: already during the
construction of the offshore breakwater, the transmission parameters as used in the numerical
model can be verified.
Depending on the design, adaptation of the cross-sectional beach profile towards a dynamic
equilibrium profile will mostly take place in a
relatively short period after completion of the beach. To take this adaptation into account, it is
common practise to use a ‘buffer’ quantity of sand
in the higher part of the beach, which may move downwards due to the initial changes or erode,
ensuring that the minimum required width of the
beach will remain over a certain (predetermined)
period.
As a general approach, the best evidence for the
performance (and thus for the design) of a groyne scheme may be sought in observation of similar
groyne schemes in similar environments
elsewhere. However, here it should be noted that
this strongly convex-shaped beach design is unusual, so no similar artificial beach designs are
present to use as reference. Therefore, all design
considerations have to be based on the investigations carried out (physical and
mathematical) and on experience. The accuracy of
the numerical morphological modelling is a
reflection of the accuracy of the input parameters, hence a large bandwidth in modelling results
occurs. Results should thus be interpreted with care
and require to be updated with progressive insight during design and construction. This is an
important aspect of the engineering management
process described in this paper. For this reason a flexible, costs efficient but effective design is
proposed with the groyne field design.
The groyne scheme as designed based on the model calculations, consists of at 2 terminal
groynes near the N and E beach boundary to
prevent sediment losses into the canal. For the time being we foresee 8 intermediate relatively short
groynes. The terminal groynes could be installed as
rubble mound structure since they are of permanent character. For the intermediate groynes,
impermeable wooden structures may be more
suitable. The recommended preliminary layout
design is presented in figure 14. The reason for

102
choosing for the relatively short intermediate
groynes is to remain as close as possible to the natural system. Advantage is e.g. that strong saw-
tooth effects will be mitigated, as well as rip
currents which are dangerous for bathing people.
Further detailing of the beach stabilizing methods will follow from progressive insight. The groynes
as indicated here, are considered no-regret and can
be extended or adapted in future upon the increase of progressive knowledge, e.g. by monitoring and
update simulation modelling. The detailed design
should maximally allow for such extension or
adaptation.
Figure 12: Model result: computed coastline evolution over 20 years (yellow line)
4. Conclusions and recommendations
4.1 Conclusions
The present paper illustrates the complex and
iterative design process for the convex-shaped
Colombo Port City (CPC) beach layout. To solve the complex problems involved, the sediment
transport distribution along the beach has been
determined for annual average wave conditions based on a 20 year time series. The hydraulic
boundary conditions within the lagoon were
determined by making use of the numerical wave
model SWAN, in which wave transmission outcomes from 2D physical model testing have
been used as input to determine the wave heights
inside the lagoon area. Despite the use of state-of-the-art physical and numerical models,
uncertainties remain. The model results are subject
to uncertainties due to e.g. wave climate, offshore
breakwater characteristics, beach profiles and sand
properties.
We think that the largest uncertainty from this
wave study is the prediction of the wave climate
inside the lagoon, for which no tailor made combination of wave theories (transmission,
reflection, diffraction, penetration) and calibration
data are available. The complex layout of the development and the modelling assumptions lead
to uncertainties in the output of the numerical wave
models applied. Also for the main beach section,
the input parameters for sediment transport computations (bed roughness, particle diameter)
lead to uncertainties in the output results.
Therefore, a sensitivity analysis has been carried out to determine the range of uncertainties in the
computed sediment transport rates. In the
sensitivity analysis the individual influence of i)

103
particle size ii) bed roughness iii) wave climate and
iv) coastline orientation on the sediment transport rates has been determined.
The modelling results indicate that without any
beach stabilizing measures, the present convex beach layout could significantly erode due to
gradients in the long shore sediment drift. The
required maintenance is estimated to be in the order of 20,000 – 40,000 m3/yr, however due to the
uncertainties this estimation may vary up to a
factor 3. In the SW area (middle area of the beach), the beach sand will start to accumulate. The source
of this sand responsible for the accumulation are
the N to S stretch in the W part of the beach and, to a lesser extent, the E to W stretch in the S part of
the beach. Furthermore, sand may well be
transported towards the canal entrances / exits near
the end of the beaches and thus be ‘lost’. The W and S parts of the beach are therefore subjected to
structural erosion. The erosion rates at the N and S
stretches of the W part of the beach may initially be around 10m per year and at the E to W stretches
of the S part of the beach approximately 3m per
year.
Figure 13: Layout groyne field with 2 terminal groynes and 8 intermediate groynes
The most NW tip of the main beach appears to be
relative well sheltered by a protruding piece of land
N of the main beach. This area is therefore less
subjected to northerly directed sediment transport into the canal entrance. This is in contrast to the
most SE tip of the main beach where there is a nett
E directed sediment transport. On the long run this will results in erosion of the S main beach and
accumulation of sand in the S Canal Entrance. This
effect will be less in the N, but over time sand may
bypass the land protrusion and be transported into the canal entrance there. Moreover, the overall
sediment transport picture as shown in the above is
an averaged picture. Individual periods
(seasonality, storms) may give other distributions,
so the sediment transport at the extremities will
have to be arrested anyhow.
4.2 Recommendations
The sediment transport analysis along the beach of the CPC development indicates that at some
locations significant erosion of the beach is likely
to happen and that at other locations sedimentation
may occur. If this would really occur and required maintenance is considered too high, the situation
can be mitigated by a properly designed groyne

104
system. At the other hand, we think that the
uncertainties in the predicted erosion rates do not yet justify to propose a final solution at this stage
of the project.
Instead, we propose to maximally utilize progressive insight on the breakwater
characteristics, wave climate and particle size in
next iterative design rounds. We therefore also recommend to start a monitoring program on
hydraulics and the morphological behaviour of the
beach and volumes of local erosion and accretion during construction. This may further indicate the
necessity of the (interstitial) groynes. If such a
groyne scheme is strongly indicated then, the
monitoring results and subsequent increased knowledge on the local morphological behaviour
of the beach can be used for the final design of the
(initial) groyne field.
References
[1]. Van der Spek, B. J. T. (2013). Data poor
environments: Uncertainty propagation in
hydrodynamic modelling (Master Thesis,
Delft University of Technology).
[2]. Van der Meer, J. W., Wang, B., Wolters, A.,
Zanuttigh, B., & Kramer, M. (2003). Oblique
wave transmission over low-crested
structures. Proceedings Coastal Structures.
[3]. d'Angremond, K., Van Der Meer, J. W., &
De Jong, R. J. (1996). Wave transmission at
low-crested structures. Coastal Engineering
Proceedings,1(25).
[4]. Vellinga, P. (1984). A tentative description
of a universal erosion profile for sandy
beaches and rock beaches. Coastal
engineering, 8(2), 177-188;
[5]. Hallermeier, Robert J. "A profile zonation
for seasonal sand beaches from wave
climate." Coastal engineering 4 (1981): 253-
277;
[6]. Wiegel, R.L. (1964). Prentice Hall.
Oceanographic Engineering;
[7]. Kraus, N. C., Larson, M., & Wise, R. A.
(1998). Depth of closure in beach-fill
design (No. CETN-II-40). ARMY
ENGINEER WATERWAYS
EXPERIMENT STATION VICKSBURG
MS COASTAL AND HYDRAULICS LAB.
[8]. Simm, J. D., Brampton, A. H., Beech, N. W.,
& Brooke, J. S. (1996). Beach management
manual (Vol. 153). London: Construction
Industry Research and Information
Association.
[9]. Engineers, U. A. C. O. (1984). Shore
protection manual. Army Engineer
Waterways Experiment Station, Vicksburg,
MS. 2v, 37-53.
[10]. Kamphuis, J. W., Davies, M. H., Nairn, R.
B., & Sayao, O. J. (1986). Calculation of
littoral sand transport rate. Coastal
engineering, 10(1), 1-21.
[11]. DHI, User Manual Litpack, (2012)