Embed Size (px)
Citation preview

Design Vehicle Detection Systemfor Better Data Accuracy
Jillian Scholler and Jingcheng Wu
June 6th, 2017

Outline• Objectives and introduction
• Type of detectors
• Detector measurement and data examples
• How detectors collect volume, speed and occupancy
• TSM&O applications utilizing detector data
• Detector data collection challenges
• Demonstrate vehicle detection system design using microwave sensor as an example
• Lessons learned

Objectives• Provide an introduction to traffic detectors
• Understand how traffic detectors collect volume, speed and occupancy data
• Design a Vehicle Detection System to provide better data accuracy

Introduction• The National Electrical Manufacturers Association (NEMA) defines
a detector as a device for indicating the presence or passage of vehicles or pedestrians.
• Type of Detection As Defined by NEMA TS 2• Advisory Detection
• Actuation for traffic signal operations
• Passage Detection
• Detect the passage of a vehicle moving through detection zone
• Ignore the presence of a vehicle stopped within detection zone
• Presence Detection
• Sense a vehicle in detection zone, whether moving or stopped

Detector Functional Types as Defined in FDOT Standard Specification
• Vehicle Presence Detection Systems
• Traffic Data Detection Systems
• Provide presence, volume, occupancy, and speed data
• Probe Data Detection Systems
• Provide speed data and travel times for a road segment

Detector Type by Installation• Non-intrusive vs. intrusive
Video Image Detector
Sunpass Reader
Inductive Loops

Detection Technologies• Inductive loops
• Magnetic sensors
• Video image detectors
• Microwave radar sensors
• Infrared sensors
• Laser radar sensors
• Ultrasonic sensors
• Acoustic sensors
• Probing technique

Detector Technology Types as Defined in FDOT Standard Specification
• Inductive Loop
• Video
• Microwave
• Wireless Magnetometer
• Automatic Vehicle Identification
• Toll tag transponder reader
• Bluetooth reader
• License plate reader
Measure all vehicles or Population
Measure a subset of all vehiclesor probe-based monitoring orSample

Probe-based Monitoring Techniques• Vehicle re-identification or vehicle signature matching
• Media Access Control (MAC) address matching
• Vehicle license plate matching
• Vehicle toll tag matching
• Floating car technique
• Global Positioning System (GPS) devices
• Cellular phones
• Radio communication systems
• Transit vehicles equipped with automatic vehicle locators
• Aerial photographs
• Mechanical devices attached to odometers
• Pickup-delivery trucks

What does a detector measure? • Point measurement (Measure all vehicles)
• The most common data are volume, speed and occupancy
• Link measurement (Probe-based monitoring)
• Include space mean speed, travel time, density, vehicle queue length and space occupancy
• Vehicle Trajectory (Connected and automated vehicles)
• When a vehicle travels along a roadway, the position of the vehicle can be expressed as a coordinate in time and space.

Point Measurement Data Example
0
5
10
15
20
25
30
35
40
45
50
0:00 6:00 12:00 18:00 0:00
RT
MS
Me
as
ure
d M
idb
oc
k S
pe
ed
(M
PH
)
Time of Day
• 24-hour microwave sensor speed data at a signalized arterial mid-block location
• Data collection interval is 10 seconds
• X-Axis is time of day
• Y-Axis is speed in miles per hour

Link Measurement Data Example• 24-hour Individual
Vehicle Travel Time on Lexington Ave. between 42nd St. and 49th St in Manhattan

Vehicle Trajectory Data Example (AV/CV)• 253,994 data records of 433
vehicles during 17 minutes
200
250
300
350
400
450
500
550
600
650
16:01:20 16:02:00 16:02:41 16:03:22 16:04:02 16:04:43 16:05:23 16:06:04 16:06:45 16:07:25 16:08:06
Loca
l YTime

Detector Volume• Volume = the
number of vehicles passing detection zone
• The equivalent hourly volume is often treated as the flow rate
• 𝑓𝑙𝑜𝑤 𝑟𝑎𝑡𝑒 =𝑣𝑜𝑙𝑢𝑚𝑒
𝑇
• 𝑇 ≥ 15 𝑚𝑖𝑛𝑢𝑡𝑒𝑠
Detection
Zone
Lv Ld Lv
Detection
Zone
L

Detector Speed• Time mean speed is the arithmetic
average of vehicle speeds passing a point on a roadway
• = 𝑖=1
𝑁𝑆𝑖
𝑁
0
5
10
15
20
25
30
35
40
09:59:00 10:15:40 10:32:20 10:49:00 11:05:40 11:22:20 11:39:00 11:55:40 12:12:20
Spee
d (m
ph
)
Time of Day
10-Second Midblock Average Spot Speed
0
5
10
15
20
25
30
35
40
45
10:16:20 10:47:44 11:23:43 12:07:11 16:37:51 17:11:40 17:36:27 21:00:00 21:22:08 21:47:41 22:07:09 22:29:22 22:48:34 23:07:09
Spe
ed (
mp
h)
Time of Day
Speed Comparison Floating Car Speed
RTMS Speed
• Space mean speed is the length of the link divided by the travel time of vehicles traversing the link
• =𝑁×𝐿
𝑖=1
𝑁𝐿
𝑆𝑖

Detector Speed• Detector speed is the harmonic mean
speed of vehicles passing detection zone.
• 𝑆𝑑𝑒𝑡𝑒𝑐𝑡𝑜𝑟 =𝑁
𝑖=1
𝑁
1𝐿𝑖+𝐿𝑑𝑡𝑖
Detection
Zone
Lv Ld Lv
Detection
Zone
L
• Detector effective detection length is the vehicle physical length plus the detection zone length

Detector Occupancy• Detector occupancy is time occupancy
• Defined as the percentage of time detection zone is occupied by a vehicle
• 𝑂𝑡𝑖𝑚𝑒 = 𝑖=1
𝑁𝑡𝑖
𝑇
Detection
Zone
Lv Ld Lv
Detection
Zone
L

Detector Data Accuracy Requirements in FDOT Standard Specification
• Vehicle Presence Detection Accuracy, 98%
• Probe Data Detection System Accuracy• Penetration rate (probing or sampling rate), 75% of all vehicles
• Match rate, 5% of all vehicles
• Segment speed and travel time, 90%
• Traffic Data Detection System Data Accuracy• Volume, 95%
• Occupancy, 90%
• Speed, 90%

TSM&O Detector Applications
• Express Lanes
• Ramp Metering
• Freeway Speed Monitoring
• Speed Advisory DMS
• Travel Time Messaging
• Active Traffic Monitoring (ATM)
TSM&O Applications – Express Lanes
• Toll Calculation Based on Real-time Traffic Flow Data used to calculate Average Traffic Density per segment every 15 mins
• Travel Time Calculation • Speed Monitoring

TSM&O Applications – Ramp Metering
• Freeway Detectors1. MVDS (Passage Style)
2. Loops
3. Magnetic Sensors
• Ramp Detectors1. Loops
2. Magnetic Sensors
3. Video (Required on Bridges)
4. MVDS (Presence Style)

TSM&O Applications – Speed Monitoring
• Data Analysis and Reporting Tool (DART)
• Speed Graphs Displayed inside TMC
• I-95 & I-75
• Displays Active Incidents
• Benefits• Incident Detection
• MVDS Failures

TSM&O Applications – Speed Advisory DMS
• Speed Detection and Advisory System
• Collects speed from each lane
• Posts excessive speed advisory message

TSM&O Applications – Travel Time
• Freeway – MVDS • Displayed on select DMS
throughout District
• Updated every minute
• Strategically selected destinations
• Messages displayed secondary to lane blockage messages

TSM&O Applications – Travel Time
• Arterial - Bluetooth• Anonymous Signal via mobile
devices
• Real-time speed and travel time
• Updated every minute
• Devices installed at major intersections and on DMS Structures
• Travel time & speed calculated between 2 paired devices

TSM&O Applications – Active Traffic Mgmt
Dynamic Lane Use
Dynamic Merge
Dynamic Shoulder Use
Dynamic Speed Limit

TSM&O Applications – Other
• Automatic Vehicle Identification (AVI)• Tolls
• SunPass
• Speed Enforcement • Point to Point
Enforcement
• Used in Australia & New Zealand with positive results

Challenges
• Express Lanes
• Real time data - Tolls updated every 15 minutes
• Motorist incorrectly charged Low/High Tolls
• Poor System Reliability
• Ramp Metering
• Real-time Data – Metering Rate Calculated based on one-minute moving average
• Freeway Congestion or Excessive Queues on Ramps
• Arterials & Speed Advisory DMS
• Incorrect messages
• Driver Confusion

Common Detector Data Collection Errors• Double count
• Count a vehicle more than once
• Miss count
• Fail to detect a vehicle
Detection Zone
Detection Zone
Detection Zone
Detection Zone

Common Detector Data Collection Errors• Occlusion
• Detector signal is blocked
• Phantom detection
• Fail to detect the correct vehicle position

Challenges Probing Techniques Facing • Privacy issues
• Minimum sample size or probing rates required
• Biased results because of differences between the population and the samples
• High implementation costs
• Fixed infrastructure constraints
• Multiple routes between data collection points
• No point measurements of performance or queue length data directly available
• Cannot be used for signal actuation

Vehicle Detection System Design• Facility
• Freeway mainline, ramp or arterial
• Performance measurement
• Point measurement vs. link measurement
• Traffic flow conditions
• Detector technologies
• Design Criteria
• Single detector or separate detectors for mainline vs. ramp, Express Lanes vs. General Use Lanes, different directions
• Detector spacing
• Detector mounting
• Communication
• Power

Freeway Microwave Sensor Design
• Traffic Data Detection System• Provide presence, volume, occupancy, and speed data• Microwave sensor signal• Detector location selection
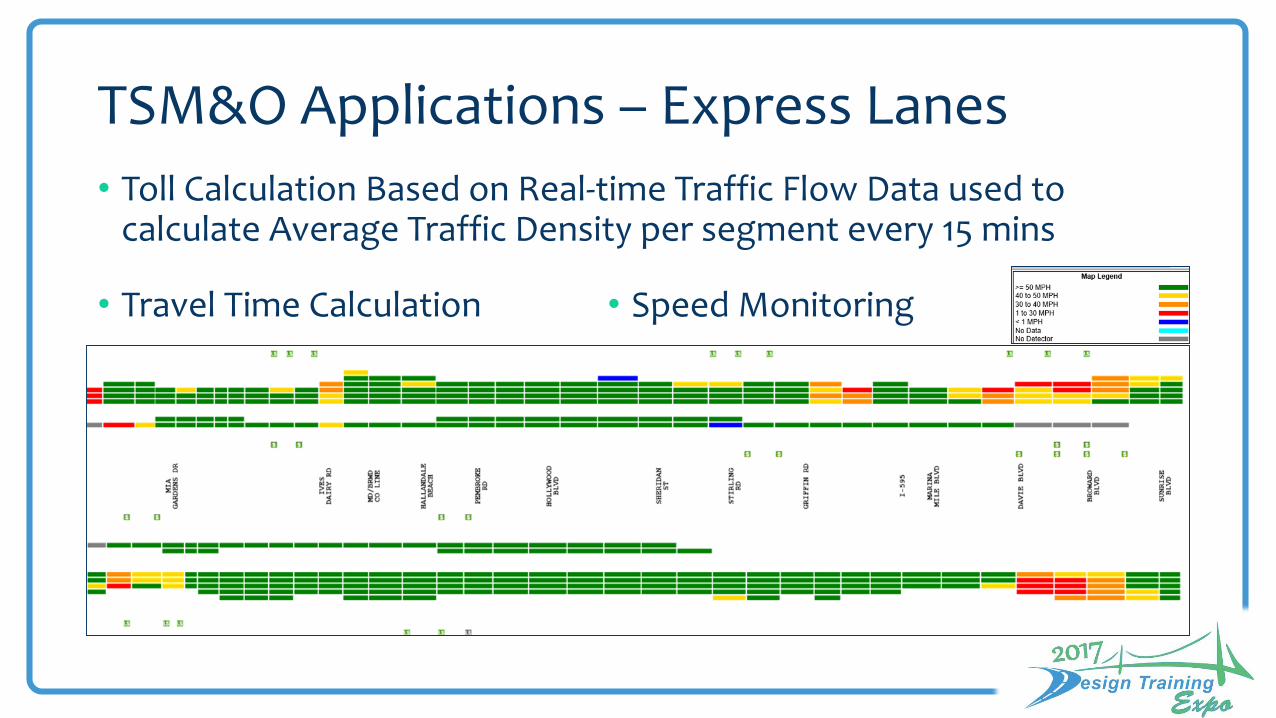
• Vehicle movement vs. detection zone• Avoid areas vehicles changing movements
• Merging area, diverging area, weaving area, etc.• Avoid obstruction of detector microwave signal
• Cross sections are important• Avoid reflection of detector microwave signal• Avoid stop and go area• Stay within detector microwave signal range
• Determine detector mounting height vs. detector offset
Detection Zone
Vehicle Movement
90.0°

Microwave Sensor Signal
• Example 1 • Example 2

Microwave Sensor Signal
• Vertical angle
• Horizontal angle

Vehicle Movement vs. Detection Zone• 𝐿𝑑1 > 𝐿𝑑• 𝐿𝑣1 > 𝐿𝑣
• 𝑆𝑑𝑒𝑡𝑒𝑐𝑡𝑜𝑟=𝑁
𝑖=1
𝑁
1𝐿𝑖 + 𝐿𝑑𝑡𝑖
• 𝑂𝑡𝑖𝑚𝑒 = 𝑖=1
𝑁𝑡𝑖
𝑇
Detection Zone
Detection Zone
Lv LvLd
Lv1
Avoid Areas Vehicles Changing Movements
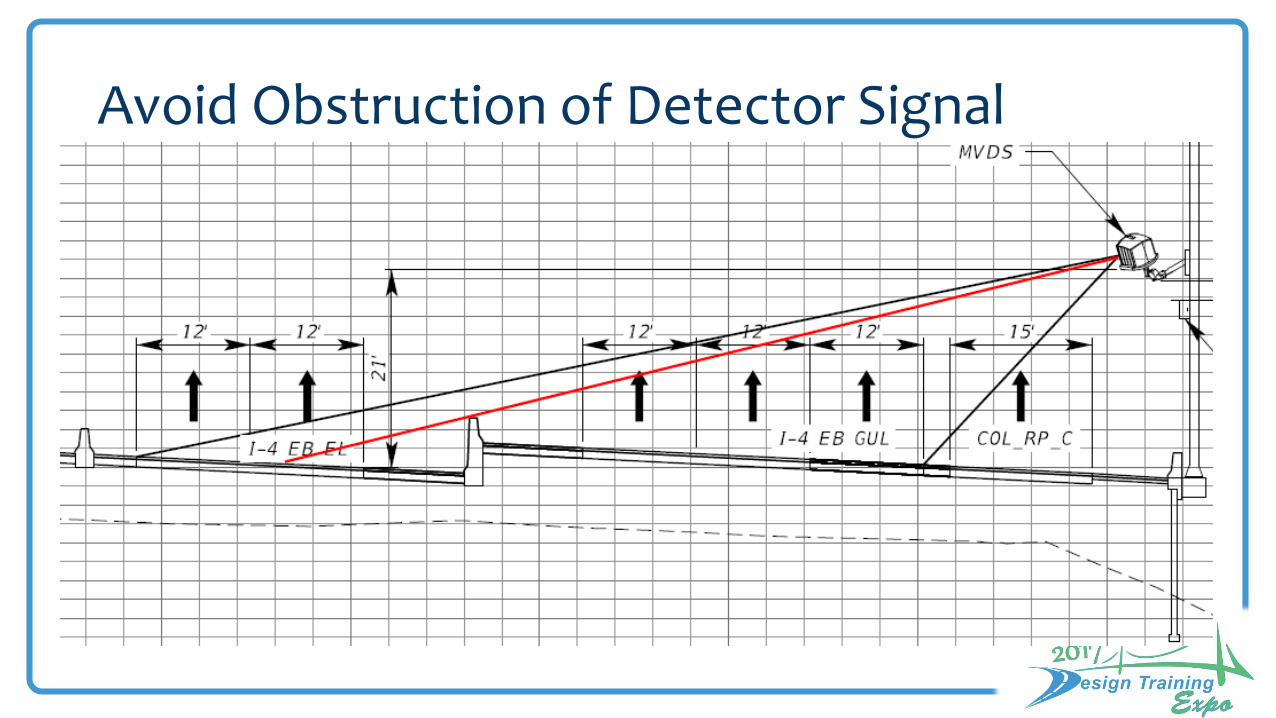
Avoid Obstruction of Detector Signal

Avoid Obstruction of Detector Signal

Avoid Obstruction of Detector Signal

Avoid Reflection of Detector Signal

Mounting Height vs. Offset

Mounting Height vs. Offset

Mounting Height vs. Offset
• Detector mounting height is measured from the edge of the closest travel lane to the bottom of the detector
• Offset is measured from the front face of the pole to the edge of the closest travel lane

Lessons Learned• FDOT standard specification section 660-2.3.1.3
• Traffic Data Detection System Field Acceptance Testing: Verify detection accuracy at installed field sites using a reduced method similar to those described in 660-2.3.1. Compare sample data collected from the detection system with ground truth data collected by human observation. For site acceptance tests, collect samples and ground truth data for each site for a minimum of five minutes during a peak period and five minutes during an off-peak period. Perform site acceptance tests in the presence of the Engineer.
• Data collection time interval or polling interval
• Valid data vs. invalid data
• By per lane vs. by per direction
• Occupancy data testing
• Time occupancy is about 0.35 seconds for a vehicle travels at 50MPH and human perception reaction time is about 1.4 seconds
• Ground truth data

Questions• Jillian Scholler, PE
Managed Lanes Coordinator
AECOM
SMART SunGuide RTMC
2300 West Commercial Blvd.
Fort Lauderdale, FL 33309
• Jingcheng Wu, PhD, PE, PTOEITS Project Manager
HDR
3250 W. Commercial Blvd., Suite 100
Fort Lauderdale, FL 33309

![Fingerprinting Electronic Control Units for Vehicle ... Electronic Control Units for Vehicle Intrusion Detection ... Various types of Intrusion Detection Systems ... bus system [4]](https://img.pdfslide.net/doc/110x75/5af615c87f8b9ae9488e5a4b/fingerprinting-electronic-control-units-for-vehicle-electronic-control-units.jpg)