Embed Size (px)
Citation preview
QEDQueen’s Economics Department Working Paper No. 1371
Designing a Basic Income Guarantee for Canada
Robin BoadwayQueen’s University
Katherine CuffMcMaster University
Kourtney KoebelQueen’s University
Department of EconomicsQueen’s University
94 University AvenueKingston, Ontario, Canada
K7L 3N6
12-2016
1
Designing a Basic Income Guarantee for
Canada
Robin Boadway, Queen’s University
Katherine Cuff, McMaster University
Kourtney Koebel, Queen’s University
Abstract
We propose mechanism for implementing a two-stage harmonized Basic Income Guarantee with
federal and provincial components. In Stage One, the federal government replaces its refundable
and nonrefundable tax credits with an income-tested basic income delivered through the income
tax system. The reform is revenue-neutral. In Stage Two, each province decides whether to
implement a provincial basic income guarantee that is harmonized with the federal one but
allows province-specific basic income levels. The provincial basic income replaces provincial
refundable and nonrefundable tax credits as well as welfare and disability transfers, and is also
revenue-neutral. All social services and contributory social insurance programs remain intact. An
illustrative calculation using Statistical Canada’s SPSD/M model shows the financial feasibility
of a national BIG of $20,000 per adult adjusted for family size with a benefit reduction rate of
30%.
Key Words: basic income guarantee, inequality, fiscal federalism
JEL Classification: H2, H7 I3
Prepared for New Frontiers in Public Policy: Federalism and the Welfare State in a
Multicultural World, A Conference in Celebration of Keith Banting, Queen’s University,
September 23–24, 2016. We thank John Myles and conference participants for comments on the
conference presentation and suggestions for revision. We are grateful to Harvey Stevens for
valuable advice on using SPSD/M for basic income simulations.
2
1. Introduction
There is renewed interest in the idea of a basic income guarantee for Canada. This is
partly driven by growing inequality and the inability of redistribution policies to address it
(Fortin et al, 2012; Banting and Myles, 2013). At the lowest income levels where much of the
population relies on provincial welfare assistance, incomes have fallen dramatically in the past
three decades. In Ontario, the welfare income of a single employable person fell from $12,500 in
1994 to $8,500 in 2014 measured in 2004 dollars (Tweddle, Battle and Torjman, 2015).
Compounding this is the increase in earnings volatility resulting from the stagnation of full-time
jobs and the precariousness of employment as technology displaces factory jobs and the forces of
globalization result in a race to the bottom among both employers and governments. Moreover,
there is increasing evidence of the self-reinforcing nature of poverty. Poverty leads to poor
nutrition and health outcomes, impedes educational attainment, and prevents poor persons from
participating in society and from improving opportunities for themselves and their families.
Putting more money in the hands of the poor will increase their well-being and life chances, and
make them less dependent.
The basic income guarantee (BIG) that we propose in this paper is motivated by these
considerations. As well as being an altruistic impulse, it is an investment in the betterment of
persons and their children who are unable to achieve their potential. However, a BIG is not in
itself a panacea. The income security it provides is necessary but not sufficient for addressing the
needs of the disadvantaged. It complements other public programs such as employment creation,
housing, education and healthcare. Our focus will be on reform of government transfer programs,
leaving intact in-kind benefits, social services and regulations (e.g., minimum wage). The BIG
we propose would be revenue-neutral reform in the composition of government transfers to
persons that would significantly improve the relative position of those in the bottom of the net
income distribution and reduce poverty. It would replace most existing transfers delivered
through the tax system, including many non-refundable and refundable tax credits. Social
insurance programs such as employment insurance (EI), workers’ compensation and Canada and
Quebec Pension Plans (CPP/QPP) would remain. Our analysis combines adequacy and
comprehensiveness of income support with dismantling the burdensome administrative costs and
3
intrusive delivery of provincial social assistance programs. Social services would remain intact,
and more wide-ranging reforms could address the administrative costs of delivering them.
Arguments for a BIG are not new to Canada. A form of BIG was proposed by the Special
Senate Committee on Poverty (1971) and the Royal Commission on Canada’s Economic
Prospects (1985). A vocal proponent has been Segal (2008, 2009). Alternate BIG proposals have
been studied empirically by Hum and Simpson (2005), Young and Mulvale (2009), Simpson and
Stevens (2015) and Lammam and MacIntyre (2015). These studies differ in terms of the changes
in the existing tax-transfer system they propose and the income guarantee level. For example,
the Lammam-MacIntyre study treated BIG as a replacement for all programs aimed at serving
the needs of low-income persons, including EI, CPP/QPP, and social services, to investigate the
administrative cost savings associated with delivering all existing programs for the poor through
a single transfer system without enhancing their benefits. This form of BIG resembles a negative
income tax system along the lines originally proposed by Milton Friedman, and would not
address the shortcomings of existing programs in alleviating poverty and income volatility.
Recent summaries of the pros and cons of a BIG may be found in Himelfarb and Hennessy
(2016) and Macdonald (2016), and suggestions for the design of a basic income pilot are found
in Forget, Marando, Surman and Urban (2016) and Segal (2016).
In approaching the design of a BIG for Canada, two broad issues must be addressed. The
first is whether the BIG should be a universal basic income paid to all persons regardless of
means or a more targeted BIG meant to ensure that no one falls below the income guarantee.
European proponents of basic income opt for the universal version both on philosophical
grounds—basic income as a right to which all are entitled—and on grounds of political
feasibility—the fostering of political support when all voters are entitled to basic income (Van
Parijs, 1995). Atkinson (2015) has instead argued that to buy political support, basic income
recipients should be required to make some social contribution, such as employment, education,
training or job search, care-giving or voluntary work. This idea, referred to as participation
income, risks perpetuating the administrative costs and stigmatization of existing systems.
The argument against the universal approach is its cost. If all persons are given, say,
$20,000 per year, it would cost $20,000 per person on average. Since many persons are not
taxpayers, the cost per taxpayer would be correspondingly greater. This would be diminished
considerably if basic income were taxable, but even then everyone would receive some amount.
4
If the top marginal tax rate were 50%, the highest income earners would receive $10,000 after
tax. This negative income system would reduce the cost of a universal basic income, but it would
still be expensive and would entail considerable ‘churning’ of tax revenues (tax revenues being
raised to make transfers to the persons who paid the taxes).
The alternative to a universal basic income is to emphasize the guarantee of a basic
income as its defining feature. According to this view, the design of a BIG should be based on
finding the most efficient way of ensuring that no one’s income falls below the chosen basic
income level, taking work incentives into account. An income-tested BIG is a suitable form and
could be administered most simply through the income tax system, either as a refundable tax
credit like the Canada Child Benefit (CCB), the Working Income Tax Benefit (WITB) and the
GST/HST Credit, or as a standalone transfer like the Old Age Security and Guaranteed Income
Supplement (OAS/GIS) system. The income-tested transfer would be superimposed on the
progressive income tax structure, but could have tax-back rates that differ from the latter as is the
case with these refundable tax credits and standalone transfer programs. They have tax-back
rates that ensure that the transfer is phased out before high incomes are achieved. A BIG
program would ideally incorporate all such transfers into a single system with a given basic
income level and tax-back rates based on individual or family income as desired. For taxpayers
who receive BIG, the implicit marginal tax rate includes both the income tax rate and the BIG
tax-back rate.1
The second broad issue to confront is that the federal government, provinces, territories
and First Nations all assume some responsibility for transfers to low-income persons. The federal
government dominates transfers to the elderly through OAS/GIS and to children through CCB,
while the provinces and territories make major transfers to the long-term unemployed and the
disabled through their welfare systems. Both levels of government implement income-based
refundable and non-refundable tax credits (RTCs, NRTCs). The federal government has
fiduciary responsibility for First Nations, and finances welfare systems that they deliver.
Transfers vary considerably among provinces and First Nations, and some groups, such as low-
income workers, receive relatively little support from any level of government. The result of this
patchwork system is uneven, where the elderly and low-income families with children fare better
than those relying on provincial transfers, and low-income workers receive limited support.
5
A BIG that supplants the existing system of transfers must take account of the interest
that both levels of government have in redistribution, as well as the special responsibility that the
federal government has for First Nations. This complicates the form of an ideal BIG system, as
well as the movement from the existing system to a BIG, especially given that the existing
system falls far short of adequate levels of income support.
The challenge we address is how to design a BIG in Canada’s federal setting that
provides adequate levels of support with a minimum of stigmatization and conditionality, with a
suitable balance between program cost and work incentives, and with a degree of differentiation
across provinces that accommodates provincial preferences without detracting from national
objectives. Our scheme involves a two-stage transition from the current system of transfers, with
the federal government implementing a federal BIG in the first stage and the provinces having
the opportunity to implement a harmonized provincial BIG in the second stage. The analogue
that informs our proposed scheme is the federal-provincial tax harmonization system that exists
in similar forms for personal and corporate income taxes and the GST/HST. These are bilateral
agreements between the federal government and individual provinces, so unanimous agreement
is not required. Like the tax collection agreements, the design of a two-stage program must make
it inviting for the provinces to join in and must pay attention to the implications of a federal-
provincial BIG system for intergovernmental fiscal arrangements, such as the division of tax
room, Equalization and the Canada Social Transfer.
Our scheme focuses on a BIG delivered by the federal government and the provinces. We
omit the territories for simplicity, since they raise no special issue of substance. Providing a BIG
to First Nations members poses special challenges, especially if it is administered through the
income tax system. An acceptable BIG would involve the participation of First Nation
governments even if the financing comes largely from the federal government. This would entail
institutional issues that call for a separate study.
Our proposal involves replacing all RTCs and NRTCs with an income-tested BIG
consisting of federal and provincial components. For computational simplicity, OAS/GIS are
also replaced, though that is not essential, while the CCB is retained as a BIG for children.
Keeping OAS/GIS and some NRTCs could be accommodated without affecting the broad
features of the reform. The system is virtually self-financing, or revenue-neutral, in the sense that
the cost of the federal BIG roughly equals the value of federal RTCs and NRTCs, and the same
6
for the provinces. No tax rate increases are required. The size of the national BIG is $20,000 per
adult adjusted for family size and with a claw-back rate of 30% based on family net income. The
federal BIG is $14,322, while the average provincial BIG is $5,678, although with allowable
variations across provinces. Financial feasibility is confirmed by simulations using Statistics
Canada’s SPSD/M model, augmented by conjectures about labour supply responses.
Replacing federal and provincial tax credits with a BIG delivers an impressive amount of
redistribution of disposable income from those in the top half of the net family income
distribution to those in the bottom half. As Table 2 indicates, the fall is roughly 10% and
relatively uniform for the former, while those in the bottom two deciles gain by 167% and 74%,
respectively. The gain for low-income single adults is almost 270%, albeit from a low pre-reform
level. Table 4 shows that disposable income inequality is significantly reduced with the Gini
coefficient falling by almost 17% and the poverty rate falling by 73% to only 3.2%. Estimated
labour supply responses reported in Table 5 are negative for the bottom six deciles and positive
for the top four. Overall, earnings fall by about 2.2%, causing the cost of the BIG program to rise
by less than 3%, not enough to compromise revenue-neutrality.
The details of how these outcomes are achieved by simply reallocating existing tax
credits and transfers are recounted below. First, we provide a brief review of the arguments for
an income-tested BIG and summarize the relevant features of the existing Canadian tax-transfer
system.
2. The Case for an Income-Tested BIG
Why should society guarantee a basic income unconditionally to all individuals
regardless of their behaviour? Two classes of arguments can be made. The first draws on
normative welfare economics and social choice theory, especially as it has been applied in
optimal redistribution analysis. These tend to be relatively technical arguments. The second class
consists of a number of policy-based considerations.
Standard optimal redistribution theory posits a benevolent government maximizing a
social welfare function that aggregates the well-being or ‘utility’ of all persons. In the absence of
redistribution, persons with greater skills or productivity—because they are so endowed or
because they have acquired skills through education and socio-economic surroundings—will be
better off (i.e., attain higher utilities). As long as the social welfare function exhibits aversion to
7
utility inequality, partly because individual marginal utilities of income are decreasing,2
redistribution will be from the better-off to the worse-off. Typically, this will require the least
well-off receiving a transfer. In the extreme case where aversion to inequality is the highest, the
social welfare function will be of the maxi-min sort (Rawls, 1971), so the welfare of the least
well-off will be maximized.3
The social welfare approach supports redistribution to the less well-off, but does not lead
one directly to a basic income guarantee. That is because income does not index individual utility
or welfare. The latter includes, for example, leisure time. In the classical optimal income tax
problem, utility is increasing in income, but if the objective of the Rawlsian government were to
maximize the income of the least well-off, that would not be the same as maximizing the welfare
of the least well-off because the value of leisure—or the cost of work—would not be given any
weight (Kanbur, Keen and Tuomala, 1994). However, recent contributions to redistribution
theory have questioned the relevance of the standard social-welfare-maximizing approach, and
lend more direct support to a BIG.
The first contribution may be found in the equality of opportunity literature and is
motivated by the fact that individuals have different preferences. Faced with identical
circumstances, individuals may make quite different choices. They may differ in their saving
behaviour or in their propensity to take risks, for example. For our purposes, they may differ in
their preferences for leisure. Those who choose to work hard will have higher incomes at the
expense of leisure than others. In these circumstances, incomes may no longer be perfectly
correlated with well-being. Indeed, ranking persons by well-being is less clear-cut when
preferences for leisure differ. The equality of opportunity approach attempts to resolve this issue
by supposing that persons are to some extent responsible for their preferences, and differences in
outcomes across persons arising because of differences in preferences should neither be
penalized nor rewarded: the Principle of Responsibility. Persons should only be compensated for
differences over which they have no control, such as their skills: the Principle of Compensation.
It turns out that these two principles are in conflict and cannot both be satisfied, though we need
not dwell on the reasons here. For our purposes, the point is that giving persons of identical skills
equal opportunities or resources preserves the Principle of Responsibility. In practical terms, this
suggests that in redistributing to the least skilled or productive, the amount of the transfer should
8
not be contingent on how much the recipients choose to work. This would support an
unconditional BIG program.
This argument has been taken further by Fleurbaey and Maniquet (2011). They also begin
with the Principles of Responsibility and Compensation, but they suppose following the social
choice literature (Arrow, 1951) that welfare can neither be measured nor compared across
persons. Since the two principles cannot be satisfied at the same time, they propose variants that
compromise one or the other principle. In one variant, the Principle of Compensation is assumed
to be satisfied, while the Principle of Responsibility is weakened. Given the immeasurability of
utility, they propose that the Principle of Compensation can be captured in a form of the Pigou-
Dalton transfer principle: social outcomes are assumed to be improved if consumption
differences are reduced between persons of different skills and the same preferences who supply
the same amount of labour. The Restricted Principle of Responsibility requires that if persons
differed only in preferences, the laissez-faire would be optimal. Using these two requirements
combined with the Pareto principle, they show that the social ordering takes the maxi-min form
in an index of utility based on resources required to get to each individual’s indifference level.4
All others persons, including less industrious persons with the lowest skills, achieve a higher
utility index. This can be interpreted as a form of BIG, where the income guarantee is a virtual
laissez-faire budget line.
These arguments for defining social orderings in terms of a measure of resources required
to achieve existing levels of welfare (or indifference curves) is reminiscent of arguments for
indexing individual well-being for tax purposes using comprehensive income (Haig-Simons-
Musgrave). Comprehensive income was taken be a measure of the ability to pay taxes, and the
Carter Report recommended it as the income tax base. The case for a progressive rate structure
was based partly on the doctrine of equal sacrifice (e.g. all individuals should be made equally
worse off as a result of taxation, either proportionately or in absolute terms), and partly on the
idea that a minimum amount of income was needed for non-discretionary spending so should be
tax-favoured. Discretionary spending could be taxed at a higher rate (up to 50% according to
Carter). The Carter Report was preoccupied by income taxes rather than transfers so did not
broach the topic of a BIG. However, the notion of minimum amount of individual spending
being non-discretionary or necessary leads one immediately to the presumption that all
individuals ought to receive at least the minimum necessary amount.
9
Compelling arguments for a universal BIG can be made on the basis of citizenship or
human rights. Article 25(1) of the Universal Declaration of Human Rights proclaimed by the
U.N. General Assembly in 1948 and signed by Canada states “Everyone has the right to a
standard of living adequate for the health and well-being of himself and of his family, including
food, clothing, housing and medical care and necessary social services, and the right to security
in the event of unemployment, sickness, disability, widowhood, old age or other lack of
livelihood in circumstances beyond his control.” This can be interpreted as the right to a basic
income.
Normative arguments reinforce that right. The enviable level of per capita output of
goods and services produced by the Canadian economy is due in part to the skills, hard work and
ingenuity of Canadian workers and entrepreneurs. However, that success is contingent on the
quality of Canadian institutions, the sanctity of the legal system and the rule of law, the
accumulated knowledge that current generations have inherited from the past and natural
endowments of resources and amenities, all of which are part of the common heritage of all
citizens. Those who earn large wages and salaries do so partly from their own effort, but partly
from luck associated with living in the right place at the right time. Providing less fortunate
persons with a BIG recognizes their share of the bounty that Canadian prosperity allows.
A BIG can also be partly justified as an investment in human development. Higher
incomes contribute to better nutrition, better health outcomes and better education, both for
income recipients and for their children. Evidence from the 1974–79 Mincome guaranteed
annual income experiment in Dauphin, Manitoba summarized by Forget (2011) confirms this. A
BIG also gives persons the capability of participating fully in society and the human dignity that
entails (Sen, 1985). Removing the anxiety about where the next meal or adequate clothing and
housing will come from allows individuals to focus on longer term decisions. And, removing the
stigmatization of the existing system can actually contribute to building social norms such that
transfer recipients feel good about themselves and their potential to contribute to society, and
therefore have more incentive to work, provided there is some minimum reward for doing so.
These arguments have already been accepted for a segment of the population, specifically
the elderly and low-income families with children. We investigate below how they might be
extended to the entire population.
10
3. Basic Elements of Canada’s Tax-Transfer System
Our national BIG would include both federal and provincial components, and would replace the
various transfer programs now provided by the two levels of government. Like the latter, a
national BIG with federal and provincial components would rely on the income tax system, and
is inspired by the Canadian tax harmonization system. It aims to achieve a similar form of
harmonization as exists in the tax system. We begin by summarizing the current federal and
provincial transfer systems and then turn to tax harmonization.
3.1 Federal and Provincial Income Transfers
Diverse forms of income support are provided by governments in Canada to different types of
residents. Virtually all low-income persons receive some support. However, levels of support are
uneven and inadequate, and often poorly targeted. Some of the current income support programs
are administratively complex and intrusive, and discourage some persons from escaping poverty.
Federal government transfers to low-income persons take two main forms. Persons aged
65 and over are eligible for OAS and GIS depending on their income. In 2016, the basic OAS is
$6,846 per year, is indexed and is taxable. Once annual net income reaches $71,592, OAS is
subject to a recovery tax of 15% so it falls to zero at an income of $116,103. In addition to OAS,
GIS is available to the lowest-income seniors and is non-taxable. The maximum annual amount
is $9,283, and it falls to zero at $17,304 (which reflects a tax-back rate of about 50%). Taken
together, OAS and GIS offer a maximum annual amount of $16,129. They operate outside the
income tax system but are integrated with it.
The other federal low-income transfers are three income-tested RTCs, which are integral
to the tax system and administered by the CRA. One is the CCB, which began in 2016. It is a
tax-free payment to families based on the number and age of children, and is family-income
tested. It can be supplemented by a child disability benefit as well as provincial or territorial
benefits. In 2016–17 (since monthly payments are recalculated each July), the annual amount
was $6,400 for each child up to age 5 and $5,400 per child aged 6 to 17. CCB is reduced when
family net income exceeds $30,000 and the tax-back rate varies with the number of children.
With one child, the tax-back rate is 7% for family incomes between $30,000 and $65,000, and
3.2% above that, and corresponding tax-back rates are 13.5% and 5.7% for two children, 19%
and 8% for three children, and 23% and 9.5% for four or more children. For families with one
11
child, the CCB falls to zero only when family incomes reach over $120,000, and similarly for
more than one child.
The WITB is a modest RTC given to low-income workers aged 19 and above, and
encourages labour force participation. It can include a disability supplement, and can vary by
provinces. For single persons in most provinces, the annual WITB for 2015 is $1,015 if working
income is between $7,060 and $11,525. It is reduced when income exceeds $11,525 and falls to
zero at $18,292. The maximum amount for families is $1,844 if family working income is
between $10,376 and $15,915. It falls to zero when family working income reaches $28,209. The
maximum WITB disability supplement is $508.
The GST credit compensates low-income persons for GST paid on their consumption
purchases. For provinces who have harmonized their sales taxes, an HST credit applies that
varies by province. The GST credit varies by family size and family net income, and is indexed
annually for inflation. For a single person with no children the maximum amount is $421 per
year on incomes starting at $20,000, and falls to zero at $46,000. (The credit is less than $421 if
income is less than $20,000.) With two children, the maximum GST credit is $842 starting at
zero income and falls to zero at $54,000. Amounts are slightly higher with two adults and more
children. As can be seen, the GST credit is modest in size.
Since these refundable tax credits are administered by CRA as part of the income tax
system, individuals must file an income tax return to be eligible. Amounts are based on the
previous year’s income, and so cannot take account of changes in family income in the
meantime. The provinces also offer some refundable tax credits, but like the GST credit these are
relatively small.
Provincial transfers consist mainly of welfare payments to the long-term unemployed and
transfers to the disabled. The amounts vary widely across provinces as documented by Tweddle,
Battle and Torjman (2015). In 2014, welfare for single employable persons was $11,035 in
Newfoundland & Labrador, and varied in other provinces from $6,811 in New Brunswick to
$8,995 in Saskatchewan. For two-parent, two-child families, the highest amount was $27,240 in
Prince Edward Island, and elsewhere was between $21,770 in New Brunswick to $25,886 in
Ontario. Single disabled persons received $14,094 in Ontario, and between $9,425 in New
Brunswick and $12,375 in Quebec. These amounts are not indexed for inflation, and have been
trending downwards in real terms since the early 1990s.
12
Unlike RTCs and OAS/GIS, provincial welfare and disability transfers are delivered by
provincial social assistance administrators. Whereas federal programs are based on self-
assessment (apart from disability supplements, which requires a doctor’s approval), eligibility for
welfare and disability involves application for support, screening for eligibility and some
ongoing monitoring. Recipients are restricted in the value of assets they can own, and their
ability to earn income is severely restricted and subject to varying tax-back rates, typically quite
high. Welfare recipients are expected to be available to work and to accept job offers. Eligibility
for welfare and disability also entails eligibility for various social services, such as housing
assistance, pharmaceuticals, public transit subsidies and counselling.5 The consequence is a
system that can be stigmatizing, and that discourages work and saving.
Both the federal and provincial government offer a number of NRTCs. These vary by
taxpayer characteristics and are income-tested. Since they are non-refundable they are of limited
value to low-income individuals.
Government transfers are typically not well targeted to those most in need, and many are
not indexed. Some are delivered in ways that are stigmatizing and do not encourage labor market
participation or work effort. Transfer recipients tend to fall into separate categories of persons
who rely mostly on federal support—such as the elderly, the working poor, the temporary
unemployed and children—and those who rely on provincial support—the long-term
unemployed and the disabled.
The inadequacy of the level of support for low-income persons can be judged by
comparison with poverty measures. The Low-Income Cut-Off (LICO) compiled by Statistics
Canada (2016) is a useful benchmark. It measures the income level at which a family of a given
size spends 20 percentage points more than the average family (of the same size) on food,
clothing and shelter. LICOs vary by size of family and populations of place of residence. In
2011, the LICO for a single person was $14,454 in towns with less than 30,000 inhabitants,
$16,328 in cities between 100,000 and 500,000, and $19,307 in cities above 500,000. For two-
person families, the corresponding figures were $17,592 in towns with less than 30,000, $19,872
in cities 100,000 to 500,000, and $23,492 in cities above 500,000. For four-person families, it
was $27,329 in towns less than 30,000, $30,871 in cities 100,000 to 500,000, and $36,504 in
cities above 500,000. Only seniors receiving OAS/GIS come close to LICO amounts, and then
only for small municipalities.
13
Moving to a national BIG involves replacing existing transfer programs them with a
uniform system, and coordinating federal and provincial programs so that a harmonized BIG is
achieved with some provincial discretion. The existing refundable tax credits and the OAS/GIS
system are proven models for delivering an income-tested transfer that could be exploited in a
BIG program. Both of these systems take advantage of the income tax collection machinery
administered by the CRA. The self-reporting feature combined with the anonymous
administration minimizes onerous application, conditionality and stigmatization associated with
transfer systems like welfare, disability and EI. The design flaws of existing transfers
administered through the income tax system could be readily overcome, although it would entail
gainers and losers.
3.2 The Federal-Provincial Tax Harmonization System
Our national BIG proposal is inspired by tax harmonization arrangements that apply to the
personal and corporate income tax systems as well as to sales taxes. In each case, tax
harmonization is based on bilateral federal-provincial agreements that follow a common
template. For the personal income tax, agreeing provinces—which include all except Quebec—
sign a Tax Collection Agreement (TCA) that obliges them to accept the federal tax base while
allowing them discretion over their provincial rate structures and non-refundable tax credits.
Taxes are administered by the CRA and are allocated to provinces according to the taxpayer’s
province of residence on December 31 of the taxation year. The federal government turns over
tax revenues owing to the provinces in as timely a manner as possible, and is responsible for
unpaid taxes.
The TCAs for the corporate tax—which apply to all provinces except Alberta and
Quebec—operate in a similar way. Provinces use the federal tax base but choose their own
general and small business tax rates and have some discretion over the choice of tax credits.
Where corporations operate in more than one province, the tax base is allocated among provinces
for tax purposes by an allocation formula that gives equal weight to shares of revenues and
payrolls in each province.
Sales tax harmonization is more complicated because of the value-added nature of the
GST. Provinces that harmonize their sales taxes with the GST (the Atlantic Provinces plus
Ontario) must replace their retail sales taxes with the harmonized sales tax (HST). The HST rate
consists of the federal rate of 5% plus the rate chosen by each province. Registered sellers in
14
each province apply the relevant HST rate where the sale takes place, and firms that purchase
taxed goods can claim an input tax credit. The CRA administers the system, but does not keep
track of the amount of tax owing to each province. Instead, the allocation of HST revenues
across provinces is based on estimates of aggregate consumption in each province. Although
Quebec does not participate in the HST, the Quebec sales tax (QST) is also harmonized with the
GST. The Quebec revenue agency administers both the QST and the GST collected in the
province, and turns over revenue from the latter to the federal government. The absence of
border controls makes the QST slightly more difficult to administer for cross-border transactions,
which could have consequences for tax compliance.
The TCAs illustrate how the federal government can pursue a harmonization initiative
that the provincial governments can choose to join. Provincial choices involve a perception that
there are net benefits of joining. In the case of tax harmonization, these benefits include the
collection and compliance benefits of a harmonized system with a single tax-collecting authority
combined with the discretion to set their own tax rates. Those who choose not to join perceive
some benefit from retaining control over their tax bases despite having to collect their own taxes.
Harmonization with the GST is a more substantial reform since it requires a significant change in
the tax base, including broadening the base to include goods and services that are not taxed under
provincial retail sales taxes.
The TCAs are not without problem. Some provinces have expressed concern over the
accuracy of initial reimbursements to the provinces, given that final reconciliation of taxes
collected on their behalf occurs more than a year after the end of the tax year. There are also
concerns with the allocation formula. Corporations are able to manipulate it to some extent
through the use of affiliates in different provinces, given that they do not have to report
consolidated accounts for tax purposes. Provinces might worry that not enough attention is paid
to ensuring compliance with the allocation formula since there is nothing at stake for the federal
government. Despite these problems and limitations that the agreements have for provincial
policy discretion, no province has left the TCAs and in recent years Ontario has signed a
corporate TCA. Provinces have gradually been adopting an HST, although in British Columbia
that intention was overturned by a fractious referendum.
From the perspective of a national BIG, the tax harmonization agreements show the
feasibility of the federal government achieving harmonization voluntarily with the provinces in a
15
situation in which both levels of government have legislative jurisdiction and interests in the
policy issue. The feasibility of a BIG harmonization agreement is not an issue given that
transfers administered through the income tax system face similar compliance issues as the
income tax itself. Implementation is an issue of political will. For a harmonization scheme to
work, the federal government must assume the role of initiator with the expectation that
provinces who join would agree to accept some basic structure of a BIG in return for having
some discretion over a provincial component.
Federal-provincial tax harmonization is part of a broader system of fiscal arrangements
that have a bearing on the kind of fiscal reforms we are contemplating. The relevant elements for
our purposes are federal-provincial transfers. One of these is Equalization which makes
unconditional transfers to provinces with revenue capacity below the national average to bring
them up to the national average. This system would remain intact with our reforms. In addition,
the Canada Health Transfer (CHT) and Canada Social Transfer (CST) are equal per capita
transfers nominally in support of provincial health, social assistance and services, and post-
secondary education. They have mild conditions attached to them, but are otherwise available for
the provinces to use at their discretion. An important purpose of the transfer system is to
maintain balance in the federation, both horizontally and vertically. The CST in particular is
intended to assist the provinces in financing social assistance, and to the extent that social
assistance will be replaced by a BIG, the size of the CST would need to be revisited.
Given these considerations, we propose a feasible two-stage process for implementing a
national BIG program that could potentially address the deficiencies of the existing transfer
programs and harmonize federal and provincial transfers.
4. A Two-Stage Basic Income Guarantee Proposal
Our national BIG encompasses federal and provincial components, with each retaining some
discretion over program size in a harmonized framework. The proposal involves two stages.
Stage One involves federal reform of its transfers to a federal BIG, taking as given existing
provincial policies. Stage Two explores individual provincial BIG choices analogous to
negotiating tax harmonization agreements with the federal government. This latter stage could
involve many alternative templates involving the nature of provincial discretion and the
rebalancing of federal-provincial fiscal arrangements. Our proposal will be somewhat general,
16
leaving full details to be worked out later, although we mention many aspects that would need to
be considered.
4.1 Stage One: A Federal BIG
The first stage is contingent on the preferred parameters of a national BIG, including a BIG level
and a tax-back schedule. The BIG level could, like the LICO, vary by family composition and
size of community, and by personal circumstances, such as disability. To keep matters simple,
suppose that a common annual level is chosen, say, $20,000 per single adult, and $6,000 per
child. The adult BIG is adjusted to take account of family size using standard family equivalence
scales. Following OECD (2008) and Statistics Canada (2016), we adopt the square-root scale: a
two-adult family receives $20,000 times √2, a three-adult family $20,000 times √3, and so on, in
addition to what they receive on behalf of children. (As discussed below, the CCB serves as the
BIG for children, with no family size adjustment.) These amounts represent the benchmark
national BIG. In Stage One, the federal government chooses BIG levels less than the national
benchmark, given that when provinces agree to join they will implement provincial supplements.
The tax-back schedule could be uniform or piecewise linear and could vary by income.
For simplicity, we use a constant tax-back rate, 30% in our numerical example. The tax-back
rate applies to family net income, comparable to many existing tax credits. The choice of a tax-
back rate affects the income level at which the BIG disappears as well as labour market
participation and work effort incentives. To promote labour force participation, the tax-back rate
could be zero for some initial income range and positive thereafter, as in one option proposed by
Simpson and Stevens (2015).
Stage One is based on the principle that all individuals are brought up to at least the
federal BIG level taking into account provincial welfare and disability transfers. (Provincial
RTCs and NRTCs will be used to finance the provincial BIG component.) Welfare and disability
recipients receive the federal BIG less an amount reflecting these provincial transfers, while the
federal BIG applies to all others. There are four main issues with implementing this.
1. The first is how to deal with the fact that provinces offer different levels of support.
Simply topping up provincial welfare and disability transfers to the federal BIG level
would be problematic. It would give provinces an incentive to reduce their transfer
rates, and, by undoing differences in provincial rates, nullify provincial preferences.
To mitigate the incentive problem and preserve provincial discretion, national
17
average provincial transfer rates would be calculated for welfare and disability
assistance. The calculation could be done for the different categories of recipients by
family type and would be weighted by the number of recipients in each province. The
BIG transfer to persons in each category would be the basic federal BIG less the
relevant national average provincial welfare or disability transfer. Welfare or
disability recipients in any given category would receive the same federal BIG top-up
but different overall amounts in different provinces. Basing the federal BIG on
national average provincial transfer rates mitigates the incentive the provinces would
otherwise have to reduce their transfers in expectation of the federal top-up making
up the difference. All other persons would receive the full federal BIG. The BIG
transfer would be taxed-back based on net income as defined for tax purposes, which
includes taxable transfers like EI and CPP/QPP. However, it would exclude
provincial social assistance transfers, so would differ from the base used for the
income tax schedule. The effective marginal tax rates would be the sum of the tax-
back rate and the marginal income tax rate. Note that provinces also apply varying
tax-back rates to employment income earned by welfare and disability recipients.
Since the BIG tax-back rate excludes provincial welfare and disability transfers, the
BIG tax-back rate and the provincial welfare/disability tax back rates are not both
applied to the same earnings.
2. The second is how to finance the federal BIG. This would largely be done by
eliminating existing federal transfers, including OAS/GIS, RTCs like the CCB, the
GST Credit and WITB, and most NRTCs, with the possible exception of those
intended to achieve non-redistributive objectives like credits for charitable donations
and political contributions. Only federal tax credits would be eliminated in Stage One
since no unilateral changes are made to provincial fiscal programs. Shortfalls in
financing would have to be made up from other revenue sources. Eliminating
OAS/GIS and the CCB when the federal BIG is introduced might be controversial
and perhaps not necessary. Some elderly persons could be made worse off by the
reform, although this might be managed during the transition. And, the CCB is
roughly comparable to the proposed BIG for children. Leaving seniors and children
out of a national BIG detracts from the comprehensiveness of the program, and that
18
would not be desirable in the long run. In our illustration below, we keep the CCB in
place for simplicity, but replace OAS and GIS with our national BIG.
3. The third issue is the size of the federal BIG. Given that provincial RTCs and NRTCs
remain in place in Stage One, they will be available to finance the provincial
component of a national BIG in Stage Two. This means that the basic federal BIG can
be correspondingly less than $20,000 per single adult and $6,000 per child. How
much less depends upon the amount of revenue that is freed up for the provinces
when they eliminate their tax credits. In our illustrative calculation below, we
determine the federal BIG by first estimating the total tax expenditures of federal and
provincial NRTCs and RTCs. The federal BIG is then $20,000 times the federal share
of total NRTCs and RTCs. A further adjustment in the federal BIG is needed to take
account of the fact that the federal government assumes primary responsibility for
transfers to seniors through OAS/GIS. To recognize this and to prevent seniors from
suffering in Stage One, we assume the federal government offers the full national
BIG to seniors in Stage One and continues to do so in Stage Two.
4. The fourth issue in implementing Stage One is that the provinces might undo the
effect of the federal BIG by reducing their welfare and disability transfers. The
federal government cannot require provinces to maintain the integrity of their transfer
programs when a federal BIG is introduced. At best it can appeal to the provinces to
keep their programs intact and only dismantle them in Stage Two. The force of this
appeal is strengthened if the federal BIG does not tax-back provincial transfers, and if
the generosity of the CST system is retained. But, the good will of the provinces must
be relied on. There is precedent for this. When the CCB was introduced by the federal
government in 2016, the provinces and territories voluntarily agreed that the CCB
would not be clawed back from welfare or disability payments. One would hope for a
similar reaction if a federal BIG is implemented.
The federal BIG would be administered by the CRA based on tax returns filed. Like
existing RFCs, the entitlement to a BIG would be based on the previous year’s tax return and
recalculated each July. Since provincial tax and transfer programs would remain intact in Stage
One, provincial finances would not be affected when the BIG is introduced. Vertical balance
19
would not be affected, so there would be no need to adjust federal-provincial transfers. This issue
becomes relevant in Stage Two when provinces adopt harmonized BIG.
4.2 Stage Two: Provincial Harmonization
Once a federal BIG is in place, provinces would be invited to join. Those who chose to join
would negotiate a bilateral national BIG (NBIG) agreement with the federal government. The
basic structure of the NBIG would be based on the federal one, but provinces would have
discretion over the size of their component. A common tax-back rate would apply initially,
although in the long run there might be some flexibility for province-specific tax-back rates.
Provinces participating in a NBIG would replace their social assistance and disability
transfers with a provincial BIG, where the NBIG would be the sum of the federal BIG and the
province’s chosen BIG level. The provincial BIG would be financed by eliminating their RFCs
and NRFCs. Provincial social services would remain in place and would be conditioned on
something other than social assistance or disability status. There would only be a single uniform
provincial BIG with no distinction between welfare recipients and others. Provinces may choose
to offer a higher provincial BIG rate to the disabled, in which case eligibility criteria for that
would still apply.
The NBIG would be administered through the income tax system by the CRA rather than
by individual provinces. Some mechanism would be required to recover from the provinces their
shares of the NBIG. One option would be to do that through a revised CST, the currently equal
per capita federal transfer in support of provincial social assistance, social services and post-
secondary education. The CST could be reduced for participating provinces by the size of the
provincial component of the NBIG, since the latter would be paid for by the federal government
through the CRA.
5. An Illustrative Calculation
To illustrate the feasibility of implementing our proposed national BIG, we use Statistics
Canada’s Social Policy Simulation Database and Model (SPSD/M Version 22.1). The SPSD/M
is a vast repository of detailed information regarding the federal and provincial tax and transfer
systems. It combines individual data from personal income tax returns, the Survey of Labour and
Income Dynamics, unemployment and claimant histories and the Survey of Household
Spending, excluding residents of the Yukon, Nunavut, the Northwest Territories and First Nation
20
reservations, and armed forces personnel residing in barracks. The SPSD/M is static, so cannot
simulate behavioural responses to policy alterations without further assumptions. Despite this,
the SPSD/M is particularly well-suited for this paper given its highly detailed depiction of the
Canadian tax-transfer system.
Simpson and Stevens (2015) use the SPSD/M to examine the impact of converting all
federal NRTCs into RTCs, which are then subject to a common clawback rate. While we follow
their methodology, the scope of their proposed reform is quite different from ours since the level
of income guarantee it is not substantial enough to represent a reasonable BIG. Also, they
consider only federal tax credit reforms and not provincial ones. In this section, we extend the
Simpson and Stevens (2015) approach to a BIG setting in a federal context.6
We first describe the effects of the two-stage implementation of BIG ignoring labour
supply responses. Subsequently, we introduce the latter.
5.1 Implementing Federal and Provincial BIGs
Stage One involves eliminating the following federal NRTCs and RTCs: basic personal amount,
age, married, married equivalent, employment, public transit, fitness, pension income, dependent
caregiver, disability, all education credits, the family tax cut, family caregiver and infirm
dependents, GST credit and WITB. Those credits that are contributory and not redistributive in
nature (CPP, EI, political and charitable tax credits) are kept; OAS and GIS are also removed.
The elimination of all tax credits as well as OAS/GIS is for simplicity. Similar results would be
obtained if only the basic personal amount were eliminated and all other credits remained intact.
The basic personal amount represents over three-quarters of all NRTCs, while OAS/GIS serves
as a basic income for seniors. BIG is delivered to adults based on an adult-only family
equivalence scale. Our proposal retains the CCB, which functions as a BIG for individuals under
18 years of age.
The federal BIG is calculated as $20,000 times the share of federal transfers relative to
provincial ones. The total value of federal NRTCs, RTCs and OAS/GIS is $106.74 billion, while
the value of provincial NRTCs and RTCs is $42.31 billion. Therefore, the federal share of
transfers eliminated is 71.6%, so that the federal BIG is $14,322 (0.7161 times $20,000). This
applies to non-senior adults in all provinces who are in one-adult families and do not receive
social assistance or disability benefits. For the latter, the amount of the federal BIG is $14,322
less the average value of those benefits for various categories of persons. Table 1 indicates these
21
amounts. For families with two adults, the total federal BIG for all adults is √2 times $14,322, or
$20,251, while for three-adult families, it is $24,806. For seniors, the federal BIG is $20,000
adjusted by adult-equivalence scales.
The tax-back rate is chosen such that the reform is roughly self-financing. The values of
federal transfers eliminated are more than sufficient to ensure that the federal BIG is self-
financing at a 30% tax-back rate. The tax-back rate applies to family net income (excluding
welfare and disability transfers) until the guarantee reaches zero. The excess of financing (around
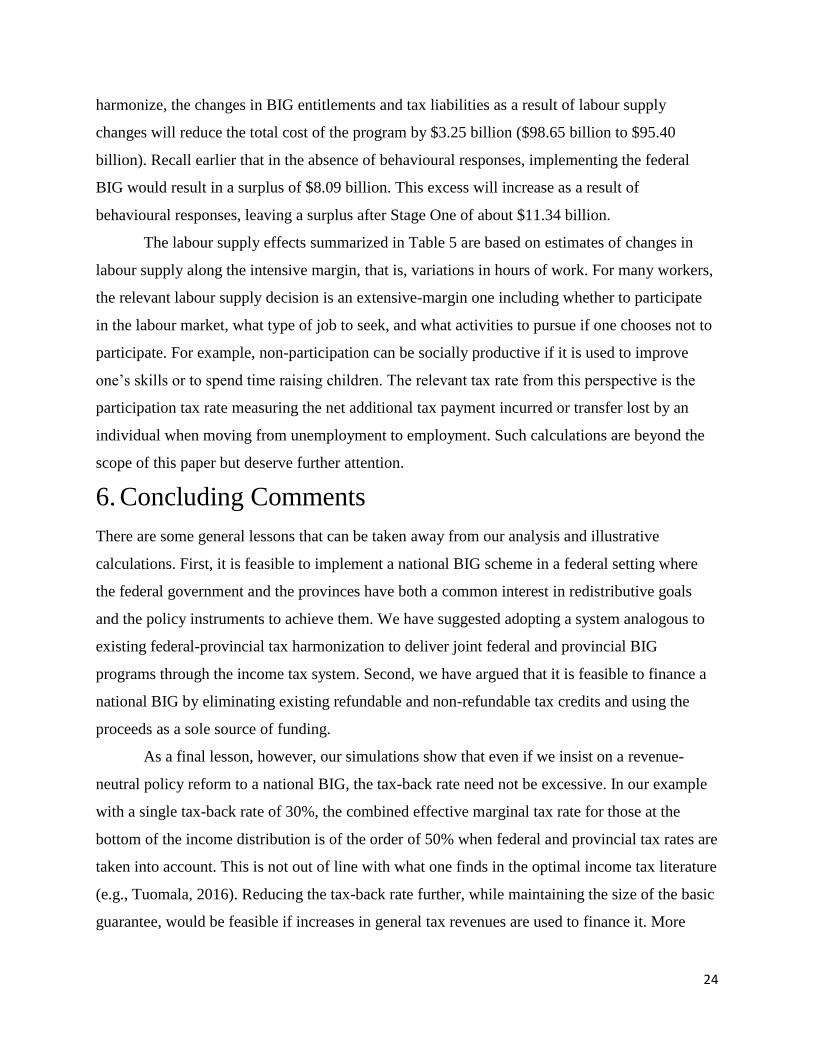
$8.09B) is prudent given the labour supply responses that we estimate below. As Table 1
indicates, with a tax-back rate of 30%, the federal BIG is phased out for single non-senior adult
non-welfare recipients at a net income of $47,740, which is lower than the income at which
existing refundable tax credits and the OAS/GIS disappear.
In Stage Two, provinces would be invited to harmonize their transfer systems with the
federal BIG. Those choosing to harmonize would take two steps. First, they would eliminate
their welfare and disability transfers, and previous social assistance recipients would receive the
standard federal BIG. Second, they would eliminate their NRTCs and RTCs to harmonize their
income tax systems with the federal government’s, and would choose their own provincial BIGs
to supplement the federal BIG. The provinces could choose their own BIG levels, but the 30%
tax-back rate would apply.
In the absence of behavioural responses, substituting a federal BIG for most federal RTCs
and NRTCs and substituting a provincial BIG for provincial RTCs, NRTCs and social assistance
amounts to pure income redistribution. Tables 2 and 3 illustrate the redistributive effects of these
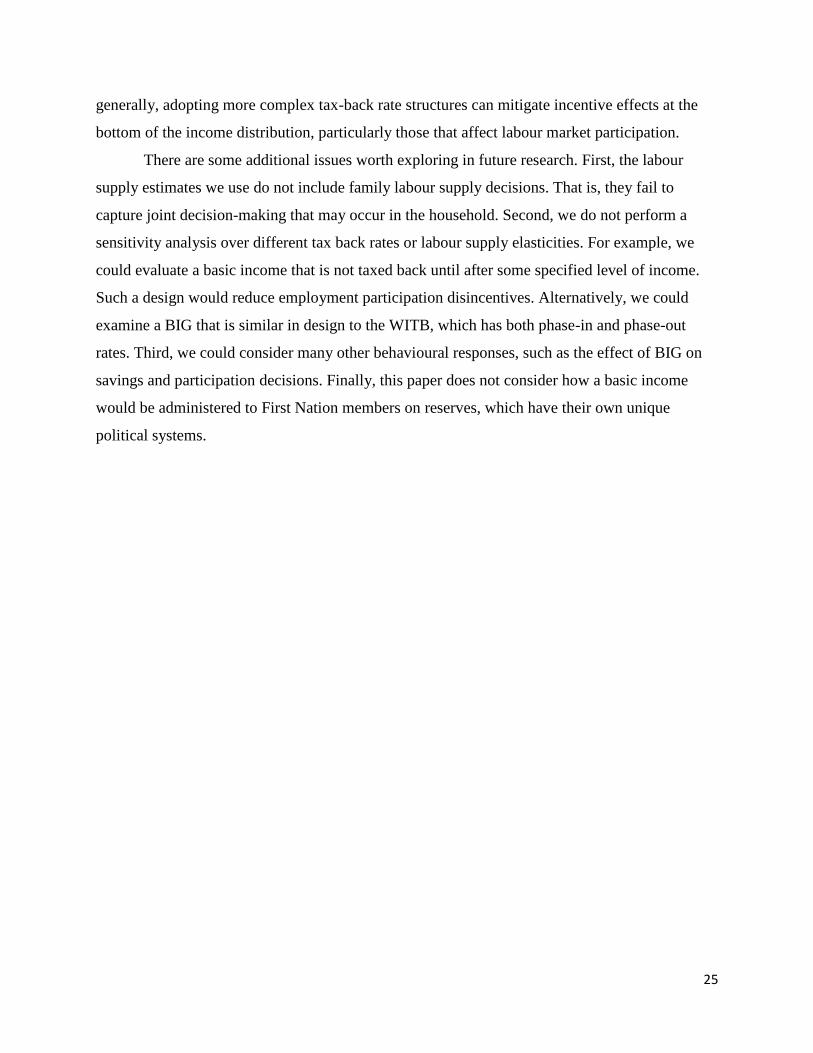
two stages. In Table 2, the average change in family disposable income for persons in each decile
of the net income distribution are shown in absolute and percentage terms. Here, deciles are
based on family-types according to family net income, and do not change when the federal BIG
is introduced.
Not surprisingly, gains decrease as one goes up the decile groups, except for the top two
deciles. Those in the bottom decile reap an average gain of 167% in disposable income over the
two stages, while the top group loses 5.39% on average. The changes follow the same pattern in
Stage One, but are proportionately less. The losses at the top are all due to eliminating the
benefits of tax credits, and these are relatively uniform in absolute terms in the top five deciles.
Only the bottom half of the population in terms of net income obtain some BIG transfer, and that
22
diminishes as income increases. Note that the average change in disposable incomes is negligible
overall, reflecting the fact the revenues raised roughly cover the cost of providing the BIG.
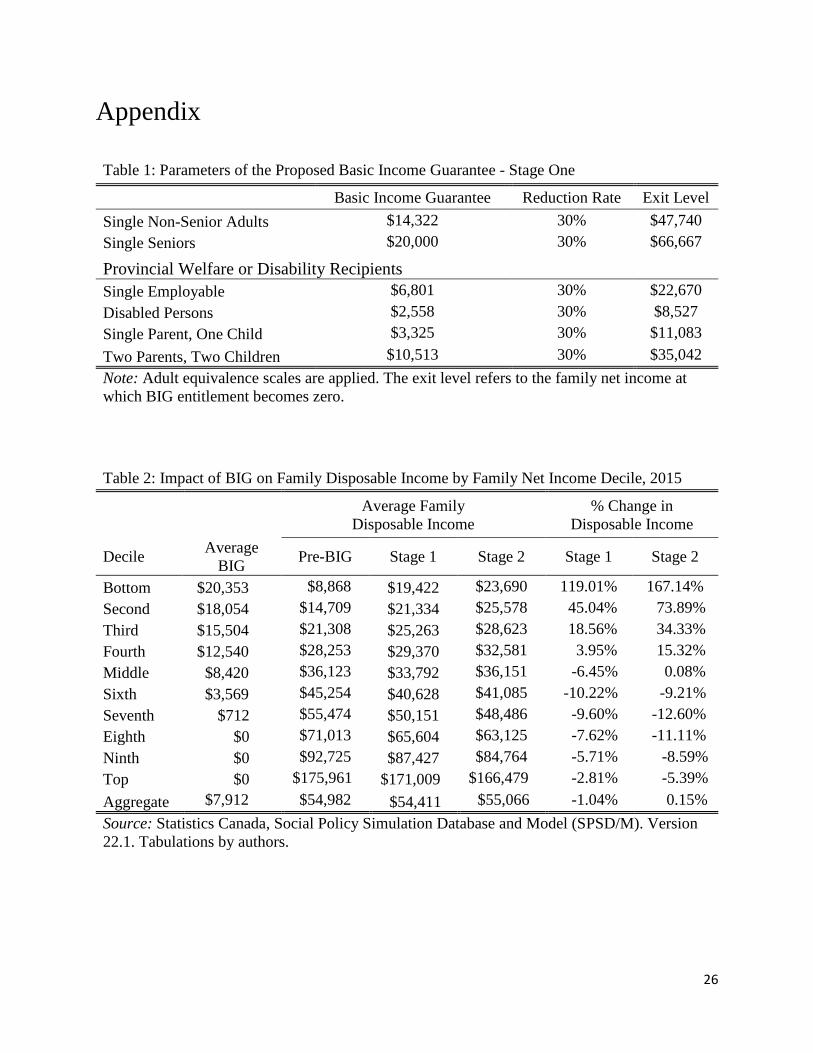
Table 3 focuses on families in the bottom decile of the net income distribution of all
persons, and shows how the gains from the federal and national BIGs vary by family type within
this decile. On average, each of the different family groups appear to benefit quite a bit from the
basic income. Of particular note is the fact that elderly single persons and single parents gain the
least. This is because they fare relatively well under existing programs, especially the elderly.
Indeed, some elderly OAS/GIS recipients may be worse off as a result of the federal BIG reform
since their initial disposable income exceeds the federal BIG. To the extent that this is a concern,
program design would have to address it in a further refinement.
Table 4 shows how poverty and income distribution measures are affected by the BIG
reform. The poverty level is taken to be the after-tax LICO amount for various family types. The
rate of poverty is the proportion of the relevant population below that level. The rate of poverty
falls significantly for all groups except senior couples, and the average poverty rate falls by 73%.
The rate of poverty rises to 6.1% for senior couples who had the lowest poverty rate before the
Stage One reform, which is a cause for concern to be addressed. A similar picture emerges for
changes in the Gini Coefficients, which are based on disposable income. As the last row
indicates, the Gini Coefficient falls by almost 10% in Stage One and over 17% in both stages.
This indicates that inequality has been reduced significantly.
The implementation of the national BIG would be roughly revenue-neutral. The overall
cost of BIG would be $162.84 billion, of which $98.65 billion is in Stage One. Revenues from
eliminating federal and provincial transfers would be $162.25 billion, of which $106.74 billion is
federal, leaving a budget deficit of only $0.59 billion.
5.2 Labour Supply Responses
The above redistributive effects include only the impact effects of the policy change and ignore
behavioural responses. The replacement of RTCs, NRTCs and social assistance with the national
BIG will change both income levels and effective marginal tax rates (EMTR) on income. These
will affect labour supply through standard income and substitution effects. Higher income groups
will face a reduction in income and this will encourage an increase in labour supply. By the same
token, those in the lower part of the income distribution will obtain higher incomes and this will
discourage work.
23
The substitution effect is more complex. In 2015, the first $45,282 of taxable income was
subject to a federal tax rate of 15% and provincial tax rates of approximately 5%. The
introduction of BIG will increase the EMTR in this bracket to 50%. This is relatively large and
has the potential to significantly distort labour decisions. Because the exit level of BIG is roughly
$48,000, mainly individuals in this bracket will face the higher EMTR. For those who do not
receive any BIG, their EMTR will be unaffected. In addition, since most of the RTCs and
NRTCs as well as OAS/GIS being eliminated are also clawed back, the EMTR before the BIG is
introduced will be higher than the statutory marginal tax rate for many taxpayers. However,
given the variability of NRTCs and RTCs, an illustrative calculation capturing the change in
EMTRs after their removal is too difficult to estimate so we ignore it. In estimating substitution
effects from introducing the BIG, we therefore assume that the EMTR rises from 15% to 50%
for BIG recipients, but remains unchanged for non-recipients. This will induce lower-income
persons to reduce their labour supply, thus reinforcing the income effect. For higher income
persons, there is no substitution effect so their labour supply should unambiguously increase.
To estimate the behavioural impacts of the BIG, we follow the methodology of Simpson
and Stevens (2015). Changes in labour supply will depend on substitution and income
elasticities. Based on a recent survey of academic work by McClelland and Mok (2012),
Simpson and Stevens assume that income elasticities for both men and women are 0.05, while
substitution elasticities are 0.2 for men and single women, and 0.3 for married women. The
percentage change in earnings from the income effect is the income elasticity times the
percentage change in disposable income.. That due to the substitution effect is the substitution
elasticity by the percentage change in the after-EMTR wage rate.7
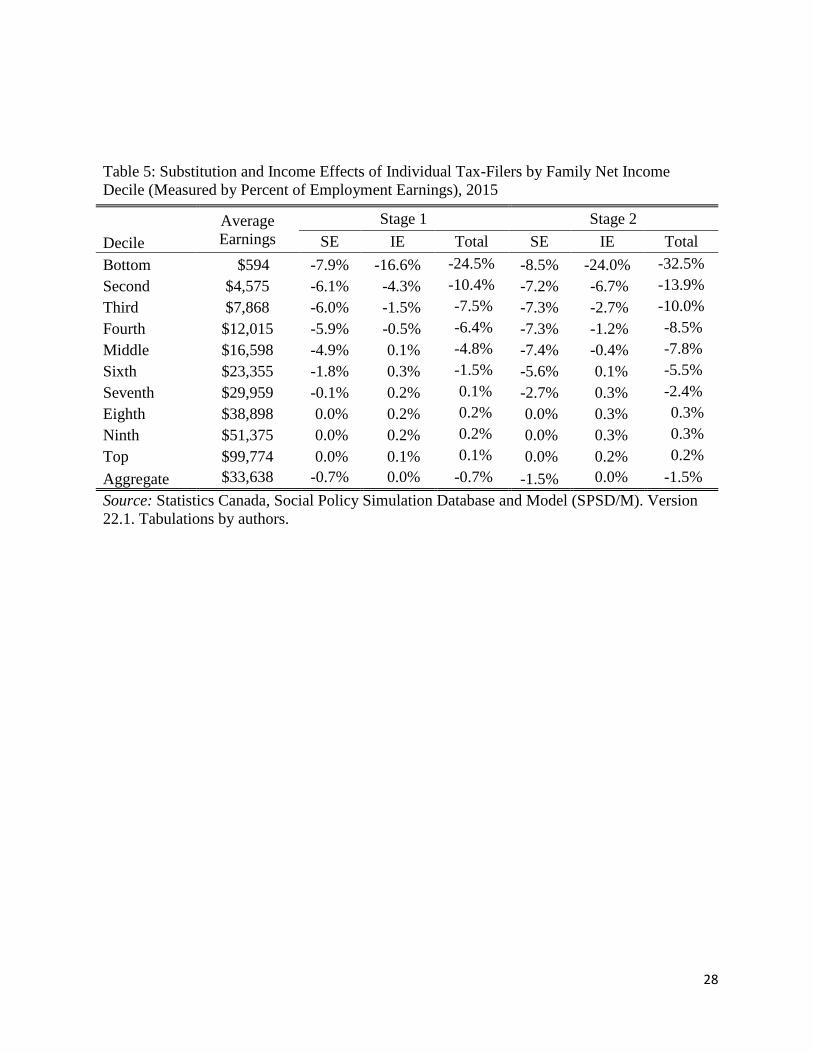
Table 5 shows that the combination of Stages One and Two causes labour supply, and
therefore earnings, to fall in the bottom seven deciles, especially in the lower deciles. Earnings
rise moderately in the top three deciles, so overall earnings fall by only $492, or 1.5%. This is
entirely due to the substitution effect since the income effect is zero on average. The change in
labour supply induces changes in BIG expenditures as well as changes in income tax revenues.
Overall, the reduction in labour supply causes the cost of the national BIG reform to rise to from
$162.84 billion to $167.69 billion, resulting in an overall budget deficit of $5.44 billion. This is
the additional amount of revenues that would have to be raised to finance the national BIG, and
is relatively modest. If only a federal BIG is implemented and the provinces choose not to
24
harmonize, the changes in BIG entitlements and tax liabilities as a result of labour supply
changes will reduce the total cost of the program by $3.25 billion ($98.65 billion to $95.40
billion). Recall earlier that in the absence of behavioural responses, implementing the federal
BIG would result in a surplus of $8.09 billion. This excess will increase as a result of
behavioural responses, leaving a surplus after Stage One of about $11.34 billion.
The labour supply effects summarized in Table 5 are based on estimates of changes in
labour supply along the intensive margin, that is, variations in hours of work. For many workers,
the relevant labour supply decision is an extensive-margin one including whether to participate
in the labour market, what type of job to seek, and what activities to pursue if one chooses not to
participate. For example, non-participation can be socially productive if it is used to improve
one’s skills or to spend time raising children. The relevant tax rate from this perspective is the
participation tax rate measuring the net additional tax payment incurred or transfer lost by an
individual when moving from unemployment to employment. Such calculations are beyond the
scope of this paper but deserve further attention.
6. Concluding Comments
There are some general lessons that can be taken away from our analysis and illustrative
calculations. First, it is feasible to implement a national BIG scheme in a federal setting where
the federal government and the provinces have both a common interest in redistributive goals
and the policy instruments to achieve them. We have suggested adopting a system analogous to
existing federal-provincial tax harmonization to deliver joint federal and provincial BIG
programs through the income tax system. Second, we have argued that it is feasible to finance a
national BIG by eliminating existing refundable and non-refundable tax credits and using the
proceeds as a sole source of funding.
As a final lesson, however, our simulations show that even if we insist on a revenue-
neutral policy reform to a national BIG, the tax-back rate need not be excessive. In our example
with a single tax-back rate of 30%, the combined effective marginal tax rate for those at the
bottom of the income distribution is of the order of 50% when federal and provincial tax rates are
taken into account. This is not out of line with what one finds in the optimal income tax literature
(e.g., Tuomala, 2016). Reducing the tax-back rate further, while maintaining the size of the basic
guarantee, would be feasible if increases in general tax revenues are used to finance it. More
25
generally, adopting more complex tax-back rate structures can mitigate incentive effects at the
bottom of the income distribution, particularly those that affect labour market participation.
There are some additional issues worth exploring in future research. First, the labour
supply estimates we use do not include family labour supply decisions. That is, they fail to
capture joint decision-making that may occur in the household. Second, we do not perform a
sensitivity analysis over different tax back rates or labour supply elasticities. For example, we
could evaluate a basic income that is not taxed back until after some specified level of income.
Such a design would reduce employment participation disincentives. Alternatively, we could
examine a BIG that is similar in design to the WITB, which has both phase-in and phase-out
rates. Third, we could consider many other behavioural responses, such as the effect of BIG on
savings and participation decisions. Finally, this paper does not consider how a basic income
would be administered to First Nation members on reserves, which have their own unique
political systems.
26
Appendix
Table 1: Parameters of the Proposed Basic Income Guarantee - Stage One
Basic Income Guarantee Reduction Rate Exit Level
Single Non-Senior Adults $14,322 30% $47,740
Single Seniors $20,000 30% $66,667
Provincial Welfare or Disability Recipients
Single Employable $6,801 30% $22,670
Disabled Persons $2,558 30% $8,527
Single Parent, One Child $3,325 30% $11,083
Two Parents, Two Children $10,513 30% $35,042
Note: Adult equivalence scales are applied. The exit level refers to the family net income at
which BIG entitlement becomes zero.
Table 2: Impact of BIG on Family Disposable Income by Family Net Income Decile, 2015
Average Family
Disposable Income
% Change in
Disposable Income
Decile Average
BIG Pre-BIG Stage 1 Stage 2 Stage 1 Stage 2
Bottom $20,353 $8,868 $19,422 $23,690 119.01% 167.14%
Second $18,054 $14,709 $21,334 $25,578 45.04% 73.89%
Third $15,504 $21,308 $25,263 $28,623 18.56% 34.33%
Fourth $12,540 $28,253 $29,370 $32,581 3.95% 15.32%
Middle $8,420 $36,123 $33,792 $36,151 -6.45% 0.08%
Sixth $3,569 $45,254 $40,628 $41,085 -10.22% -9.21%
Seventh $712 $55,474 $50,151 $48,486 -9.60% -12.60%
Eighth $0 $71,013 $65,604 $63,125 -7.62% -11.11%
Ninth $0 $92,725 $87,427 $84,764 -5.71% -8.59%
Top $0 $175,961 $171,009 $166,479 -2.81% -5.39%
Aggregate $7,912 $54,982 $54,411 $55,066 -1.04% 0.15%
Source: Statistics Canada, Social Policy Simulation Database and Model (SPSD/M). Version
22.1. Tabulations by authors.
27
Table 3: Average Impact of BIG on Family Disposable Income by Families Types in the
Bottom Decile, 2015
Average Family
Disposable Income
% Change in
Disposable Income
N
(000s)
Average
BIG Pre-BIG Stage 1 Stage 2 Stage 1 Stage 2
Single Parent 150 $19,871 $24,869 $29,680 $35,169 19.35% 41.42%
Two Parent 59 $27,515 $28,188 $43,384 $45,675 53.91% 62.04%
Non-Senior
Single 1,661 $19,772 $5,830 $16,855 $21,505 189.11% 268.87%
Non-Senior
Couple 65 $27,874 $14,011 $30,359 $33,135 116.68% 136.49%
Senior Single 90 $19,453 $17,700 $20,731 $21,297 17.12% 20.32%
Senior Couple 30 $27,029 $20,457 $34,623 $30,130 69.25% 47.28%
Disabled
Persons 907 $20,654 $12,843 $21,532 $24,635 67.66% 91.82%
Aggregate 2,962 $20,353 $8,868 $19,422 $23,690 119.01% 167.14%
Source: Statistics Canada, Social Policy Simulation Database and Model (SPSD/M). Version
22.1. Tabulations by authors.
Table 4: BIG Impact on Rate of Poverty and Gini Coefficient by Family Types, 2015
Rate of Poverty Gini Coefficient
Pre-
BIG
Stage
1
Stage
2 Impact
Pre-
BIG
Stage
1
Stage
2
Impact
(%)
Single Parent 15.9% 0.1% 0.1% -99.37% 0.3076 0.2782 0.2339 -23.96%
Two Parent 4.9% 1.1% 0.6% -87.76% 0.3059 0.3066 0.2992 -2.19%
Non-Senior
Single 26.0% 12.9% 4.9% -81.15% 0.4714 0.3233 0.2630 -44.21%
Non-Senior
Couple 4.3% 1.9% 0.4% -90.70% 0.3570 0.3573 0.3497 -2.04%
Senior Single 10.3% 7.9% 5.5% -46.60% 0.2919 0.2744 0.2505 -14.18%
Senior
Couple 2.3% 5.1% 6.1% 165.22% 0.3364 0.3876 0.3872 15.10%
Disabled
Persons 16.4% 9.9% 5.2% -68.29% 0.4221 0.3855 0.3554 -15.80%
Aggregate 11.9% 6.2% 3.2% -73.11% 0.4603 0.4144 0.3801 -17.42%
Source: Statistics Canada, Social Policy Simulation Database and Model (SPSD/M). Version
22.1. Tabulations by authors.
28
Table 5: Substitution and Income Effects of Individual Tax-Filers by Family Net Income
Decile (Measured by Percent of Employment Earnings), 2015
Decile
Average
Earnings
Stage 1 Stage 2
SE IE Total SE IE Total
Bottom $594 -7.9% -16.6% -24.5% -8.5% -24.0% -32.5%
Second $4,575 -6.1% -4.3% -10.4% -7.2% -6.7% -13.9%
Third $7,868 -6.0% -1.5% -7.5% -7.3% -2.7% -10.0%
Fourth $12,015 -5.9% -0.5% -6.4% -7.3% -1.2% -8.5%
Middle $16,598 -4.9% 0.1% -4.8% -7.4% -0.4% -7.8%
Sixth $23,355 -1.8% 0.3% -1.5% -5.6% 0.1% -5.5%
Seventh $29,959 -0.1% 0.2% 0.1% -2.7% 0.3% -2.4%
Eighth $38,898 0.0% 0.2% 0.2% 0.0% 0.3% 0.3%
Ninth $51,375 0.0% 0.2% 0.2% 0.0% 0.3% 0.3%
Top $99,774 0.0% 0.1% 0.1% 0.0% 0.2% 0.2%
Aggregate $33,638 -0.7% 0.0% -0.7% -1.5% 0.0% -1.5%
Source: Statistics Canada, Social Policy Simulation Database and Model (SPSD/M). Version
22.1. Tabulations by authors.
29
References
Arrow, Kenneth J. (1951), Social Choice and Individual Values (New York: Wiley).
Atkinson, Anthony B. (2015), Inequality: What can be done? (Cambridge: Harvard University
Press).
Banting, Keith and John Myles (2013), (eds.), Inequality and the Fading of Redistributive
Politics (Vancouver: UBC Press).
Boadway, Robin and Laurence Jacquet (2008), “Optimal Marginal and Average Income
Taxation under Maximin,'' Journal of Economic Theory 143, 425–41.
Commission on the Reform of Ontario's Public Services (The Drummond Report) (2012), Public
Services for Ontarians: A Path to Sustainability and Excellence (Toronto: Queen’s
Printer for Ontario).
Fleurbaey, Marc and François Maniquet (2011), A Theory of Fairness and Social Welfare (New
York: Cambridge University Press).
Forget, Evelyn L. (2011), “The Town with No Poverty: The Health Effects of a Canadian
Guaranteed Annual Income Field Experiment,” Canadian Public Policy 37(3), 283–305.
Forget, Evelyn L., Dylan Marando, Tonya Surman, and Michael Crawford Urban (2016), Pilot
Lessons: How to Design a Basic Income Pilot Project for Ontario (Toronto: Mowat
Centre).
Fortin, Nicole, Green, David A., Lemieux, Thomas, Milligan, Kevin and Riddell, W. Craig
(2012), “Canadian Inequality: Recent Developments and Policy Options,” Canadian
Public Policy 38(2), 121–145.
Himelfarb, Alex and Trish Hennessy (eds.) (2016), Basic Income: Rethinking Social Policy
(Toronto: Canadian Centre for Policy Alternatives).
Hum, Derek and Wayne Simpson (2005), “The Cost of Eliminating Poverty in Canada: Basic
Income with an Income Test Twist,” in K. Widerquist, M. Lewis, and S. Pressman (eds.),
The Ethics and Economics of the Basic Income Guarantee (Aldershot, UK: Ashgate),
282–92.
Kanbur, Ravi, Michael Keen and Matti Tuomala (1994), “Labor Supply and Targeting in Poverty
Alleviation Programs,” The World Bank Economic Review 8, 191–211.
30
Koebel, Kourtney (2016), BIG Reform: A Sensible Solution to Poverty and Inequality in Canada,
M.A. Essay, Queen’s University.
Lammam, Charles and Hugh MacIntyre (2015), The Practical Challenges of Creating a
Guaranteed Annual Income in Canada (Vancouver: The Fraser Institute).
Macdonald, David (2016), A Policymaker's Guide to Basic Income (Ottawa: Canadian Centre for
Policy Alternatives).
McClelland, Robert and Shannon Mok (2012), “A Review of Recent Research on Labor Supply
Elasticities,” Working Paper 2012–12, Congressional Budget Office, Washington.
Organisation for Economic Cooperation and Development (2008), Growing Unequal? Income
Distribution and Poverty in OECD Countries (OECD: Paris).
Rawls, J. (1971), A Theory of Justice (Oxford: Oxford University Press).
Royal Commission on the Economic Union and Development Prospects for Canada (1985)
(Macdonald Commission), Report (Ottawa: Supply and Services Canada).
Segal, Hugh (2008), “Guaranteed Annual Income: Why Milton Friedman and Bob Stanfield
Were Right.” Policy Options (April), 46–51.
Segal, Hugh (2009), “The Last Public Policy Frontier: Eliminating Poverty,” 2009 Donald Gow
Lecture, School of Public Policy, Queen’s University, unpublished.
Segal, Hugh (2016), “Finding a Better Way: A Basic Income Pilot Project for Ontario,”
discussion paper submitted to the Ontario Government.
Sen, A. K. (1985), Commodities and Capabilities, Amsterdam: North-Holland.
Simpson, Wayne and Harvey Stevens (2015), “The Impact of Converting Federal Non-
Refundable Tax Credits into Refundable Credits,” School of Public Policy Research
Papers Volume 8, Issue30, University of Calgary.
Special Senate Committee on Poverty (1971), Report of the Special Senate Committee on
Poverty (Croll Report) (Ottawa: Information Canada).
Statistics Canada (2016), Low Income Lines: What they are and how they are created, Income
Research Paper Series Ottawa: Statistics Canada)
http://www.statcan.gc.ca/pub/75f0002m/75f0002m2016002-eng.htm
Tuomala, Matti (2016), Optimal Redistributive Taxation (Oxford: Oxford University Press).
Tweddle, Anne, Ken Battle and Sherri Torjman (2015), Welfare in Canada, 2014 (Ottawa: The
Caledon Institute of Social Policy).

31
Van Parijs, Philippe (1995), Real Freedom for All (Oxford: Oxford University Press).
Young, Margot and James P. Mulvale (2009), Possibilities and Prospects: The Debate over a
Guaranteed Income (Ottawa: Canadian Centre for Policy Alternatives).
1 A more ambitious program would harmonize BIG with the income tax system so a single tax
rate schedule applies to the BIG and all other income combined as in the optimal income tax
literature. In this unified tax-transfer system, marginal tax rates would be relatively high at lower
incomes to target transfers to the least well-off.
2 With decreasing marginal utility in income, giving an additional dollar to a low-income person
increases their utility by more than giving the additional dollar to a high-income person.
3 It will not be feasible to redistribute so much that utilities are equalized. In the literature this is
precluded by an equity-efficiency trade-off resulting from the inability of the government to
identify persons by their skill. At best, incomes can be observed, and these incomes can be
affected by individuals’ behaviour.
4 More precisely, each person’s welfare is indexed by the slope of a ray through the origin that is
tangential to their utility level, that is, a virtual laissez-faire skill level. According to this index of
utility, the worst-off individuals are the most industrious ones with the lowest productivity. The
optimal redistribution scheme transfers resources to them to maximize their utility index.
5 The Drummond Report (2012) noted that in Ontario, social assistance comprised about 51% of
social program spending in 2010–11 with the remainder consisting of various social services
(Chart 8.1).
6 A preliminary version of our simulations was undertaken in Koebel (2016).
7 See appendix in Simpson and Stevens (2015) for more details.


![[ NEWSLEttER DESIGN ] Basic tips for designing newspapers€¦ · [ NEWSLEttER DESIGN ] Basic tips for designing newspapers. aRtWoRk Next to type, artwork is the next most important](https://img.pdfslide.net/doc/110x75/5f0708937e708231d41af735/-newsletter-design-basic-tips-for-designing-newsletter-design-basic-tips.jpg)