Embed Size (px)
Citation preview

Designing a Network-Based Earthquake Early Warning
Algorithm for California: ElarmS-2
by H. Serdar Kuyuk, Richard M. Allen, Holly Brown, Margaret Hellweg, Ivan Henson,and Douglas Neuhauser
Abstract The California Integrated Seismic Network (CISN) is developing anearthquake early warning (EEW) demonstration system for the state of California.Within this CISN ShakeAlert project, three algorithms are being tested, one of whichis the network-based Earthquake Alarm Systems (ElarmS) EEW system. Over the last threeyears, the ElarmS algorithms have undergone a large-scale reassessment and have beenrecoded to solve technological andmethodological challenges. The improved algorithms inthe new production-grade version of the ElarmS version 2 (referred to as ElarmS-2 or E2)code maximize the current seismic network’s configuration, hardware, and software per-formance capabilities, improving both the speed of the early warning processing and theaccuracy of the warnings. E2 is designed as a modular code and consists of a new eventmonitor module with an improved associator that allows for more rapid association withfewer triggers, while also adding several new alert filter checks that help minimize falsealarms. Here, we outline the methodology and summarize the performance of this newonline real-time system. The online performance from 2 October 2012 to 15 February2013 shows, on average, ElarmS currently issues an alert 8:68� 3:73 s after the firstP-wave detection for all events across California. This time is reduced by 2 s in regionswith dense station instrumentation. Standard deviations of magnitude, origin time are 0.4magnitude units, 1.2 s, and the median location errors is 3.8 km. E2 successfully detected26 of 29 earthquakes (MANSS >3:5) across California, while issuing two false alarms. E2is now delivering alerts to ShakeAlert, which in turn distributes warnings to test users.
Introduction
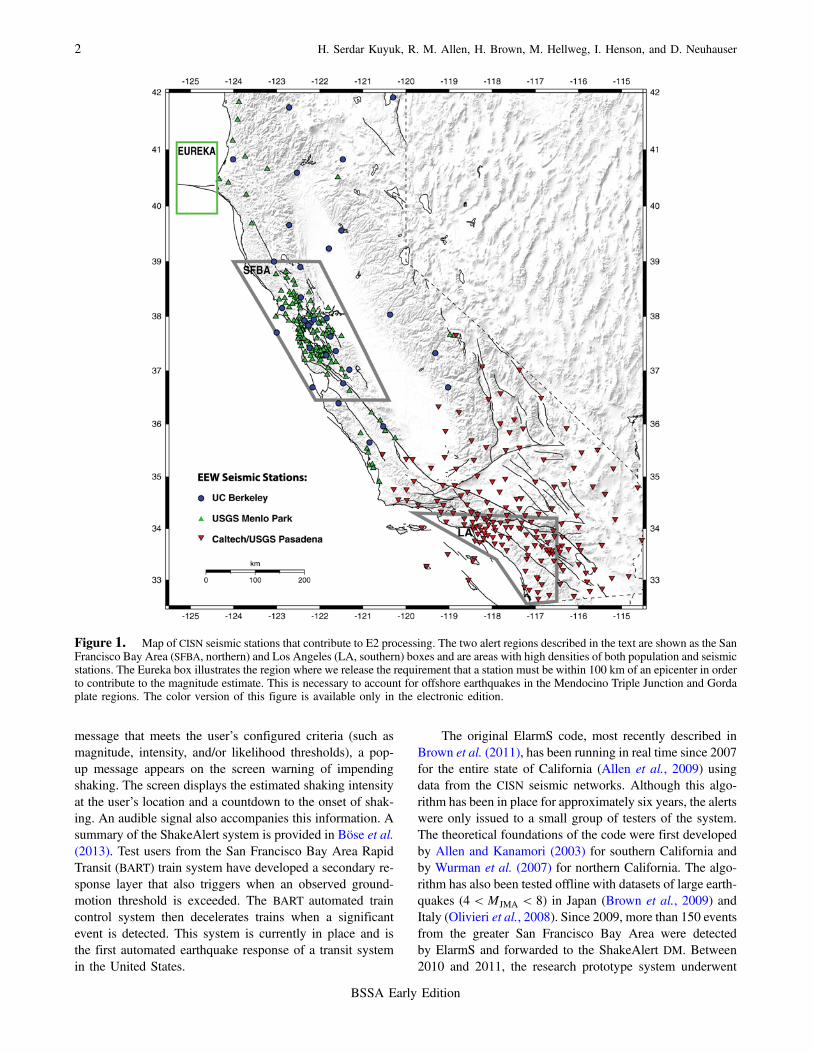
Earthquake early warning (EEW) is the concept of rec-ognizing earthquakes in progress and sending immediatealerts to surrounding population centers, ideally several sec-onds before damaging ground shaking begins (Allen, 2004,2006, 2007; Kuyuk and Allen, 2013a). Both onsite and net-work-based early warning algorithms use data from severalseismic stations near the source to rapidly estimate eventmagnitude, location, and origin time, typically from P-wavearrivals (Olson and Allen, 2005; Kuyuk and Allen, 2013b).In 2007, the California Integrated Seismic Network (CISN) em-barked on a multiyear EEW project in California. The project,named CISN ShakeAlert, is implementing, testing, and integrat-ing three distinct EEWalgorithms into a single, end-to-end pro-duction-grade system to provide warnings to test users fromindustrial, government, and corporate groups, with a view toeventually provide warnings to the general public (Böse et al.,2013). The system uses seismic data from networks across thestate (∼400 stations), which contribute to the CISN (Fig. 1).
ShakeAlert is based on three research EEW algorithms:(1) Earthquake Alarm Systems (ElarmS), developed andmaintained at the University of California Berkeley (this
article); (2) OnSite, developed and maintained at theCalifornia Institute of Technology (Böse et al., 2009); and(3) Virtual Seismologist, developed and maintained at ETHZurich (Cua et al., 2009). Each of these algorithms hasdifferentmethods of detecting thePwave, associating triggerswith events, estimating magnitude, and filtering out falsealarms. ShakeAlert combines information from all three ofthese algorithms and, through a DecisionModule (DM), it rec-ognizes when the algorithms identify the same event and pro-duces a single summary for each earthquake. This combinedevent information is sent as a single sequence of updated alertmessages across the Internet to registered test users. The threealgorithms (including ElarmS) provide source information(location, magnitude, etc.) to the DM. Source informationis then passed forward to users who use the UserDisplay(UD) to (automatically) determine the expected shaking inten-sity and time until shaking at their location.
There are a variety of ways early test users of the projectcan receive and use the alerts. The most common use at thisstage is to receive the alerts on computer desktops usingthe project’s UD software. When the UD receives an alert
BSSA Early Edition / 1
Bulletin of the Seismological Society of America, Vol. 104, No. 1, pp. –, February 2014, doi: 10.1785/0120130146
message that meets the user’s configured criteria (such asmagnitude, intensity, and/or likelihood thresholds), a pop-up message appears on the screen warning of impendingshaking. The screen displays the estimated shaking intensityat the user’s location and a countdown to the onset of shak-ing. An audible signal also accompanies this information. Asummary of the ShakeAlert system is provided in Böse et al.(2013). Test users from the San Francisco Bay Area RapidTransit (BART) train system have developed a secondary re-sponse layer that also triggers when an observed ground-motion threshold is exceeded. The BART automated traincontrol system then decelerates trains when a significantevent is detected. This system is currently in place and isthe first automated earthquake response of a transit systemin the United States.
The original ElarmS code, most recently described inBrown et al. (2011), has been running in real time since 2007for the entire state of California (Allen et al., 2009) usingdata from the CISN seismic networks. Although this algo-rithm has been in place for approximately six years, the alertswere only issued to a small group of testers of the system.The theoretical foundations of the code were first developedby Allen and Kanamori (2003) for southern California andby Wurman et al. (2007) for northern California. The algo-rithm has also been tested offline with datasets of large earth-quakes (4 < MJMA < 8) in Japan (Brown et al., 2009) andItaly (Olivieri et al., 2008). Since 2009, more than 150 eventsfrom the greater San Francisco Bay Area were detectedby ElarmS and forwarded to the ShakeAlert DM. Between2010 and 2011, the research prototype system underwent
Figure 1. Map of CISN seismic stations that contribute to E2 processing. The two alert regions described in the text are shown as the SanFrancisco Bay Area (SFBA, northern) and Los Angeles (LA, southern) boxes and are areas with high densities of both population and seismicstations. The Eureka box illustrates the region where we release the requirement that a station must be within 100 km of an epicenter in orderto contribute to the magnitude estimate. This is necessary to account for offshore earthquakes in the Mendocino Triple Junction and Gordaplate regions. The color version of this figure is available only in the electronic edition.
2 H. Serdar Kuyuk, R. M. Allen, H. Brown, M. Hellweg, I. Henson, and D. Neuhauser
BSSA Early Edition

a complete rewrite and rebuild. Existing processing elementshave been rewritten to become a streamlined productioncode, and we have developed new algorithms to improve per-formance. In early 2012, the second-generation ElarmS sys-tem replaced the first-generation code as the authoritativeversion reporting to the ShakeAlert DM. This new versionof the algorithm detects and sends alert information for allCalifornia earthquakes. In this article, we describe the sig-nificant methodology and code development and the perfor-mance of ElarmS version 2 (referred to as ElarmS-2 or E2)that is now in operation in California.
ElarmS-2 Methodology
The E2 code is designed specifically to maximize thecurrent network, hardware, and software performance capa-bilities by improving both the speed and accuracy of earlywarning processing. E2 is written in C++, which, comparedwith the previous scripting language (FORTRAN), improvesprocessing speed and takes advantage of the power of the
networking environment. In addition, the speed of data trans-mission recently has increased. Many of the data loggers atthe seismic stations of the CISN’s networks were replacedwith funding through the recent American Recovery and Re-investment Act (ARRA). These stations can now send data in1 s packets to the waveform processing (WP) centers; this isan improvement over the previous system, in which packettransmissions could take several seconds. Since April 2012(for the UC Berkeley [BK] network) and August 2012 (forthe Southern California Seismic Network [CI] network),these data are now processed directly, shaving up to 6 s fromalert times.
E2 consists of a new WP module and a new event mon-itor (EM) module, plus several new alert filters that checkeach event just prior to forwarding alerts to the DM. Thenew modular code design of E2 makes it easy to upgradeindividual elements of the algorithm (location, magnitude,etc.) at any time, without disrupting the processing stream(Fig. 2). E2 now also has a replay capability, allowing usto compare results from new algorithms or components with
Figure 2. Processing flow for E2. Station waveform feeds are processed at the three CISN network hubs, UC Berkeley, Caltech, andMenlo Park. P-wave triggers, amplitudes, frequencies, and other parameters are generated at the three processing centers and forwarded to asingle, statewide trigger pool and event monitor running at UC Berkeley. After a quality check of new triggers, association is first attemptedwith existing events based on the trigger time falling within a defined space–time window. If new triggers cannot be associated with existingevents, the associator attempts to create a new event based on the space–time proximity of unassociated triggers. If three or more triggers areclose in space and time, a new event is created. New or modified events are then located using the arrival times and a simple grid-searchalgorithm. Magnitude is then estimated. A split-event filter checks that the triggers from a single event have not been split into two events (i.e.,two or more events within a small space–time window), in which case one is deleted and the triggers are returned to the trigger pool. An alertfilter continuously checks the event pool to identify any events that pass another set of criteria and can be published to the ShakeAlert DM.Currently, event alerts are only published to test users.
Designing a Network-Based Earthquake Early Warning Algorithm for California: ElarmS-2 3
BSSA Early Edition

past performance and thereby to optimize configurationchanges. The replay capability is key to improving thesystem, and modules within the E2 algorithms have beenupdated several times (Table 1). The latest version, E2.3.2,has been operational since 22 January 2013.
Waveform Processing
The new WP module is currently operating at the threeCISN network hubs (UC Berkeley, Caltech, and the U.S.Geological Survey [USGS] at Menlo Park). At each of theselocations, WP processes individual data streams as they ar-rive from the seismic stations. The WP has been redesignedso that it can read and process smaller packets of waveformdata, and it can now send the resulting parameters morepromptly to the EM, which runs at UC Berkeley (Fig. 2). WPprocesses waveforms in 1 s segments. To allow monitoringof data quality for all stations and channels, the maximumvalues of displacement, velocity, and acceleration in eachsecond are sent to E2. These ground-motion parameters arebundled together into packets containing up to 50 channels.Event detection is based on a set of trigger parameters. Whenthe short-term-average to long-term-average trigger thresh-old is exceeded, the station information and trigger timeare packaged into a trigger packet containing network, sta-tion, channel, location code, station latitude and longitude,and trigger time. This packet is immediately forwarded to
the EM. During the 4 s following the P-wave trigger time,parameters providing information on the frequency contentof the P wave (τmax
p ) and on the peak displacement (Pd) andpeak velocity (Pv) amplitude are computed every 0.1 s andforwarded to the EM. More information on the determinationof these parameters is found in Brown et al. (2011).
An Apache ActiveMQ server running at UC Berkeleyhandles communication between the WP centers and theEM at Berkeley. The WP clients send compressed binarymessages via the Java Message Service API to the ActiveMQmessage broker, which provides a publish–subscribe mes-sage environment for E2 and any other message-receivingclients. E2 and all WP programs send heartbeat messagesevery 5 s to the message broker at UC Berkeley. Thesemessages are logged in a file and received by a monitoringprogram that provides state-of-health information to clients,such as the CISN ShakeAlert UD.
Event Monitor
The second component of E2 is the EM (Fig. 2). Its maintasks are to associate P-wave triggers in order to identifyearthquakes in progress, characterize the source, and to filterout false events. The EM consists of a C++ code designed forefficiency, a revised trigger associator, and a new alert filter,which verifies each event before sending an alert to the DMfor release to test users. Additional improvements include
Table 1Modifications to the Various Versions of E2
E2 E2.1 E2.2 E2.3 E2.3.1 E2.3.2
12–26 April 2012 27–30April 2012
1 May–28August 2012
28 August–01October 2012
02 October 2012–22January 2013
22 January 2013–present
1 s packet BK implementation CI implementationWP WP2 and heartbeats
implementedData packetsprocessedimmediately (notwaiting for integersecond)
Association Relocation ofepicenter inintegrated intoassociationalgorithm
Association of triggersup to 1500 kmequation (1)implemented
Trigger pool updated
Magnitude* nCA: MTp,MPdsCA: MPd
Networkmagnitudecorrection
Eureka magnitudebox
nCA: MPdsCA:MPd
Location 2 km gridimplemented
5 km approximationcombined with2 km exact grid
Rejection ifepicenter ison edge of grid
AlertCriteria
50% of stationswithin distance ofmost distanttrigger must havetriggered; fourstation triggersrequired
Linearteleseismicfilteringimplemented
40% of station musthave triggered; still4 stations required
Break out ofassociation and goto alert if 10 stationshave triggered
*nCA, northern California; sCA, southern California; MTp, magnitude estimated from TauPmax; MPd, magnitude estimated from Pd.
4 H. Serdar Kuyuk, R. M. Allen, H. Brown, M. Hellweg, I. Henson, and D. Neuhauser
BSSA Early Edition

trigger and event pools. The EM can handle multiple eventsin the event pool at the same time. Currently, there is onlyone EM running at UC Berkeley, but the modular design al-lows for multiple EMs to be active simultaneously. The EMoperates on data from the entire state, which it receives astrigger and ground-motion information from WP modulesat each of the three data centers.
Before association, the quality of each trigger is evalu-ated. For example, the signal-to-noise ratio must be greaterthan 0.5. Also, two additional criteria must be satisfied:−5:5 < log�Pd� < 3:5 and −0:9 < log�τmax
p � < 1, in whichPd and τmax
p are in centimeters and seconds, respectively.Requiring triggers to fall in this range filters out many noisespikes. The EM can declare an event by associating just twotriggers, but the trigger criteria are more strict in this case,requiring 0:5 < log�Pd� < 3 and 0:3 < log�τmax
p � < 1. If atrigger from any channel fails to satisfy the criteria, it is sentback to the trigger pool. This iterative process continues untilboth Pd and τmax
p pass the quality checks.Next, the EM’s associator attempts to link qualified trig-
gers with existing events from the event pool. To be associ-ated, the trigger time must fall within a defined time–spacewindow (Fig. 3). New triggers are permitted to contribute anevent’s location and origin time if they are within 1500 km ofthe epicenter. This requirement prevents E2 from creatingseparate (false) events using triggers from stations far fromthe epicenter and allows the algorithm to better characterizeevents with long fault ruptures. If a qualified trigger cannotbe associated with any of the existing events, the EM at-tempts to create a new event by associating it with other trig-gers from the trigger pool. A new event can only be created ifthe trigger satisfies the equation
jtnew − tnj < Δd=VP � 3; �1�
in which jtnew − tnj is the onset time difference between thenew trigger and existing triggers in the event, Δd is the dis-tance between stations, and VP is the P-wave velocity. Thiscriterion prevents the association of triggers that are incon-sistent with a Pwave traveling between the station of the newtrigger and other stations in the event.
The new E2 associator has an additional level of eventdetection. If a new trigger cannot be associated with anexisting event, it is added to the trigger pool, which is a hop-per containing unassociated triggers. When otherwise unoc-cupied, the algorithm scans through the hopper, looking forany set of three or more triggers that can be associated into anevent based on the space–time parameters (Fig. 3 and equa-tion 1). This multitrigger event step is critical because it canidentify a large portion of California earthquakes in regionsof dense station coverage, which typically coincide with re-gions of dense population. In these regions, P-wave triggerscan occur at multiple stations in rapid succession. If thealgorithm cannot generate a multitrigger event, it scansthrough the hopper again, looking for any two triggers thatare less than 100 km apart and separated by fewer than16.5 s. Any trigger not associated with an existing event, orused to generate a new event, remains in the trigger pool. Atrigger not associated with any other events will be returnedto the trigger pool until an expiration time of 30 s is ex-ceeded, at which point the trigger is deemed anomalousand subsequently deleted from the pool.
If an event is created based on two triggers, the locatorassigns an epicenter located between them, but one-thirdcloser to the station that was triggered first. If an event isdetermined from triggers at three or more stations, the locatorestimates its position and origin time using a grid-searchalgorithm. This algorithm assesses points within a400 × 400 km grid, with grid points every 5 km, locatedat the centroid of the three stations. Each station is assumedto be located at the nearest grid point, and an approximateepicenter is estimated based on arrival-time residuals. To ob-tain a higher-resolution location, the search is repeated on a40 × 40 km grid, with 2 km grid-point spacing, based on theapproximate epicenter determined from the first cycle itera-tion. As accurate magnitude estimation relies on a good dis-tance correction factor, this location step is important to theE2 system process.
Rapid magnitude estimation is at the heart of ElarmSand is accomplished using empirically derived scaling rela-tionships between magnitude and the frequency (τmax
p ) and/ordisplacement (Pd) and velocity (Pv) amplitude content of theP waves. An empirical scaling relationship between magni-tude and τmax
p was first calibrated from a southern Californiaearthquake catalog (Fig. 4, Allen and Kanamori, 2003) andthen updated by Tsang et al. (2007). A second set of scalingrelationships, between P-wave amplitude (Pd and Pv) andmagnitude, was empirically determined for northern Califor-nia (Wurman et al., 2007). Prior to late August 2012, E2 used
0 20 40 60 80 100−5
0
5
10
15
20
25
30
Epicentral Distance (km)
Trig
ger
Tim
e (s
econ
ds a
fter
estim
ated
eve
nt o
rigin
tim
e)ElarmS-2 Association Criteria
S waveP waveE2 Association window
Figure 3. Time–space association criteria for E2. ExpectedP- and S-wave arrival times are shown as solid and dashed lines,respectively, for 8 km focal depth. If a new trigger falls withinthe E2 association time and space window (between thick solidlines), relative to an existing event, it is associated with the event,and its parameter information contributes to the event location,origin time, and magnitude.
Designing a Network-Based Earthquake Early Warning Algorithm for California: ElarmS-2 5
BSSA Early Edition

both the Pd and τmaxp relationships for northern California and
only the Pd relationship for southern California. However,since September 2012, only the Pd–magnitude relationshipis used in both parts of the state, because it provides a moreaccurate estimate of magnitude with less variation in the ab-solute error. Initially E2 only included triggered stationswithin 100 km of the epicenter to contribute to magnitudecalculations. However, this created a problem determiningthe magnitude of offshore events, particularly around theMendocino Triple Junction region, where many earthquakesare more than 100 km offshore. To avoid this problem, we donot enforce the 100 km restriction near the Mendocino TripleJunction in a region we refer to as the Eureka box (Fig. 1).
The original EM occasionally struggled with splitevents, in which the system produces two separate but simul-taneous events for a single earthquake. This occurs when asmall subset of triggers falls outside the initial associationcriteria. This can occur, for example, from a poor initialearthquake location. To avoid this problem, we define ablackout window around existing events encompassingtime–space windows of 15 s and 90 km. Before the associa-tor generates a new event, it first checks all existing events inthe blackout window. If the proposed new event epicenter is amatch with an existing event in the blackout window, theassociator cancels the new event. All triggers associated withthe canceled event are released back into the trigger pool. Inoffline reruns of past data, this simple procedure has pre-vented the creation of split events in most cases.
In the new E2, the EM has four filters that have beenadded at the end of processing and before an alert messageis sent to the DM for release. The purpose of these filters isto minimize the publication of false events. First, the eventmagnitude must be greater than 2, and the estimated epicen-ter should not be on the edge of a location grid-search area.Second, an event must have triggers contributed from at leastfour stations. Although an event can be generated internallywithin ElarmS based on triggers from only two stations, we
find the false alarm rate is significantly reduced if we requirefour stations to be associated before an alert is issued to theDM. We have also developed an artificial neural network-based approach to improve performance when only two orthree triggers are available. This method is currently underconsideration for inclusion in a future version of E2. The cur-rent E2 requires four station sites to trigger an alert ratherthan only four vertical channels (many sites have a velocityand acceleration instrument). This may seem like a minortechnicality, but the seismic network in California has manystations installations that have more than one sensor, such ascollocated accelerometers and broadband seismometers.Given this, the old requirement of triggers from four chan-nels could potentially be satisfied by just two stations, whichwe have determined are not enough to accurately determinean epicenter.
Our third filter was designed to assure that sufficient sta-tions were triggered near the epicenter prior to issuing analert message. To accomplish this, the algorithm first countsthe number of triggered stations and determines the largestsource–station distance (Dmax). Next, a circle of radius Dmax
is constructed around the earthquake epicenter, and the num-ber of stations within this circle is counted. The filter checksthat at least 40% of these stations issued trigger alerts. If thepercentage is below 40%, the event remains in the event pooluntil the 40% criteria is satisfied.
Our fourth filter discriminates between local and tele-seismic events. This filter was created to avoid false eventsfrom large-magnitude teleseisms. The initial P-wave dis-placements of large teleseismic earthquakes generally havedisplacement amplitudes similar to those of smaller localevents. The difference between the two is that waveformsfrom the local events tend to have shorter-period content(τmax
p ) than the waveforms of the teleseismic events. Thistype of filter is also used by the Onsite algorithm (Böse et al.,2009). For ElarmS, we have developed a simple linear dis-criminant based on the events’ average τmax
p and Pd (Fig. 5).
2 3 4 5 6 7 8 9−4
−3
−2
−1
0
1
2
3
Event Magnitude (from ANSS catalog)
Log 10
( P d
) (
cm)
2 3 4 5 6 7 8 9−1
−0.5
0
0.5
1
Event Magnitude (from ANSS catalog)
Log 10
(pm
ax)
(s)
Southern CaliforniaNorthern California
Southern CaliforniaNorthern California
(b)(a)
τ
Figure 4. P-wave parameters scaling relationships. Crosses and squares represent (a) displacement (Pd) and (b) P-wave frequency (τmaxp )
values from the calibration datasets in southern and northern California, respectively (modified from Brown et al., 2011). Diagonal lines arethe resulting magnitude scaling relations used by E2 to estimate event magnitudes. The color version of this figure is available only in theelectronic edition.
6 H. Serdar Kuyuk, R. M. Allen, H. Brown, M. Hellweg, I. Henson, and D. Neuhauser
BSSA Early Edition
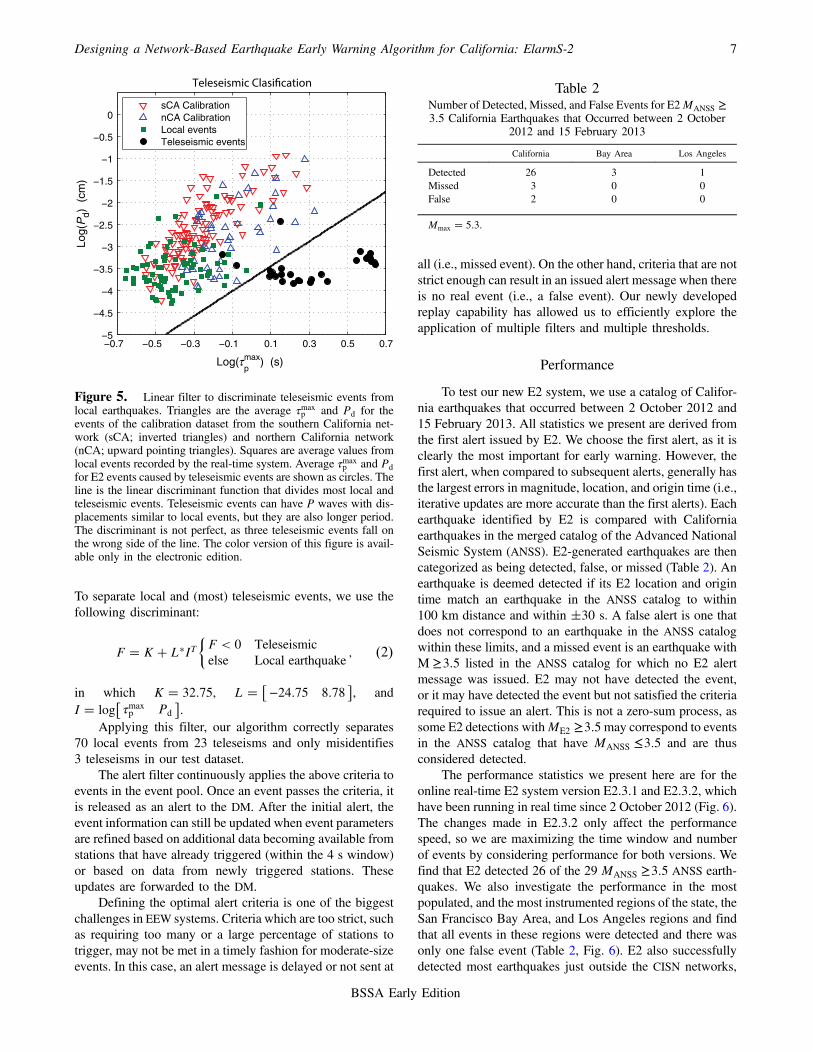
To separate local and (most) teleseismic events, we use thefollowing discriminant:
F � K � L�IT�F < 0 Teleseismicelse Local earthquake
; �2�
in which K � 32:75, L � −24:75 8:78� �
, andI � log τmax
p Pd� �
.Applying this filter, our algorithm correctly separates
70 local events from 23 teleseisms and only misidentifies3 teleseisms in our test dataset.
The alert filter continuously applies the above criteria toevents in the event pool. Once an event passes the criteria, itis released as an alert to the DM. After the initial alert, theevent information can still be updated when event parametersare refined based on additional data becoming available fromstations that have already triggered (within the 4 s window)or based on data from newly triggered stations. Theseupdates are forwarded to the DM.
Defining the optimal alert criteria is one of the biggestchallenges in EEW systems. Criteria which are too strict, suchas requiring too many or a large percentage of stations totrigger, may not be met in a timely fashion for moderate-sizeevents. In this case, an alert message is delayed or not sent at
all (i.e., missed event). On the other hand, criteria that are notstrict enough can result in an issued alert message when thereis no real event (i.e., a false event). Our newly developedreplay capability has allowed us to efficiently explore theapplication of multiple filters and multiple thresholds.
Performance
To test our new E2 system, we use a catalog of Califor-nia earthquakes that occurred between 2 October 2012 and15 February 2013. All statistics we present are derived fromthe first alert issued by E2. We choose the first alert, as it isclearly the most important for early warning. However, thefirst alert, when compared to subsequent alerts, generally hasthe largest errors in magnitude, location, and origin time (i.e.,iterative updates are more accurate than the first alerts). Eachearthquake identified by E2 is compared with Californiaearthquakes in the merged catalog of the Advanced NationalSeismic System (ANSS). E2-generated earthquakes are thencategorized as being detected, false, or missed (Table 2). Anearthquake is deemed detected if its E2 location and origintime match an earthquake in the ANSS catalog to within100 km distance and within �30 s. A false alert is one thatdoes not correspond to an earthquake in the ANSS catalogwithin these limits, and a missed event is an earthquake withM ≥3:5 listed in the ANSS catalog for which no E2 alertmessage was issued. E2 may not have detected the event,or it may have detected the event but not satisfied the criteriarequired to issue an alert. This is not a zero-sum process, assome E2 detections withME2 ≥3:5may correspond to eventsin the ANSS catalog that have MANSS ≤3:5 and are thusconsidered detected.
The performance statistics we present here are for theonline real-time E2 system version E2.3.1 and E2.3.2, whichhave been running in real time since 2 October 2012 (Fig. 6).The changes made in E2.3.2 only affect the performancespeed, so we are maximizing the time window and numberof events by considering performance for both versions. Wefind that E2 detected 26 of the 29 MANSS ≥3:5 ANSS earth-quakes. We also investigate the performance in the mostpopulated, and the most instrumented regions of the state, theSan Francisco Bay Area, and Los Angeles regions and findthat all events in these regions were detected and there wasonly one false event (Table 2, Fig. 6). E2 also successfullydetected most earthquakes just outside the CISN networks,
−0.7 −0.5 −0.3 −0.1 0.1 0.3 0.5 0.7−5
−4.5
−4
−3.5
−3
−2.5
−2
−1.5
−1
−0.5
0
Log(τmaxp
) (s)
Log(
Pd)
(cm
)
sCA CalibrationnCA CalibrationLocal eventsTeleseismic events
Figure 5. Linear filter to discriminate teleseismic events fromlocal earthquakes. Triangles are the average τmax
p and Pd for theevents of the calibration dataset from the southern California net-work (sCA; inverted triangles) and northern California network(nCA; upward pointing triangles). Squares are average values fromlocal events recorded by the real-time system. Average τmax
p and Pdfor E2 events caused by teleseismic events are shown as circles. Theline is the linear discriminant function that divides most local andteleseismic events. Teleseismic events can have P waves with dis-placements similar to local events, but they are also longer period.The discriminant is not perfect, as three teleseismic events fall onthe wrong side of the line. The color version of this figure is avail-able only in the electronic edition.
Table 2Number of Detected, Missed, and False Events for E2MANSS ≥3:5 California Earthquakes that Occurred between 2 October
2012 and 15 February 2013
California Bay Area Los Angeles
Detected 26 3 1Missed 3 0 0False 2 0 0
Mmax � 5:3.
Designing a Network-Based Earthquake Early Warning Algorithm for California: ElarmS-2 7
BSSA Early Edition
including offshore of Cape Mendocino in northern Californiaand south of the California–Mexico border. However, theseestimates for earthquakes that are at the edge or outside ofour network have larger errors than typical detections withinthe network footprint.
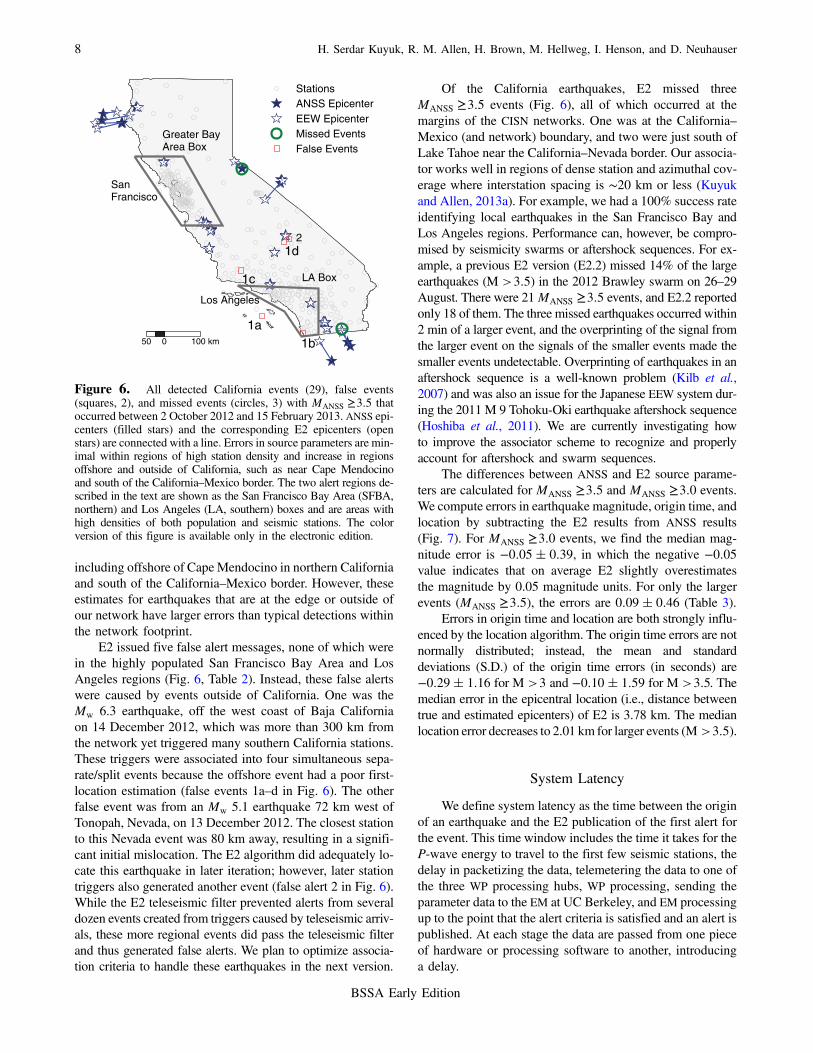
E2 issued five false alert messages, none of which werein the highly populated San Francisco Bay Area and LosAngeles regions (Fig. 6, Table 2). Instead, these false alertswere caused by events outside of California. One was theMw 6.3 earthquake, off the west coast of Baja Californiaon 14 December 2012, which was more than 300 km fromthe network yet triggered many southern California stations.These triggers were associated into four simultaneous sepa-rate/split events because the offshore event had a poor first-location estimation (false events 1a–d in Fig. 6). The otherfalse event was from an Mw 5.1 earthquake 72 km west ofTonopah, Nevada, on 13 December 2012. The closest stationto this Nevada event was 80 km away, resulting in a signifi-cant initial mislocation. The E2 algorithm did adequately lo-cate this earthquake in later iteration; however, later stationtriggers also generated another event (false alert 2 in Fig. 6).While the E2 teleseismic filter prevented alerts from severaldozen events created from triggers caused by teleseismic arriv-als, these more regional events did pass the teleseismic filterand thus generated false alerts. We plan to optimize associa-tion criteria to handle these earthquakes in the next version.
Of the California earthquakes, E2 missed threeMANSS ≥3:5 events (Fig. 6), all of which occurred at themargins of the CISN networks. One was at the California–Mexico (and network) boundary, and two were just south ofLake Tahoe near the California–Nevada border. Our associa-tor works well in regions of dense station and azimuthal cov-erage where interstation spacing is ∼20 km or less (Kuyukand Allen, 2013a). For example, we had a 100% success rateidentifying local earthquakes in the San Francisco Bay andLos Angeles regions. Performance can, however, be compro-mised by seismicity swarms or aftershock sequences. For ex-ample, a previous E2 version (E2.2) missed 14% of the largeearthquakes (M >3:5) in the 2012 Brawley swarm on 26–29August. There were 21MANSS ≥3:5 events, and E2.2 reportedonly 18 of them. The three missed earthquakes occurred within2 min of a larger event, and the overprinting of the signal fromthe larger event on the signals of the smaller events made thesmaller events undetectable. Overprinting of earthquakes in anaftershock sequence is a well-known problem (Kilb et al.,2007) and was also an issue for the Japanese EEW system dur-ing the 2011 M 9 Tohoku-Oki earthquake aftershock sequence(Hoshiba et al., 2011). We are currently investigating howto improve the associator scheme to recognize and properlyaccount for aftershock and swarm sequences.
The differences between ANSS and E2 source parame-ters are calculated for MANSS ≥3:5 and MANSS ≥3:0 events.We compute errors in earthquake magnitude, origin time, andlocation by subtracting the E2 results from ANSS results(Fig. 7). For MANSS ≥3:0 events, we find the median mag-nitude error is −0:05� 0:39, in which the negative −0:05value indicates that on average E2 slightly overestimatesthe magnitude by 0.05 magnitude units. For only the largerevents (MANSS ≥3:5), the errors are 0:09� 0:46 (Table 3).
Errors in origin time and location are both strongly influ-enced by the location algorithm. The origin time errors are notnormally distributed; instead, the mean and standarddeviations (S.D.) of the origin time errors (in seconds) are−0:29� 1:16 for M >3 and −0:10� 1:59 for M >3:5. Themedian error in the epicentral location (i.e., distance betweentrue and estimated epicenters) of E2 is 3.78 km. The medianlocation error decreases to 2.01 km for larger events (M >3:5).
System Latency
We define system latency as the time between the originof an earthquake and the E2 publication of the first alert forthe event. This time window includes the time it takes for theP-wave energy to travel to the first few seismic stations, thedelay in packetizing the data, telemetering the data to one ofthe three WP processing hubs, WP processing, sending theparameter data to the EM at UC Berkeley, and EM processingup to the point that the alert criteria is satisfied and an alert ispublished. At each stage the data are passed from one pieceof hardware or processing software to another, introducinga delay.
0 100 km50
1a1b
1c
1d2
StationsANSS EpicenterEEW EpicenterMissed EventsFalse Events
Greater BayArea Box
San Francisco
Los Angeles
LA Box
Figure 6. All detected California events (29), false events(squares, 2), and missed events (circles, 3) with MANSS ≥3:5 thatoccurred between 2 October 2012 and 15 February 2013. ANSS epi-centers (filled stars) and the corresponding E2 epicenters (openstars) are connected with a line. Errors in source parameters are min-imal within regions of high station density and increase in regionsoffshore and outside of California, such as near Cape Mendocinoand south of the California–Mexico border. The two alert regions de-scribed in the text are shown as the San Francisco Bay Area (SFBA,northern) and Los Angeles (LA, southern) boxes and are areas withhigh densities of both population and seismic stations. The colorversion of this figure is available only in the electronic edition.
8 H. Serdar Kuyuk, R. M. Allen, H. Brown, M. Hellweg, I. Henson, and D. Neuhauser
BSSA Early Edition

We evaluate four measures of latency: (1) Telemetrylatency is the delay in sending waveform data packets froma seismic station to the network WP processing hub. (2) TheWP processing delay is the delay in processing the wave-forms by the WP module to generate parameters. (3) TheP-wave latency is the time between the P-wave arrival at aseismic site and the time when that trigger is detected andprocessed by one of the WP modules. (4) The alert latencyencompasses all components of latency from the origin timeof an earthquake to the first published alert from E2.
Telemetry latency is the transit time of data from thestation to its network processing hub (e.g., UC Berkeleyfor BK; USGS Menlo Park for the Northern CaliforniaSeismic Network [NC] and some for National Strong MotionProgram [NP]; Caltech for CI, the Anza Network [AZ], andsome NP stations), where the WP module is applied to the
data. This is independent of data packet size, because it iscalculated as the time difference between a data packet’sarrival at a WP hub and the time of the last sample in thepacket. To evaluate telemetry delay, we collected all packetsfrom all channels/stations and networks from an ∼1:5 monthtime window (20 December 2012 to 4 February 2013).
−1 −0.5 0 0.5 10
5
10
15N
umbe
r of
Eve
nts
−4 −3 −2 −1 0 1 2 3 40
10
20
Num
ber
of E
vent
s
0 5 10 15 20 25 300
10
20
Num
ber
of E
vent
s
M>3
M>3.5
Time Error
Magnitude Error
Distance Error
sec
km
Median = −0.05Std = 0.39
Median = −0.29Std = 1.16
Median = 3.78
Figure 7. The magnitude, time, and location errors for E2. Thelighter histograms are errors for all events with MANSS ≥3:0, anddarker histograms are for events with MANSS ≥3:5. For a compari-son of the statistics, see Table 5.
Table 3Magnitude, Origin Time, and Location Error Statistics for E2
Algorithms
MANSS >3:0 MANSS >3:5
Error Median S.D. Median S.D.
Magnitude −0.05 0.39 0.09 0.46Time −0.29 1.16 −0.10 1.59Distance 3.78 2.01
Figure 8. The telemetry latencies by seismic network: UCBerkeley Digital Seismic Network, (BK), USGS Northern CaliforniaSeismic Network (NC), USGS National Strong Motion Program(NP), USGS/Caltech Southern California Seismic Network (CI),and UC San Diego Anza Network (AZ). The telemetry latencyis the time it takes for a completed packet to be transmitted froma station to its network processing hub. (a) The y axis is normalizedso that each network is represented in the histogram by the samearea. (b) Histogram displayed with true counts, which correctly rep-resents the average telemetry delay seen by E2. On average, thetelemetry latency is 0.44 s (see Table 4).
Table 4Median Telemetry Latencies for the Networks Used by E2
Median (s) S.D. (s)
All* 0.46 1.84BK† 0.44 1.38NP‡ 1.06 1.80NC§ 1.36 2.50CI‖ 0.31 0.96AZ# 4.57 3.41
Although distribution of latencies is not normal distributed, we list thestandard deviations to provide some measure of the variability.*The top row, labeled ‘All,’ is a summary of all combined networks.†UC Berkeley Digital Seismic Network (BK).‡USGS National Strong Motion Program (NP).§USGS Northern California Seismic Network (NC).‖USGS/Caltech Southern California Seismic Network (CI).#UC San Diego Anza Network (AZ).
Designing a Network-Based Earthquake Early Warning Algorithm for California: ElarmS-2 9
BSSA Early Edition
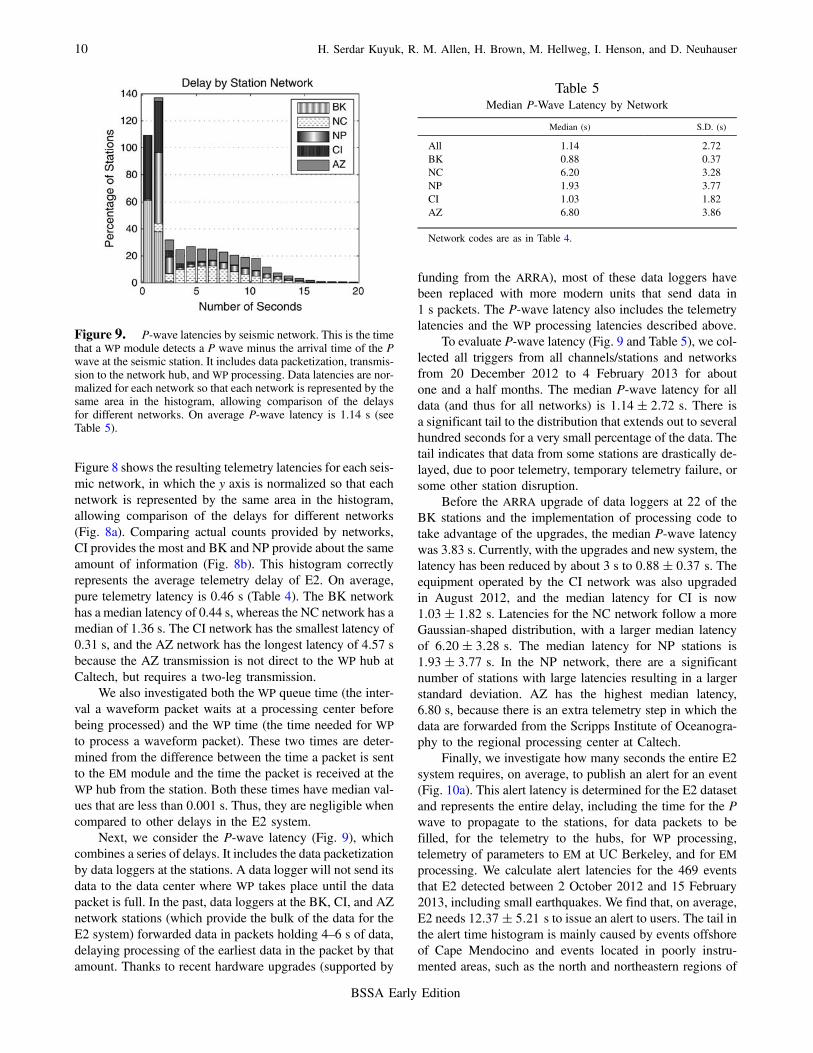
Figure 8 shows the resulting telemetry latencies for each seis-mic network, in which the y axis is normalized so that eachnetwork is represented by the same area in the histogram,allowing comparison of the delays for different networks(Fig. 8a). Comparing actual counts provided by networks,CI provides the most and BK and NP provide about the sameamount of information (Fig. 8b). This histogram correctlyrepresents the average telemetry delay of E2. On average,pure telemetry latency is 0.46 s (Table 4). The BK networkhas a median latency of 0.44 s, whereas the NC network has amedian of 1.36 s. The CI network has the smallest latency of0.31 s, and the AZ network has the longest latency of 4.57 sbecause the AZ transmission is not direct to the WP hub atCaltech, but requires a two-leg transmission.
We also investigated both the WP queue time (the inter-val a waveform packet waits at a processing center beforebeing processed) and the WP time (the time needed for WPto process a waveform packet). These two times are deter-mined from the difference between the time a packet is sentto the EM module and the time the packet is received at theWP hub from the station. Both these times have median val-ues that are less than 0.001 s. Thus, they are negligible whencompared to other delays in the E2 system.
Next, we consider the P-wave latency (Fig. 9), whichcombines a series of delays. It includes the data packetizationby data loggers at the stations. A data logger will not send itsdata to the data center where WP takes place until the datapacket is full. In the past, data loggers at the BK, CI, and AZnetwork stations (which provide the bulk of the data for theE2 system) forwarded data in packets holding 4–6 s of data,delaying processing of the earliest data in the packet by thatamount. Thanks to recent hardware upgrades (supported by
funding from the ARRA), most of these data loggers havebeen replaced with more modern units that send data in1 s packets. The P-wave latency also includes the telemetrylatencies and the WP processing latencies described above.
To evaluate P-wave latency (Fig. 9 and Table 5), we col-lected all triggers from all channels/stations and networksfrom 20 December 2012 to 4 February 2013 for aboutone and a half months. The median P-wave latency for alldata (and thus for all networks) is 1:14� 2:72 s. There isa significant tail to the distribution that extends out to severalhundred seconds for a very small percentage of the data. Thetail indicates that data from some stations are drastically de-layed, due to poor telemetry, temporary telemetry failure, orsome other station disruption.
Before the ARRA upgrade of data loggers at 22 of theBK stations and the implementation of processing code totake advantage of the upgrades, the median P-wave latencywas 3.83 s. Currently, with the upgrades and new system, thelatency has been reduced by about 3 s to 0:88� 0:37 s. Theequipment operated by the CI network was also upgradedin August 2012, and the median latency for CI is now1:03� 1:82 s. Latencies for the NC network follow a moreGaussian-shaped distribution, with a larger median latencyof 6:20� 3:28 s. The median latency for NP stations is1:93� 3:77 s. In the NP network, there are a significantnumber of stations with large latencies resulting in a largerstandard deviation. AZ has the highest median latency,6.80 s, because there is an extra telemetry step in which thedata are forwarded from the Scripps Institute of Oceanogra-phy to the regional processing center at Caltech.
Finally, we investigate how many seconds the entire E2system requires, on average, to publish an alert for an event(Fig. 10a). This alert latency is determined for the E2 datasetand represents the entire delay, including the time for the Pwave to propagate to the stations, for data packets to befilled, for the telemetry to the hubs, for WP processing,telemetry of parameters to EM at UC Berkeley, and for EMprocessing. We calculate alert latencies for the 469 eventsthat E2 detected between 2 October 2012 and 15 February2013, including small earthquakes. We find that, on average,E2 needs 12:37� 5:21 s to issue an alert to users. The tail inthe alert time histogram is mainly caused by events offshoreof Cape Mendocino and events located in poorly instru-mented areas, such as the north and northeastern regions of
Figure 9. P-wave latencies by seismic network. This is the timethat a WP module detects a P wave minus the arrival time of the Pwave at the seismic station. It includes data packetization, transmis-sion to the network hub, and WP processing. Data latencies are nor-malized for each network so that each network is represented by thesame area in the histogram, allowing comparison of the delaysfor different networks. On average P-wave latency is 1.14 s (seeTable 5).
Table 5Median P-Wave Latency by Network
Median (s) S.D. (s)
All 1.14 2.72BK 0.88 0.37NC 6.20 3.28NP 1.93 3.77CI 1.03 1.82AZ 6.80 3.86
Network codes are as in Table 4.
10 H. Serdar Kuyuk, R. M. Allen, H. Brown, M. Hellweg, I. Henson, and D. Neuhauser
BSSA Early Edition
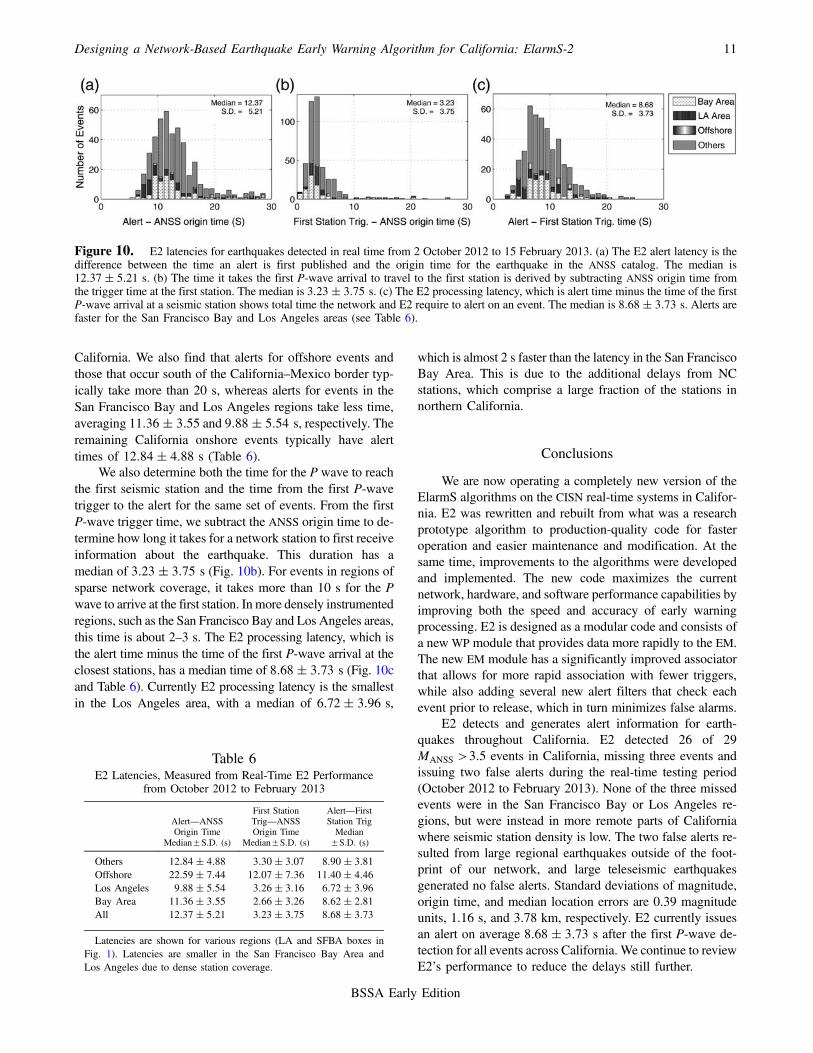
California. We also find that alerts for offshore events andthose that occur south of the California–Mexico border typ-ically take more than 20 s, whereas alerts for events in theSan Francisco Bay and Los Angeles regions take less time,averaging 11:36� 3:55 and 9:88� 5:54 s, respectively. Theremaining California onshore events typically have alerttimes of 12:84� 4:88 s (Table 6).
We also determine both the time for the P wave to reachthe first seismic station and the time from the first P-wavetrigger to the alert for the same set of events. From the firstP-wave trigger time, we subtract the ANSS origin time to de-termine how long it takes for a network station to first receiveinformation about the earthquake. This duration has amedian of 3:23� 3:75 s (Fig. 10b). For events in regions ofsparse network coverage, it takes more than 10 s for the Pwave to arrive at the first station. In more densely instrumentedregions, such as the San Francisco Bay and Los Angeles areas,this time is about 2–3 s. The E2 processing latency, which isthe alert time minus the time of the first P-wave arrival at theclosest stations, has a median time of 8:68� 3:73 s (Fig. 10cand Table 6). Currently E2 processing latency is the smallestin the Los Angeles area, with a median of 6:72� 3:96 s,
which is almost 2 s faster than the latency in the San FranciscoBay Area. This is due to the additional delays from NCstations, which comprise a large fraction of the stations innorthern California.
Conclusions
We are now operating a completely new version of theElarmS algorithms on the CISN real-time systems in Califor-nia. E2 was rewritten and rebuilt from what was a researchprototype algorithm to production-quality code for fasteroperation and easier maintenance and modification. At thesame time, improvements to the algorithms were developedand implemented. The new code maximizes the currentnetwork, hardware, and software performance capabilities byimproving both the speed and accuracy of early warningprocessing. E2 is designed as a modular code and consists ofa new WP module that provides data more rapidly to the EM.The new EM module has a significantly improved associatorthat allows for more rapid association with fewer triggers,while also adding several new alert filters that check eachevent prior to release, which in turn minimizes false alarms.
E2 detects and generates alert information for earth-quakes throughout California. E2 detected 26 of 29MANSS >3:5 events in California, missing three events andissuing two false alerts during the real-time testing period(October 2012 to February 2013). None of the three missedevents were in the San Francisco Bay or Los Angeles re-gions, but were instead in more remote parts of Californiawhere seismic station density is low. The two false alerts re-sulted from large regional earthquakes outside of the foot-print of our network, and large teleseismic earthquakesgenerated no false alerts. Standard deviations of magnitude,origin time, and median location errors are 0.39 magnitudeunits, 1.16 s, and 3.78 km, respectively. E2 currently issuesan alert on average 8:68� 3:73 s after the first P-wave de-tection for all events across California. We continue to reviewE2’s performance to reduce the delays still further.
Figure 10. E2 latencies for earthquakes detected in real time from 2 October 2012 to 15 February 2013. (a) The E2 alert latency is thedifference between the time an alert is first published and the origin time for the earthquake in the ANSS catalog. The median is12:37� 5:21 s. (b) The time it takes the first P-wave arrival to travel to the first station is derived by subtracting ANSS origin time fromthe trigger time at the first station. The median is 3:23� 3:75 s. (c) The E2 processing latency, which is alert time minus the time of the firstP-wave arrival at a seismic station shows total time the network and E2 require to alert on an event. The median is 8:68� 3:73 s. Alerts arefaster for the San Francisco Bay and Los Angeles areas (see Table 6).
Table 6E2 Latencies, Measured from Real-Time E2 Performance
from October 2012 to February 2013
Alert—ANSSOrigin Time
Median±S.D. (s)
First StationTrig—ANSSOrigin Time
Median±S.D. (s)
Alert—FirstStation TrigMedian
±S.D. (s)
Others 12:84� 4:88 3:30� 3:07 8:90� 3:81Offshore 22:59� 7:44 12:07� 7:36 11:40� 4:46Los Angeles 9:88� 5:54 3:26� 3:16 6:72� 3:96Bay Area 11:36� 3:55 2:66� 3:26 8:62� 2:81All 12:37� 5:21 3:23� 3:75 8:68� 3:73
Latencies are shown for various regions (LA and SFBA boxes inFig. 1). Latencies are smaller in the San Francisco Bay Area andLos Angeles due to dense station coverage.
Designing a Network-Based Earthquake Early Warning Algorithm for California: ElarmS-2 11
BSSA Early Edition

Data and Resources
In order to evaluate the E2 performance, we used Cal-ifornia earthquakes in the merged catalog of the ANSS(http://www.ncedc.org/anss/; last accessed March 2013) forearthquakes from 2 October 2012 to 15 February 2013. Ouranalysis uses standardized E2 output provided to the Shake-Alert project, and these are the same output data provided tothe EEW DM. The analysis programming codes were writtenin MATLAB (http://www.mathworks.com/; last accessedJune 2013).
Acknowledgments
This project was only possible because of the collaborative efforts ofmany people working at the CISN operating institutions: UC Berkeley,Caltech, USGS Menlo Park, and USGS Pasadena. This work is funded byUSGS/National Earthquake Hazards Reduction Program AwardsG09AC00259 and G12AC20348 and by the Gordon and Betty Moore Foun-dation through Grant GBMF3024 to UC Berkeley. Figure 1 was producedusing Generic Mapping Tools by Wessel and Smith (1995).
References
Allen, R. M. (2004). Rapid magnitude determination for earthquake earlywarning, in The Many Facets of Seismic Risk, G. Manfredi (Editor),University of DegliStudi di Napoli “Federico II”, Naples, Italy, 15–24.
Allen, R. M. (2006). Probabilistic warning times for earthquake groundshaking in the San Francisco Bay Area, Seismol. Res. Lett. 77,no. 3, 371–376.
Allen, R. M. (2007). The ElarmS earthquake early warning methodologyand application across California, in Earthquake Early Warning,P. Gasparini (Editor), Springer, Milan, Italy, 21–44.
Allen, R. M., and H. Kanamori (2003). The potential for earthquake earlywarning in southern California, Science 300, 786–789.
Allen, R. M., H. Brown, M. Hellweg, O. Khainovski, P. Lombard, andD. Neuhauser (2009). Real-time earthquake detection and hazardassessment by ElarmS across California, Geophys. Res. Lett. 36,L00B08, doi: 10.1029/2008GL036766.
Böse, M., R. Allen, H. Brown, G. Cua, M. Fischer, E. Hauksson, T. Heaton,M. Hellweg, M. Liukis, D. Neuhauser, P. Maechling, and CISN EEWGroup (2013). CISN ShakeAlert: An earthquake early warning dem-onstration system for California, in Early Warning for GeologicalDisasters—Scientific Methods and Current Practice, F. Wenzel andJ. Zschau (Editors), Springer, Berlin, Germany, ISBN: 978-3-642-12232-3.
Böse, M., E. Hauksson, K. Solanki, H. Kanamori, Y.-M. Wu, and T. H. Hea-ton (2009). A new trigger criterion for improved real-time performance
of on-site earthquake early warning in southern California, Bull. Seis-mol. Soc. Am. 99, no. 2A, 897–905, doi: 10.1785/0120080034.
Brown, H. M., R. M. Allen, and V. F. Grasso (2009). Testing ElarmS inJapan, Seismol. Res. Lett. 80, 727–739.
Brown, H. M., R. M. Allen, M. Hellweg, O. Khainovski, D. Neuhauser, andA. Souf (2011). Development of the ElarmS methodology for earth-quake early warning: Realtime application in California and offlinetesting in Japan, Soil Dynam. Earthq. Eng. 31, 188–200, doi: 10.1016/j.soildyn.2010.03.008.
Cua, G., M. Fischer, T. Heaton, and S. Wiemer (2009). Real-time perfor-mance of the virtual seismologist earthquake early warning algorithmin southern California, Seismol. Res. Lett. 80, no. 5, 740–747.
Hoshiba, H., K. Iwakiri, N. Hayashimoto, T. Shimoyama, K. Hirano, Y.Yamada, Y. Ishigaki, and H. Kikuta (2011). Outline of the 2011Off the Pacific Coast of Tohoku earthquake (Mw 9.0)—Earthquakeearly warning and observed seismic intensity, Earth Planet. Space63, 547–551.
Kilb, D., V. G. Martynov, and F. L. Vernon (2007). Aftershock detectionthresholds as a function of time: Results from the ANZA seismic net-work following the 31 October 2001ML 5.1 ANZA, California, earth-quake, Bull. Seismol. Soc. Am. 97, 780–792.
Kuyuk, H. S., and R. M. Allen (2013a). Optimal seismic network density forearthquake early warning: A case study from California, Seismol. Res.Lett. 84, no. 6, 946–954.
Kuyuk, H. S., and R. M. Allen (2013b). A global approach to providemagnitude estimates for warthquake early warning alerts, Geophys.Res. Lett. 40, doi: 10.1002/2013GL058580.
Olivieri, M., R. M. Allen, and G. Wurman (2008). The potential for earth-quake early earning in Italy using ElarmS, Bull. Seismol. Soc. Am. 98,495–503, doi: 10.1785/0120070054.
Olson, E. L., and R. M. Allen (2005). The deterministic nature of earthquakerupture, Nature 438, no. 7065, 212–215.
Tsang, L., R. M. Allen, and G. Wurman (2007). Magnitude scaling relationsfrom P waves in southern California, Geophys. Res. Lett. 34, L19304,doi: 10.1029/2007GL031077.
Wessel, P., and W. H. F. Smith (1995). New version of the Generic MappingTools released, Eos Trans. AGU 76, 329.
Wurman, G., R. M. Allen, and P. Lombard (2007). Toward earthquake earlywarning in northern California, J. Geophys. Res. 112, no. B08311, doi:10.1029/2006JB004830.
Seismological LaboratoryUniversity of CaliforniaMcCone Hall, UC BerkeleyBerkeley, California [email protected]
Manuscript received 5 June 2013;Published Online 24 December 2013
12 H. Serdar Kuyuk, R. M. Allen, H. Brown, M. Hellweg, I. Henson, and D. Neuhauser
BSSA Early Edition